Butte County, SD
Butte County Map
Butte County Overview
10,369
TOTAL POPULATION
5,092
MALE POPULATION
5,277
FEMALE POPULATION
96.49
MALES / 100 FEMALES
103.63
FEMALES / 100 MALES
40.3
MEDIAN AGE
3.0
AVG FAMILY SIZE
2.5
AVG HOUSEHOLD SIZE
$34,218
PER CAPITA INCOME
$80,701
AVG FAMILY INCOME
$58,106
AVG HOUSEHOLD INCOME
45.3%
WAGE / INCOME GAP [ % ]
54.7¢/ $1
WAGE / INCOME GAP [ $ ]
0.47
INEQUALITY / GINI INDEX
5,425
LABOR FORCE [ PEOPLE ]
65.8%
PERCENT IN LABOR FORCE
5.8%
UNEMPLOYMENT RATE
Butte County Area Codes
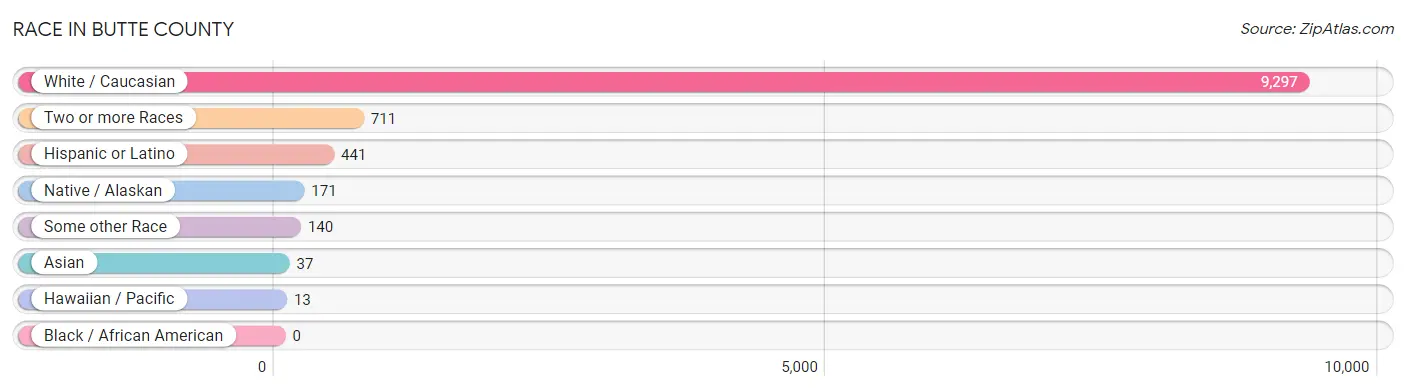
Race in Butte County
The most populous races in Butte County are White / Caucasian (9,297 | 89.7%), Two or more Races (711 | 6.9%), and Hispanic or Latino (441 | 4.3%).
| Race | # Population | % Population |
| Asian | 37 | 0.4% |
| Black / African American | 0 | 0.0% |
| Hawaiian / Pacific | 13 | 0.1% |
| Hispanic or Latino | 441 | 4.3% |
| Native / Alaskan | 171 | 1.7% |
| White / Caucasian | 9,297 | 89.7% |
| Two or more Races | 711 | 6.9% |
| Some other Race | 140 | 1.3% |
| Total | 10,369 | 100.0% |
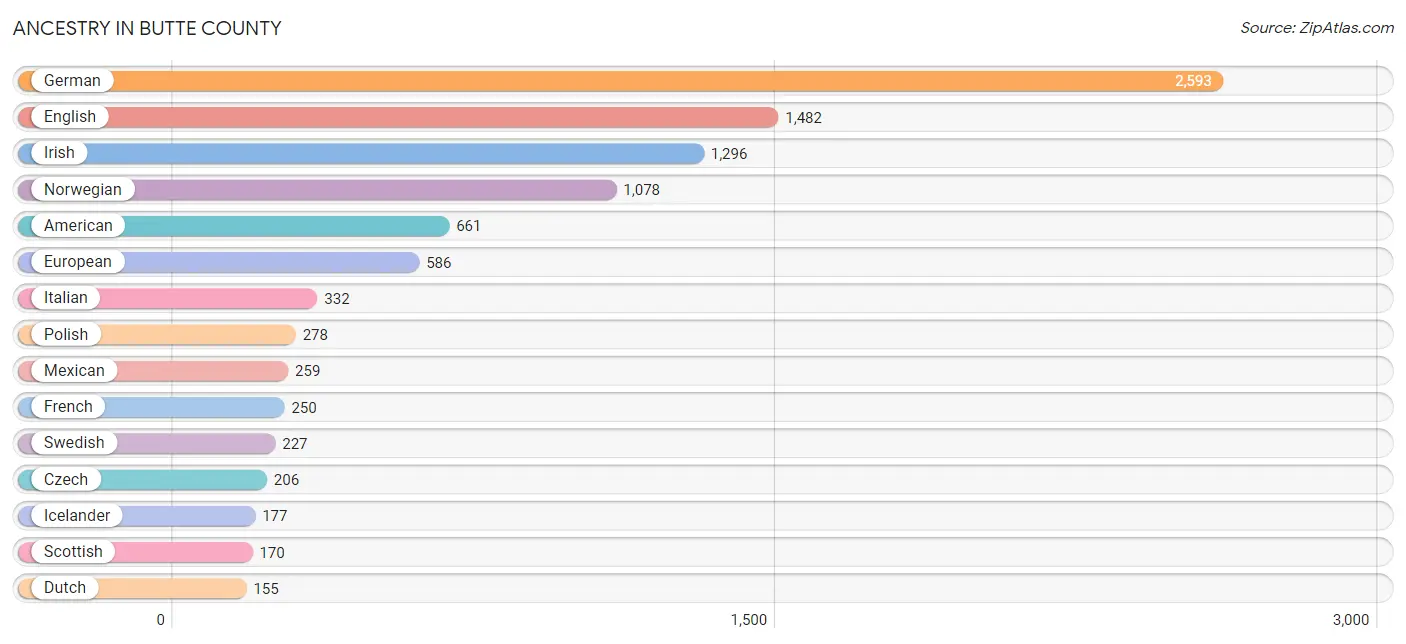
Ancestry in Butte County
The most populous ancestries reported in Butte County are German (2,593 | 25.0%), English (1,482 | 14.3%), Irish (1,296 | 12.5%), Norwegian (1,078 | 10.4%), and American (661 | 6.4%), together accounting for 68.6% of all Butte County residents.
| Ancestry | # Population | % Population |
| American | 661 | 6.4% |
| Apache | 8 | 0.1% |
| Austrian | 4 | 0.0% |
| Belgian | 32 | 0.3% |
| Blackfeet | 2 | 0.0% |
| Bulgarian | 15 | 0.1% |
| Canadian | 60 | 0.6% |
| Cherokee | 64 | 0.6% |
| Choctaw | 49 | 0.5% |
| Creek | 40 | 0.4% |
| Czech | 206 | 2.0% |
| Czechoslovakian | 8 | 0.1% |
| Danish | 145 | 1.4% |
| Dutch | 155 | 1.5% |
| Eastern European | 81 | 0.8% |
| English | 1,482 | 14.3% |
| European | 586 | 5.7% |
| Finnish | 106 | 1.0% |
| French | 250 | 2.4% |
| French Canadian | 78 | 0.7% |
| German | 2,593 | 25.0% |
| German Russian | 3 | 0.0% |
| Icelander | 177 | 1.7% |
| Irish | 1,296 | 12.5% |
| Italian | 332 | 3.2% |
| Latvian | 14 | 0.1% |
| Mexican | 259 | 2.5% |
| Native Hawaiian | 13 | 0.1% |
| Navajo | 83 | 0.8% |
| Norwegian | 1,078 | 10.4% |
| Pennsylvania German | 2 | 0.0% |
| Polish | 278 | 2.7% |
| Puerto Rican | 34 | 0.3% |
| Romanian | 20 | 0.2% |
| Russian | 114 | 1.1% |
| Scandinavian | 8 | 0.1% |
| Scotch-Irish | 141 | 1.4% |
| Scottish | 170 | 1.6% |
| Sioux | 146 | 1.4% |
| Spanish | 64 | 0.6% |
| Spanish American | 8 | 0.1% |
| Sri Lankan | 14 | 0.1% |
| Swedish | 227 | 2.2% |
| Swiss | 51 | 0.5% |
| Thai | 37 | 0.4% |
| Ukrainian | 74 | 0.7% |
| Ute | 12 | 0.1% |
| Welsh | 30 | 0.3% | View All 48 Rows |
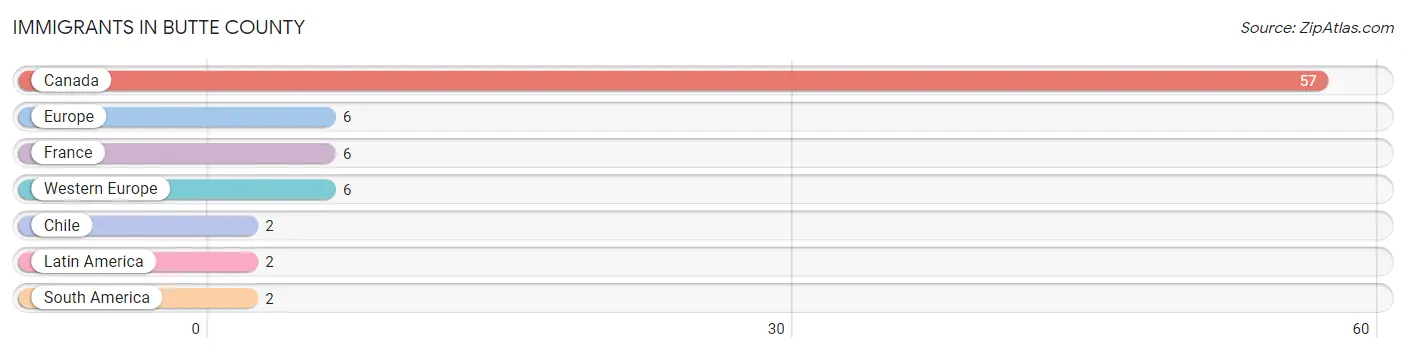
Immigrants in Butte County
The most numerous immigrant groups reported in Butte County came from Canada (57 | 0.5%), Europe (6 | 0.1%), France (6 | 0.1%), Western Europe (6 | 0.1%), and Chile (2 | 0.0%), together accounting for 0.7% of all Butte County residents.
| Immigration Origin | # Population | % Population |
| Canada | 57 | 0.5% |
| Chile | 2 | 0.0% |
| Europe | 6 | 0.1% |
| France | 6 | 0.1% |
| Latin America | 2 | 0.0% |
| South America | 2 | 0.0% |
| Western Europe | 6 | 0.1% | View All 7 Rows |
Sex and Age in Butte County
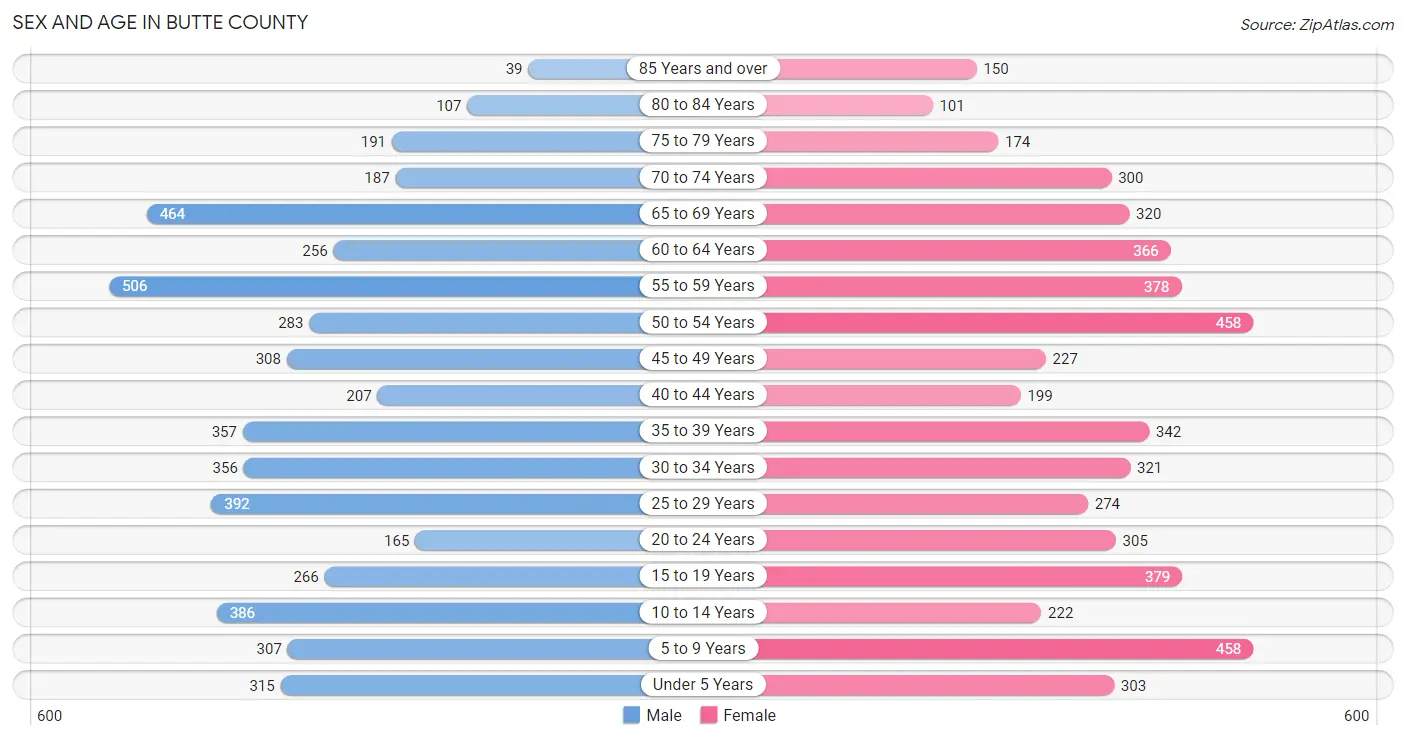
Sex and Age in Butte County
The most populous age groups in Butte County are 55 to 59 Years (506 | 9.9%) for men and 5 to 9 Years (458 | 8.7%) for women.
| Age Bracket | Male | Female |
| Under 5 Years | 315 (6.2%) | 303 (5.7%) |
| 5 to 9 Years | 307 (6.0%) | 458 (8.7%) |
| 10 to 14 Years | 386 (7.6%) | 222 (4.2%) |
| 15 to 19 Years | 266 (5.2%) | 379 (7.2%) |
| 20 to 24 Years | 165 (3.2%) | 305 (5.8%) |
| 25 to 29 Years | 392 (7.7%) | 274 (5.2%) |
| 30 to 34 Years | 356 (7.0%) | 321 (6.1%) |
| 35 to 39 Years | 357 (7.0%) | 342 (6.5%) |
| 40 to 44 Years | 207 (4.1%) | 199 (3.8%) |
| 45 to 49 Years | 308 (6.0%) | 227 (4.3%) |
| 50 to 54 Years | 283 (5.6%) | 458 (8.7%) |
| 55 to 59 Years | 506 (9.9%) | 378 (7.2%) |
| 60 to 64 Years | 256 (5.0%) | 366 (6.9%) |
| 65 to 69 Years | 464 (9.1%) | 320 (6.1%) |
| 70 to 74 Years | 187 (3.7%) | 300 (5.7%) |
| 75 to 79 Years | 191 (3.7%) | 174 (3.3%) |
| 80 to 84 Years | 107 (2.1%) | 101 (1.9%) |
| 85 Years and over | 39 (0.8%) | 150 (2.8%) |
| Total | 5,092 (100.0%) | 5,277 (100.0%) |
Families and Households in Butte County
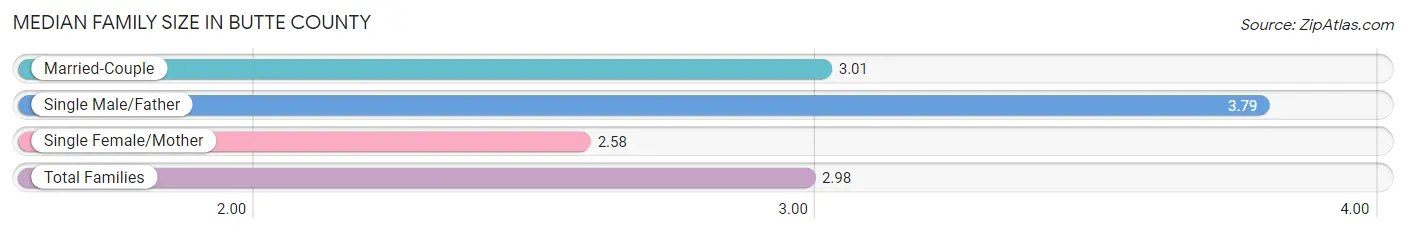
Median Family Size in Butte County
The median family size in Butte County is 2.98 persons per family, with single male/father families (123 | 4.4%) accounting for the largest median family size of 3.79 persons per family. On the other hand, single female/mother families (377 | 13.4%) represent the smallest median family size with 2.58 persons per family.
| Family Type | # Families | Family Size |
| Married-Couple | 2,317 (82.3%) | 3.01 |
| Single Male/Father | 123 (4.4%) | 3.79 |
| Single Female/Mother | 377 (13.4%) | 2.58 |
| Total Families | 2,817 (100.0%) | 2.98 |
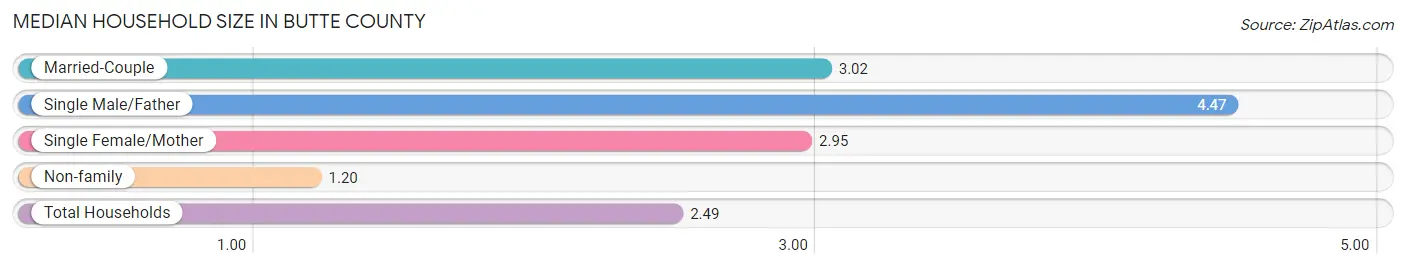
Median Household Size in Butte County
The median household size in Butte County is 2.49 persons per household, with single male/father households (123 | 3.0%) accounting for the largest median household size of 4.47 persons per household. non-family households (1,295 | 31.5%) represent the smallest median household size with 1.20 persons per household.
| Household Type | # Households | Household Size |
| Married-Couple | 2,317 (56.4%) | 3.02 |
| Single Male/Father | 123 (3.0%) | 4.47 |
| Single Female/Mother | 377 (9.2%) | 2.95 |
| Non-family | 1,295 (31.5%) | 1.20 |
| Total Households | 4,112 (100.0%) | 2.49 |
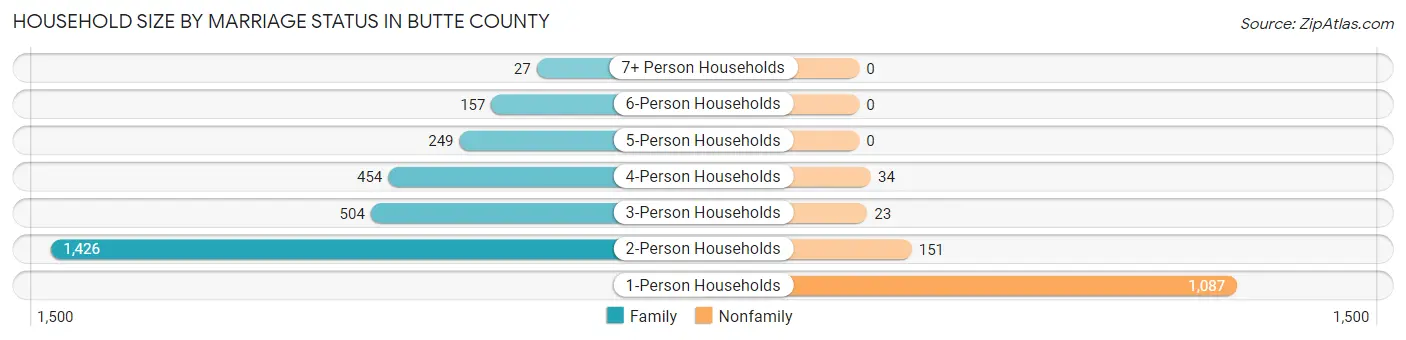
Household Size by Marriage Status in Butte County
Out of a total of 4,112 households in Butte County, 2,817 (68.5%) are family households, while 1,295 (31.5%) are nonfamily households. The most numerous type of family households are 2-person households, comprising 1,426, and the most common type of nonfamily households are 1-person households, comprising 1,087.
| Household Size | Family Households | Nonfamily Households |
| 1-Person Households | - | 1,087 (26.4%) |
| 2-Person Households | 1,426 (34.7%) | 151 (3.7%) |
| 3-Person Households | 504 (12.3%) | 23 (0.6%) |
| 4-Person Households | 454 (11.0%) | 34 (0.8%) |
| 5-Person Households | 249 (6.1%) | 0 (0.0%) |
| 6-Person Households | 157 (3.8%) | 0 (0.0%) |
| 7+ Person Households | 27 (0.7%) | 0 (0.0%) |
| Total | 2,817 (68.5%) | 1,295 (31.5%) |
Female Fertility in Butte County
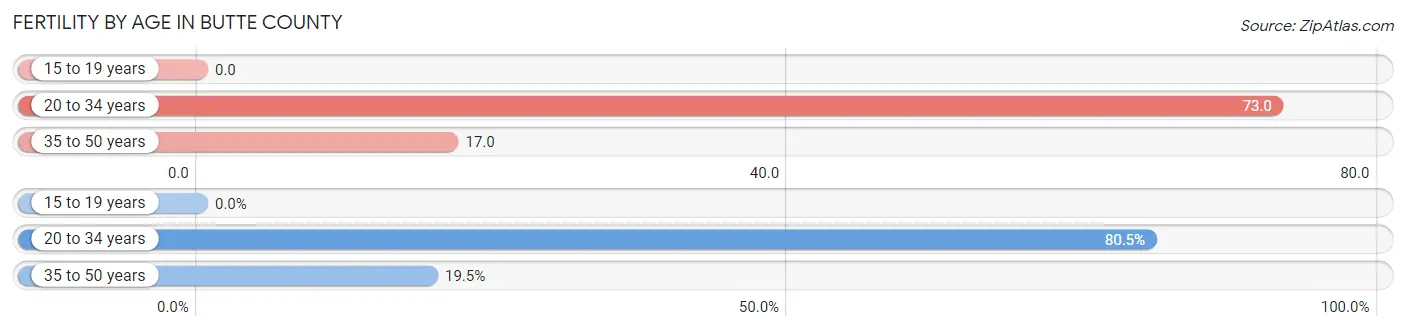
Fertility by Age in Butte County
Average fertility rate in Butte County is 37.0 births per 1,000 women. Women in the age bracket of 20 to 34 years have the highest fertility rate with 73.0 births per 1,000 women. Women in the age bracket of 20 to 34 years acount for 80.5% of all women with births.
| Age Bracket | Women with Births | Births / 1,000 Women |
| 15 to 19 years | 0 (0.0%) | 0.0 |
| 20 to 34 years | 66 (80.5%) | 73.0 |
| 35 to 50 years | 16 (19.5%) | 17.0 |
| Total | 82 (100.0%) | 37.0 |
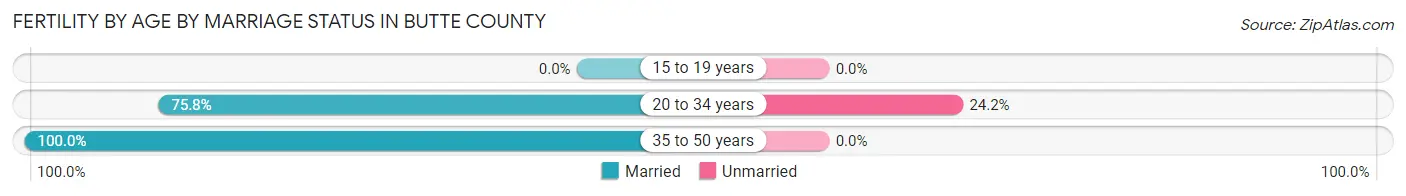
Fertility by Age by Marriage Status in Butte County
80.5% of women with births (82) in Butte County are married. The highest percentage of unmarried women with births falls into 20 to 34 years age bracket with 24.2% of them unmarried at the time of birth, while the lowest percentage of unmarried women with births belong to 35 to 50 years age bracket with 0.0% of them unmarried.
| Age Bracket | Married | Unmarried |
| 15 to 19 years | 0 (0.0%) | 0 (0.0%) |
| 20 to 34 years | 50 (75.8%) | 16 (24.2%) |
| 35 to 50 years | 16 (100.0%) | 0 (0.0%) |
| Total | 66 (80.5%) | 16 (19.5%) |
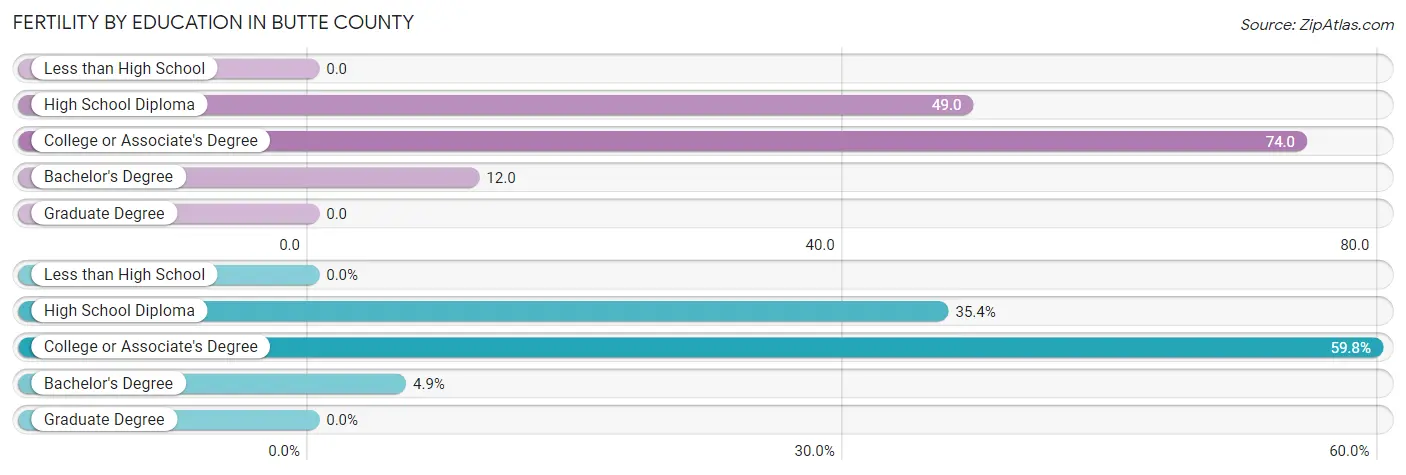
Fertility by Education in Butte County
| Educational Attainment | Women with Births | Births / 1,000 Women |
| Less than High School | 0 (0.0%) | 0.0 |
| High School Diploma | 29 (35.4%) | 49.0 |
| College or Associate's Degree | 49 (59.8%) | 74.0 |
| Bachelor's Degree | 4 (4.9%) | 12.0 |
| Graduate Degree | 0 (0.0%) | 0.0 |
| Total | 82 (100.0%) | 37.0 |
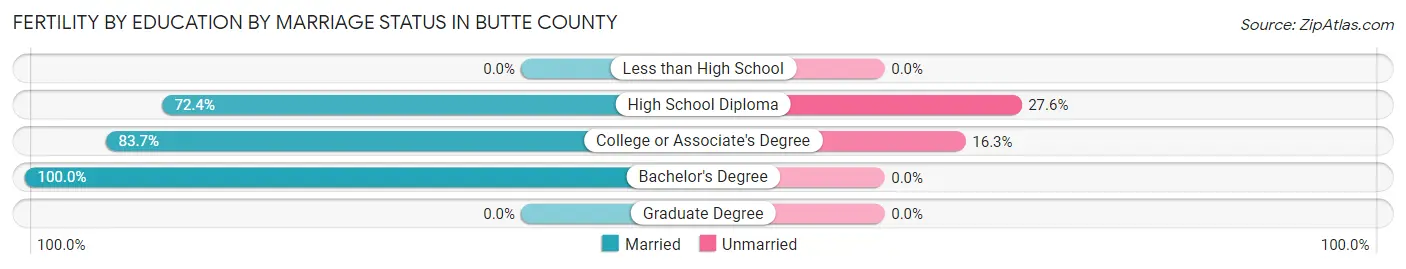
Fertility by Education by Marriage Status in Butte County
19.5% of women with births in Butte County are unmarried. Women with the educational attainment of bachelor's degree are most likely to be married with 100.0% of them married at childbirth, while women with the educational attainment of high school diploma are least likely to be married with 27.6% of them unmarried at childbirth.
| Educational Attainment | Married | Unmarried |
| Less than High School | 0 (0.0%) | 0 (0.0%) |
| High School Diploma | 21 (72.4%) | 8 (27.6%) |
| College or Associate's Degree | 41 (83.7%) | 8 (16.3%) |
| Bachelor's Degree | 4 (100.0%) | 0 (0.0%) |
| Graduate Degree | 0 (0.0%) | 0 (0.0%) |
| Total | 66 (80.5%) | 16 (19.5%) |
Income in Butte County
Income Overview in Butte County
Per Capita Income in Butte County is $34,218, while median incomes of families and households are $80,701 and $58,106 respectively.
| Characteristic | Number | Measure |
| Per Capita Income | 10,369 | $34,218 |
| Median Family Income | 2,817 | $80,701 |
| Mean Family Income | 2,817 | $104,894 |
| Median Household Income | 4,112 | $58,106 |
| Mean Household Income | 4,112 | $85,481 |
| Income Deficit | 2,817 | $0 |
| Wage / Income Gap (%) | 10,369 | 45.33% |
| Wage / Income Gap ($) | 10,369 | 54.67¢ per $1 |
| Gini / Inequality Index | 10,369 | 0.47 |
Earnings by Sex in Butte County
Average Earnings in Butte County are $34,244, $49,607 for men and $27,120 for women, a difference of 45.3%.
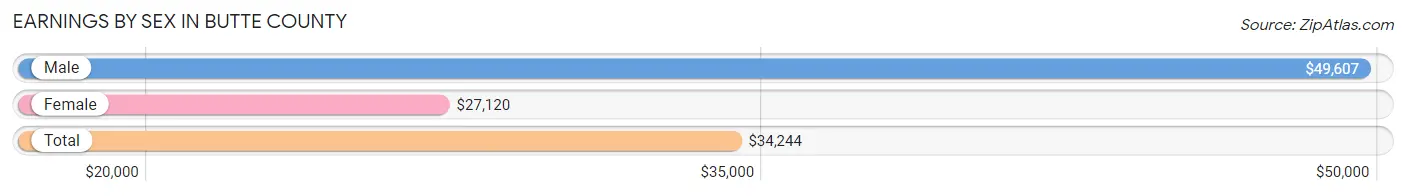
| Sex | Number | Average Earnings |
| Male | 2,849 (49.2%) | $49,607 |
| Female | 2,943 (50.8%) | $27,120 |
| Total | 5,792 (100.0%) | $34,244 |
Earnings by Sex by Income Bracket in Butte County
The most common earnings brackets in Butte County are $100,000+ for men (412 | 14.5%) and $25,000 to $29,999 for women (327 | 11.1%).
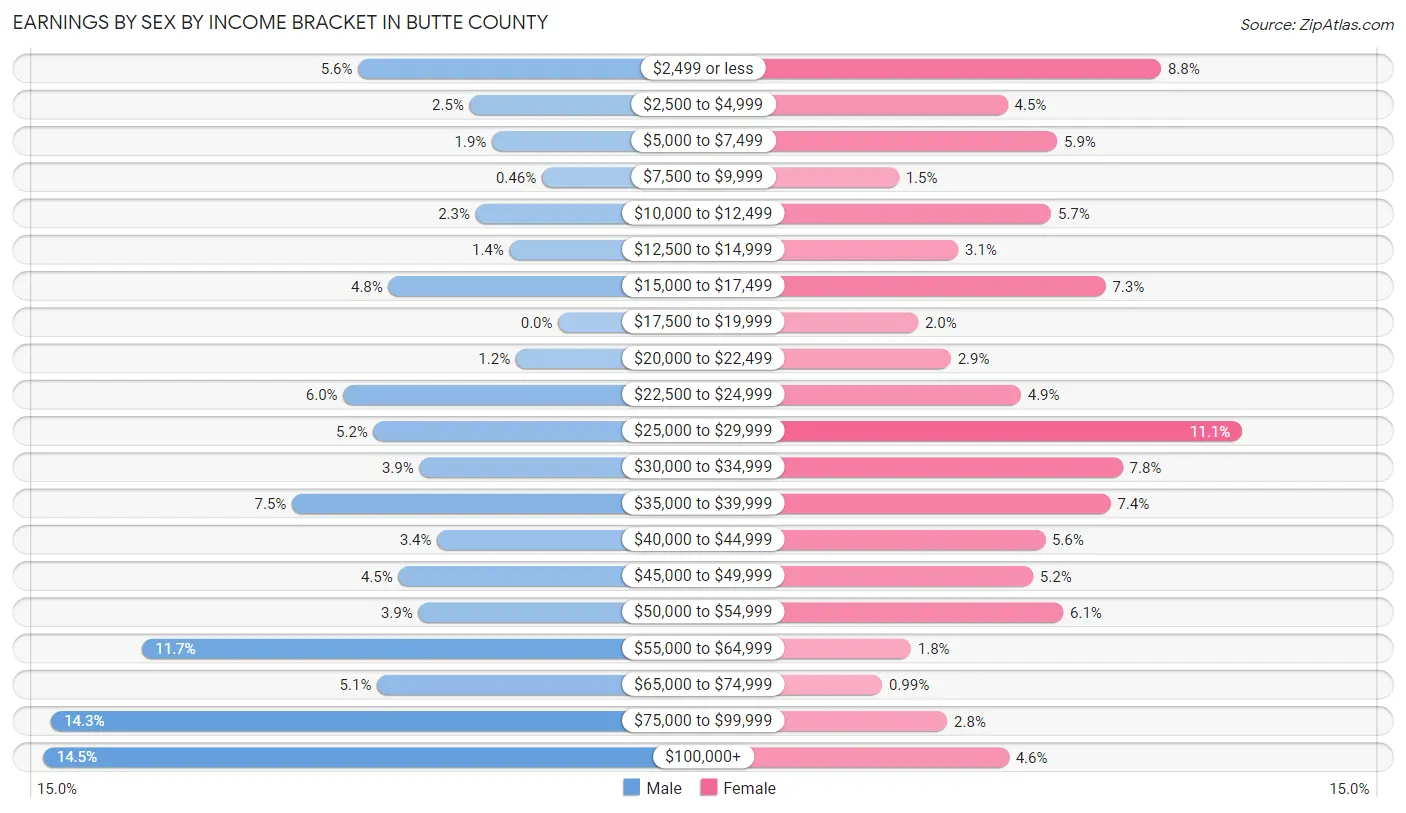
| Income | Male | Female |
| $2,499 or less | 160 (5.6%) | 260 (8.8%) |
| $2,500 to $4,999 | 71 (2.5%) | 133 (4.5%) |
| $5,000 to $7,499 | 53 (1.9%) | 174 (5.9%) |
| $7,500 to $9,999 | 13 (0.5%) | 43 (1.5%) |
| $10,000 to $12,499 | 66 (2.3%) | 169 (5.7%) |
| $12,500 to $14,999 | 39 (1.4%) | 92 (3.1%) |
| $15,000 to $17,499 | 136 (4.8%) | 214 (7.3%) |
| $17,500 to $19,999 | 0 (0.0%) | 59 (2.0%) |
| $20,000 to $22,499 | 34 (1.2%) | 86 (2.9%) |
| $22,500 to $24,999 | 172 (6.0%) | 144 (4.9%) |
| $25,000 to $29,999 | 148 (5.2%) | 327 (11.1%) |
| $30,000 to $34,999 | 111 (3.9%) | 228 (7.7%) |
| $35,000 to $39,999 | 213 (7.5%) | 218 (7.4%) |
| $40,000 to $44,999 | 97 (3.4%) | 164 (5.6%) |
| $45,000 to $49,999 | 128 (4.5%) | 154 (5.2%) |
| $50,000 to $54,999 | 112 (3.9%) | 179 (6.1%) |
| $55,000 to $64,999 | 333 (11.7%) | 53 (1.8%) |
| $65,000 to $74,999 | 145 (5.1%) | 29 (1.0%) |
| $75,000 to $99,999 | 406 (14.2%) | 83 (2.8%) |
| $100,000+ | 412 (14.5%) | 134 (4.5%) |
| Total | 2,849 (100.0%) | 2,943 (100.0%) |
Earnings by Sex by Educational Attainment in Butte County
Average earnings in Butte County are $53,188 for men and $29,793 for women, a difference of 44.0%. Men with an educational attainment of bachelor's degree enjoy the highest average annual earnings of $62,222, while those with graduate degree education earn the least with $24,112. Women with an educational attainment of graduate degree earn the most with the average annual earnings of $51,778, while those with less than high school education have the smallest earnings of $23,777.
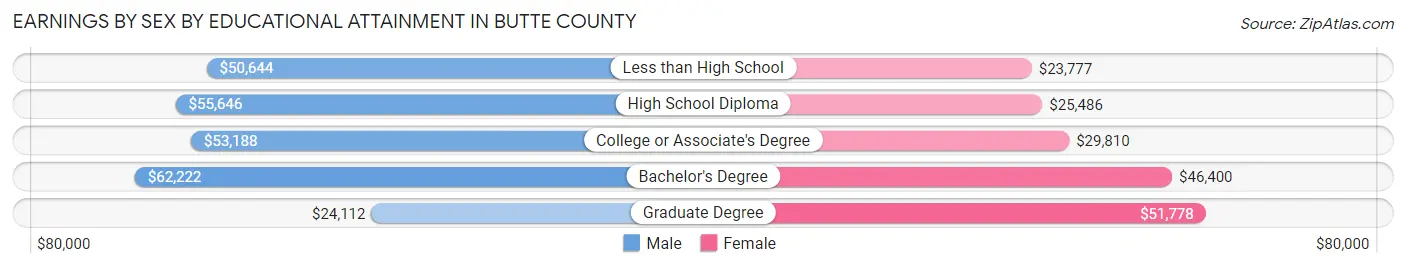
| Educational Attainment | Male Income | Female Income |
| Less than High School | $50,644 | $23,777 |
| High School Diploma | $55,646 | $25,486 |
| College or Associate's Degree | $53,188 | $29,810 |
| Bachelor's Degree | $62,222 | $46,400 |
| Graduate Degree | $24,112 | $51,778 |
| Total | $53,188 | $29,793 |
Family Income in Butte County
Family Income Brackets in Butte County
According to the Butte County family income data, there are 603 families falling into the $50,000 to $74,999 income range, which is the most common income bracket and makes up 21.4% of all families. Conversely, the less than $10,000 income bracket is the least frequent group with only 51 families (1.8%) belonging to this category.
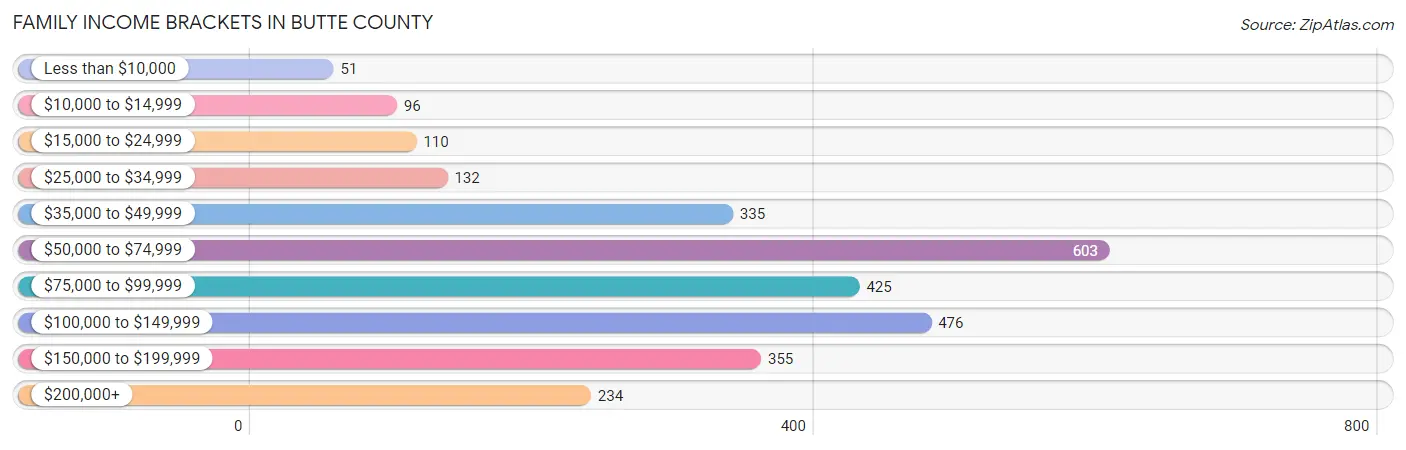
| Income Bracket | # Families | % Families |
| Less than $10,000 | 51 | 1.8% |
| $10,000 to $14,999 | 96 | 3.4% |
| $15,000 to $24,999 | 110 | 3.9% |
| $25,000 to $34,999 | 132 | 4.7% |
| $35,000 to $49,999 | 335 | 11.9% |
| $50,000 to $74,999 | 603 | 21.4% |
| $75,000 to $99,999 | 425 | 15.1% |
| $100,000 to $149,999 | 476 | 16.9% |
| $150,000 to $199,999 | 355 | 12.6% |
| $200,000+ | 234 | 8.3% |
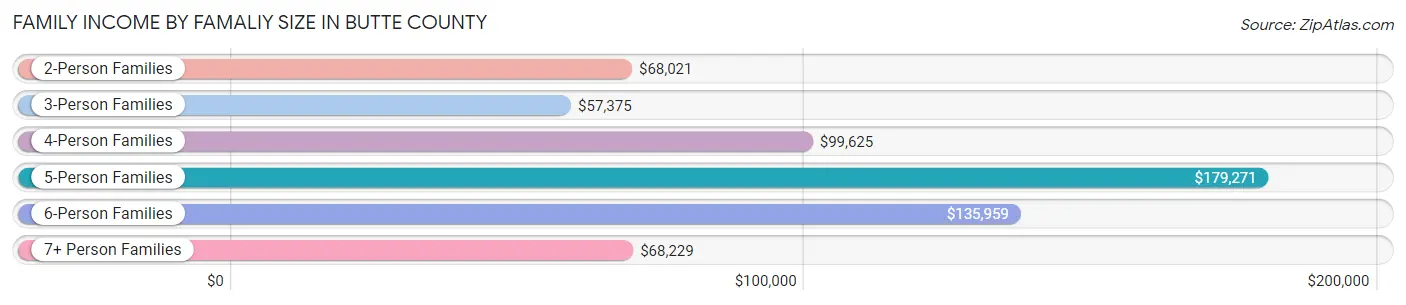
Family Income by Famaliy Size in Butte County
5-person families (222 | 7.9%) account for the highest median family income in Butte County with $179,271 per family, while 5-person families (222 | 7.9%) have the highest median income of $35,854 per family member.
| Income Bracket | # Families | Median Income |
| 2-Person Families | 1,537 (54.6%) | $68,021 |
| 3-Person Families | 453 (16.1%) | $57,375 |
| 4-Person Families | 473 (16.8%) | $99,625 |
| 5-Person Families | 222 (7.9%) | $179,271 |
| 6-Person Families | 105 (3.7%) | $135,959 |
| 7+ Person Families | 27 (1.0%) | $68,229 |
| Total | 2,817 (100.0%) | $80,701 |
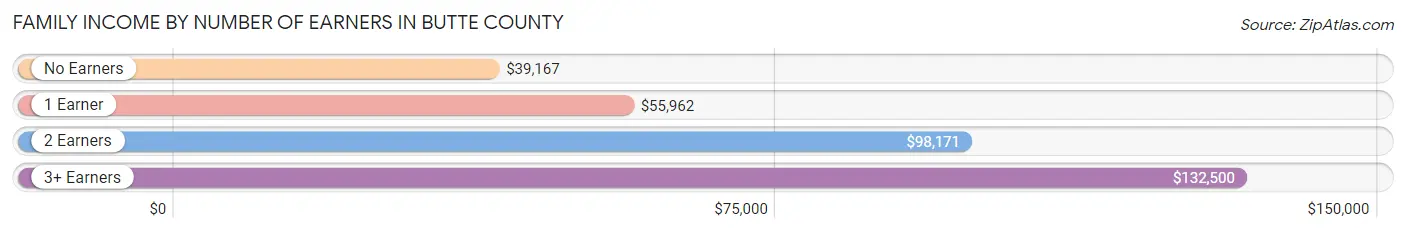
Family Income by Number of Earners in Butte County
The median family income in Butte County is $80,701, with families comprising 3+ earners (294) having the highest median family income of $132,500, while families with no earners (448) have the lowest median family income of $39,167, accounting for 10.4% and 15.9% of families, respectively.
| Number of Earners | # Families | Median Income |
| No Earners | 448 (15.9%) | $39,167 |
| 1 Earner | 676 (24.0%) | $55,962 |
| 2 Earners | 1,399 (49.7%) | $98,171 |
| 3+ Earners | 294 (10.4%) | $132,500 |
| Total | 2,817 (100.0%) | $80,701 |
Household Income in Butte County
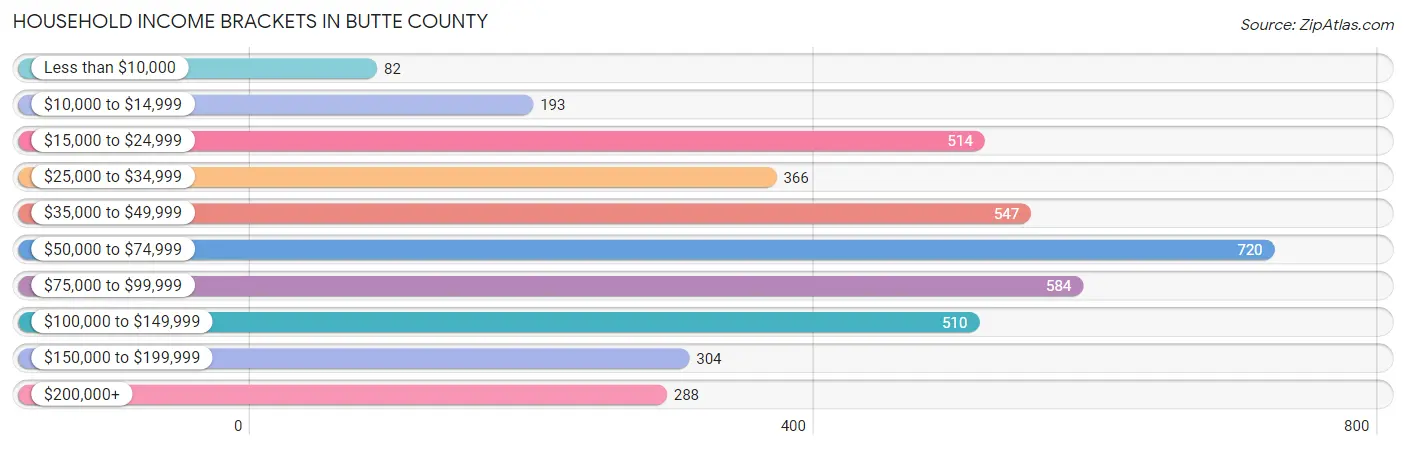
Household Income Brackets in Butte County
With 720 households falling in the category, the $50,000 to $74,999 income range is the most frequent in Butte County, accounting for 17.5% of all households. In contrast, only 82 households (2.0%) fall into the less than $10,000 income bracket, making it the least populous group.
| Income Bracket | # Households | % Households |
| Less than $10,000 | 82 | 2.0% |
| $10,000 to $14,999 | 193 | 4.7% |
| $15,000 to $24,999 | 514 | 12.5% |
| $25,000 to $34,999 | 366 | 8.9% |
| $35,000 to $49,999 | 547 | 13.3% |
| $50,000 to $74,999 | 720 | 17.5% |
| $75,000 to $99,999 | 584 | 14.2% |
| $100,000 to $149,999 | 510 | 12.4% |
| $150,000 to $199,999 | 304 | 7.4% |
| $200,000+ | 288 | 7.0% |
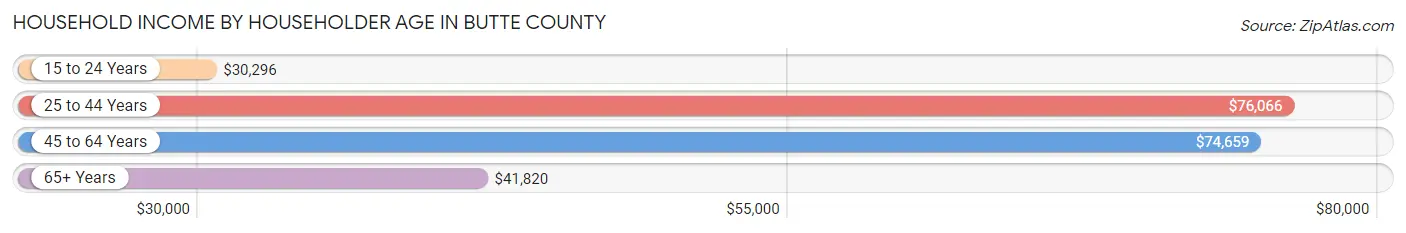
Household Income by Householder Age in Butte County
The median household income in Butte County is $58,106, with the highest median household income of $76,066 found in the 25 to 44 years age bracket for the primary householder. A total of 1,207 households (29.3%) fall into this category. Meanwhile, the 15 to 24 years age bracket for the primary householder has the lowest median household income of $30,296, with 137 households (3.3%) in this group.
| Income Bracket | # Households | Median Income |
| 15 to 24 Years | 137 (3.3%) | $30,296 |
| 25 to 44 Years | 1,207 (29.3%) | $76,066 |
| 45 to 64 Years | 1,483 (36.1%) | $74,659 |
| 65+ Years | 1,285 (31.2%) | $41,820 |
| Total | 4,112 (100.0%) | $58,106 |
Poverty in Butte County
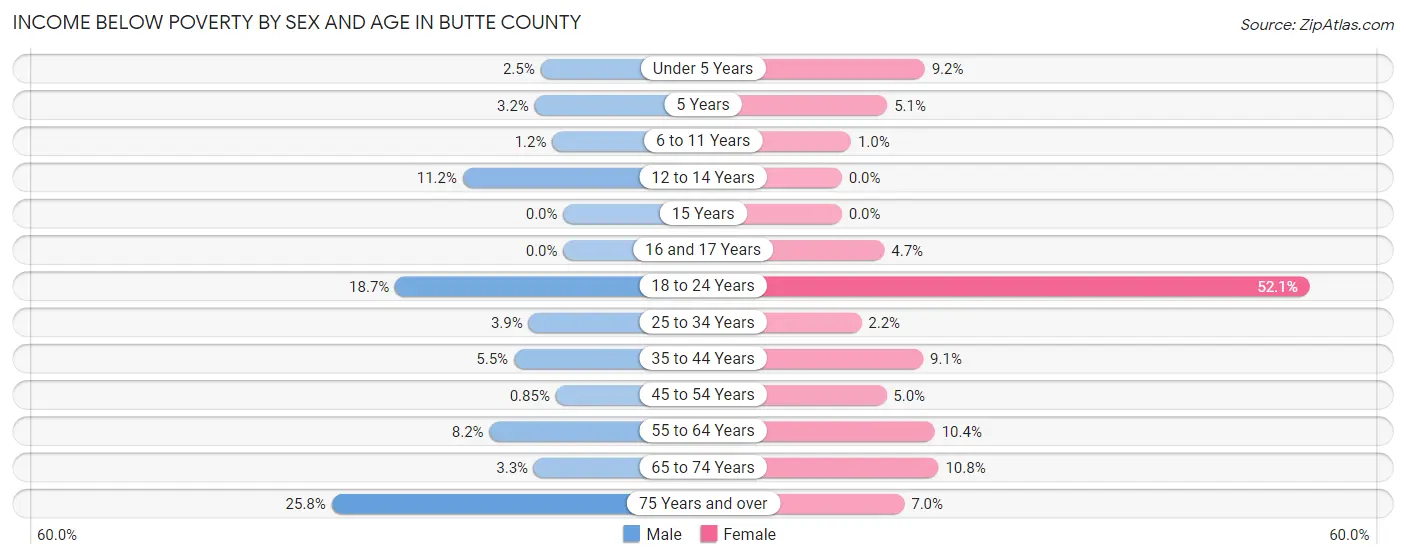
Income Below Poverty by Sex and Age in Butte County
With 6.5% poverty level for males and 9.9% for females among the residents of Butte County, 75 year old and over males and 18 to 24 year old females are the most vulnerable to poverty, with 80 males (25.8%) and 199 females (52.1%) in their respective age groups living below the poverty level.
| Age Bracket | Male | Female |
| Under 5 Years | 8 (2.5%) | 28 (9.2%) |
| 5 Years | 3 (3.2%) | 4 (5.1%) |
| 6 to 11 Years | 4 (1.2%) | 5 (1.0%) |
| 12 to 14 Years | 28 (11.2%) | 0 (0.0%) |
| 15 Years | 0 (0.0%) | 0 (0.0%) |
| 16 and 17 Years | 0 (0.0%) | 13 (4.7%) |
| 18 to 24 Years | 56 (18.7%) | 199 (52.1%) |
| 25 to 34 Years | 29 (3.9%) | 13 (2.2%) |
| 35 to 44 Years | 31 (5.5%) | 49 (9.1%) |
| 45 to 54 Years | 5 (0.9%) | 34 (5.0%) |
| 55 to 64 Years | 61 (8.2%) | 77 (10.3%) |
| 65 to 74 Years | 21 (3.3%) | 66 (10.8%) |
| 75 Years and over | 80 (25.8%) | 27 (7.0%) |
| Total | 326 (6.5%) | 515 (9.9%) |
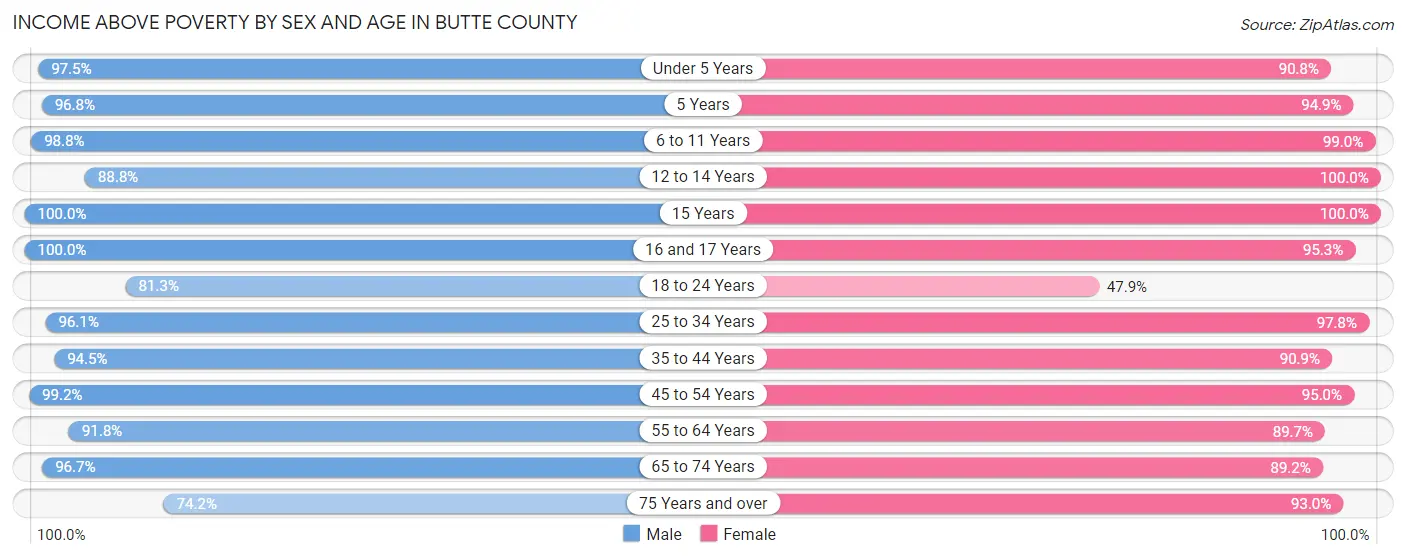
Income Above Poverty by Sex and Age in Butte County
According to the poverty statistics in Butte County, males aged 15 years and females aged 12 to 14 years are the age groups that are most secure financially, with 100.0% of males and 100.0% of females in these age groups living above the poverty line.
| Age Bracket | Male | Female |
| Under 5 Years | 307 (97.5%) | 275 (90.8%) |
| 5 Years | 91 (96.8%) | 75 (94.9%) |
| 6 to 11 Years | 320 (98.8%) | 483 (99.0%) |
| 12 to 14 Years | 222 (88.8%) | 87 (100.0%) |
| 15 Years | 106 (100.0%) | 27 (100.0%) |
| 16 and 17 Years | 24 (100.0%) | 261 (95.3%) |
| 18 to 24 Years | 243 (81.3%) | 183 (47.9%) |
| 25 to 34 Years | 719 (96.1%) | 582 (97.8%) |
| 35 to 44 Years | 533 (94.5%) | 492 (90.9%) |
| 45 to 54 Years | 586 (99.2%) | 651 (95.0%) |
| 55 to 64 Years | 680 (91.8%) | 667 (89.6%) |
| 65 to 74 Years | 620 (96.7%) | 547 (89.2%) |
| 75 Years and over | 230 (74.2%) | 361 (93.0%) |
| Total | 4,681 (93.5%) | 4,691 (90.1%) |
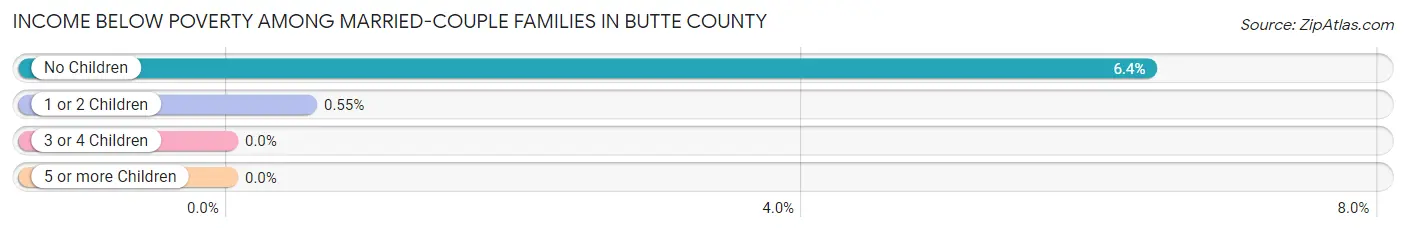
Income Below Poverty Among Married-Couple Families in Butte County
The poverty statistics for married-couple families in Butte County show that 4.1% or 96 of the total 2,317 families live below the poverty line. Families with no children have the highest poverty rate of 6.4%, comprising of 92 families. On the other hand, families with 3 or 4 children have the lowest poverty rate of 0.0%, which includes 0 families.
| Children | Above Poverty | Below Poverty |
| No Children | 1,345 (93.6%) | 92 (6.4%) |
| 1 or 2 Children | 723 (99.5%) | 4 (0.5%) |
| 3 or 4 Children | 131 (100.0%) | 0 (0.0%) |
| 5 or more Children | 22 (100.0%) | 0 (0.0%) |
| Total | 2,221 (95.9%) | 96 (4.1%) |
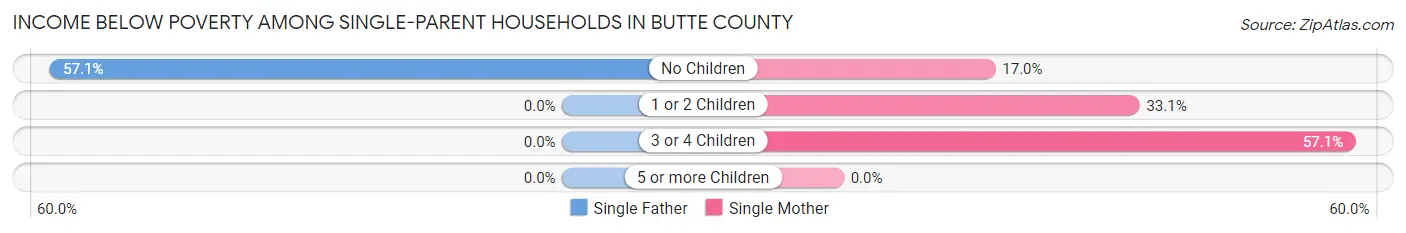
Income Below Poverty Among Single-Parent Households in Butte County
According to the poverty data in Butte County, 9.8% or 12 single-father households and 28.9% or 109 single-mother households are living below the poverty line. Among single-father households, those with no children have the highest poverty rate, with 12 households (57.1%) experiencing poverty. Likewise, among single-mother households, those with 3 or 4 children have the highest poverty rate, with 8 households (57.1%) falling below the poverty line.
| Children | Single Father | Single Mother |
| No Children | 12 (57.1%) | 20 (17.0%) |
| 1 or 2 Children | 0 (0.0%) | 81 (33.1%) |
| 3 or 4 Children | 0 (0.0%) | 8 (57.1%) |
| 5 or more Children | 0 (0.0%) | 0 (0.0%) |
| Total | 12 (9.8%) | 109 (28.9%) |
Income Below Poverty Among Married-Couple vs Single-Parent Households in Butte County
The poverty data for Butte County shows that 96 of the married-couple family households (4.1%) and 121 of the single-parent households (24.2%) are living below the poverty level. Within the married-couple family households, those with no children have the highest poverty rate, with 92 households (6.4%) falling below the poverty line. Among the single-parent households, those with 3 or 4 children have the highest poverty rate, with 8 household (25.8%) living below poverty.
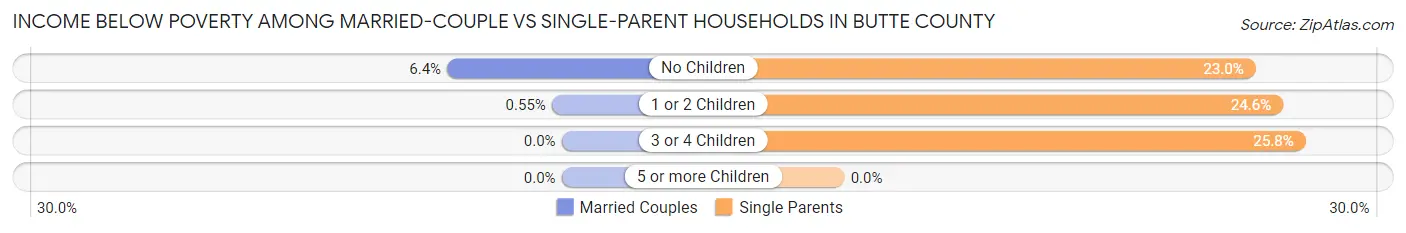
| Children | Married-Couple Families | Single-Parent Households |
| No Children | 92 (6.4%) | 32 (23.0%) |
| 1 or 2 Children | 4 (0.5%) | 81 (24.5%) |
| 3 or 4 Children | 0 (0.0%) | 8 (25.8%) |
| 5 or more Children | 0 (0.0%) | 0 (0.0%) |
| Total | 96 (4.1%) | 121 (24.2%) |
Employment Characteristics in Butte County
Employment by Class of Employer in Butte County
Among the 4,977 employed individuals in Butte County, private company employees (2,989 | 60.1%), local government employees (508 | 10.2%), and not-for-profit organizations (438 | 8.8%) make up the most common classes of employment.
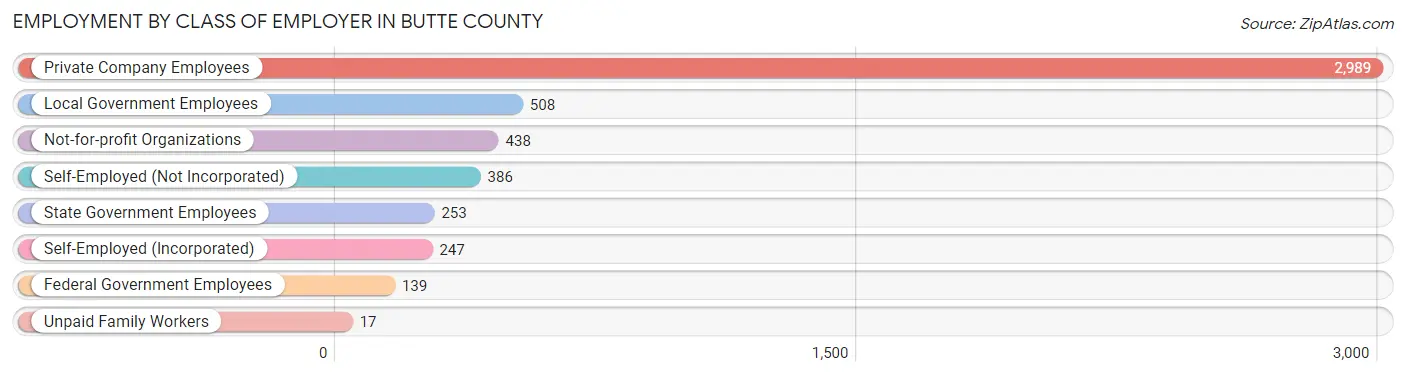
| Employer Class | # Employees | % Employees |
| Private Company Employees | 2,989 | 60.1% |
| Self-Employed (Incorporated) | 247 | 5.0% |
| Self-Employed (Not Incorporated) | 386 | 7.8% |
| Not-for-profit Organizations | 438 | 8.8% |
| Local Government Employees | 508 | 10.2% |
| State Government Employees | 253 | 5.1% |
| Federal Government Employees | 139 | 2.8% |
| Unpaid Family Workers | 17 | 0.3% |
| Total | 4,977 | 100.0% |
Employment Status by Age in Butte County
According to the labor force statistics for Butte County, out of the total population over 16 years of age (8,245), 65.8% or 5,425 individuals are in the labor force, with 5.8% or 315 of them unemployed. The age group with the highest labor force participation rate is 55 to 59 years, with 91.7% or 811 individuals in the labor force. Within the labor force, the 20 to 24 years age range has the highest percentage of unemployed individuals, with 17.0% or 62 of them being unemployed.
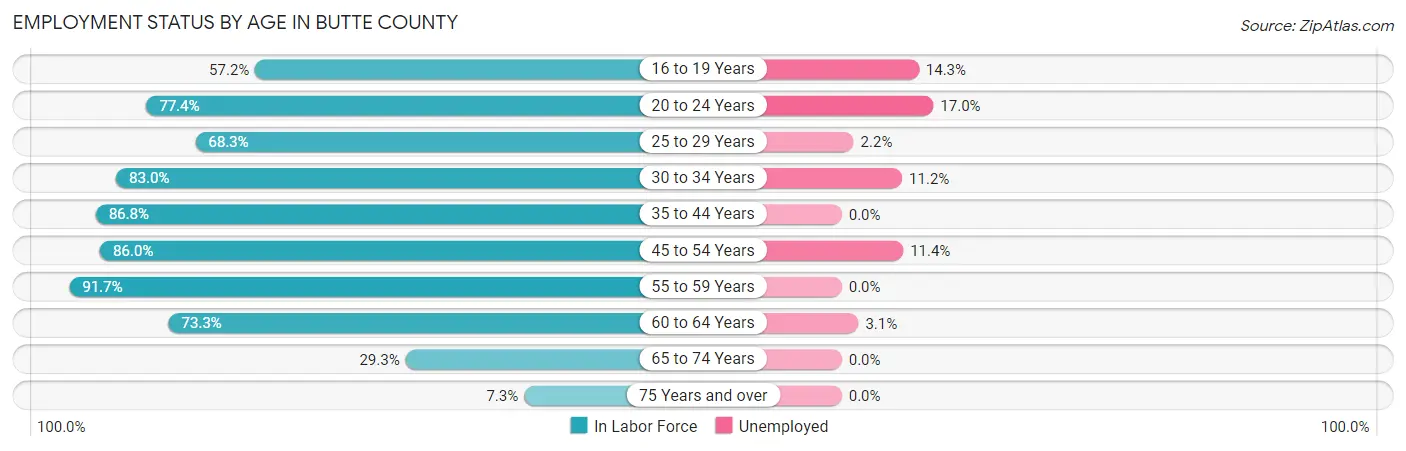
| Age Bracket | In Labor Force | Unemployed |
| 16 to 19 Years | 293 (57.2%) | 42 (14.3%) |
| 20 to 24 Years | 364 (77.4%) | 62 (17.0%) |
| 25 to 29 Years | 455 (68.3%) | 10 (2.2%) |
| 30 to 34 Years | 562 (83.0%) | 63 (11.2%) |
| 35 to 44 Years | 959 (86.8%) | 0 (0.0%) |
| 45 to 54 Years | 1,097 (86.0%) | 125 (11.4%) |
| 55 to 59 Years | 811 (91.7%) | 0 (0.0%) |
| 60 to 64 Years | 456 (73.3%) | 14 (3.1%) |
| 65 to 74 Years | 372 (29.3%) | 0 (0.0%) |
| 75 Years and over | 56 (7.3%) | 0 (0.0%) |
| Total | 5,425 (65.8%) | 315 (5.8%) |
Employment Status by Educational Attainment in Butte County
According to labor force statistics for Butte County, 83.0% of individuals (4,341) out of the total population between 25 and 64 years of age (5,230) are in the labor force, with 4.9% or 213 of them being unemployed. The group with the highest labor force participation rate are those with the educational attainment of bachelor's degree or higher, with 93.0% or 946 individuals in the labor force. Within the labor force, individuals with high school diploma education have the highest percentage of unemployment, with 9.5% or 148 of them being unemployed.
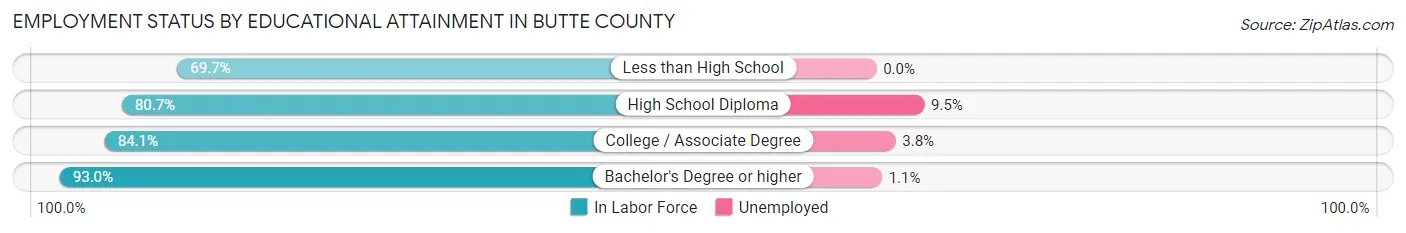
| Educational Attainment | In Labor Force | Unemployed |
| Less than High School | 403 (69.7%) | 0 (0.0%) |
| High School Diploma | 1,553 (80.7%) | 183 (9.5%) |
| College / Associate Degree | 1,438 (84.1%) | 65 (3.8%) |
| Bachelor's Degree or higher | 946 (93.0%) | 11 (1.1%) |
| Total | 4,341 (83.0%) | 256 (4.9%) |
Employment Occupations by Sex in Butte County
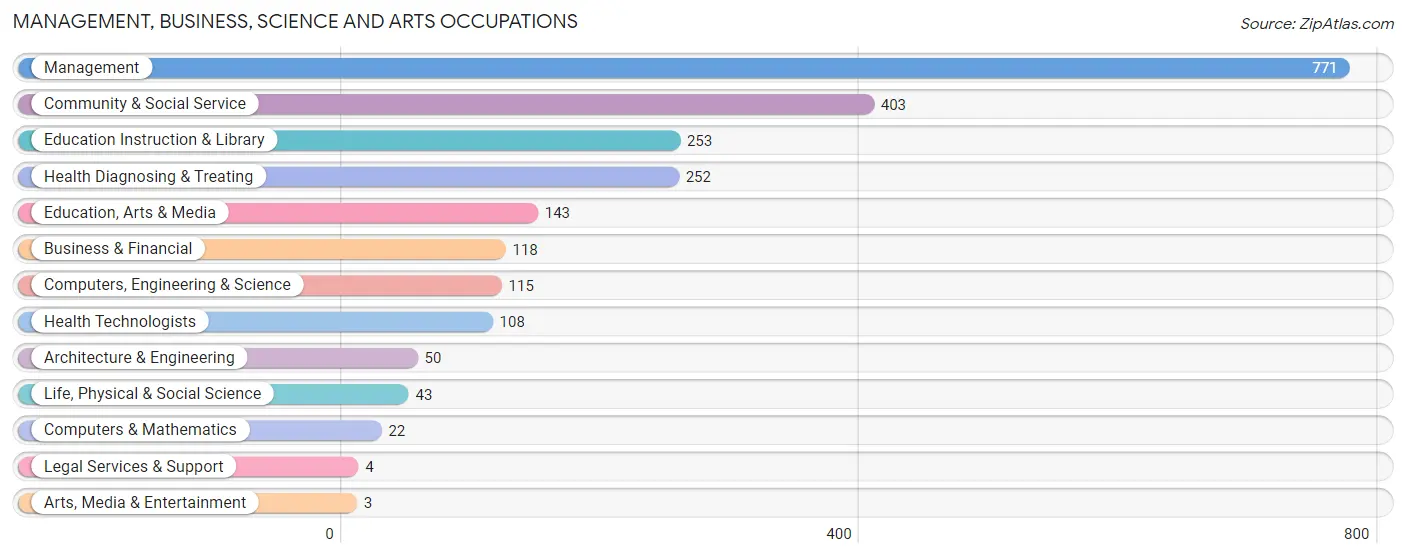
Management, Business, Science and Arts Occupations
The most common Management, Business, Science and Arts occupations in Butte County are Management (771 | 15.1%), Community & Social Service (403 | 7.9%), Education Instruction & Library (253 | 5.0%), Health Diagnosing & Treating (252 | 4.9%), and Education, Arts & Media (143 | 2.8%).
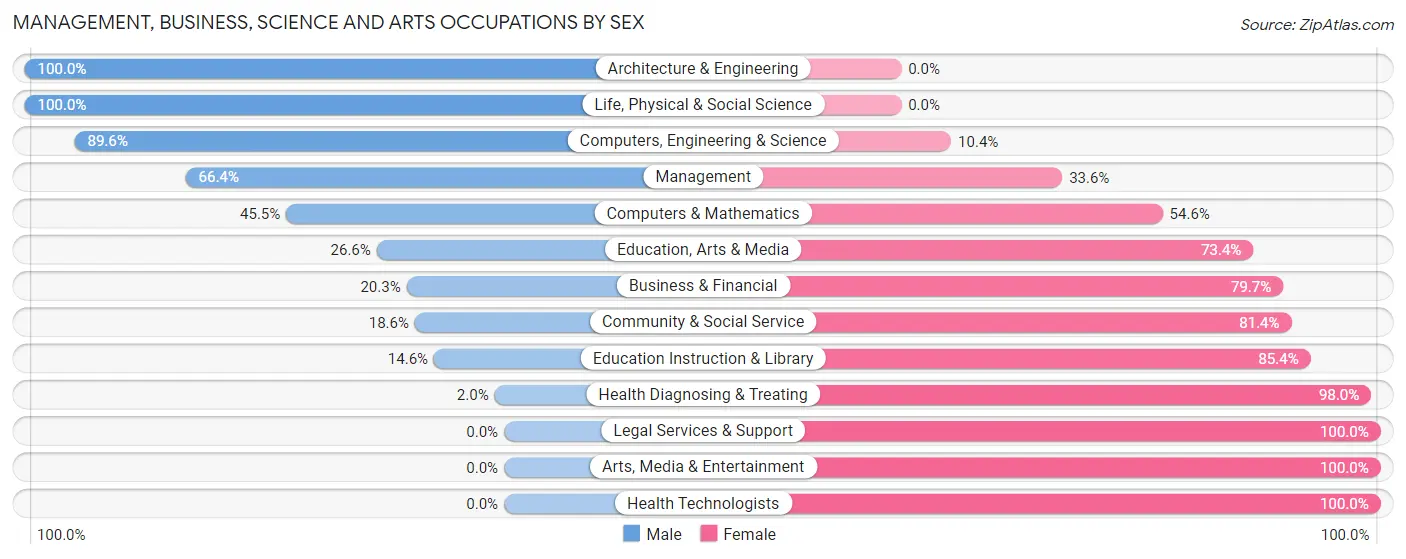
Management, Business, Science and Arts Occupations by Sex
Within the Management, Business, Science and Arts occupations in Butte County, the most male-oriented occupations are Architecture & Engineering (100.0%), Life, Physical & Social Science (100.0%), and Computers, Engineering & Science (89.6%), while the most female-oriented occupations are Legal Services & Support (100.0%), Arts, Media & Entertainment (100.0%), and Health Technologists (100.0%).
| Occupation | Male | Female |
| Management | 512 (66.4%) | 259 (33.6%) |
| Business & Financial | 24 (20.3%) | 94 (79.7%) |
| Computers, Engineering & Science | 103 (89.6%) | 12 (10.4%) |
| Computers & Mathematics | 10 (45.5%) | 12 (54.5%) |
| Architecture & Engineering | 50 (100.0%) | 0 (0.0%) |
| Life, Physical & Social Science | 43 (100.0%) | 0 (0.0%) |
| Community & Social Service | 75 (18.6%) | 328 (81.4%) |
| Education, Arts & Media | 38 (26.6%) | 105 (73.4%) |
| Legal Services & Support | 0 (0.0%) | 4 (100.0%) |
| Education Instruction & Library | 37 (14.6%) | 216 (85.4%) |
| Arts, Media & Entertainment | 0 (0.0%) | 3 (100.0%) |
| Health Diagnosing & Treating | 5 (2.0%) | 247 (98.0%) |
| Health Technologists | 0 (0.0%) | 108 (100.0%) |
| Total (Category) | 719 (43.3%) | 940 (56.7%) |
| Total (Overall) | 2,485 (48.6%) | 2,624 (51.4%) |
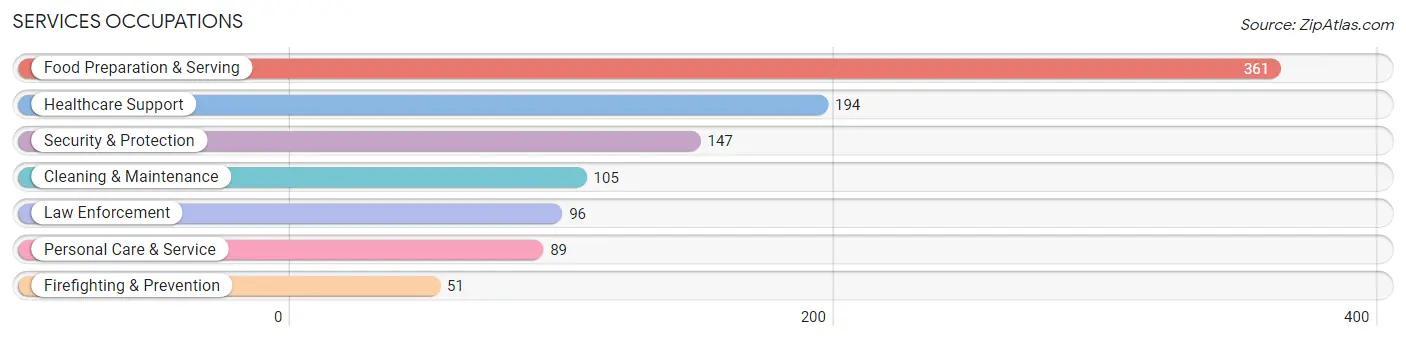
Services Occupations
The most common Services occupations in Butte County are Food Preparation & Serving (361 | 7.1%), Healthcare Support (194 | 3.8%), Security & Protection (147 | 2.9%), Cleaning & Maintenance (105 | 2.1%), and Law Enforcement (96 | 1.9%).
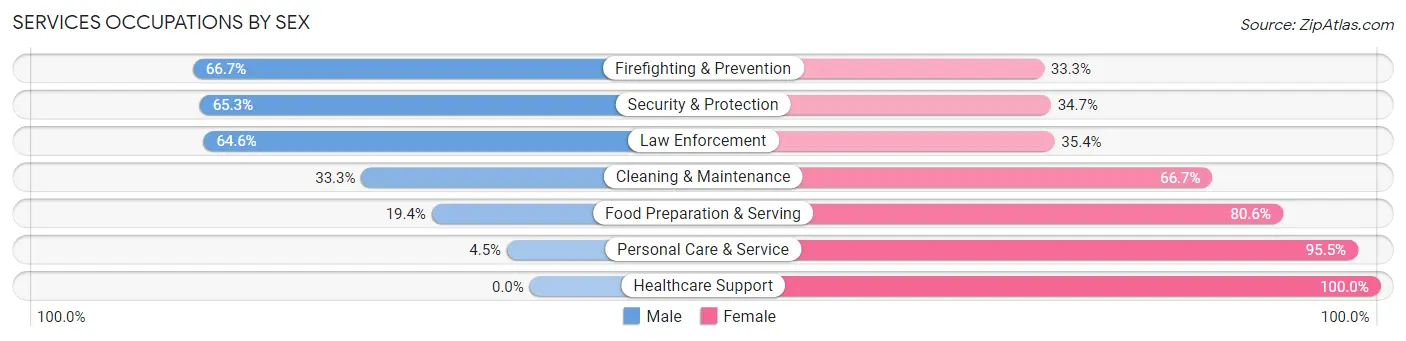
Services Occupations by Sex
Within the Services occupations in Butte County, the most male-oriented occupations are Firefighting & Prevention (66.7%), Security & Protection (65.3%), and Law Enforcement (64.6%), while the most female-oriented occupations are Healthcare Support (100.0%), Personal Care & Service (95.5%), and Food Preparation & Serving (80.6%).
| Occupation | Male | Female |
| Healthcare Support | 0 (0.0%) | 194 (100.0%) |
| Security & Protection | 96 (65.3%) | 51 (34.7%) |
| Firefighting & Prevention | 34 (66.7%) | 17 (33.3%) |
| Law Enforcement | 62 (64.6%) | 34 (35.4%) |
| Food Preparation & Serving | 70 (19.4%) | 291 (80.6%) |
| Cleaning & Maintenance | 35 (33.3%) | 70 (66.7%) |
| Personal Care & Service | 4 (4.5%) | 85 (95.5%) |
| Total (Category) | 205 (22.9%) | 691 (77.1%) |
| Total (Overall) | 2,485 (48.6%) | 2,624 (51.4%) |
Sales and Office Occupations
The most common Sales and Office occupations in Butte County are Office & Administration (609 | 11.9%), and Sales & Related (372 | 7.3%).
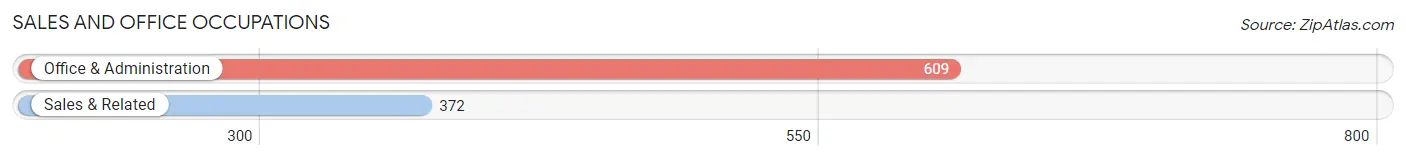
Sales and Office Occupations by Sex
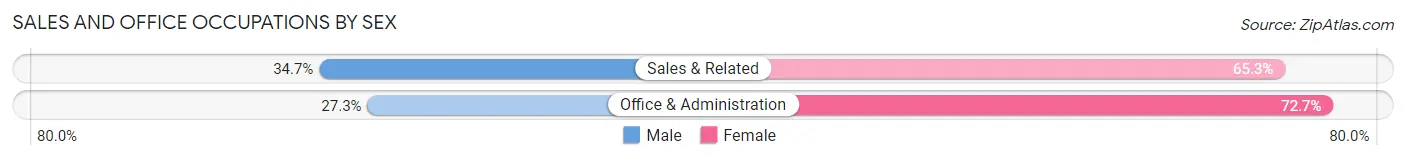
| Occupation | Male | Female |
| Sales & Related | 129 (34.7%) | 243 (65.3%) |
| Office & Administration | 166 (27.3%) | 443 (72.7%) |
| Total (Category) | 295 (30.1%) | 686 (69.9%) |
| Total (Overall) | 2,485 (48.6%) | 2,624 (51.4%) |
Natural Resources, Construction and Maintenance Occupations
The most common Natural Resources, Construction and Maintenance occupations in Butte County are Construction & Extraction (360 | 7.0%), Installation, Maintenance & Repair (262 | 5.1%), and Farming, Fishing & Forestry (160 | 3.1%).
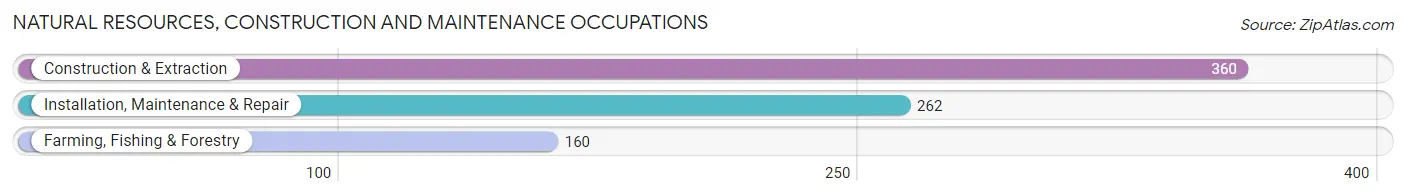
Natural Resources, Construction and Maintenance Occupations by Sex
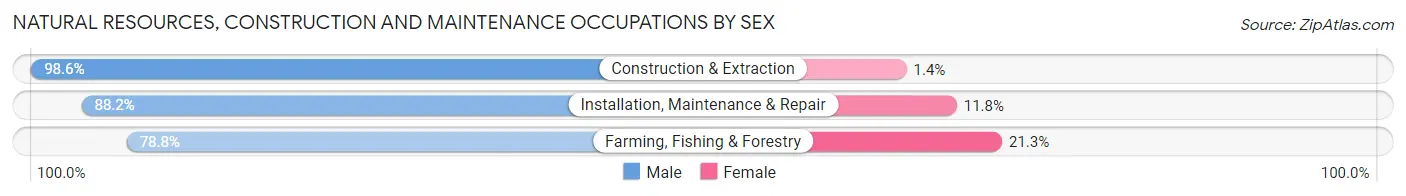
| Occupation | Male | Female |
| Farming, Fishing & Forestry | 126 (78.7%) | 34 (21.2%) |
| Construction & Extraction | 355 (98.6%) | 5 (1.4%) |
| Installation, Maintenance & Repair | 231 (88.2%) | 31 (11.8%) |
| Total (Category) | 712 (91.0%) | 70 (8.9%) |
| Total (Overall) | 2,485 (48.6%) | 2,624 (51.4%) |
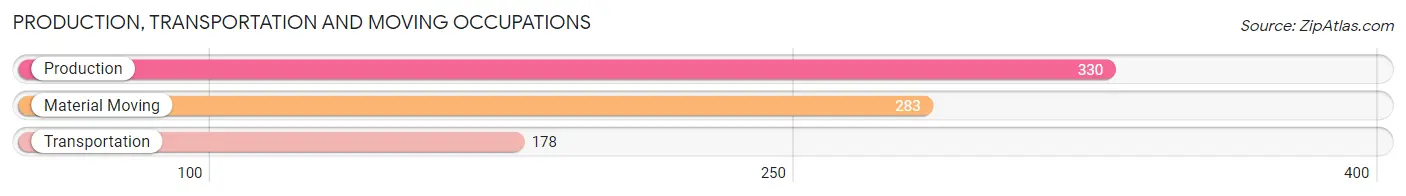
Production, Transportation and Moving Occupations
The most common Production, Transportation and Moving occupations in Butte County are Production (330 | 6.5%), Material Moving (283 | 5.5%), and Transportation (178 | 3.5%).
Production, Transportation and Moving Occupations by Sex
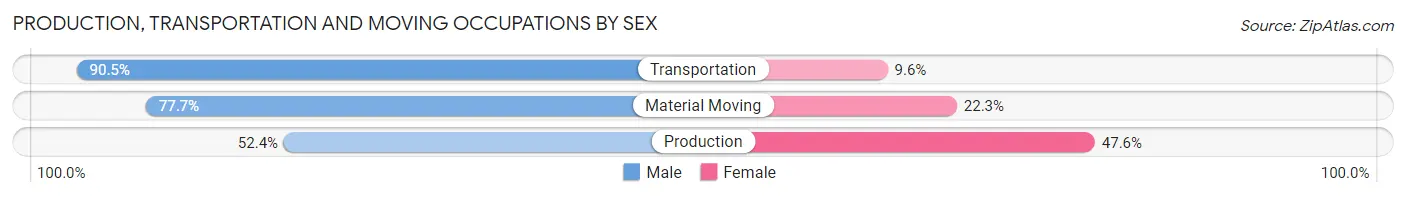
| Occupation | Male | Female |
| Production | 173 (52.4%) | 157 (47.6%) |
| Transportation | 161 (90.4%) | 17 (9.6%) |
| Material Moving | 220 (77.7%) | 63 (22.3%) |
| Total (Category) | 554 (70.0%) | 237 (30.0%) |
| Total (Overall) | 2,485 (48.6%) | 2,624 (51.4%) |
Employment Industries by Sex in Butte County
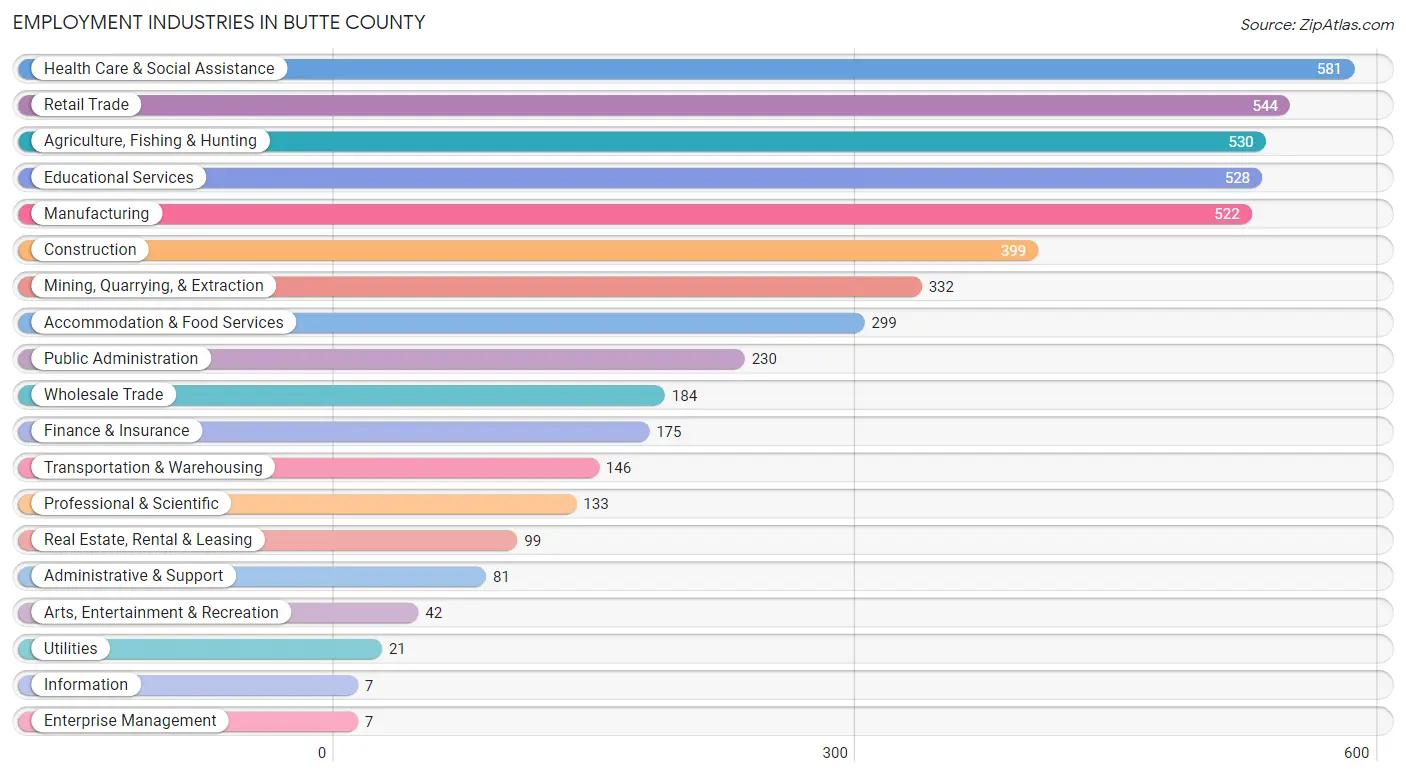
Employment Industries in Butte County
The major employment industries in Butte County include Health Care & Social Assistance (581 | 11.4%), Retail Trade (544 | 10.6%), Agriculture, Fishing & Hunting (530 | 10.4%), Educational Services (528 | 10.3%), and Manufacturing (522 | 10.2%).
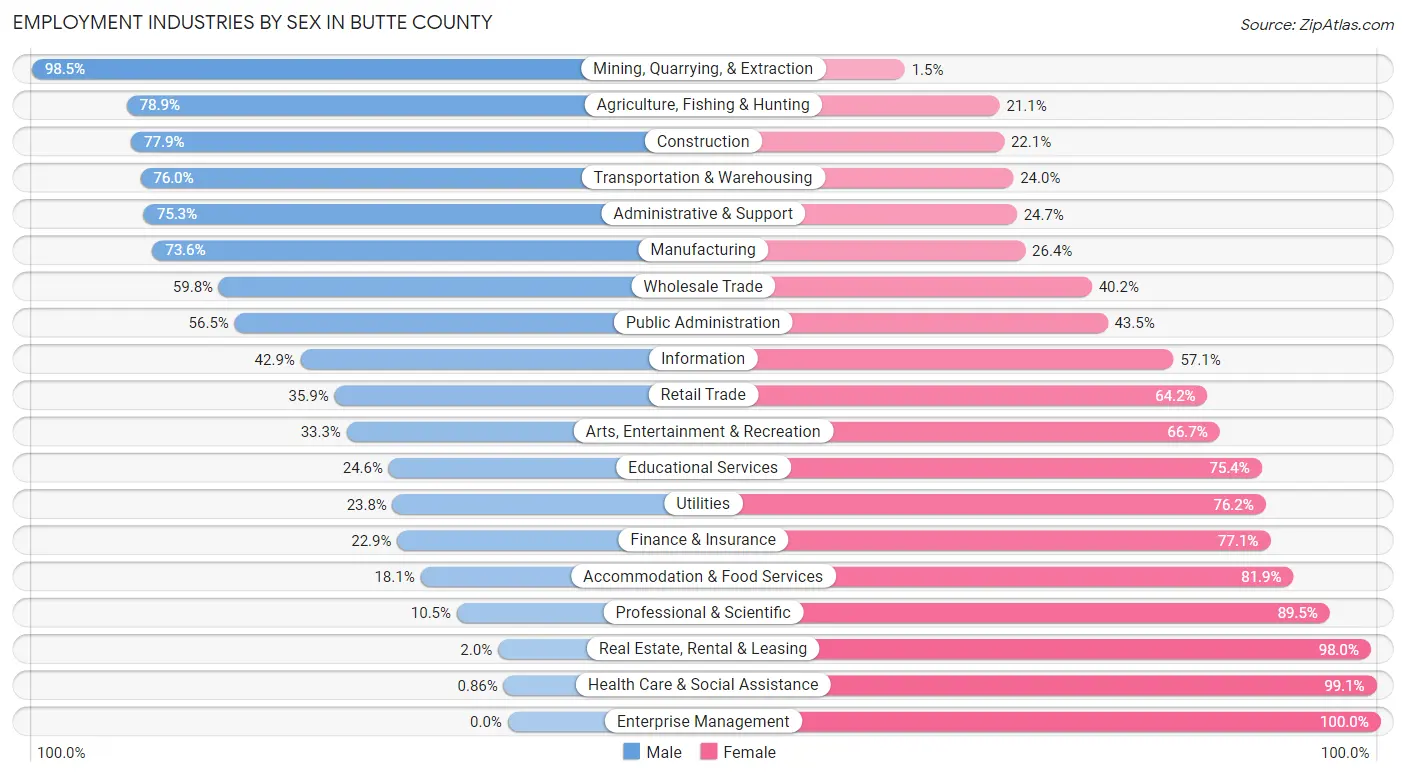
Employment Industries by Sex in Butte County
The Butte County industries that see more men than women are Mining, Quarrying, & Extraction (98.5%), Agriculture, Fishing & Hunting (78.9%), and Construction (77.9%), whereas the industries that tend to have a higher number of women are Enterprise Management (100.0%), Health Care & Social Assistance (99.1%), and Real Estate, Rental & Leasing (98.0%).
| Industry | Male | Female |
| Agriculture, Fishing & Hunting | 418 (78.9%) | 112 (21.1%) |
| Mining, Quarrying, & Extraction | 327 (98.5%) | 5 (1.5%) |
| Construction | 311 (77.9%) | 88 (22.1%) |
| Manufacturing | 384 (73.6%) | 138 (26.4%) |
| Wholesale Trade | 110 (59.8%) | 74 (40.2%) |
| Retail Trade | 195 (35.8%) | 349 (64.1%) |
| Transportation & Warehousing | 111 (76.0%) | 35 (24.0%) |
| Utilities | 5 (23.8%) | 16 (76.2%) |
| Information | 3 (42.9%) | 4 (57.1%) |
| Finance & Insurance | 40 (22.9%) | 135 (77.1%) |
| Real Estate, Rental & Leasing | 2 (2.0%) | 97 (98.0%) |
| Professional & Scientific | 14 (10.5%) | 119 (89.5%) |
| Enterprise Management | 0 (0.0%) | 7 (100.0%) |
| Administrative & Support | 61 (75.3%) | 20 (24.7%) |
| Educational Services | 130 (24.6%) | 398 (75.4%) |
| Health Care & Social Assistance | 5 (0.9%) | 576 (99.1%) |
| Arts, Entertainment & Recreation | 14 (33.3%) | 28 (66.7%) |
| Accommodation & Food Services | 54 (18.1%) | 245 (81.9%) |
| Public Administration | 130 (56.5%) | 100 (43.5%) |
| Total | 2,485 (48.6%) | 2,624 (51.4%) |
Education in Butte County
School Enrollment in Butte County
The most common levels of schooling among the 2,203 students in Butte County are elementary school (700 | 31.8%), high school (637 | 28.9%), and middle school (420 | 19.1%).
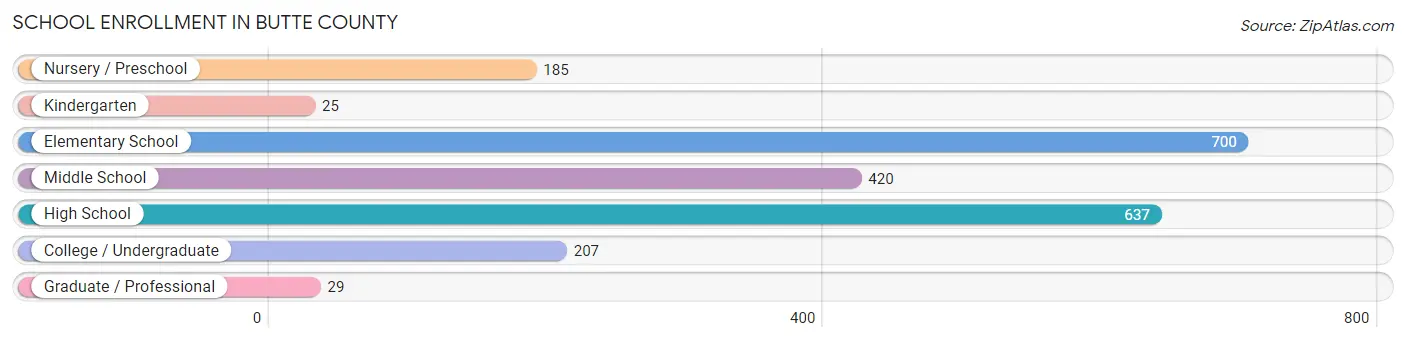
| School Level | # Students | % Students |
| Nursery / Preschool | 185 | 8.4% |
| Kindergarten | 25 | 1.1% |
| Elementary School | 700 | 31.8% |
| Middle School | 420 | 19.1% |
| High School | 637 | 28.9% |
| College / Undergraduate | 207 | 9.4% |
| Graduate / Professional | 29 | 1.3% |
| Total | 2,203 | 100.0% |
School Enrollment by Age by Funding Source in Butte County
Out of a total of 2,203 students who are enrolled in schools in Butte County, 430 (19.5%) attend a private institution, while the remaining 1,773 (80.5%) are enrolled in public schools. The age group of 3 to 4 year olds has the highest likelihood of being enrolled in private schools, with 40 (48.8% in the age bracket) enrolled. Conversely, the age group of 25 to 34 year olds has the lowest likelihood of being enrolled in a private school, with 14 (100.0% in the age bracket) attending a public institution.
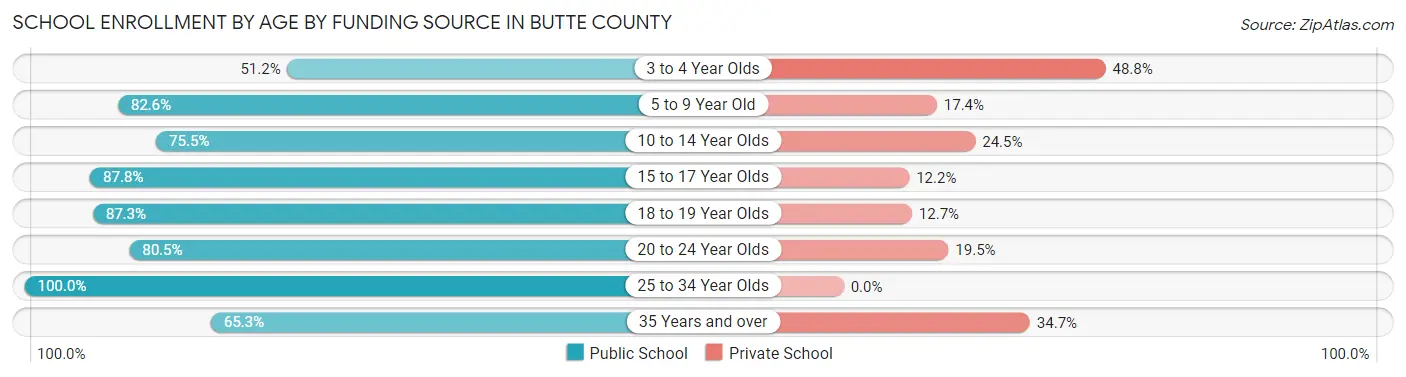
| Age Bracket | Public School | Private School |
| 3 to 4 Year Olds | 42 (51.2%) | 40 (48.8%) |
| 5 to 9 Year Old | 595 (82.6%) | 125 (17.4%) |
| 10 to 14 Year Olds | 459 (75.5%) | 149 (24.5%) |
| 15 to 17 Year Olds | 374 (87.8%) | 52 (12.2%) |
| 18 to 19 Year Olds | 158 (87.3%) | 23 (12.7%) |
| 20 to 24 Year Olds | 99 (80.5%) | 24 (19.5%) |
| 25 to 34 Year Olds | 14 (100.0%) | 0 (0.0%) |
| 35 Years and over | 32 (65.3%) | 17 (34.7%) |
| Total | 1,773 (80.5%) | 430 (19.5%) |
Educational Attainment by Field of Study in Butte County
Education (378 | 27.7%), business (227 | 16.7%), bio, nature & agricultural (171 | 12.6%), engineering (125 | 9.2%), and science & technology (116 | 8.5%) are the most common fields of study among 1,363 individuals in Butte County who have obtained a bachelor's degree or higher.
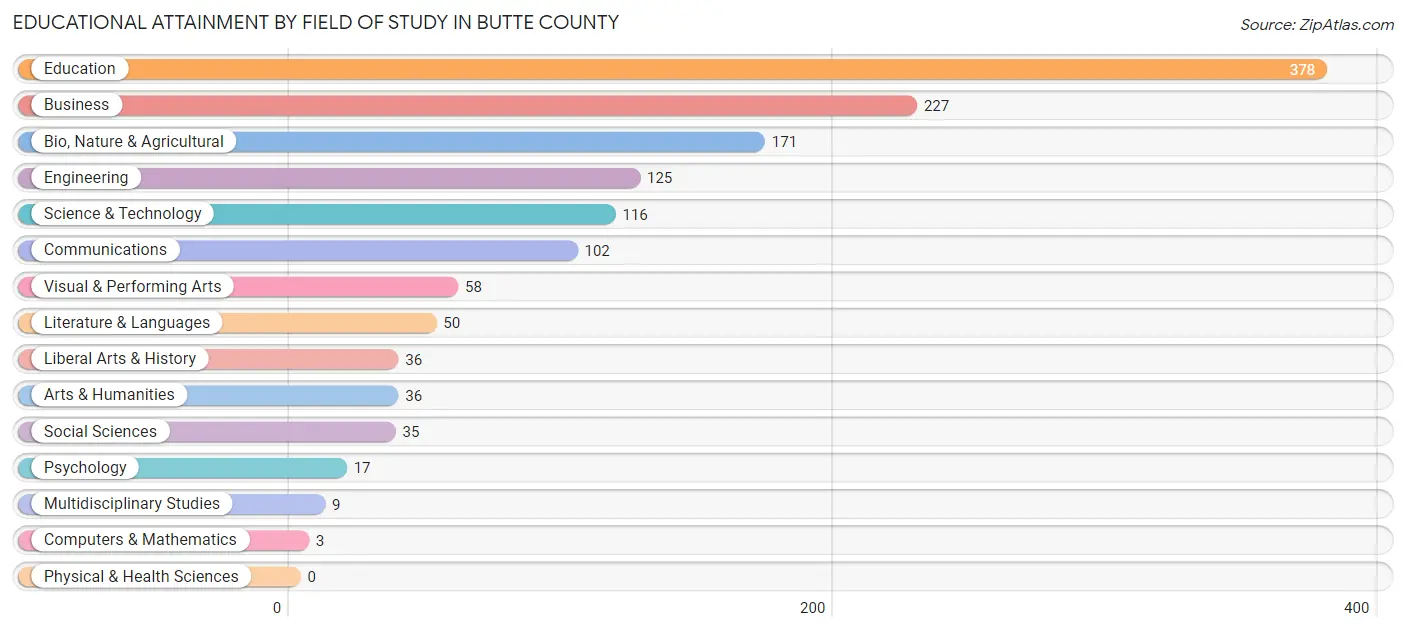
| Field of Study | # Graduates | % Graduates |
| Computers & Mathematics | 3 | 0.2% |
| Bio, Nature & Agricultural | 171 | 12.6% |
| Physical & Health Sciences | 0 | 0.0% |
| Psychology | 17 | 1.3% |
| Social Sciences | 35 | 2.6% |
| Engineering | 125 | 9.2% |
| Multidisciplinary Studies | 9 | 0.7% |
| Science & Technology | 116 | 8.5% |
| Business | 227 | 16.7% |
| Education | 378 | 27.7% |
| Literature & Languages | 50 | 3.7% |
| Liberal Arts & History | 36 | 2.6% |
| Visual & Performing Arts | 58 | 4.3% |
| Communications | 102 | 7.5% |
| Arts & Humanities | 36 | 2.6% |
| Total | 1,363 | 100.0% |
Transportation & Commute in Butte County
Vehicle Availability by Sex in Butte County
The most prevalent vehicle ownership categories in Butte County are males with 2 vehicles (833, accounting for 35.3%) and females with 2 vehicles (703, making up 32.0%).
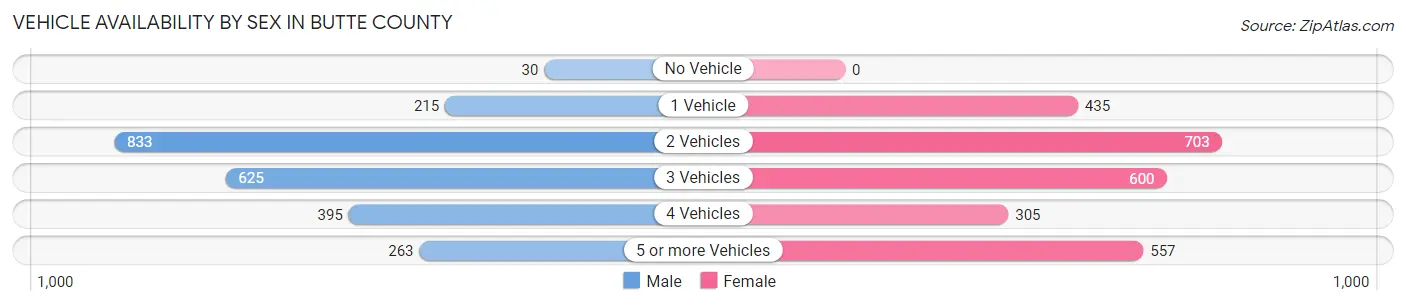
| Vehicles Available | Male | Female |
| No Vehicle | 30 (1.3%) | 0 (0.0%) |
| 1 Vehicle | 215 (9.1%) | 435 (16.7%) |
| 2 Vehicles | 833 (35.3%) | 703 (27.0%) |
| 3 Vehicles | 625 (26.5%) | 600 (23.1%) |
| 4 Vehicles | 395 (16.7%) | 305 (11.7%) |
| 5 or more Vehicles | 263 (11.1%) | 557 (21.4%) |
| Total | 2,361 (100.0%) | 2,600 (100.0%) |
Commute Time in Butte County
The most frequently occuring commute durations in Butte County are 5 to 9 minutes (1,042 commuters, 23.3%), 15 to 19 minutes (666 commuters, 14.9%), and 20 to 24 minutes (622 commuters, 13.9%).
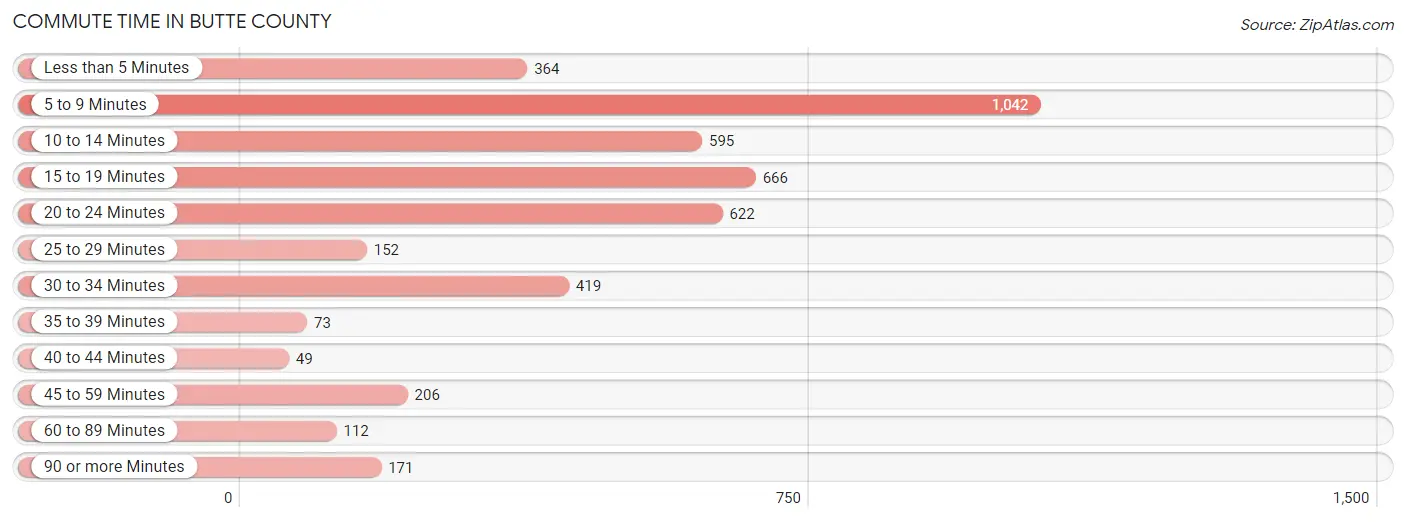
| Commute Time | # Commuters | % Commuters |
| Less than 5 Minutes | 364 | 8.1% |
| 5 to 9 Minutes | 1,042 | 23.3% |
| 10 to 14 Minutes | 595 | 13.3% |
| 15 to 19 Minutes | 666 | 14.9% |
| 20 to 24 Minutes | 622 | 13.9% |
| 25 to 29 Minutes | 152 | 3.4% |
| 30 to 34 Minutes | 419 | 9.4% |
| 35 to 39 Minutes | 73 | 1.6% |
| 40 to 44 Minutes | 49 | 1.1% |
| 45 to 59 Minutes | 206 | 4.6% |
| 60 to 89 Minutes | 112 | 2.5% |
| 90 or more Minutes | 171 | 3.8% |
Commute Time by Sex in Butte County
The most common commute times in Butte County are 5 to 9 minutes (526 commuters, 24.9%) for males and 5 to 9 minutes (516 commuters, 21.9%) for females.
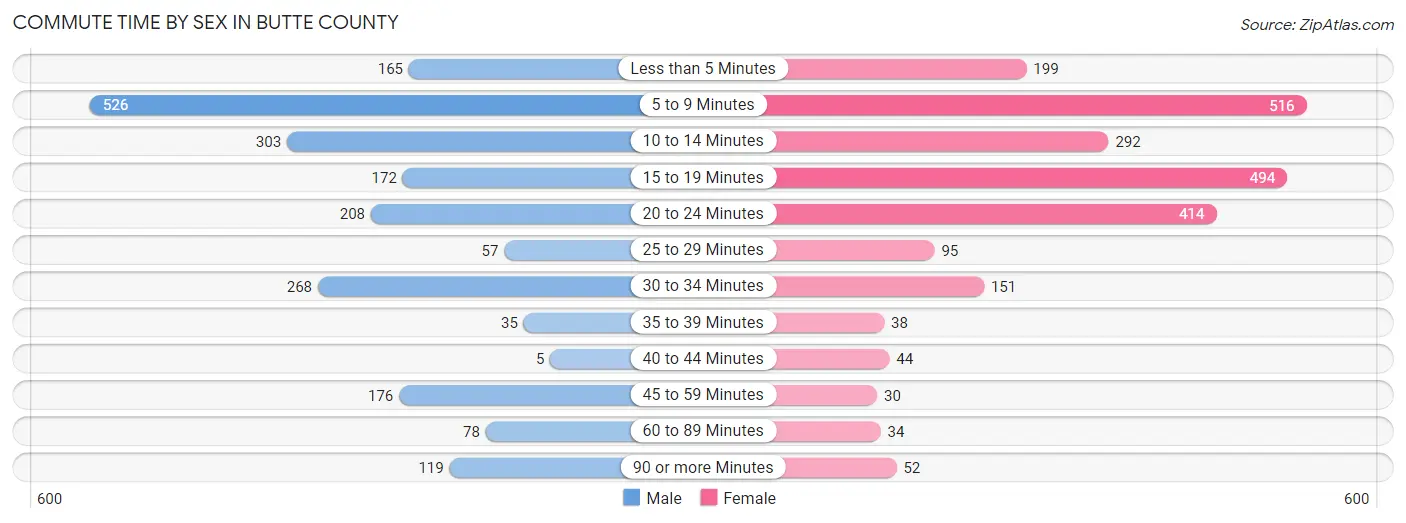
| Commute Time | Male | Female |
| Less than 5 Minutes | 165 (7.8%) | 199 (8.4%) |
| 5 to 9 Minutes | 526 (24.9%) | 516 (21.9%) |
| 10 to 14 Minutes | 303 (14.3%) | 292 (12.4%) |
| 15 to 19 Minutes | 172 (8.1%) | 494 (20.9%) |
| 20 to 24 Minutes | 208 (9.9%) | 414 (17.5%) |
| 25 to 29 Minutes | 57 (2.7%) | 95 (4.0%) |
| 30 to 34 Minutes | 268 (12.7%) | 151 (6.4%) |
| 35 to 39 Minutes | 35 (1.7%) | 38 (1.6%) |
| 40 to 44 Minutes | 5 (0.2%) | 44 (1.9%) |
| 45 to 59 Minutes | 176 (8.3%) | 30 (1.3%) |
| 60 to 89 Minutes | 78 (3.7%) | 34 (1.4%) |
| 90 or more Minutes | 119 (5.6%) | 52 (2.2%) |
Time of Departure to Work by Sex in Butte County
The most frequent times of departure to work in Butte County are 7:30 AM to 7:59 AM (489, 23.2%) for males and 7:00 AM to 7:29 AM (617, 26.2%) for females.
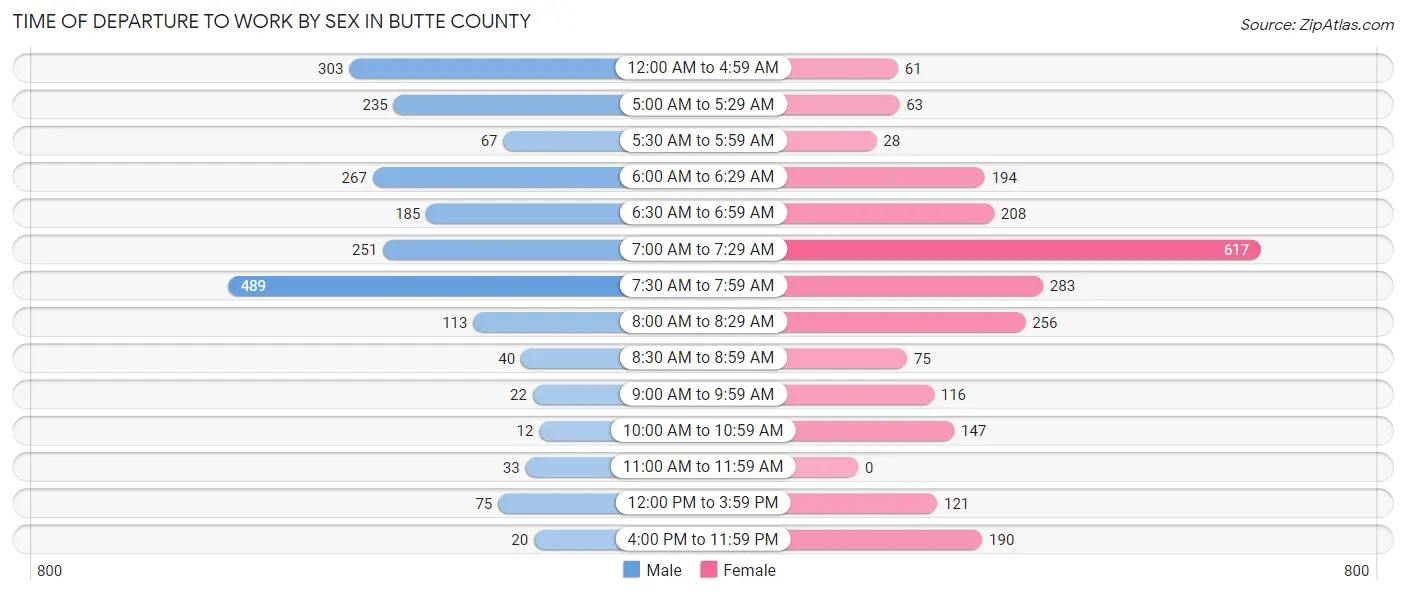
| Time of Departure | Male | Female |
| 12:00 AM to 4:59 AM | 303 (14.3%) | 61 (2.6%) |
| 5:00 AM to 5:29 AM | 235 (11.1%) | 63 (2.7%) |
| 5:30 AM to 5:59 AM | 67 (3.2%) | 28 (1.2%) |
| 6:00 AM to 6:29 AM | 267 (12.6%) | 194 (8.2%) |
| 6:30 AM to 6:59 AM | 185 (8.8%) | 208 (8.8%) |
| 7:00 AM to 7:29 AM | 251 (11.9%) | 617 (26.2%) |
| 7:30 AM to 7:59 AM | 489 (23.2%) | 283 (12.0%) |
| 8:00 AM to 8:29 AM | 113 (5.3%) | 256 (10.8%) |
| 8:30 AM to 8:59 AM | 40 (1.9%) | 75 (3.2%) |
| 9:00 AM to 9:59 AM | 22 (1.0%) | 116 (4.9%) |
| 10:00 AM to 10:59 AM | 12 (0.6%) | 147 (6.2%) |
| 11:00 AM to 11:59 AM | 33 (1.6%) | 0 (0.0%) |
| 12:00 PM to 3:59 PM | 75 (3.5%) | 121 (5.1%) |
| 4:00 PM to 11:59 PM | 20 (0.9%) | 190 (8.1%) |
| Total | 2,112 (100.0%) | 2,359 (100.0%) |
Housing Occupancy in Butte County
Occupancy by Ownership in Butte County
Of the total 4,112 dwellings in Butte County, owner-occupied units account for 3,296 (80.2%), while renter-occupied units make up 816 (19.8%).
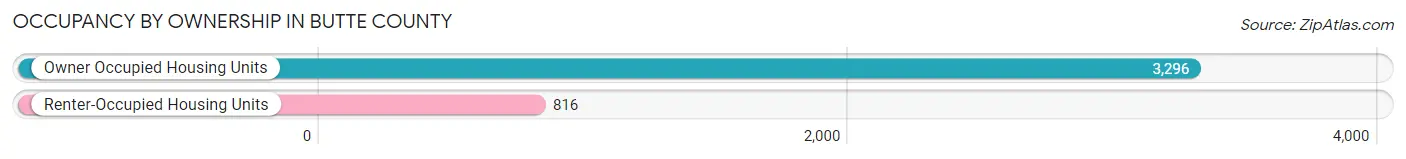
| Occupancy | # Housing Units | % Housing Units |
| Owner Occupied Housing Units | 3,296 | 80.2% |
| Renter-Occupied Housing Units | 816 | 19.8% |
| Total Occupied Housing Units | 4,112 | 100.0% |
Occupancy by Household Size in Butte County
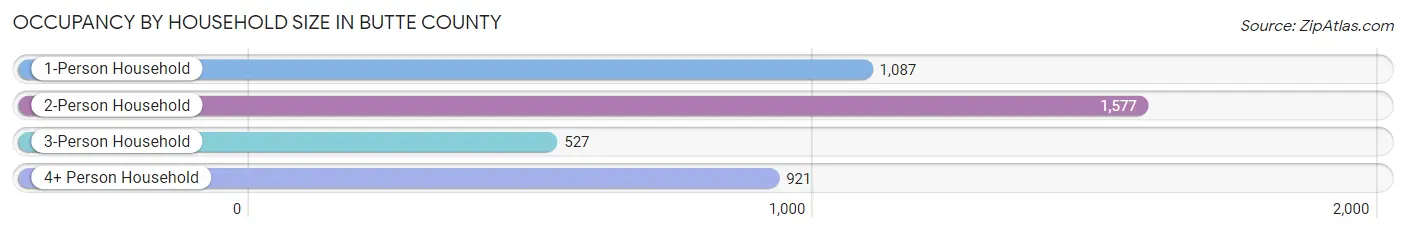
| Household Size | # Housing Units | % Housing Units |
| 1-Person Household | 1,087 | 26.4% |
| 2-Person Household | 1,577 | 38.4% |
| 3-Person Household | 527 | 12.8% |
| 4+ Person Household | 921 | 22.4% |
| Total Housing Units | 4,112 | 100.0% |
Occupancy by Ownership by Household Size in Butte County
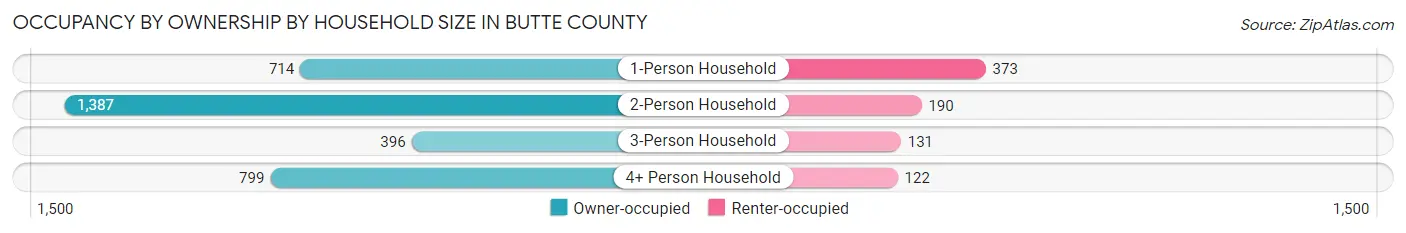
| Household Size | Owner-occupied | Renter-occupied |
| 1-Person Household | 714 (65.7%) | 373 (34.3%) |
| 2-Person Household | 1,387 (87.9%) | 190 (12.0%) |
| 3-Person Household | 396 (75.1%) | 131 (24.9%) |
| 4+ Person Household | 799 (86.8%) | 122 (13.3%) |
| Total Housing Units | 3,296 (80.2%) | 816 (19.8%) |
Occupancy by Educational Attainment in Butte County
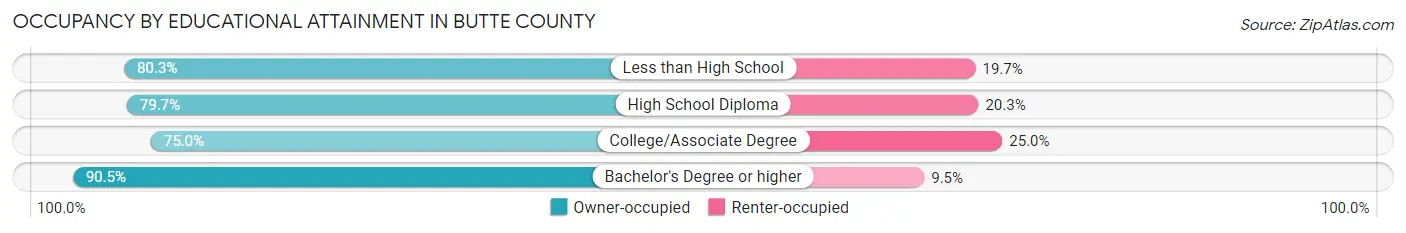
| Household Size | Owner-occupied | Renter-occupied |
| Less than High School | 220 (80.3%) | 54 (19.7%) |
| High School Diploma | 1,124 (79.7%) | 286 (20.3%) |
| College/Associate Degree | 1,184 (75.0%) | 395 (25.0%) |
| Bachelor's Degree or higher | 768 (90.5%) | 81 (9.5%) |
Occupancy by Age of Householder in Butte County
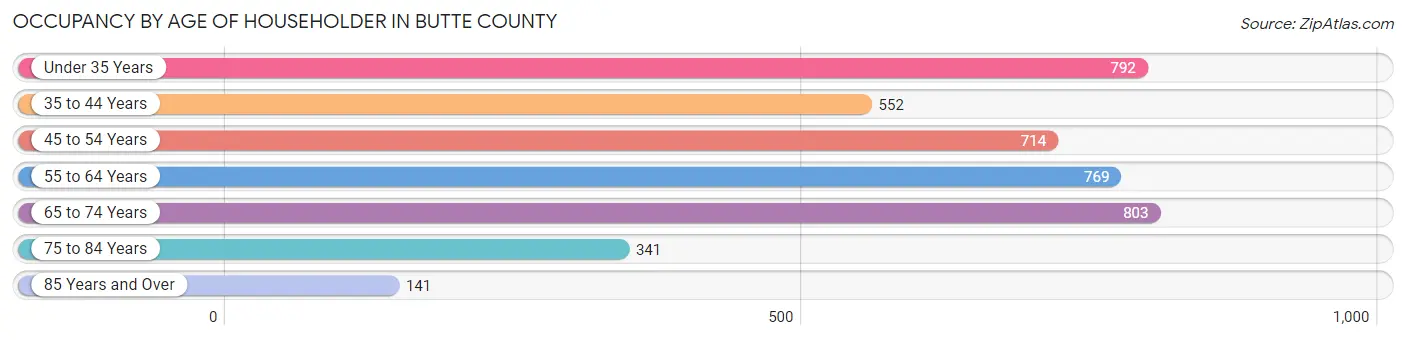
| Age Bracket | # Households | % Households |
| Under 35 Years | 792 | 19.3% |
| 35 to 44 Years | 552 | 13.4% |
| 45 to 54 Years | 714 | 17.4% |
| 55 to 64 Years | 769 | 18.7% |
| 65 to 74 Years | 803 | 19.5% |
| 75 to 84 Years | 341 | 8.3% |
| 85 Years and Over | 141 | 3.4% |
| Total | 4,112 | 100.0% |
Housing Finances in Butte County
Median Income by Occupancy in Butte County
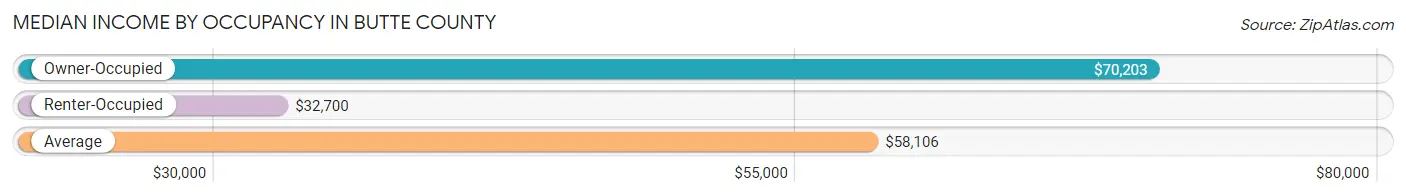
| Occupancy Type | # Households | Median Income |
| Owner-Occupied | 3,296 (80.2%) | $70,203 |
| Renter-Occupied | 816 (19.8%) | $32,700 |
| Average | 4,112 (100.0%) | $58,106 |
Occupancy by Householder Income Bracket in Butte County
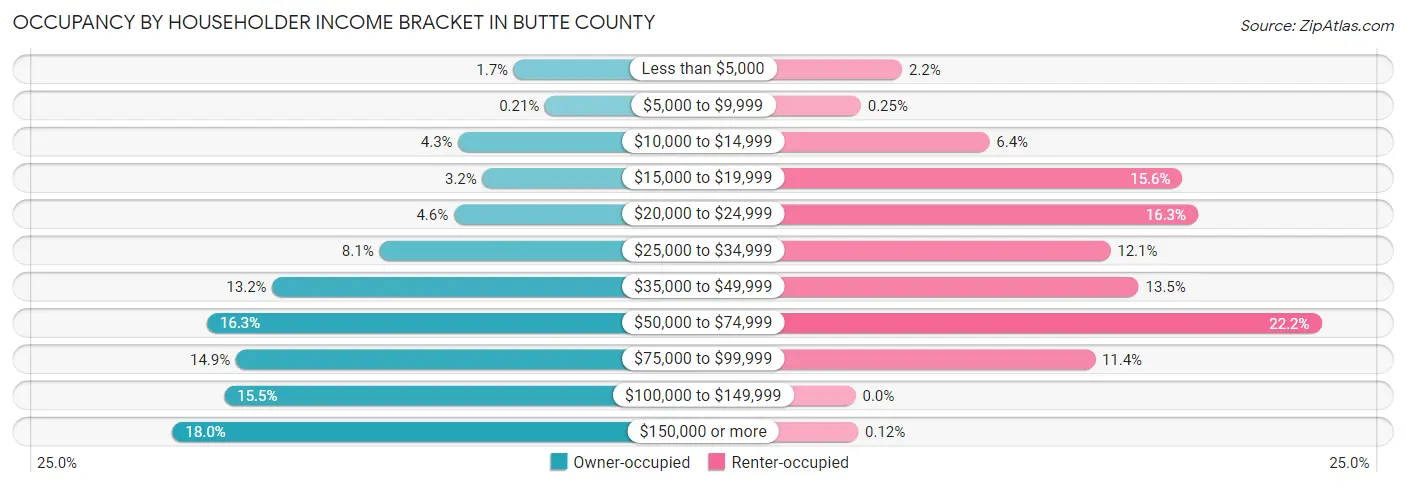
| Income Bracket | Owner-occupied | Renter-occupied |
| Less than $5,000 | 56 (1.7%) | 18 (2.2%) |
| $5,000 to $9,999 | 7 (0.2%) | 2 (0.3%) |
| $10,000 to $14,999 | 143 (4.3%) | 52 (6.4%) |
| $15,000 to $19,999 | 105 (3.2%) | 127 (15.6%) |
| $20,000 to $24,999 | 150 (4.5%) | 133 (16.3%) |
| $25,000 to $34,999 | 267 (8.1%) | 99 (12.1%) |
| $35,000 to $49,999 | 435 (13.2%) | 110 (13.5%) |
| $50,000 to $74,999 | 538 (16.3%) | 181 (22.2%) |
| $75,000 to $99,999 | 492 (14.9%) | 93 (11.4%) |
| $100,000 to $149,999 | 511 (15.5%) | 0 (0.0%) |
| $150,000 or more | 592 (18.0%) | 1 (0.1%) |
| Total | 3,296 (100.0%) | 816 (100.0%) |
Monthly Housing Cost Tiers in Butte County
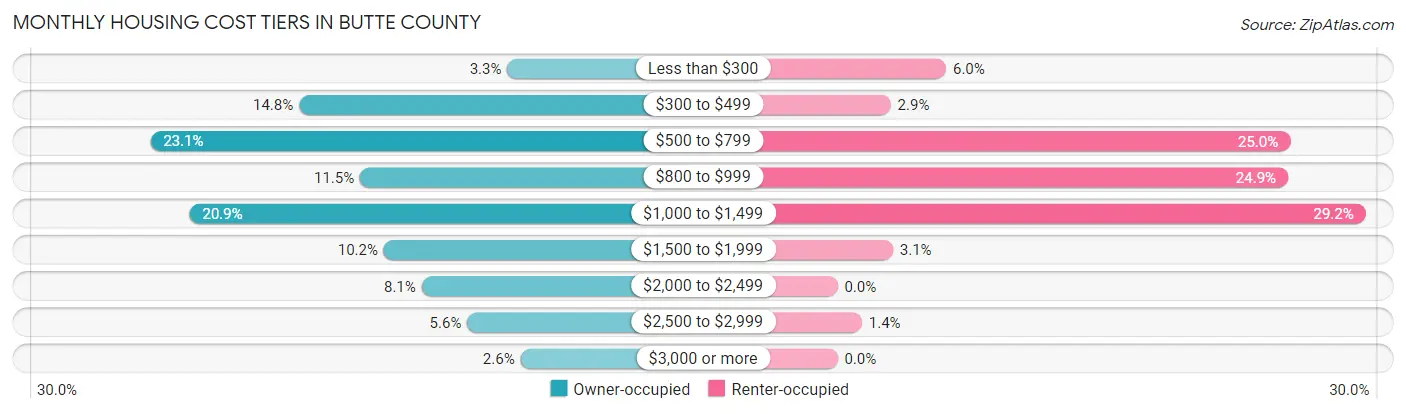
| Monthly Cost | Owner-occupied | Renter-occupied |
| Less than $300 | 110 (3.3%) | 49 (6.0%) |
| $300 to $499 | 489 (14.8%) | 24 (2.9%) |
| $500 to $799 | 760 (23.1%) | 204 (25.0%) |
| $800 to $999 | 378 (11.5%) | 203 (24.9%) |
| $1,000 to $1,499 | 689 (20.9%) | 238 (29.2%) |
| $1,500 to $1,999 | 335 (10.2%) | 25 (3.1%) |
| $2,000 to $2,499 | 266 (8.1%) | 0 (0.0%) |
| $2,500 to $2,999 | 183 (5.6%) | 11 (1.3%) |
| $3,000 or more | 86 (2.6%) | 0 (0.0%) |
| Total | 3,296 (100.0%) | 816 (100.0%) |
Physical Housing Characteristics in Butte County
Housing Structures in Butte County
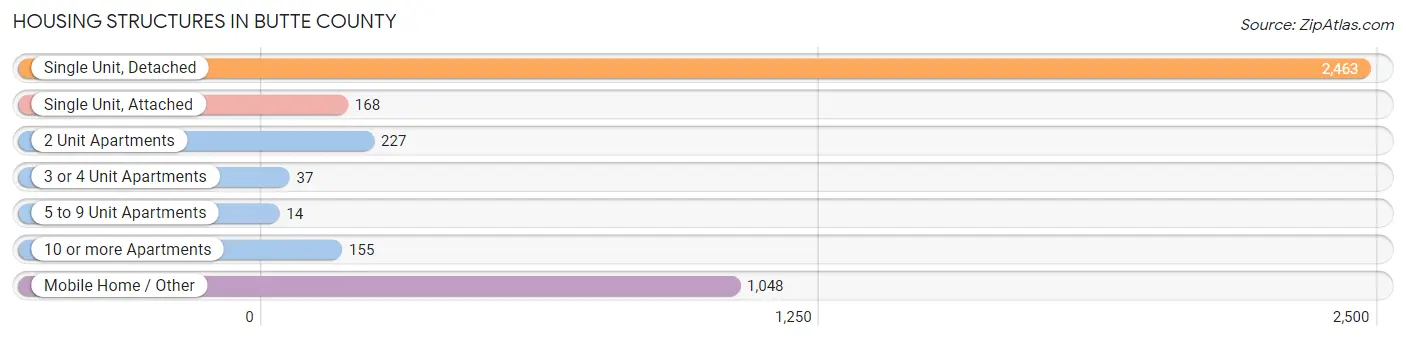
| Structure Type | # Housing Units | % Housing Units |
| Single Unit, Detached | 2,463 | 59.9% |
| Single Unit, Attached | 168 | 4.1% |
| 2 Unit Apartments | 227 | 5.5% |
| 3 or 4 Unit Apartments | 37 | 0.9% |
| 5 to 9 Unit Apartments | 14 | 0.3% |
| 10 or more Apartments | 155 | 3.8% |
| Mobile Home / Other | 1,048 | 25.5% |
| Total | 4,112 | 100.0% |
Housing Structures by Occupancy in Butte County
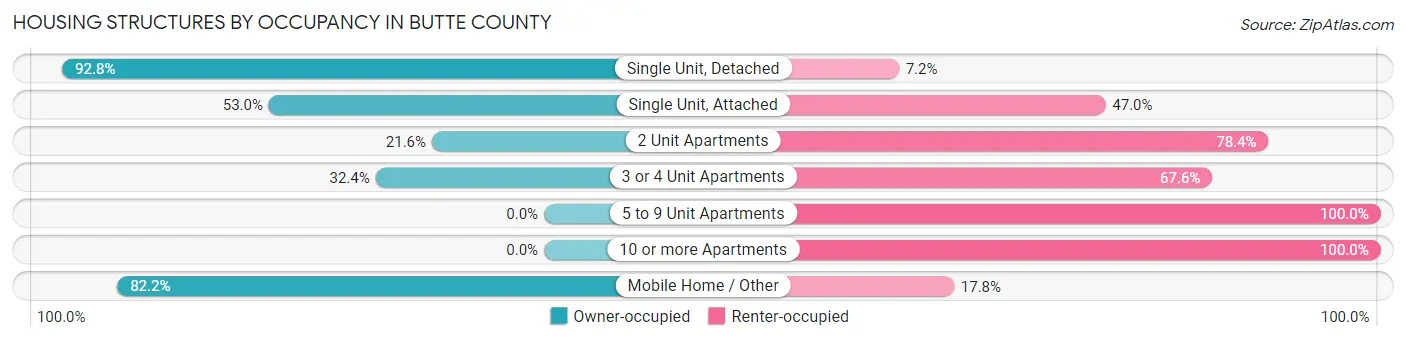
| Structure Type | Owner-occupied | Renter-occupied |
| Single Unit, Detached | 2,285 (92.8%) | 178 (7.2%) |
| Single Unit, Attached | 89 (53.0%) | 79 (47.0%) |
| 2 Unit Apartments | 49 (21.6%) | 178 (78.4%) |
| 3 or 4 Unit Apartments | 12 (32.4%) | 25 (67.6%) |
| 5 to 9 Unit Apartments | 0 (0.0%) | 14 (100.0%) |
| 10 or more Apartments | 0 (0.0%) | 155 (100.0%) |
| Mobile Home / Other | 861 (82.2%) | 187 (17.8%) |
| Total | 3,296 (80.2%) | 816 (19.8%) |
Housing Structures by Number of Rooms in Butte County

| Number of Rooms | Owner-occupied | Renter-occupied |
| 1 Room | 10 (0.3%) | 25 (3.1%) |
| 2 or 3 Rooms | 150 (4.5%) | 180 (22.1%) |
| 4 or 5 Rooms | 981 (29.8%) | 364 (44.6%) |
| 6 or 7 Rooms | 999 (30.3%) | 221 (27.1%) |
| 8 or more Rooms | 1,156 (35.1%) | 26 (3.2%) |
| Total | 3,296 (100.0%) | 816 (100.0%) |
Housing Structure by Heating Type in Butte County
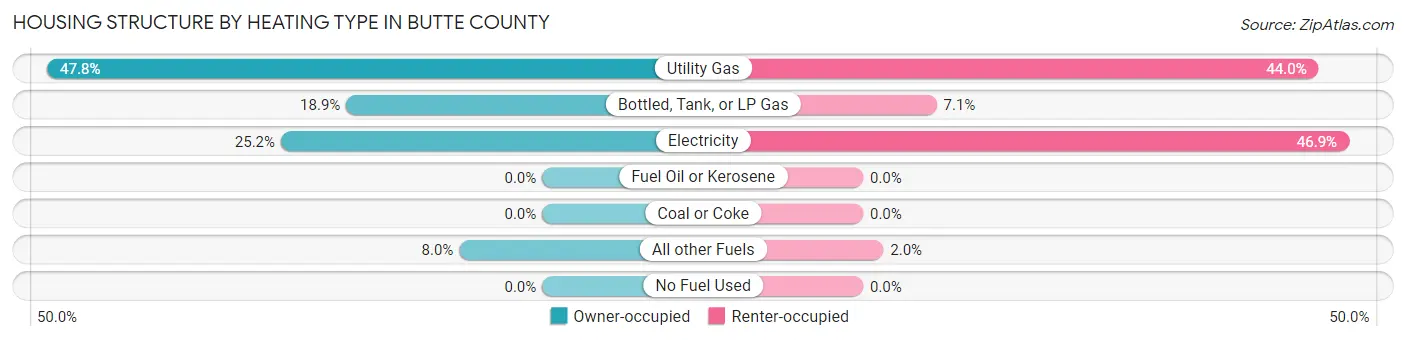
| Heating Type | Owner-occupied | Renter-occupied |
| Utility Gas | 1,576 (47.8%) | 359 (44.0%) |
| Bottled, Tank, or LP Gas | 624 (18.9%) | 58 (7.1%) |
| Electricity | 832 (25.2%) | 383 (46.9%) |
| Fuel Oil or Kerosene | 0 (0.0%) | 0 (0.0%) |
| Coal or Coke | 0 (0.0%) | 0 (0.0%) |
| All other Fuels | 264 (8.0%) | 16 (2.0%) |
| No Fuel Used | 0 (0.0%) | 0 (0.0%) |
| Total | 3,296 (100.0%) | 816 (100.0%) |
Household Vehicle Usage in Butte County
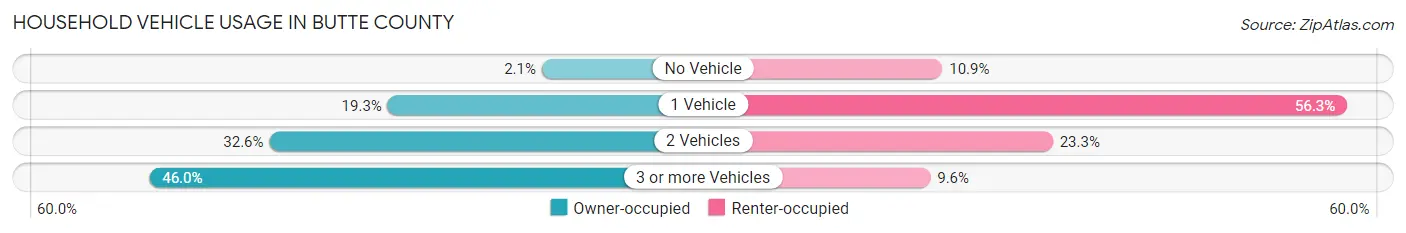
| Vehicles per Household | Owner-occupied | Renter-occupied |
| No Vehicle | 68 (2.1%) | 89 (10.9%) |
| 1 Vehicle | 637 (19.3%) | 459 (56.2%) |
| 2 Vehicles | 1,074 (32.6%) | 190 (23.3%) |
| 3 or more Vehicles | 1,517 (46.0%) | 78 (9.6%) |
| Total | 3,296 (100.0%) | 816 (100.0%) |
Real Estate & Mortgages in Butte County
Real Estate and Mortgage Overview in Butte County
| Characteristic | Without Mortgage | With Mortgage |
| Housing Units | 1,554 | 1,742 |
| Median Property Value | $122,300 | $239,000 |
| Median Household Income | $47,336 | $408 |
| Monthly Housing Costs | $566 | $86 |
| Real Estate Taxes | $1,592 | $20 |
Property Value by Mortgage Status in Butte County
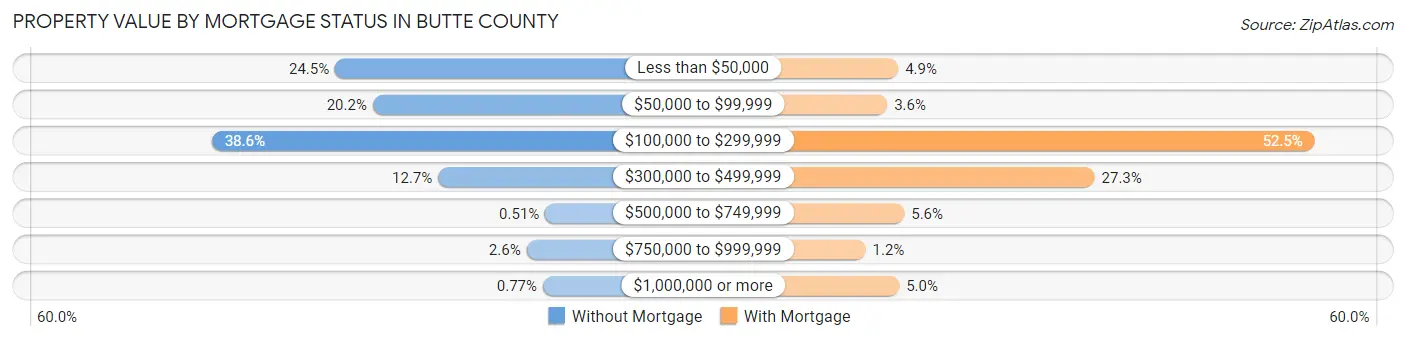
| Property Value | Without Mortgage | With Mortgage |
| Less than $50,000 | 381 (24.5%) | 85 (4.9%) |
| $50,000 to $99,999 | 314 (20.2%) | 63 (3.6%) |
| $100,000 to $299,999 | 600 (38.6%) | 914 (52.5%) |
| $300,000 to $499,999 | 198 (12.7%) | 476 (27.3%) |
| $500,000 to $749,999 | 8 (0.5%) | 97 (5.6%) |
| $750,000 to $999,999 | 41 (2.6%) | 20 (1.1%) |
| $1,000,000 or more | 12 (0.8%) | 87 (5.0%) |
| Total | 1,554 (100.0%) | 1,742 (100.0%) |
Household Income by Mortgage Status in Butte County
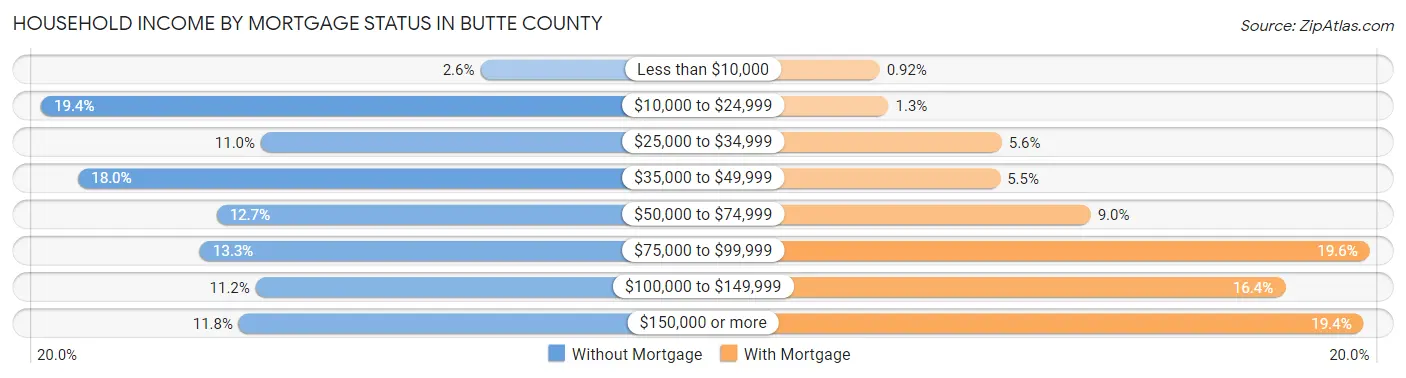
| Household Income | Without Mortgage | With Mortgage |
| Less than $10,000 | 41 (2.6%) | 16 (0.9%) |
| $10,000 to $24,999 | 301 (19.4%) | 22 (1.3%) |
| $25,000 to $34,999 | 171 (11.0%) | 97 (5.6%) |
| $35,000 to $49,999 | 279 (17.9%) | 96 (5.5%) |
| $50,000 to $74,999 | 197 (12.7%) | 156 (9.0%) |
| $75,000 to $99,999 | 207 (13.3%) | 341 (19.6%) |
| $100,000 to $149,999 | 174 (11.2%) | 285 (16.4%) |
| $150,000 or more | 184 (11.8%) | 337 (19.4%) |
| Total | 1,554 (100.0%) | 1,742 (100.0%) |
Property Value to Household Income Ratio in Butte County
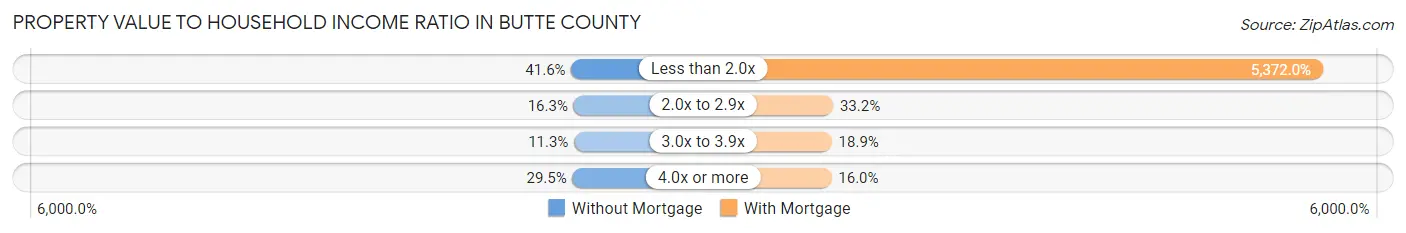
| Value-to-Income Ratio | Without Mortgage | With Mortgage |
| Less than 2.0x | 646 (41.6%) | 93,581 (5,372.0%) |
| 2.0x to 2.9x | 253 (16.3%) | 579 (33.2%) |
| 3.0x to 3.9x | 176 (11.3%) | 330 (18.9%) |
| 4.0x or more | 459 (29.5%) | 278 (16.0%) |
| Total | 1,554 (100.0%) | 1,742 (100.0%) |
Real Estate Taxes by Mortgage Status in Butte County
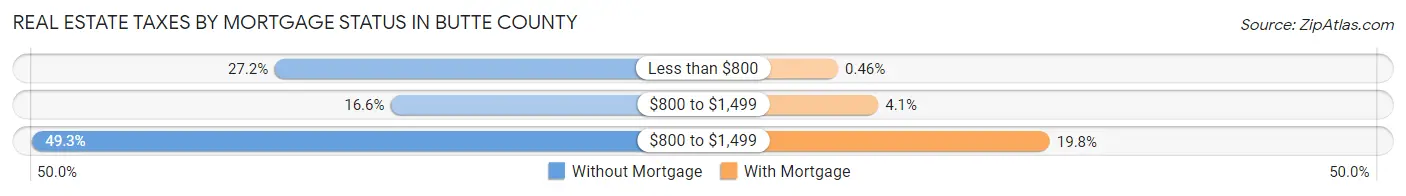
| Property Taxes | Without Mortgage | With Mortgage |
| Less than $800 | 423 (27.2%) | 8 (0.5%) |
| $800 to $1,499 | 258 (16.6%) | 72 (4.1%) |
| $800 to $1,499 | 766 (49.3%) | 345 (19.8%) |
| Total | 1,554 (100.0%) | 1,742 (100.0%) |
Health & Disability in Butte County
Health Insurance Coverage by Age in Butte County
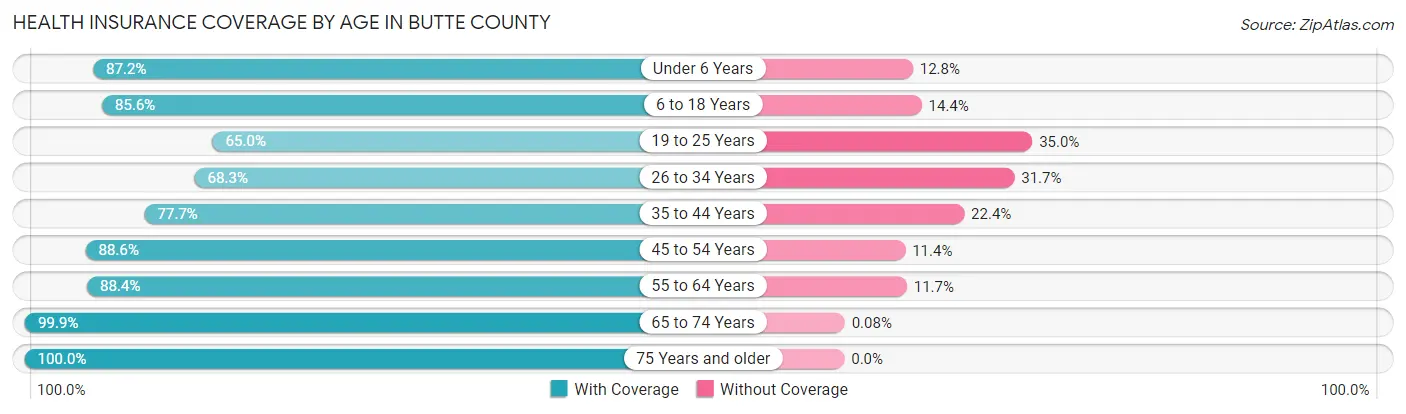
| Age Bracket | With Coverage | Without Coverage |
| Under 6 Years | 690 (87.2%) | 101 (12.8%) |
| 6 to 18 Years | 1,525 (85.6%) | 257 (14.4%) |
| 19 to 25 Years | 356 (65.0%) | 192 (35.0%) |
| 26 to 34 Years | 905 (68.3%) | 420 (31.7%) |
| 35 to 44 Years | 858 (77.6%) | 247 (22.4%) |
| 45 to 54 Years | 1,131 (88.6%) | 145 (11.4%) |
| 55 to 64 Years | 1,312 (88.3%) | 173 (11.7%) |
| 65 to 74 Years | 1,253 (99.9%) | 1 (0.1%) |
| 75 Years and older | 698 (100.0%) | 0 (0.0%) |
| Total | 8,728 (85.0%) | 1,536 (15.0%) |
Health Insurance Coverage by Citizenship Status in Butte County
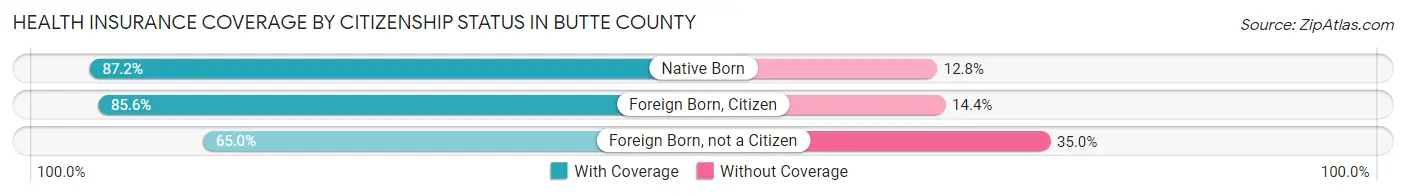
| Citizenship Status | With Coverage | Without Coverage |
| Native Born | 690 (87.2%) | 101 (12.8%) |
| Foreign Born, Citizen | 1,525 (85.6%) | 257 (14.4%) |
| Foreign Born, not a Citizen | 356 (65.0%) | 192 (35.0%) |
Health Insurance Coverage by Household Income in Butte County
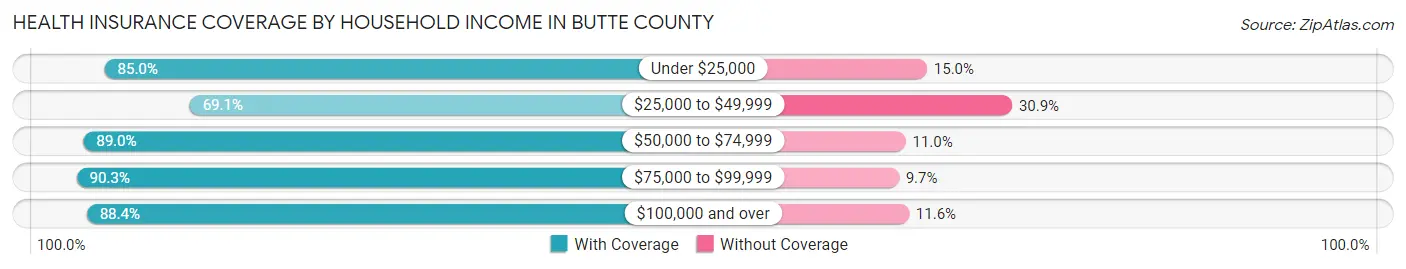
| Household Income | With Coverage | Without Coverage |
| Under $25,000 | 986 (85.0%) | 174 (15.0%) |
| $25,000 to $49,999 | 1,156 (69.1%) | 518 (30.9%) |
| $50,000 to $74,999 | 1,869 (89.0%) | 231 (11.0%) |
| $75,000 to $99,999 | 1,391 (90.3%) | 150 (9.7%) |
| $100,000 and over | 3,311 (88.4%) | 436 (11.6%) |
Public vs Private Health Insurance Coverage by Age in Butte County
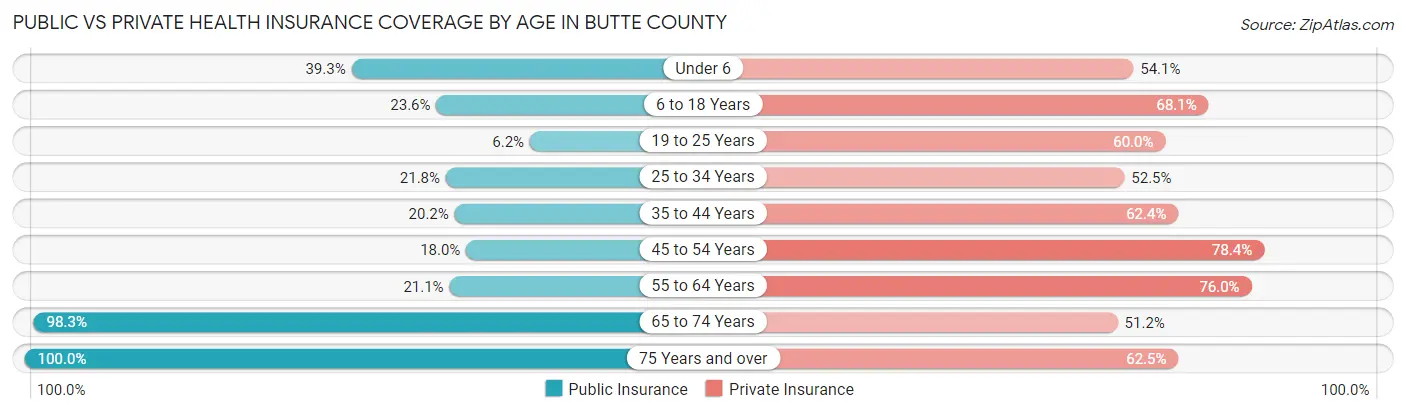
| Age Bracket | Public Insurance | Private Insurance |
| Under 6 | 311 (39.3%) | 428 (54.1%) |
| 6 to 18 Years | 420 (23.6%) | 1,213 (68.1%) |
| 19 to 25 Years | 34 (6.2%) | 329 (60.0%) |
| 25 to 34 Years | 289 (21.8%) | 695 (52.4%) |
| 35 to 44 Years | 223 (20.2%) | 690 (62.4%) |
| 45 to 54 Years | 230 (18.0%) | 1,000 (78.4%) |
| 55 to 64 Years | 314 (21.1%) | 1,129 (76.0%) |
| 65 to 74 Years | 1,233 (98.3%) | 642 (51.2%) |
| 75 Years and over | 698 (100.0%) | 436 (62.5%) |
| Total | 3,752 (36.5%) | 6,562 (63.9%) |
Disability Status by Sex by Age in Butte County
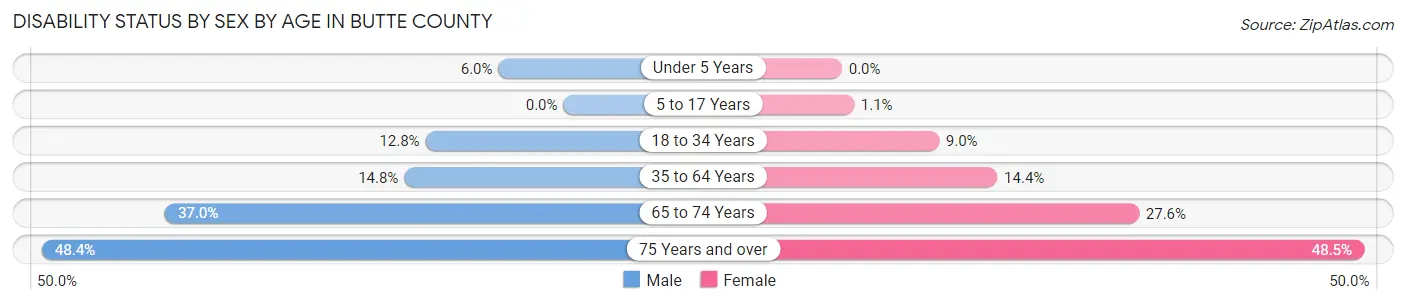
| Age Bracket | Male | Female |
| Under 5 Years | 19 (6.0%) | 0 (0.0%) |
| 5 to 17 Years | 0 (0.0%) | 11 (1.1%) |
| 18 to 34 Years | 134 (12.8%) | 88 (9.0%) |
| 35 to 64 Years | 280 (14.8%) | 284 (14.4%) |
| 65 to 74 Years | 237 (37.0%) | 169 (27.6%) |
| 75 Years and over | 150 (48.4%) | 188 (48.4%) |
Disability Class by Sex by Age in Butte County
Disability Class: Hearing Difficulty
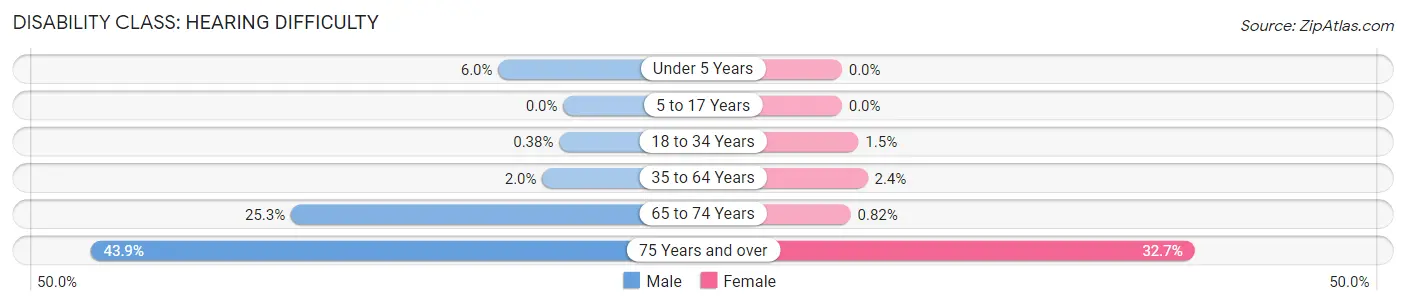
| Age Bracket | Male | Female |
| Under 5 Years | 19 (6.0%) | 0 (0.0%) |
| 5 to 17 Years | 0 (0.0%) | 0 (0.0%) |
| 18 to 34 Years | 4 (0.4%) | 15 (1.5%) |
| 35 to 64 Years | 37 (1.9%) | 47 (2.4%) |
| 65 to 74 Years | 162 (25.3%) | 5 (0.8%) |
| 75 Years and over | 136 (43.9%) | 127 (32.7%) |
Disability Class: Vision Difficulty
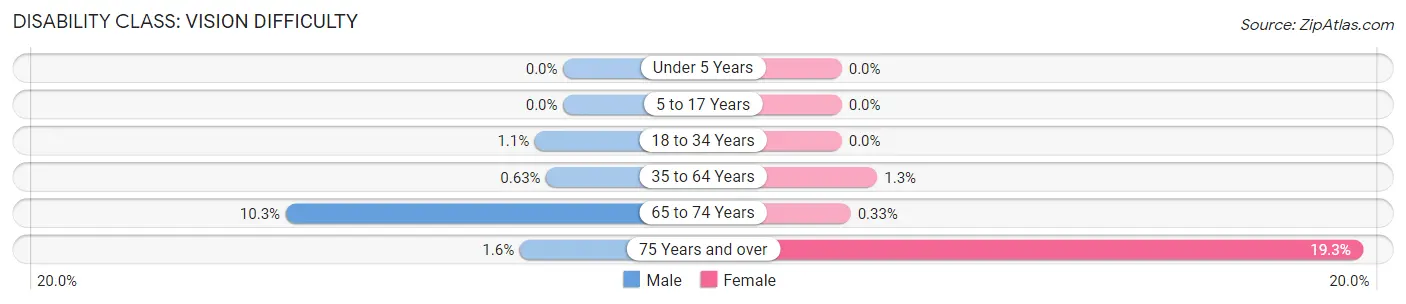
| Age Bracket | Male | Female |
| Under 5 Years | 0 (0.0%) | 0 (0.0%) |
| 5 to 17 Years | 0 (0.0%) | 0 (0.0%) |
| 18 to 34 Years | 11 (1.1%) | 0 (0.0%) |
| 35 to 64 Years | 12 (0.6%) | 26 (1.3%) |
| 65 to 74 Years | 66 (10.3%) | 2 (0.3%) |
| 75 Years and over | 5 (1.6%) | 75 (19.3%) |
Disability Class: Cognitive Difficulty
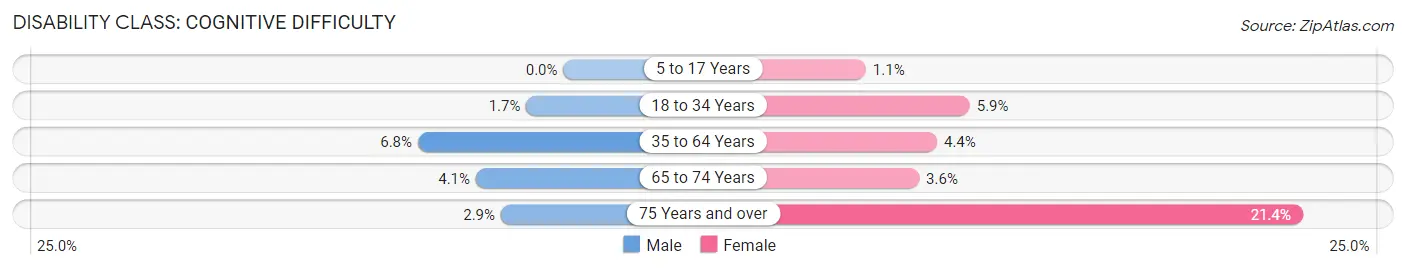
| Age Bracket | Male | Female |
| 5 to 17 Years | 0 (0.0%) | 11 (1.1%) |
| 18 to 34 Years | 18 (1.7%) | 58 (5.9%) |
| 35 to 64 Years | 128 (6.8%) | 87 (4.4%) |
| 65 to 74 Years | 26 (4.1%) | 22 (3.6%) |
| 75 Years and over | 9 (2.9%) | 83 (21.4%) |
Disability Class: Ambulatory Difficulty
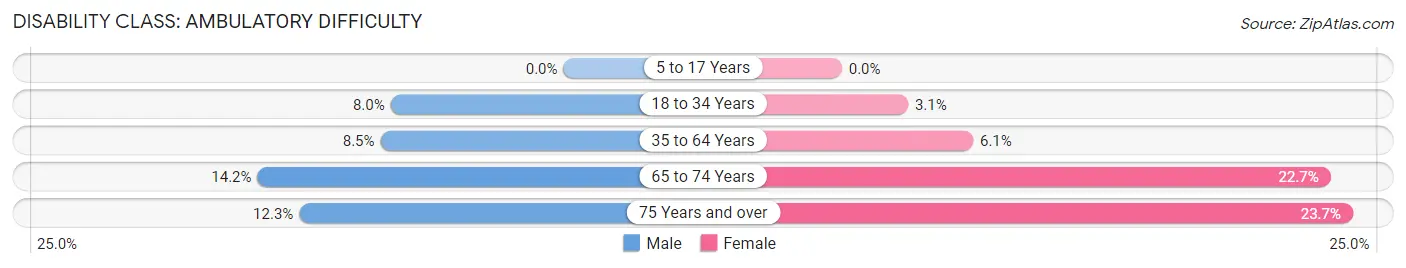
| Age Bracket | Male | Female |
| 5 to 17 Years | 0 (0.0%) | 0 (0.0%) |
| 18 to 34 Years | 84 (8.0%) | 30 (3.1%) |
| 35 to 64 Years | 161 (8.5%) | 120 (6.1%) |
| 65 to 74 Years | 91 (14.2%) | 139 (22.7%) |
| 75 Years and over | 38 (12.3%) | 92 (23.7%) |
Disability Class: Self-Care Difficulty
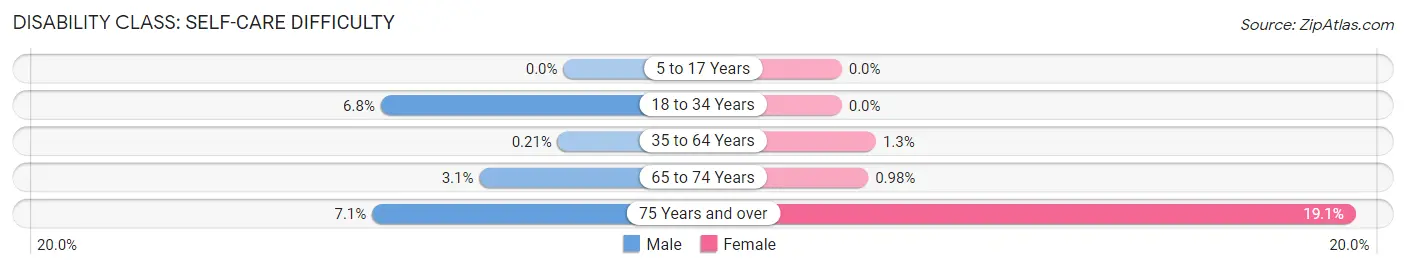
| Age Bracket | Male | Female |
| 5 to 17 Years | 0 (0.0%) | 0 (0.0%) |
| 18 to 34 Years | 71 (6.8%) | 0 (0.0%) |
| 35 to 64 Years | 4 (0.2%) | 25 (1.3%) |
| 65 to 74 Years | 20 (3.1%) | 6 (1.0%) |
| 75 Years and over | 22 (7.1%) | 74 (19.1%) |
Technology Access in Butte County
Computing Device Access in Butte County
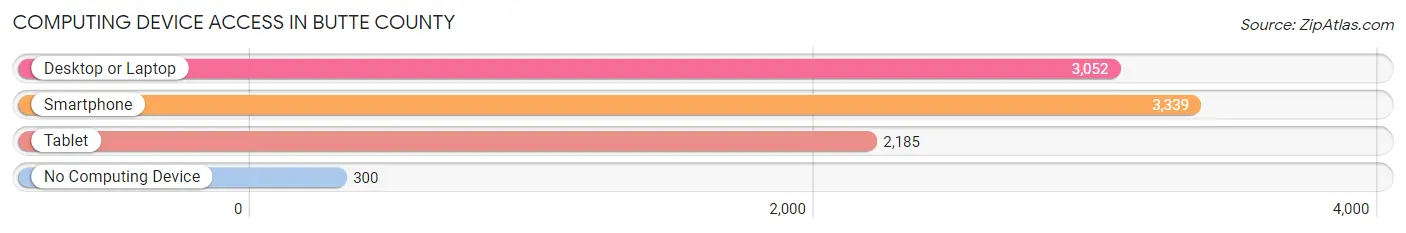
| Device Type | # Households | % Households |
| Desktop or Laptop | 3,052 | 74.2% |
| Smartphone | 3,339 | 81.2% |
| Tablet | 2,185 | 53.1% |
| No Computing Device | 300 | 7.3% |
| Total | 4,112 | 100.0% |
Internet Access in Butte County
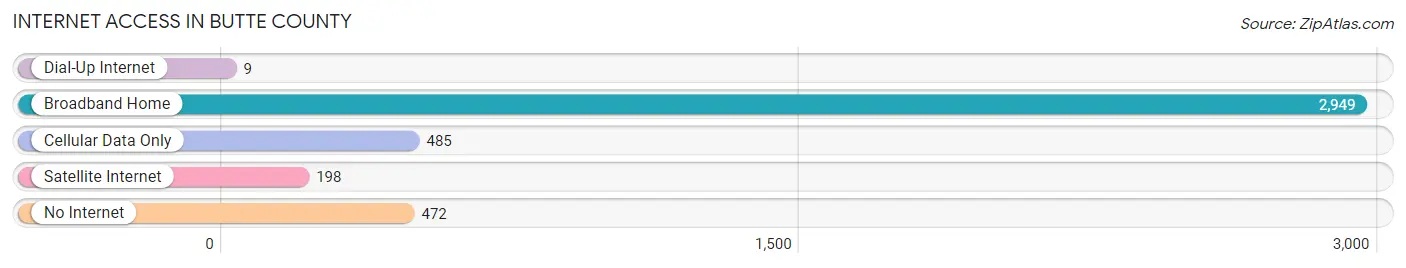
| Internet Type | # Households | % Households |
| Dial-Up Internet | 9 | 0.2% |
| Broadband Home | 2,949 | 71.7% |
| Cellular Data Only | 485 | 11.8% |
| Satellite Internet | 198 | 4.8% |
| No Internet | 472 | 11.5% |
| Total | 4,112 | 100.0% |
Butte County Summary
Butte County is located in the western part of South Dakota, and is bordered by Lawrence County to the north, Meade County to the east, Pennington County to the south, and Harding County to the west. The county seat is Belle Fourche, and the county has a total area of 1,845 square miles.
History
Butte County was established in 1883, and was named after the nearby Butte Creek. The county was originally part of the Dakota Territory, and was part of the original Cheyenne River Indian Reservation. The county was created in order to provide a local government for the area, and to provide services to the settlers who had begun to move into the area.
The first settlers in the area were ranchers, who were attracted to the area by the abundance of grass and water. The first town in the county was Belle Fourche, which was established in 1883. The town quickly grew, and by the early 1900s it had become the largest town in the county.
Geography
Butte County is located in the western part of South Dakota, and is bordered by Lawrence County to the north, Meade County to the east, Pennington County to the south, and Harding County to the west. The county has a total area of 1,845 square miles, and is mostly covered by prairie grasslands. The county is home to several small lakes, including Lake Belle Fourche, which is the largest lake in the county.
The county is located in the Missouri Plateau region of the Great Plains, and is characterized by rolling hills and flat plains. The county is home to several small streams, including Butte Creek, which is the largest stream in the county.
Economy
Butte County has a diverse economy, with the largest industries being agriculture, tourism, and manufacturing. Agriculture is the largest industry in the county, and is responsible for the majority of the county’s economic activity. The county is home to several large farms, and is a major producer of wheat, corn, and other grains.
Tourism is also an important part of the county’s economy, and the county is home to several popular tourist attractions, including the Belle Fourche River, the Black Hills National Forest, and the Badlands National Park. The county is also home to several popular ski resorts, and is a popular destination for outdoor recreation.
Manufacturing is also an important part of the county’s economy, and the county is home to several large manufacturing companies, including the Belle Fourche Manufacturing Company, which produces a variety of products, including furniture, clothing, and automotive parts.
Demographics
As of the 2010 census, Butte County had a population of 10,845. The population is spread out over an area of 1,845 square miles, giving the county a population density of 5.9 people per square mile. The racial makeup of the county is 95.3% White, 0.7% Native American, 0.3% Asian, 0.2% Black or African American, 0.1% Pacific Islander, and 2.4% from two or more races.
The median income for a household in the county is $41,945, and the median income for a family is $50,945. The per capita income for the county is $20,945. The unemployment rate in the county is 4.2%, and the poverty rate is 11.3%.
Common Questions
What is the Total Population of Butte County?
Total Population of Butte County is 10,369.
What is the Total Male Population of Butte County?
Total Male Population of Butte County is 5,092.
What is the Total Female Population of Butte County?
Total Female Population of Butte County is 5,277.
What is the Ratio of Males per 100 Females in Butte County?
There are 96.49 Males per 100 Females in Butte County.
What is the Ratio of Females per 100 Males in Butte County?
There are 103.63 Females per 100 Males in Butte County.
What is the Median Population Age in Butte County?
Median Population Age in Butte County is 40.3 Years.
What is the Average Family Size in Butte County
Average Family Size in Butte County is 3.0 People.
What is the Average Household Size in Butte County
Average Household Size in Butte County is 2.5 People.
What is Per Capita Income in Butte County?
Per Capita income in Butte County is $34,218.
What is the Median Family Income in Butte County?
Median Family Income in Butte County is $80,701.
What is the Median Household income in Butte County?
Median Household Income in Butte County is $58,106.
What is Income or Wage Gap in Butte County?
Income or Wage Gap in Butte County is 45.3%.
Women in Butte County earn 54.7 cents for every dollar earned by a man.
What is Inequality or Gini Index in Butte County?
Inequality or Gini Index in Butte County is 0.47.
How Large is the Labor Force in Butte County?
There are 5,425 People in the Labor Forcein in Butte County.
What is the Percentage of People in the Labor Force in Butte County?
65.8% of People are in the Labor Force in Butte County.
What is the Unemployment Rate in Butte County?
Unemployment Rate in Butte County is 5.8%.