Buffalo County, SD
Buffalo County Map

Buffalo County Overview
1,859
TOTAL POPULATION
992
MALE POPULATION
867
FEMALE POPULATION
114.42
MALES / 100 FEMALES
87.40
FEMALES / 100 MALES
24.0
MEDIAN AGE
4.7
AVG FAMILY SIZE
3.8
AVG HOUSEHOLD SIZE
$13,731
PER CAPITA INCOME
$44,297
AVG FAMILY INCOME
$42,917
AVG HOUSEHOLD INCOME
6.4%
WAGE / INCOME GAP [ % ]
93.6¢/ $1
WAGE / INCOME GAP [ $ ]
$18,844
FAMILY INCOME DEFICIT
0.47
INEQUALITY / GINI INDEX
696
LABOR FORCE [ PEOPLE ]
56.0%
PERCENT IN LABOR FORCE
14.9%
UNEMPLOYMENT RATE
Buffalo County Area Codes
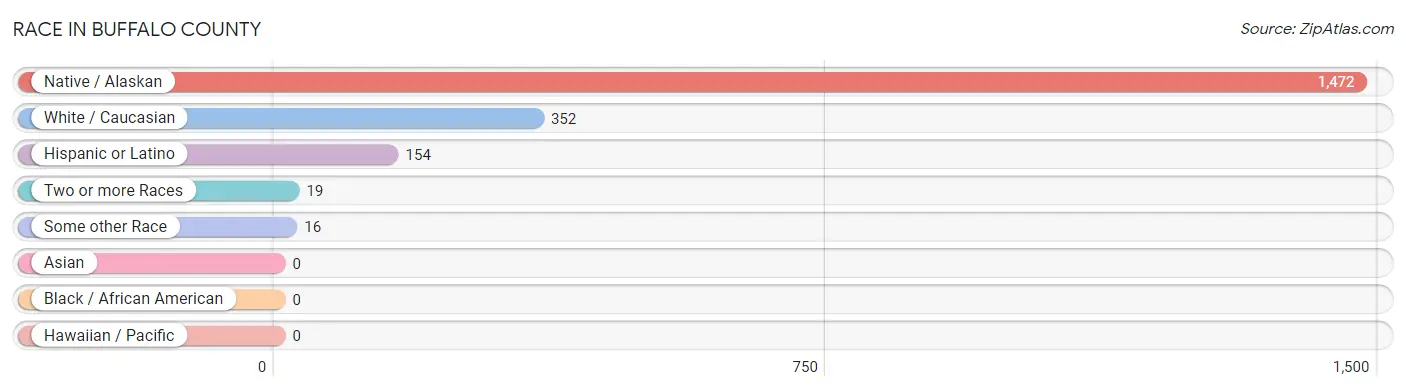
Race in Buffalo County
The most populous races in Buffalo County are Native / Alaskan (1,472 | 79.2%), White / Caucasian (352 | 18.9%), and Hispanic or Latino (154 | 8.3%).
| Race | # Population | % Population |
| Asian | 0 | 0.0% |
| Black / African American | 0 | 0.0% |
| Hawaiian / Pacific | 0 | 0.0% |
| Hispanic or Latino | 154 | 8.3% |
| Native / Alaskan | 1,472 | 79.2% |
| White / Caucasian | 352 | 18.9% |
| Two or more Races | 19 | 1.0% |
| Some other Race | 16 | 0.9% |
| Total | 1,859 | 100.0% |
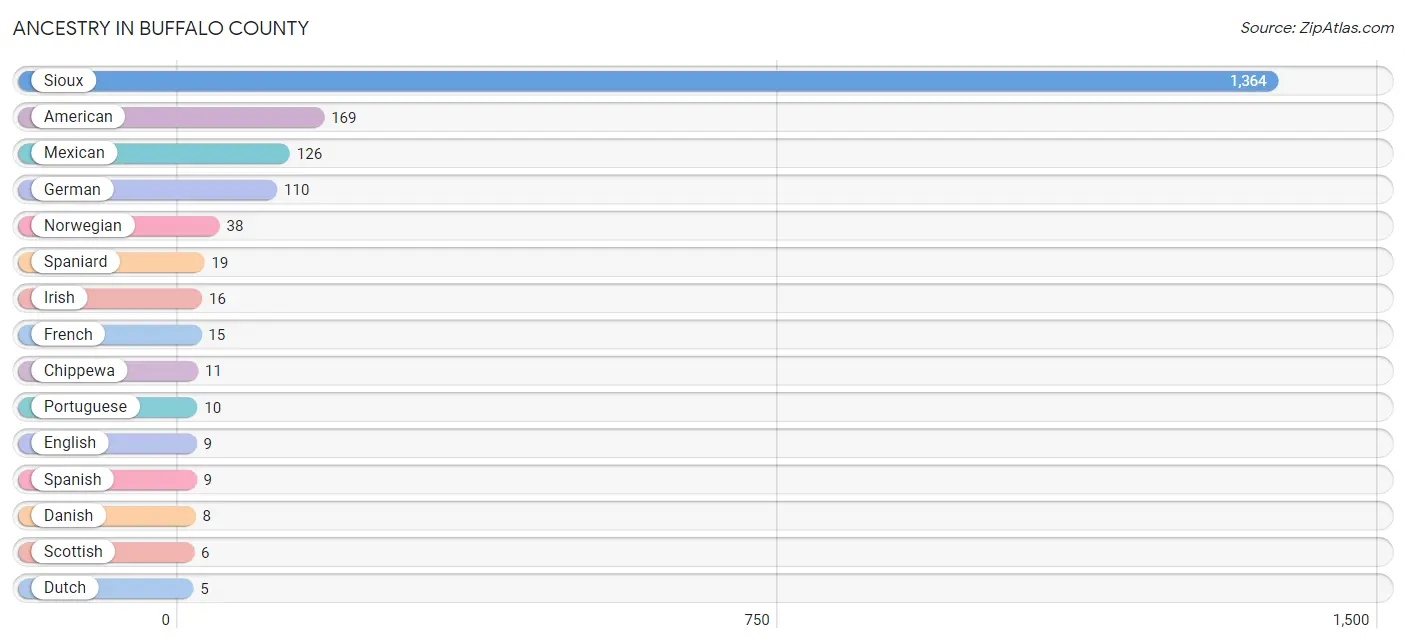
Ancestry in Buffalo County
The most populous ancestries reported in Buffalo County are Sioux (1,364 | 73.4%), American (169 | 9.1%), Mexican (126 | 6.8%), German (110 | 5.9%), and Norwegian (38 | 2.0%), together accounting for 97.2% of all Buffalo County residents.
| Ancestry | # Population | % Population |
| American | 169 | 9.1% |
| Chippewa | 11 | 0.6% |
| Creek | 2 | 0.1% |
| Czech | 2 | 0.1% |
| Danish | 8 | 0.4% |
| Dutch | 5 | 0.3% |
| English | 9 | 0.5% |
| French | 15 | 0.8% |
| German | 110 | 5.9% |
| Irish | 16 | 0.9% |
| Italian | 1 | 0.1% |
| Mexican | 126 | 6.8% |
| Norwegian | 38 | 2.0% |
| Portuguese | 10 | 0.5% |
| Romanian | 1 | 0.1% |
| Scandinavian | 3 | 0.2% |
| Scotch-Irish | 2 | 0.1% |
| Scottish | 6 | 0.3% |
| Sioux | 1,364 | 73.4% |
| Spaniard | 19 | 1.0% |
| Spanish | 9 | 0.5% |
| Welsh | 2 | 0.1% | View All 22 Rows |
Immigrants in Buffalo County

| Immigration Origin | # Population | % Population | View All 0 Rows |
Sex and Age in Buffalo County
Sex and Age in Buffalo County
The most populous age groups in Buffalo County are Under 5 Years (136 | 13.7%) for men and Under 5 Years (99 | 11.4%) for women.

| Age Bracket | Male | Female |
| Under 5 Years | 136 (13.7%) | 99 (11.4%) |
| 5 to 9 Years | 70 (7.1%) | 90 (10.4%) |
| 10 to 14 Years | 98 (9.9%) | 72 (8.3%) |
| 15 to 19 Years | 125 (12.6%) | 96 (11.1%) |
| 20 to 24 Years | 71 (7.2%) | 91 (10.5%) |
| 25 to 29 Years | 50 (5.0%) | 63 (7.3%) |
| 30 to 34 Years | 60 (6.0%) | 44 (5.1%) |
| 35 to 39 Years | 37 (3.7%) | 31 (3.6%) |
| 40 to 44 Years | 67 (6.8%) | 83 (9.6%) |
| 45 to 49 Years | 51 (5.1%) | 15 (1.7%) |
| 50 to 54 Years | 41 (4.1%) | 48 (5.5%) |
| 55 to 59 Years | 47 (4.7%) | 30 (3.5%) |
| 60 to 64 Years | 52 (5.2%) | 52 (6.0%) |
| 65 to 69 Years | 28 (2.8%) | 30 (3.5%) |
| 70 to 74 Years | 19 (1.9%) | 10 (1.1%) |
| 75 to 79 Years | 26 (2.6%) | 4 (0.5%) |
| 80 to 84 Years | 9 (0.9%) | 6 (0.7%) |
| 85 Years and over | 5 (0.5%) | 3 (0.4%) |
| Total | 992 (100.0%) | 867 (100.0%) |
Families and Households in Buffalo County
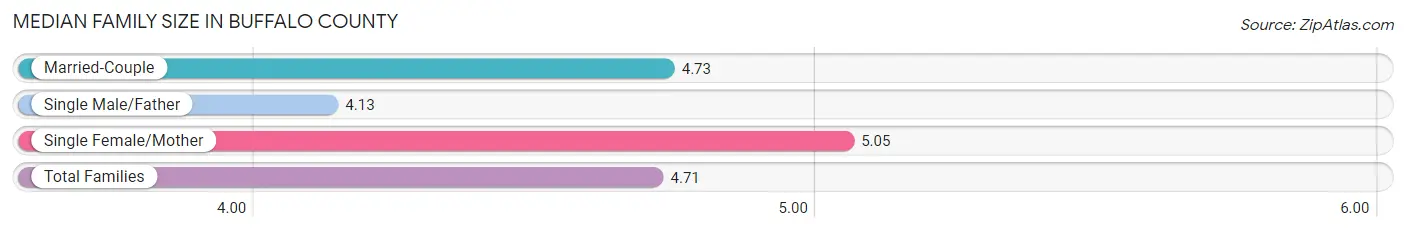
Median Family Size in Buffalo County
The median family size in Buffalo County is 4.71 persons per family, with single female/mother families (117 | 35.3%) accounting for the largest median family size of 5.05 persons per family. On the other hand, single male/father families (72 | 21.7%) represent the smallest median family size with 4.13 persons per family.
| Family Type | # Families | Family Size |
| Married-Couple | 142 (42.9%) | 4.73 |
| Single Male/Father | 72 (21.7%) | 4.13 |
| Single Female/Mother | 117 (35.3%) | 5.05 |
| Total Families | 331 (100.0%) | 4.71 |
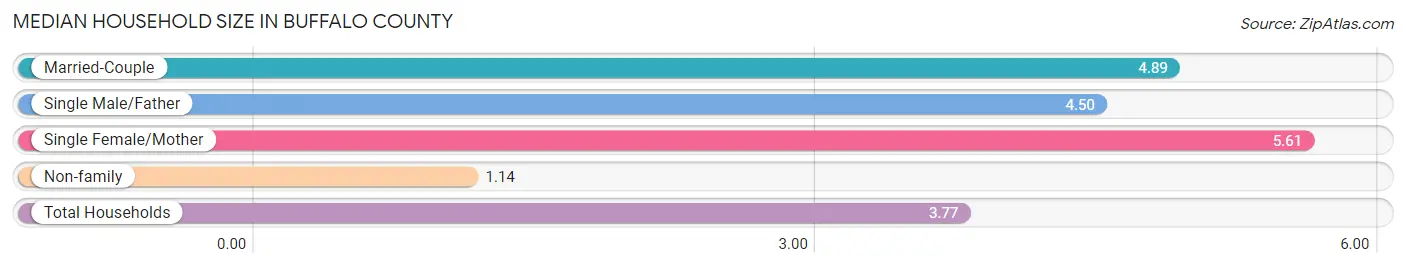
Median Household Size in Buffalo County
The median household size in Buffalo County is 3.77 persons per household, with single female/mother households (117 | 23.8%) accounting for the largest median household size of 5.61 persons per household. non-family households (161 | 32.7%) represent the smallest median household size with 1.14 persons per household.
| Household Type | # Households | Household Size |
| Married-Couple | 142 (28.9%) | 4.89 |
| Single Male/Father | 72 (14.6%) | 4.50 |
| Single Female/Mother | 117 (23.8%) | 5.61 |
| Non-family | 161 (32.7%) | 1.14 |
| Total Households | 492 (100.0%) | 3.77 |
Household Size by Marriage Status in Buffalo County
Out of a total of 492 households in Buffalo County, 331 (67.3%) are family households, while 161 (32.7%) are nonfamily households. The most numerous type of family households are 3-person households, comprising 79, and the most common type of nonfamily households are 1-person households, comprising 140.
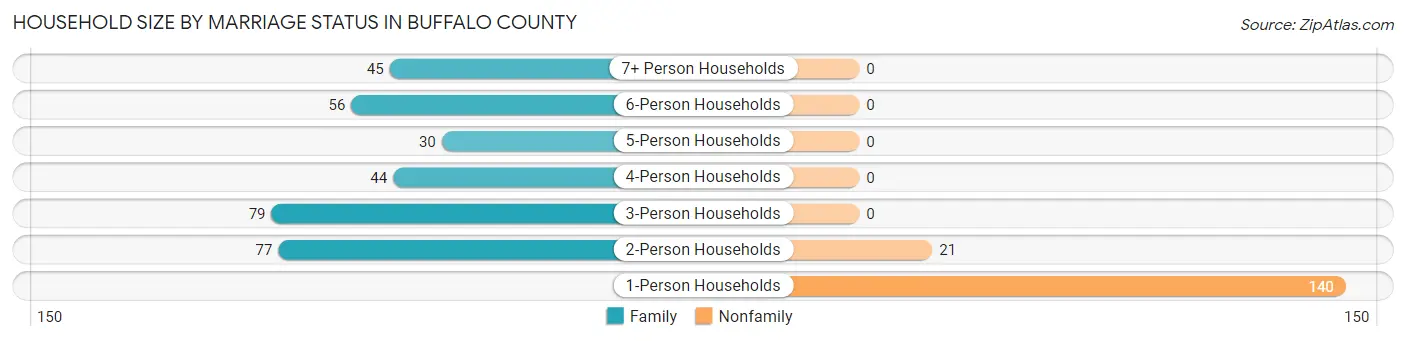
| Household Size | Family Households | Nonfamily Households |
| 1-Person Households | - | 140 (28.5%) |
| 2-Person Households | 77 (15.7%) | 21 (4.3%) |
| 3-Person Households | 79 (16.1%) | 0 (0.0%) |
| 4-Person Households | 44 (8.9%) | 0 (0.0%) |
| 5-Person Households | 30 (6.1%) | 0 (0.0%) |
| 6-Person Households | 56 (11.4%) | 0 (0.0%) |
| 7+ Person Households | 45 (9.1%) | 0 (0.0%) |
| Total | 331 (67.3%) | 161 (32.7%) |
Female Fertility in Buffalo County
Fertility by Age in Buffalo County
Average fertility rate in Buffalo County is 82.0 births per 1,000 women. Women in the age bracket of 20 to 34 years have the highest fertility rate with 182.0 births per 1,000 women. Women in the age bracket of 20 to 34 years acount for 100.0% of all women with births.

| Age Bracket | Women with Births | Births / 1,000 Women |
| 15 to 19 years | 0 (0.0%) | 0.0 |
| 20 to 34 years | 36 (100.0%) | 182.0 |
| 35 to 50 years | 0 (0.0%) | 0.0 |
| Total | 36 (100.0%) | 82.0 |
Fertility by Age by Marriage Status in Buffalo County
27.8% of women with births (36) in Buffalo County are married. The highest percentage of unmarried women with births falls into 20 to 34 years age bracket with 72.2% of them unmarried at the time of birth, while the lowest percentage of unmarried women with births belong to 20 to 34 years age bracket with 72.2% of them unmarried.

| Age Bracket | Married | Unmarried |
| 15 to 19 years | 0 (0.0%) | 0 (0.0%) |
| 20 to 34 years | 10 (27.8%) | 26 (72.2%) |
| 35 to 50 years | 0 (0.0%) | 0 (0.0%) |
| Total | 10 (27.8%) | 26 (72.2%) |
Fertility by Education in Buffalo County
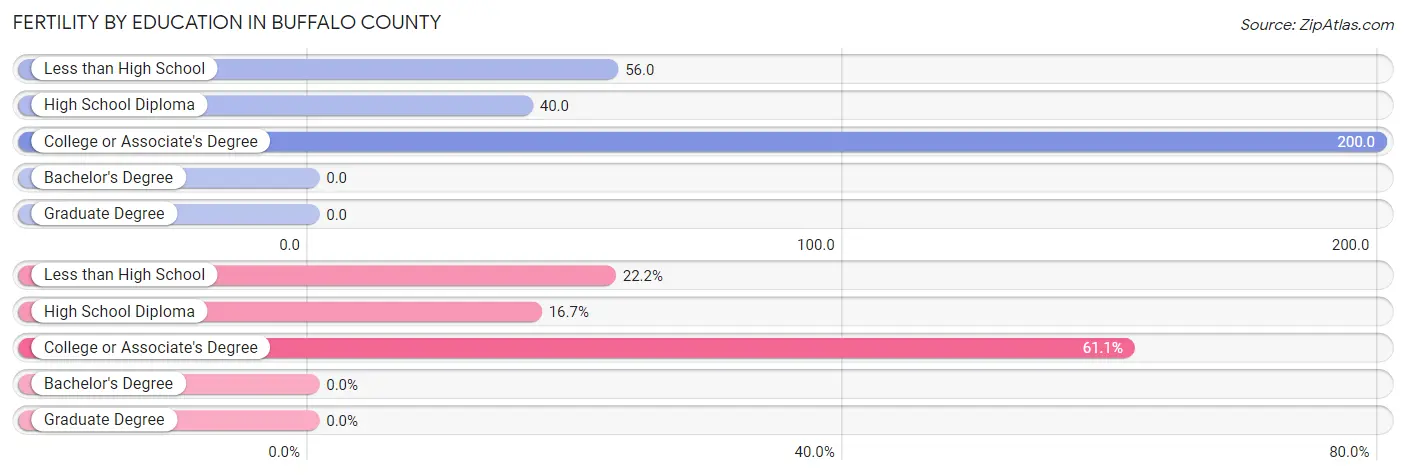
| Educational Attainment | Women with Births | Births / 1,000 Women |
| Less than High School | 8 (22.2%) | 56.0 |
| High School Diploma | 6 (16.7%) | 40.0 |
| College or Associate's Degree | 22 (61.1%) | 200.0 |
| Bachelor's Degree | 0 (0.0%) | 0.0 |
| Graduate Degree | 0 (0.0%) | 0.0 |
| Total | 36 (100.0%) | 82.0 |
Fertility by Education by Marriage Status in Buffalo County
72.2% of women with births in Buffalo County are unmarried. Women with the educational attainment of high school diploma are most likely to be married with 50.0% of them married at childbirth, while women with the educational attainment of less than high school are least likely to be married with 100.0% of them unmarried at childbirth.

| Educational Attainment | Married | Unmarried |
| Less than High School | 0 (0.0%) | 8 (100.0%) |
| High School Diploma | 3 (50.0%) | 3 (50.0%) |
| College or Associate's Degree | 7 (31.8%) | 15 (68.2%) |
| Bachelor's Degree | 0 (0.0%) | 0 (0.0%) |
| Graduate Degree | 0 (0.0%) | 0 (0.0%) |
| Total | 10 (27.8%) | 26 (72.2%) |
Income in Buffalo County
Income Overview in Buffalo County
Per Capita Income in Buffalo County is $13,731, while median incomes of families and households are $44,297 and $42,917 respectively.
| Characteristic | Number | Measure |
| Per Capita Income | 1,859 | $13,731 |
| Median Family Income | 331 | $44,297 |
| Mean Family Income | 331 | $50,581 |
| Median Household Income | 492 | $42,917 |
| Mean Household Income | 492 | $46,912 |
| Income Deficit | 331 | $18,844 |
| Wage / Income Gap (%) | 1,859 | 6.44% |
| Wage / Income Gap ($) | 1,859 | 93.56¢ per $1 |
| Gini / Inequality Index | 1,859 | 0.47 |
Earnings by Sex in Buffalo County
Average Earnings in Buffalo County are $20,833, $19,881 for men and $21,250 for women, a difference of 6.4%.

| Sex | Number | Average Earnings |
| Male | 402 (55.4%) | $19,881 |
| Female | 324 (44.6%) | $21,250 |
| Total | 726 (100.0%) | $20,833 |
Earnings by Sex by Income Bracket in Buffalo County
The most common earnings brackets in Buffalo County are $30,000 to $34,999 for men (57 | 14.2%) and $2,500 to $4,999 for women (52 | 16.1%).
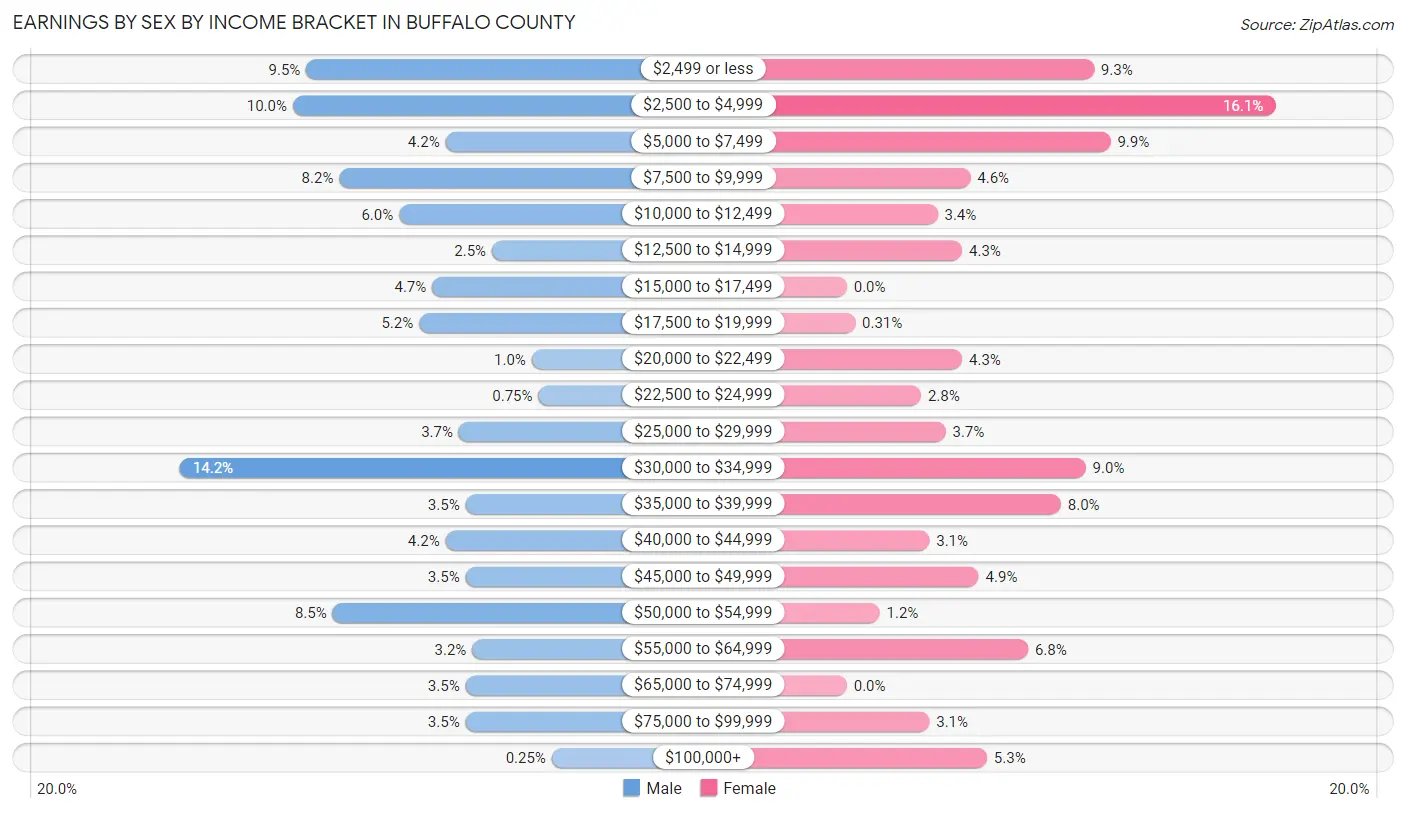
| Income | Male | Female |
| $2,499 or less | 38 (9.5%) | 30 (9.3%) |
| $2,500 to $4,999 | 40 (10.0%) | 52 (16.1%) |
| $5,000 to $7,499 | 17 (4.2%) | 32 (9.9%) |
| $7,500 to $9,999 | 33 (8.2%) | 15 (4.6%) |
| $10,000 to $12,499 | 24 (6.0%) | 11 (3.4%) |
| $12,500 to $14,999 | 10 (2.5%) | 14 (4.3%) |
| $15,000 to $17,499 | 19 (4.7%) | 0 (0.0%) |
| $17,500 to $19,999 | 21 (5.2%) | 1 (0.3%) |
| $20,000 to $22,499 | 4 (1.0%) | 14 (4.3%) |
| $22,500 to $24,999 | 3 (0.7%) | 9 (2.8%) |
| $25,000 to $29,999 | 15 (3.7%) | 12 (3.7%) |
| $30,000 to $34,999 | 57 (14.2%) | 29 (8.9%) |
| $35,000 to $39,999 | 14 (3.5%) | 26 (8.0%) |
| $40,000 to $44,999 | 17 (4.2%) | 10 (3.1%) |
| $45,000 to $49,999 | 14 (3.5%) | 16 (4.9%) |
| $50,000 to $54,999 | 34 (8.5%) | 4 (1.2%) |
| $55,000 to $64,999 | 13 (3.2%) | 22 (6.8%) |
| $65,000 to $74,999 | 14 (3.5%) | 0 (0.0%) |
| $75,000 to $99,999 | 14 (3.5%) | 10 (3.1%) |
| $100,000+ | 1 (0.3%) | 17 (5.2%) |
| Total | 402 (100.0%) | 324 (100.0%) |
Earnings by Sex by Educational Attainment in Buffalo County
Average earnings in Buffalo County are $32,703 for men and $26,750 for women, a difference of 18.2%. Men with an educational attainment of bachelor's degree enjoy the highest average annual earnings of $39,643, while those with high school diploma education earn the least with $29,107. Women with an educational attainment of graduate degree earn the most with the average annual earnings of $109,125, while those with high school diploma education have the smallest earnings of $26,375.

| Educational Attainment | Male Income | Female Income |
| Less than High School | - | - |
| High School Diploma | $29,107 | $26,375 |
| College or Associate's Degree | $33,056 | $33,523 |
| Bachelor's Degree | $39,643 | $40,417 |
| Graduate Degree | - | - |
| Total | $32,703 | $26,750 |
Family Income in Buffalo County
Family Income Brackets in Buffalo County
According to the Buffalo County family income data, there are 70 families falling into the $50,000 to $74,999 income range, which is the most common income bracket and makes up 21.1% of all families.
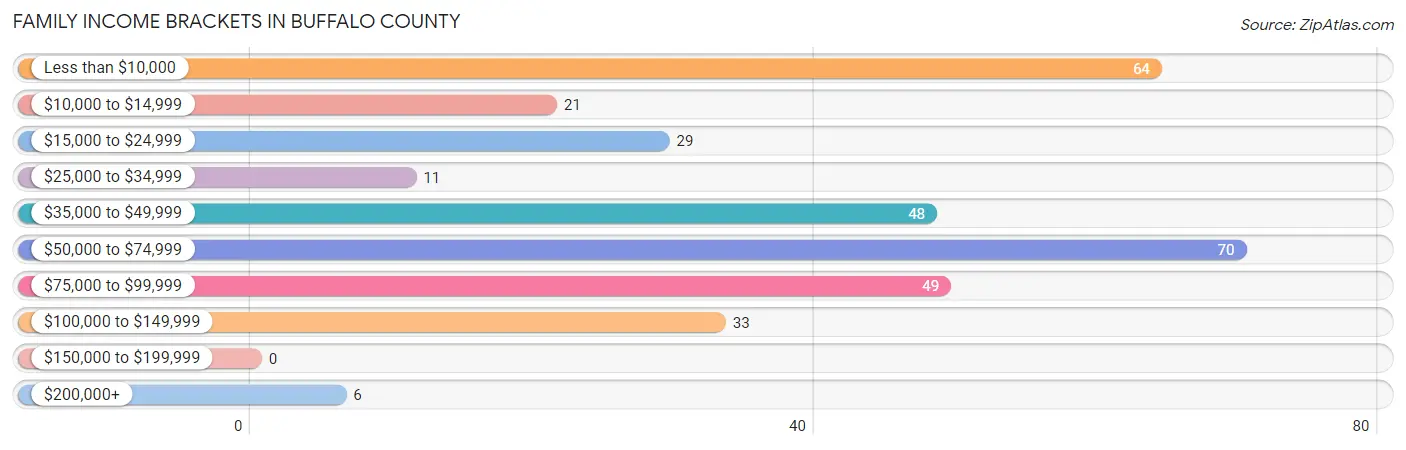
| Income Bracket | # Families | % Families |
| Less than $10,000 | 64 | 19.3% |
| $10,000 to $14,999 | 21 | 6.3% |
| $15,000 to $24,999 | 29 | 8.8% |
| $25,000 to $34,999 | 11 | 3.3% |
| $35,000 to $49,999 | 48 | 14.5% |
| $50,000 to $74,999 | 70 | 21.1% |
| $75,000 to $99,999 | 49 | 14.8% |
| $100,000 to $149,999 | 33 | 10.0% |
| $150,000 to $199,999 | 0 | 0.0% |
| $200,000+ | 6 | 1.8% |
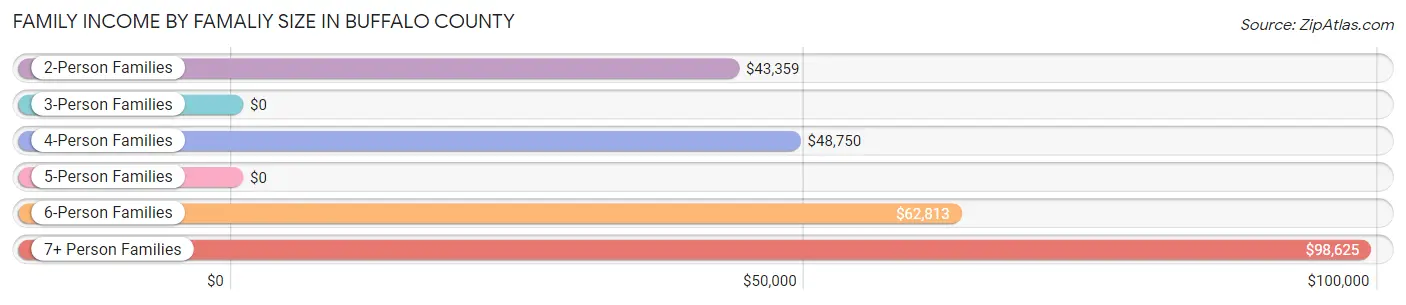
Family Income by Famaliy Size in Buffalo County
7+ person families (27 | 8.2%) account for the highest median family income in Buffalo County with $98,625 per family, while 2-person families (83 | 25.1%) have the highest median income of $21,680 per family member.
| Income Bracket | # Families | Median Income |
| 2-Person Families | 83 (25.1%) | $43,359 |
| 3-Person Families | 85 (25.7%) | $0 |
| 4-Person Families | 40 (12.1%) | $48,750 |
| 5-Person Families | 36 (10.9%) | $0 |
| 6-Person Families | 60 (18.1%) | $62,813 |
| 7+ Person Families | 27 (8.2%) | $98,625 |
| Total | 331 (100.0%) | $44,297 |
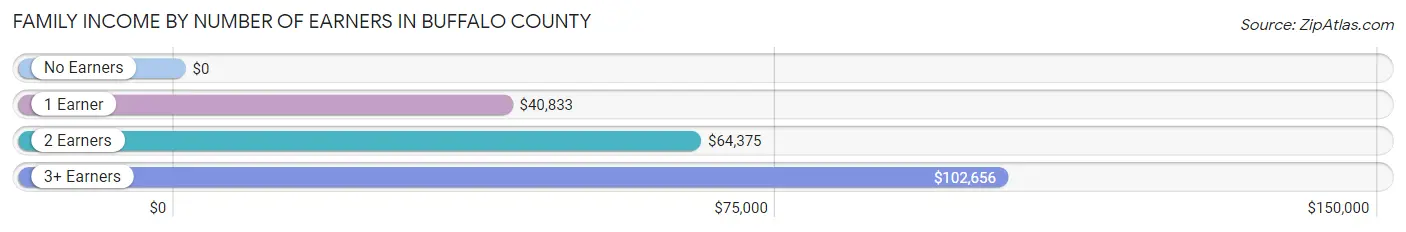
Family Income by Number of Earners in Buffalo County
| Number of Earners | # Families | Median Income |
| No Earners | 74 (22.4%) | $0 |
| 1 Earner | 100 (30.2%) | $40,833 |
| 2 Earners | 114 (34.4%) | $64,375 |
| 3+ Earners | 43 (13.0%) | $102,656 |
| Total | 331 (100.0%) | $44,297 |
Household Income in Buffalo County
Household Income Brackets in Buffalo County
With 101 households falling in the category, the $50,000 to $74,999 income range is the most frequent in Buffalo County, accounting for 20.5% of all households. In contrast, only 3 households (0.6%) fall into the $150,000 to $199,999 income bracket, making it the least populous group.

| Income Bracket | # Households | % Households |
| Less than $10,000 | 100 | 20.3% |
| $10,000 to $14,999 | 46 | 9.3% |
| $15,000 to $24,999 | 53 | 10.8% |
| $25,000 to $34,999 | 15 | 3.0% |
| $35,000 to $49,999 | 68 | 13.8% |
| $50,000 to $74,999 | 101 | 20.5% |
| $75,000 to $99,999 | 57 | 11.6% |
| $100,000 to $149,999 | 43 | 8.7% |
| $150,000 to $199,999 | 3 | 0.6% |
| $200,000+ | 6 | 1.2% |
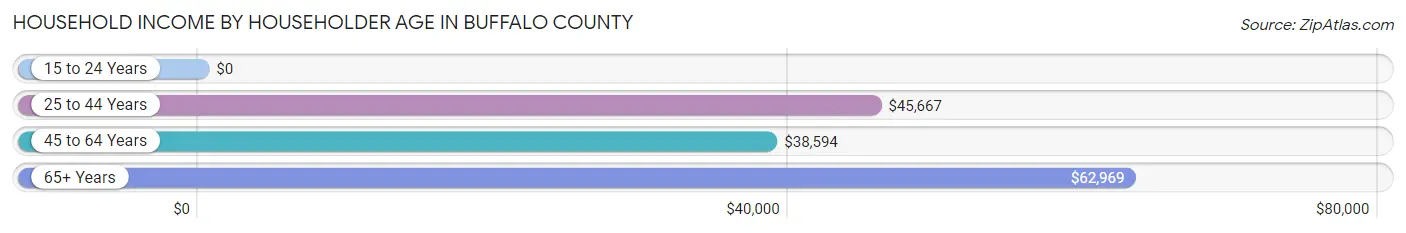
Household Income by Householder Age in Buffalo County
The median household income in Buffalo County is $42,917, with the highest median household income of $62,969 found in the 65+ years age bracket for the primary householder. A total of 104 households (21.1%) fall into this category. Meanwhile, the 15 to 24 years age bracket for the primary householder has the lowest median household income of $0, with 13 households (2.6%) in this group.
| Income Bracket | # Households | Median Income |
| 15 to 24 Years | 13 (2.6%) | $0 |
| 25 to 44 Years | 178 (36.2%) | $45,667 |
| 45 to 64 Years | 197 (40.0%) | $38,594 |
| 65+ Years | 104 (21.1%) | $62,969 |
| Total | 492 (100.0%) | $42,917 |
Poverty in Buffalo County
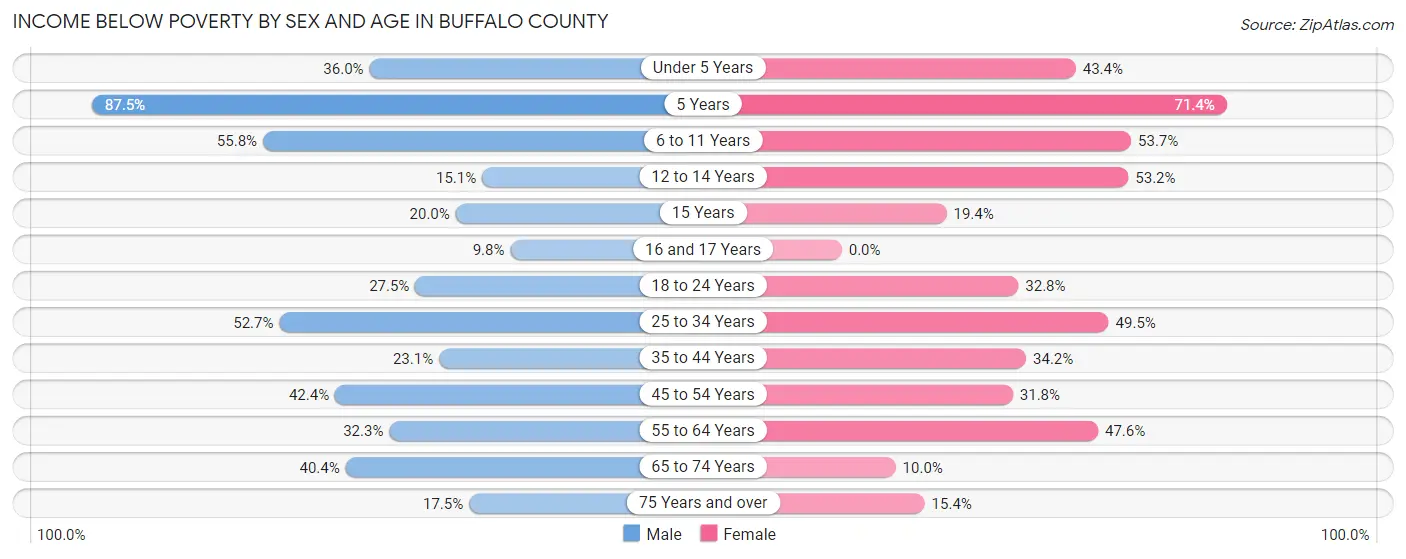
Income Below Poverty by Sex and Age in Buffalo County
With 34.7% poverty level for males and 38.6% for females among the residents of Buffalo County, 5 year old males and 5 year old females are the most vulnerable to poverty, with 7 males (87.5%) and 5 females (71.4%) in their respective age groups living below the poverty level.
| Age Bracket | Male | Female |
| Under 5 Years | 45 (36.0%) | 43 (43.4%) |
| 5 Years | 7 (87.5%) | 5 (71.4%) |
| 6 to 11 Years | 58 (55.8%) | 58 (53.7%) |
| 12 to 14 Years | 8 (15.1%) | 25 (53.2%) |
| 15 Years | 3 (20.0%) | 7 (19.4%) |
| 16 and 17 Years | 6 (9.8%) | 0 (0.0%) |
| 18 to 24 Years | 33 (27.5%) | 39 (32.8%) |
| 25 to 34 Years | 58 (52.7%) | 53 (49.5%) |
| 35 to 44 Years | 24 (23.1%) | 39 (34.2%) |
| 45 to 54 Years | 39 (42.4%) | 20 (31.8%) |
| 55 to 64 Years | 32 (32.3%) | 39 (47.6%) |
| 65 to 74 Years | 19 (40.4%) | 4 (10.0%) |
| 75 Years and over | 7 (17.5%) | 2 (15.4%) |
| Total | 339 (34.7%) | 334 (38.6%) |
Income Above Poverty by Sex and Age in Buffalo County
According to the poverty statistics in Buffalo County, males aged 16 and 17 years and females aged 16 and 17 years are the age groups that are most secure financially, with 90.2% of males and 100.0% of females in these age groups living above the poverty line.
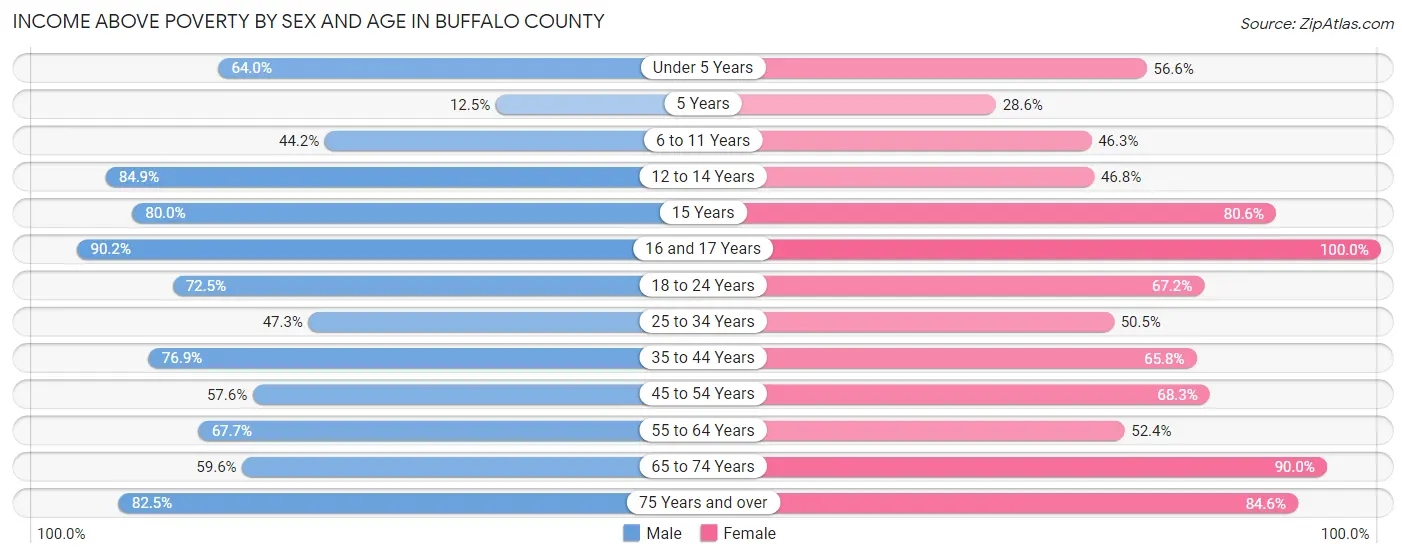
| Age Bracket | Male | Female |
| Under 5 Years | 80 (64.0%) | 56 (56.6%) |
| 5 Years | 1 (12.5%) | 2 (28.6%) |
| 6 to 11 Years | 46 (44.2%) | 50 (46.3%) |
| 12 to 14 Years | 45 (84.9%) | 22 (46.8%) |
| 15 Years | 12 (80.0%) | 29 (80.6%) |
| 16 and 17 Years | 55 (90.2%) | 30 (100.0%) |
| 18 to 24 Years | 87 (72.5%) | 80 (67.2%) |
| 25 to 34 Years | 52 (47.3%) | 54 (50.5%) |
| 35 to 44 Years | 80 (76.9%) | 75 (65.8%) |
| 45 to 54 Years | 53 (57.6%) | 43 (68.2%) |
| 55 to 64 Years | 67 (67.7%) | 43 (52.4%) |
| 65 to 74 Years | 28 (59.6%) | 36 (90.0%) |
| 75 Years and over | 33 (82.5%) | 11 (84.6%) |
| Total | 639 (65.3%) | 531 (61.4%) |
Income Below Poverty Among Married-Couple Families in Buffalo County
The poverty statistics for married-couple families in Buffalo County show that 16.9% or 24 of the total 142 families live below the poverty line. Families with 3 or 4 children have the highest poverty rate of 58.1%, comprising of 18 families. On the other hand, families with 1 or 2 children have the lowest poverty rate of 0.0%, which includes 0 families.
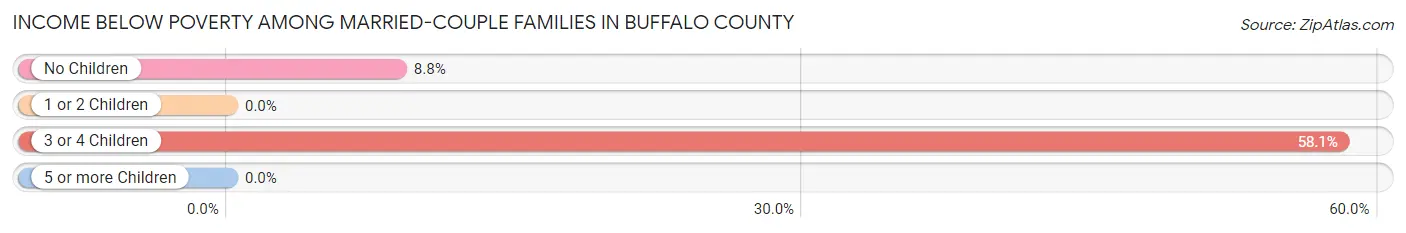
| Children | Above Poverty | Below Poverty |
| No Children | 62 (91.2%) | 6 (8.8%) |
| 1 or 2 Children | 32 (100.0%) | 0 (0.0%) |
| 3 or 4 Children | 13 (41.9%) | 18 (58.1%) |
| 5 or more Children | 11 (100.0%) | 0 (0.0%) |
| Total | 118 (83.1%) | 24 (16.9%) |
Income Below Poverty Among Single-Parent Households in Buffalo County
According to the poverty data in Buffalo County, 16.7% or 12 single-father households and 68.4% or 80 single-mother households are living below the poverty line. Among single-father households, those with 3 or 4 children have the highest poverty rate, with 9 households (81.8%) experiencing poverty. Likewise, among single-mother households, those with 5 or more children have the highest poverty rate, with 7 households (77.8%) falling below the poverty line.

| Children | Single Father | Single Mother |
| No Children | 0 (0.0%) | 14 (58.3%) |
| 1 or 2 Children | 3 (6.1%) | 37 (68.5%) |
| 3 or 4 Children | 9 (81.8%) | 22 (73.3%) |
| 5 or more Children | 0 (0.0%) | 7 (77.8%) |
| Total | 12 (16.7%) | 80 (68.4%) |
Income Below Poverty Among Married-Couple vs Single-Parent Households in Buffalo County
The poverty data for Buffalo County shows that 24 of the married-couple family households (16.9%) and 92 of the single-parent households (48.7%) are living below the poverty level. Within the married-couple family households, those with 3 or 4 children have the highest poverty rate, with 18 households (58.1%) falling below the poverty line. Among the single-parent households, those with 5 or more children have the highest poverty rate, with 7 household (77.8%) living below poverty.

| Children | Married-Couple Families | Single-Parent Households |
| No Children | 6 (8.8%) | 14 (38.9%) |
| 1 or 2 Children | 0 (0.0%) | 40 (38.8%) |
| 3 or 4 Children | 18 (58.1%) | 31 (75.6%) |
| 5 or more Children | 0 (0.0%) | 7 (77.8%) |
| Total | 24 (16.9%) | 92 (48.7%) |
Employment Characteristics in Buffalo County
Employment by Class of Employer in Buffalo County
Among the 583 employed individuals in Buffalo County, private company employees (252 | 43.2%), local government employees (182 | 31.2%), and self-employed (not incorporated) (87 | 14.9%) make up the most common classes of employment.
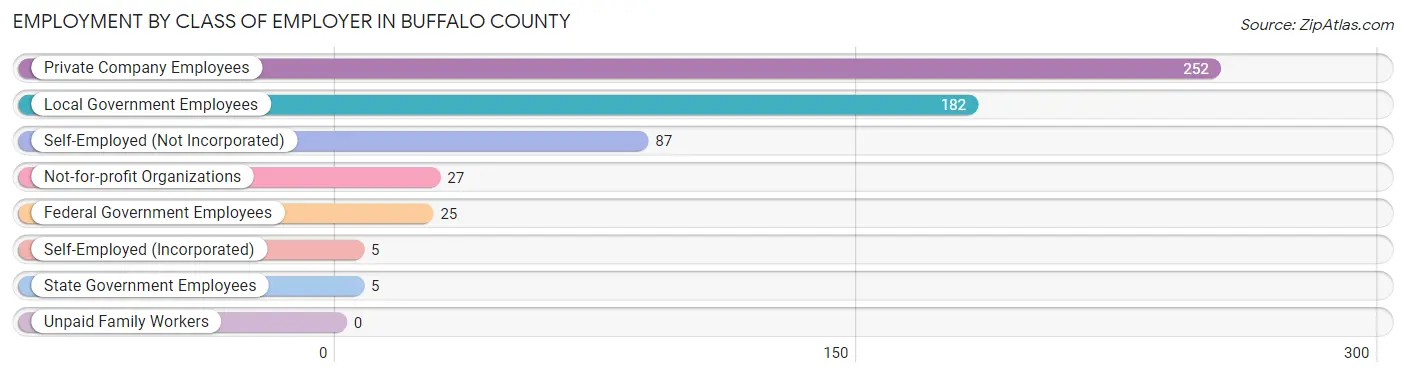
| Employer Class | # Employees | % Employees |
| Private Company Employees | 252 | 43.2% |
| Self-Employed (Incorporated) | 5 | 0.9% |
| Self-Employed (Not Incorporated) | 87 | 14.9% |
| Not-for-profit Organizations | 27 | 4.6% |
| Local Government Employees | 182 | 31.2% |
| State Government Employees | 5 | 0.9% |
| Federal Government Employees | 25 | 4.3% |
| Unpaid Family Workers | 0 | 0.0% |
| Total | 583 | 100.0% |
Employment Status by Age in Buffalo County
According to the labor force statistics for Buffalo County, out of the total population over 16 years of age (1,243), 56.0% or 696 individuals are in the labor force, with 14.9% or 104 of them unemployed. The age group with the highest labor force participation rate is 30 to 34 years, with 90.4% or 94 individuals in the labor force. Within the labor force, the 30 to 34 years age range has the highest percentage of unemployed individuals, with 34.0% or 32 of them being unemployed.
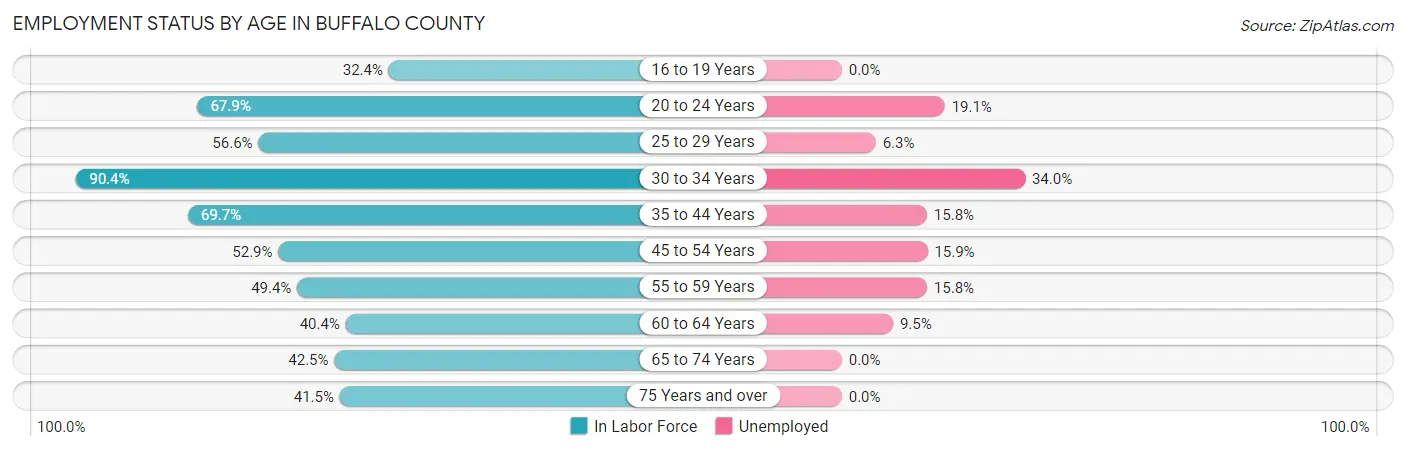
| Age Bracket | In Labor Force | Unemployed |
| 16 to 19 Years | 55 (32.4%) | 0 (0.0%) |
| 20 to 24 Years | 110 (67.9%) | 21 (19.1%) |
| 25 to 29 Years | 64 (56.6%) | 4 (6.3%) |
| 30 to 34 Years | 94 (90.4%) | 32 (34.0%) |
| 35 to 44 Years | 152 (69.7%) | 24 (15.8%) |
| 45 to 54 Years | 82 (52.9%) | 13 (15.9%) |
| 55 to 59 Years | 38 (49.4%) | 6 (15.8%) |
| 60 to 64 Years | 42 (40.4%) | 4 (9.5%) |
| 65 to 74 Years | 37 (42.5%) | 0 (0.0%) |
| 75 Years and over | 22 (41.5%) | 0 (0.0%) |
| Total | 696 (56.0%) | 104 (14.9%) |
Employment Status by Educational Attainment in Buffalo County
According to labor force statistics for Buffalo County, 61.2% of individuals (472) out of the total population between 25 and 64 years of age (771) are in the labor force, with 17.6% or 83 of them being unemployed. The group with the highest labor force participation rate are those with the educational attainment of bachelor's degree or higher, with 94.0% or 47 individuals in the labor force. Within the labor force, individuals with less than high school education have the highest percentage of unemployment, with 37.0% or 17 of them being unemployed.

| Educational Attainment | In Labor Force | Unemployed |
| Less than High School | 46 (31.3%) | 54 (37.0%) |
| High School Diploma | 202 (58.2%) | 79 (22.8%) |
| College / Associate Degree | 177 (78.0%) | 17 (7.3%) |
| Bachelor's Degree or higher | 47 (94.0%) | 7 (14.9%) |
| Total | 472 (61.2%) | 136 (17.6%) |
Employment Occupations by Sex in Buffalo County
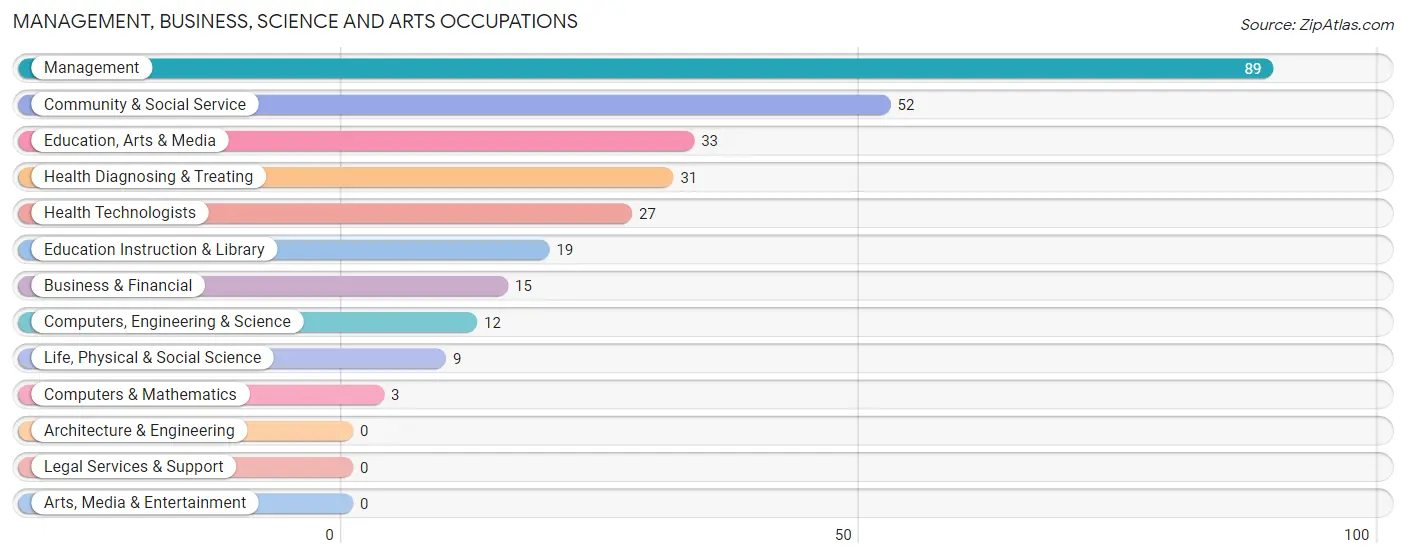
Management, Business, Science and Arts Occupations
The most common Management, Business, Science and Arts occupations in Buffalo County are Management (89 | 15.0%), Community & Social Service (52 | 8.8%), Education, Arts & Media (33 | 5.6%), Health Diagnosing & Treating (31 | 5.2%), and Health Technologists (27 | 4.6%).
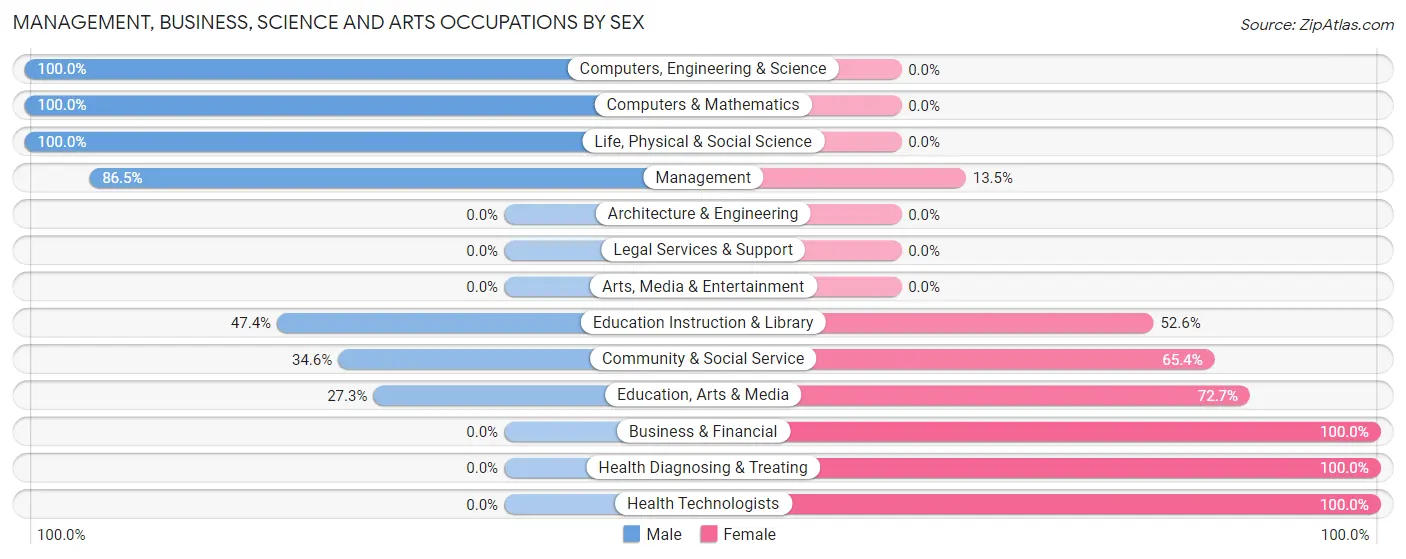
Management, Business, Science and Arts Occupations by Sex
Within the Management, Business, Science and Arts occupations in Buffalo County, the most male-oriented occupations are Computers, Engineering & Science (100.0%), Computers & Mathematics (100.0%), and Life, Physical & Social Science (100.0%), while the most female-oriented occupations are Business & Financial (100.0%), Health Diagnosing & Treating (100.0%), and Health Technologists (100.0%).
| Occupation | Male | Female |
| Management | 77 (86.5%) | 12 (13.5%) |
| Business & Financial | 0 (0.0%) | 15 (100.0%) |
| Computers, Engineering & Science | 12 (100.0%) | 0 (0.0%) |
| Computers & Mathematics | 3 (100.0%) | 0 (0.0%) |
| Architecture & Engineering | 0 (0.0%) | 0 (0.0%) |
| Life, Physical & Social Science | 9 (100.0%) | 0 (0.0%) |
| Community & Social Service | 18 (34.6%) | 34 (65.4%) |
| Education, Arts & Media | 9 (27.3%) | 24 (72.7%) |
| Legal Services & Support | 0 (0.0%) | 0 (0.0%) |
| Education Instruction & Library | 9 (47.4%) | 10 (52.6%) |
| Arts, Media & Entertainment | 0 (0.0%) | 0 (0.0%) |
| Health Diagnosing & Treating | 0 (0.0%) | 31 (100.0%) |
| Health Technologists | 0 (0.0%) | 27 (100.0%) |
| Total (Category) | 107 (53.8%) | 92 (46.2%) |
| Total (Overall) | 330 (55.7%) | 262 (44.3%) |
Services Occupations
The most common Services occupations in Buffalo County are Personal Care & Service (56 | 9.5%), Food Preparation & Serving (41 | 6.9%), Security & Protection (37 | 6.2%), Cleaning & Maintenance (26 | 4.4%), and Law Enforcement (22 | 3.7%).

Services Occupations by Sex
Within the Services occupations in Buffalo County, the most male-oriented occupations are Personal Care & Service (71.4%), Firefighting & Prevention (66.7%), and Security & Protection (62.2%), while the most female-oriented occupations are Healthcare Support (100.0%), Food Preparation & Serving (95.1%), and Cleaning & Maintenance (42.3%).

| Occupation | Male | Female |
| Healthcare Support | 0 (0.0%) | 12 (100.0%) |
| Security & Protection | 23 (62.2%) | 14 (37.8%) |
| Firefighting & Prevention | 10 (66.7%) | 5 (33.3%) |
| Law Enforcement | 13 (59.1%) | 9 (40.9%) |
| Food Preparation & Serving | 2 (4.9%) | 39 (95.1%) |
| Cleaning & Maintenance | 15 (57.7%) | 11 (42.3%) |
| Personal Care & Service | 40 (71.4%) | 16 (28.6%) |
| Total (Category) | 80 (46.5%) | 92 (53.5%) |
| Total (Overall) | 330 (55.7%) | 262 (44.3%) |
Sales and Office Occupations
The most common Sales and Office occupations in Buffalo County are Sales & Related (41 | 6.9%), and Office & Administration (37 | 6.2%).

Sales and Office Occupations by Sex

| Occupation | Male | Female |
| Sales & Related | 12 (29.3%) | 29 (70.7%) |
| Office & Administration | 0 (0.0%) | 37 (100.0%) |
| Total (Category) | 12 (15.4%) | 66 (84.6%) |
| Total (Overall) | 330 (55.7%) | 262 (44.3%) |
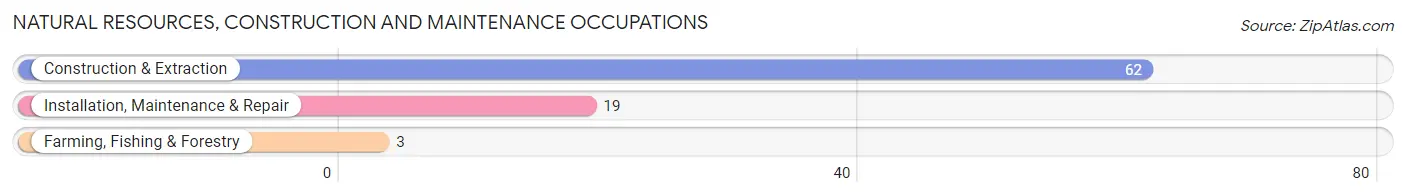
Natural Resources, Construction and Maintenance Occupations
The most common Natural Resources, Construction and Maintenance occupations in Buffalo County are Construction & Extraction (62 | 10.5%), Installation, Maintenance & Repair (19 | 3.2%), and Farming, Fishing & Forestry (3 | 0.5%).
Natural Resources, Construction and Maintenance Occupations by Sex

| Occupation | Male | Female |
| Farming, Fishing & Forestry | 2 (66.7%) | 1 (33.3%) |
| Construction & Extraction | 59 (95.2%) | 3 (4.8%) |
| Installation, Maintenance & Repair | 16 (84.2%) | 3 (15.8%) |
| Total (Category) | 77 (91.7%) | 7 (8.3%) |
| Total (Overall) | 330 (55.7%) | 262 (44.3%) |
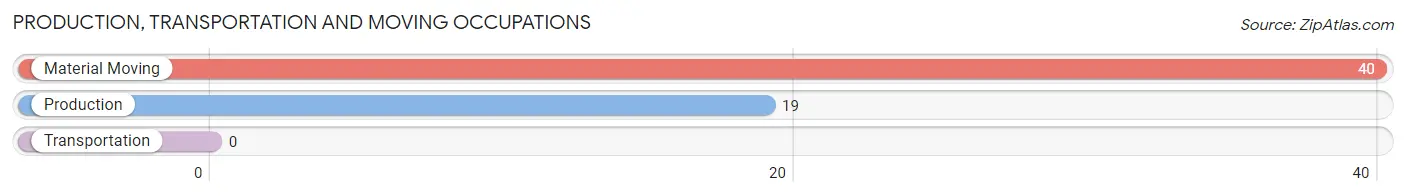
Production, Transportation and Moving Occupations
The most common Production, Transportation and Moving occupations in Buffalo County are Material Moving (40 | 6.8%), and Production (19 | 3.2%).
Production, Transportation and Moving Occupations by Sex

| Occupation | Male | Female |
| Production | 14 (73.7%) | 5 (26.3%) |
| Transportation | 0 (0.0%) | 0 (0.0%) |
| Material Moving | 40 (100.0%) | 0 (0.0%) |
| Total (Category) | 54 (91.5%) | 5 (8.5%) |
| Total (Overall) | 330 (55.7%) | 262 (44.3%) |
Employment Industries by Sex in Buffalo County
Employment Industries in Buffalo County
The major employment industries in Buffalo County include Health Care & Social Assistance (82 | 13.9%), Educational Services (76 | 12.8%), Agriculture, Fishing & Hunting (71 | 12.0%), Public Administration (62 | 10.5%), and Arts, Entertainment & Recreation (49 | 8.3%).

Employment Industries by Sex in Buffalo County
The Buffalo County industries that see more men than women are Mining, Quarrying, & Extraction (100.0%), Transportation & Warehousing (100.0%), and Professional & Scientific (100.0%), whereas the industries that tend to have a higher number of women are Utilities (100.0%), Information (100.0%), and Finance & Insurance (100.0%).
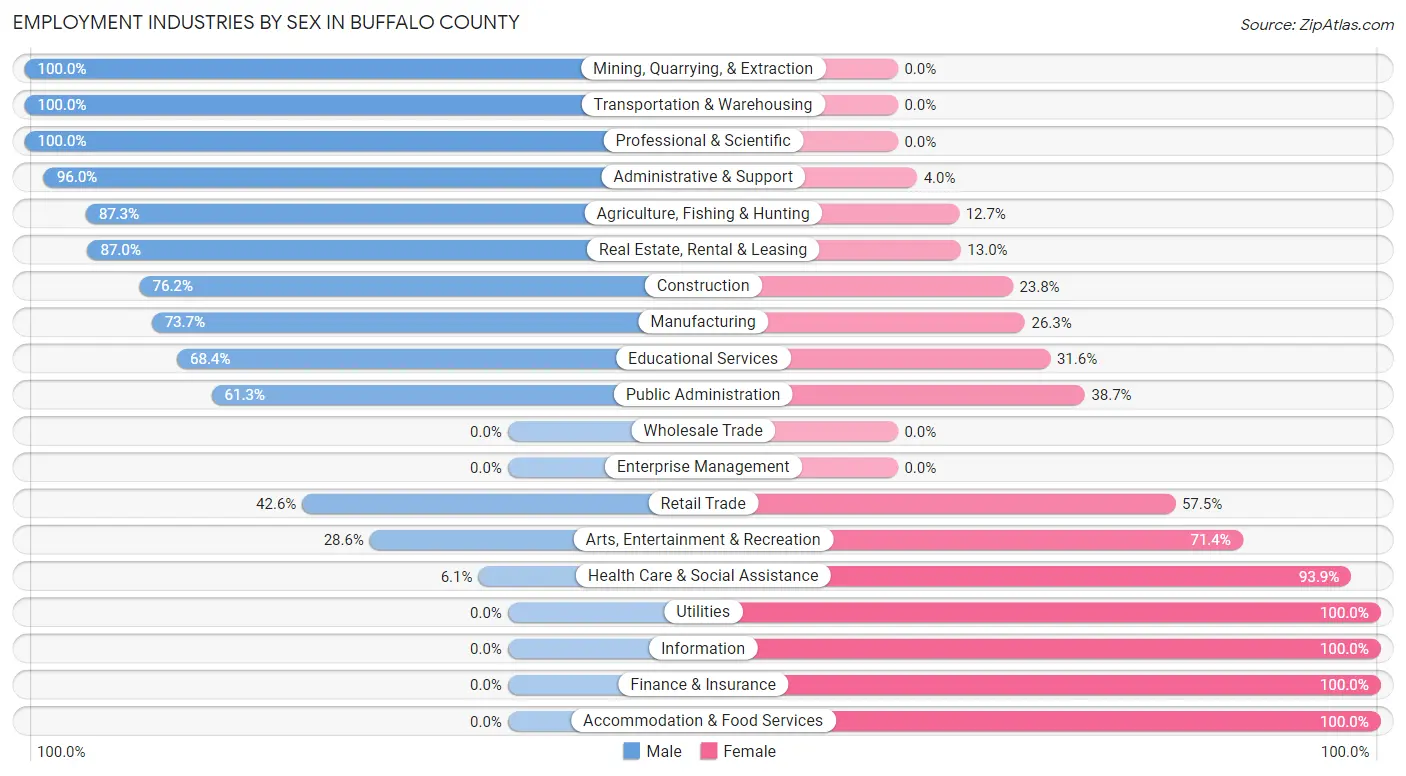
| Industry | Male | Female |
| Agriculture, Fishing & Hunting | 62 (87.3%) | 9 (12.7%) |
| Mining, Quarrying, & Extraction | 11 (100.0%) | 0 (0.0%) |
| Construction | 32 (76.2%) | 10 (23.8%) |
| Manufacturing | 14 (73.7%) | 5 (26.3%) |
| Wholesale Trade | 0 (0.0%) | 0 (0.0%) |
| Retail Trade | 20 (42.5%) | 27 (57.5%) |
| Transportation & Warehousing | 6 (100.0%) | 0 (0.0%) |
| Utilities | 0 (0.0%) | 3 (100.0%) |
| Information | 0 (0.0%) | 2 (100.0%) |
| Finance & Insurance | 0 (0.0%) | 21 (100.0%) |
| Real Estate, Rental & Leasing | 20 (87.0%) | 3 (13.0%) |
| Professional & Scientific | 20 (100.0%) | 0 (0.0%) |
| Enterprise Management | 0 (0.0%) | 0 (0.0%) |
| Administrative & Support | 24 (96.0%) | 1 (4.0%) |
| Educational Services | 52 (68.4%) | 24 (31.6%) |
| Health Care & Social Assistance | 5 (6.1%) | 77 (93.9%) |
| Arts, Entertainment & Recreation | 14 (28.6%) | 35 (71.4%) |
| Accommodation & Food Services | 0 (0.0%) | 19 (100.0%) |
| Public Administration | 38 (61.3%) | 24 (38.7%) |
| Total | 330 (55.7%) | 262 (44.3%) |
Education in Buffalo County
School Enrollment in Buffalo County
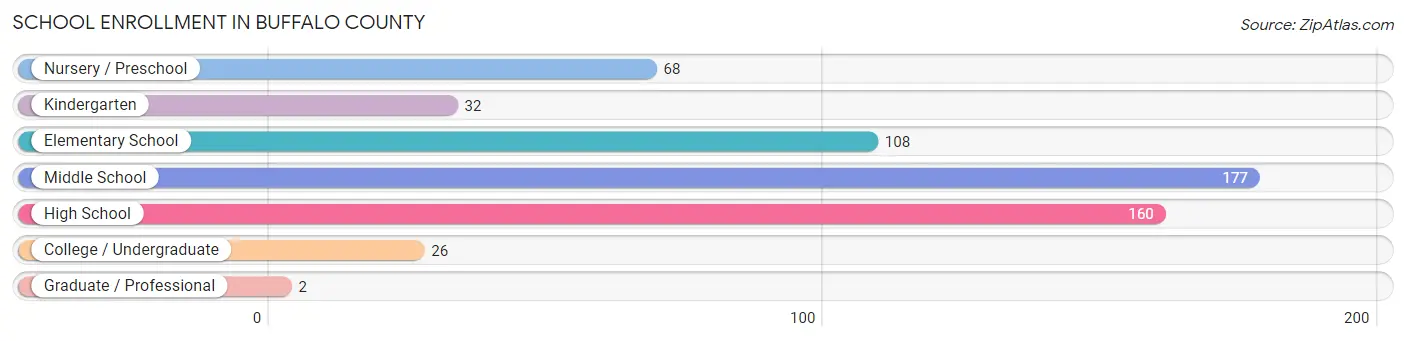
The most common levels of schooling among the 573 students in Buffalo County are middle school (177 | 30.9%), high school (160 | 27.9%), and elementary school (108 | 18.9%).
| School Level | # Students | % Students |
| Nursery / Preschool | 68 | 11.9% |
| Kindergarten | 32 | 5.6% |
| Elementary School | 108 | 18.9% |
| Middle School | 177 | 30.9% |
| High School | 160 | 27.9% |
| College / Undergraduate | 26 | 4.5% |
| Graduate / Professional | 2 | 0.4% |
| Total | 573 | 100.0% |
School Enrollment by Age by Funding Source in Buffalo County
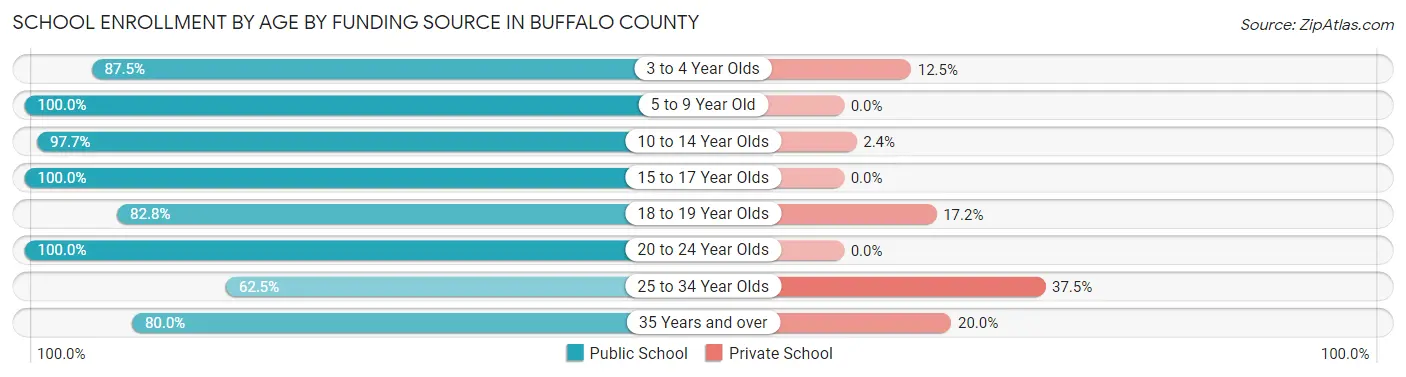
Out of a total of 573 students who are enrolled in schools in Buffalo County, 22 (3.8%) attend a private institution, while the remaining 551 (96.2%) are enrolled in public schools. The age group of 25 to 34 year olds has the highest likelihood of being enrolled in private schools, with 3 (37.5% in the age bracket) enrolled. Conversely, the age group of 5 to 9 year old has the lowest likelihood of being enrolled in a private school, with 140 (100.0% in the age bracket) attending a public institution.
| Age Bracket | Public School | Private School |
| 3 to 4 Year Olds | 56 (87.5%) | 8 (12.5%) |
| 5 to 9 Year Old | 140 (100.0%) | 0 (0.0%) |
| 10 to 14 Year Olds | 166 (97.7%) | 4 (2.4%) |
| 15 to 17 Year Olds | 142 (100.0%) | 0 (0.0%) |
| 18 to 19 Year Olds | 24 (82.8%) | 5 (17.2%) |
| 20 to 24 Year Olds | 10 (100.0%) | 0 (0.0%) |
| 25 to 34 Year Olds | 5 (62.5%) | 3 (37.5%) |
| 35 Years and over | 8 (80.0%) | 2 (20.0%) |
| Total | 551 (96.2%) | 22 (3.8%) |
Educational Attainment by Field of Study in Buffalo County
Bio, nature & agricultural (15 | 24.2%), science & technology (14 | 22.6%), social sciences (9 | 14.5%), education (9 | 14.5%), and arts & humanities (9 | 14.5%) are the most common fields of study among 62 individuals in Buffalo County who have obtained a bachelor's degree or higher.

| Field of Study | # Graduates | % Graduates |
| Computers & Mathematics | 0 | 0.0% |
| Bio, Nature & Agricultural | 15 | 24.2% |
| Physical & Health Sciences | 0 | 0.0% |
| Psychology | 1 | 1.6% |
| Social Sciences | 9 | 14.5% |
| Engineering | 0 | 0.0% |
| Multidisciplinary Studies | 0 | 0.0% |
| Science & Technology | 14 | 22.6% |
| Business | 3 | 4.8% |
| Education | 9 | 14.5% |
| Literature & Languages | 0 | 0.0% |
| Liberal Arts & History | 1 | 1.6% |
| Visual & Performing Arts | 1 | 1.6% |
| Communications | 0 | 0.0% |
| Arts & Humanities | 9 | 14.5% |
| Total | 62 | 100.0% |
Transportation & Commute in Buffalo County
Vehicle Availability by Sex in Buffalo County
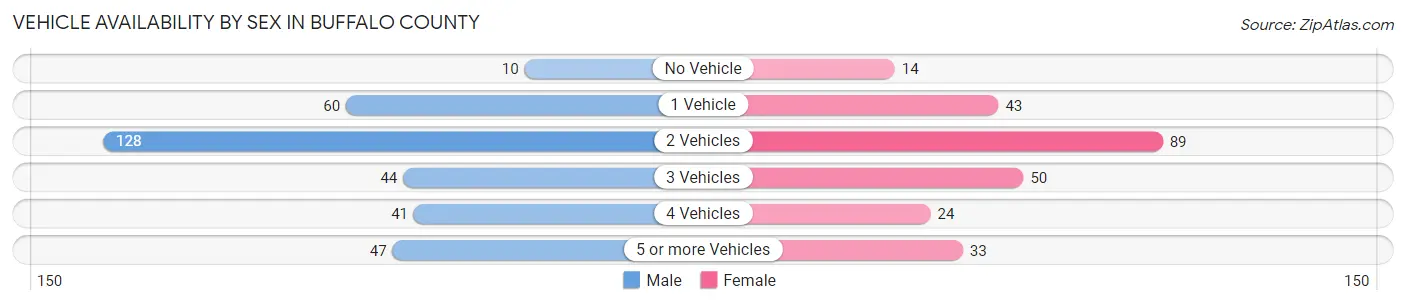
The most prevalent vehicle ownership categories in Buffalo County are males with 2 vehicles (128, accounting for 38.8%) and females with 2 vehicles (89, making up 50.6%).
| Vehicles Available | Male | Female |
| No Vehicle | 10 (3.0%) | 14 (5.5%) |
| 1 Vehicle | 60 (18.2%) | 43 (17.0%) |
| 2 Vehicles | 128 (38.8%) | 89 (35.2%) |
| 3 Vehicles | 44 (13.3%) | 50 (19.8%) |
| 4 Vehicles | 41 (12.4%) | 24 (9.5%) |
| 5 or more Vehicles | 47 (14.2%) | 33 (13.0%) |
| Total | 330 (100.0%) | 253 (100.0%) |
Commute Time in Buffalo County
The most frequently occuring commute durations in Buffalo County are 5 to 9 minutes (160 commuters, 31.2%), less than 5 minutes (86 commuters, 16.8%), and 30 to 34 minutes (75 commuters, 14.6%).

| Commute Time | # Commuters | % Commuters |
| Less than 5 Minutes | 86 | 16.8% |
| 5 to 9 Minutes | 160 | 31.2% |
| 10 to 14 Minutes | 44 | 8.6% |
| 15 to 19 Minutes | 16 | 3.1% |
| 20 to 24 Minutes | 56 | 10.9% |
| 25 to 29 Minutes | 46 | 9.0% |
| 30 to 34 Minutes | 75 | 14.6% |
| 35 to 39 Minutes | 13 | 2.5% |
| 40 to 44 Minutes | 0 | 0.0% |
| 45 to 59 Minutes | 16 | 3.1% |
| 60 to 89 Minutes | 0 | 0.0% |
| 90 or more Minutes | 0 | 0.0% |
Commute Time by Sex in Buffalo County
The most common commute times in Buffalo County are 5 to 9 minutes (93 commuters, 34.6%) for males and 5 to 9 minutes (67 commuters, 27.6%) for females.

| Commute Time | Male | Female |
| Less than 5 Minutes | 32 (11.9%) | 54 (22.2%) |
| 5 to 9 Minutes | 93 (34.6%) | 67 (27.6%) |
| 10 to 14 Minutes | 29 (10.8%) | 15 (6.2%) |
| 15 to 19 Minutes | 6 (2.2%) | 10 (4.1%) |
| 20 to 24 Minutes | 39 (14.5%) | 17 (7.0%) |
| 25 to 29 Minutes | 38 (14.1%) | 8 (3.3%) |
| 30 to 34 Minutes | 32 (11.9%) | 43 (17.7%) |
| 35 to 39 Minutes | 0 (0.0%) | 13 (5.3%) |
| 40 to 44 Minutes | 0 (0.0%) | 0 (0.0%) |
| 45 to 59 Minutes | 0 (0.0%) | 16 (6.6%) |
| 60 to 89 Minutes | 0 (0.0%) | 0 (0.0%) |
| 90 or more Minutes | 0 (0.0%) | 0 (0.0%) |
Time of Departure to Work by Sex in Buffalo County
The most frequent times of departure to work in Buffalo County are 7:30 AM to 7:59 AM (82, 30.5%) for males and 7:30 AM to 7:59 AM (78, 32.1%) for females.
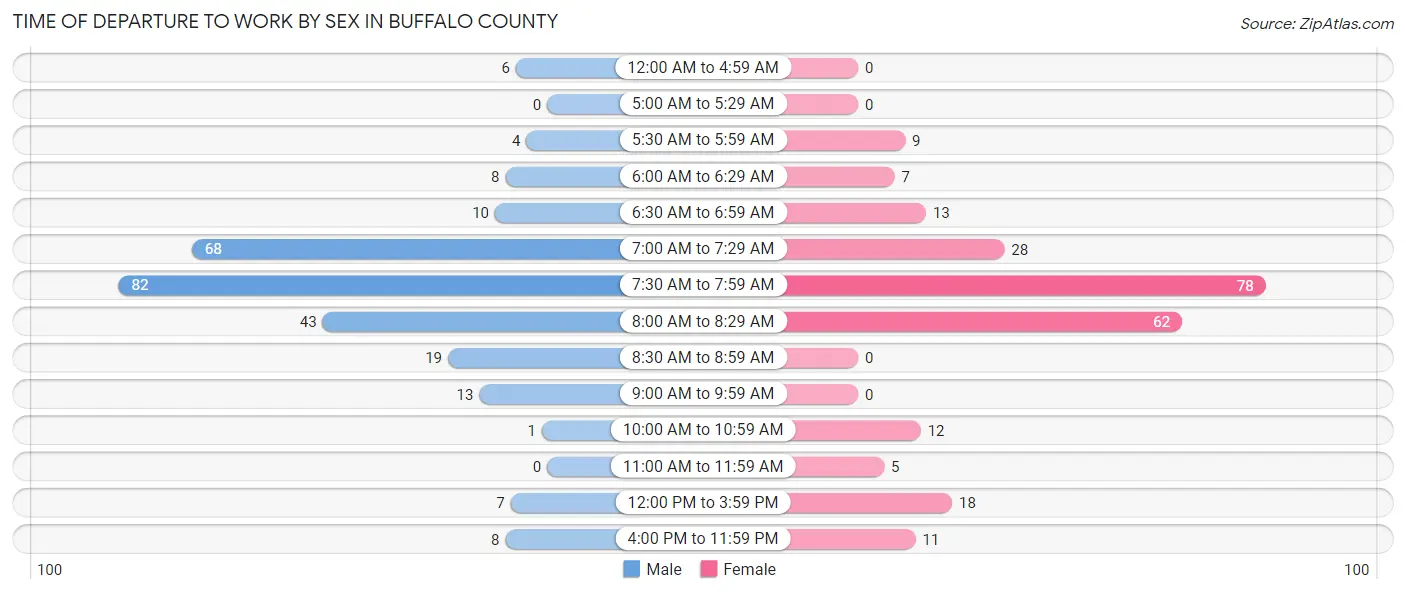
| Time of Departure | Male | Female |
| 12:00 AM to 4:59 AM | 6 (2.2%) | 0 (0.0%) |
| 5:00 AM to 5:29 AM | 0 (0.0%) | 0 (0.0%) |
| 5:30 AM to 5:59 AM | 4 (1.5%) | 9 (3.7%) |
| 6:00 AM to 6:29 AM | 8 (3.0%) | 7 (2.9%) |
| 6:30 AM to 6:59 AM | 10 (3.7%) | 13 (5.3%) |
| 7:00 AM to 7:29 AM | 68 (25.3%) | 28 (11.5%) |
| 7:30 AM to 7:59 AM | 82 (30.5%) | 78 (32.1%) |
| 8:00 AM to 8:29 AM | 43 (16.0%) | 62 (25.5%) |
| 8:30 AM to 8:59 AM | 19 (7.1%) | 0 (0.0%) |
| 9:00 AM to 9:59 AM | 13 (4.8%) | 0 (0.0%) |
| 10:00 AM to 10:59 AM | 1 (0.4%) | 12 (4.9%) |
| 11:00 AM to 11:59 AM | 0 (0.0%) | 5 (2.1%) |
| 12:00 PM to 3:59 PM | 7 (2.6%) | 18 (7.4%) |
| 4:00 PM to 11:59 PM | 8 (3.0%) | 11 (4.5%) |
| Total | 269 (100.0%) | 243 (100.0%) |
Housing Occupancy in Buffalo County
Occupancy by Ownership in Buffalo County
Of the total 492 dwellings in Buffalo County, owner-occupied units account for 241 (49.0%), while renter-occupied units make up 251 (51.0%).

| Occupancy | # Housing Units | % Housing Units |
| Owner Occupied Housing Units | 241 | 49.0% |
| Renter-Occupied Housing Units | 251 | 51.0% |
| Total Occupied Housing Units | 492 | 100.0% |
Occupancy by Household Size in Buffalo County

| Household Size | # Housing Units | % Housing Units |
| 1-Person Household | 140 | 28.5% |
| 2-Person Household | 98 | 19.9% |
| 3-Person Household | 79 | 16.1% |
| 4+ Person Household | 175 | 35.6% |
| Total Housing Units | 492 | 100.0% |
Occupancy by Ownership by Household Size in Buffalo County

| Household Size | Owner-occupied | Renter-occupied |
| 1-Person Household | 71 (50.7%) | 69 (49.3%) |
| 2-Person Household | 64 (65.3%) | 34 (34.7%) |
| 3-Person Household | 34 (43.0%) | 45 (57.0%) |
| 4+ Person Household | 72 (41.1%) | 103 (58.9%) |
| Total Housing Units | 241 (49.0%) | 251 (51.0%) |
Occupancy by Educational Attainment in Buffalo County
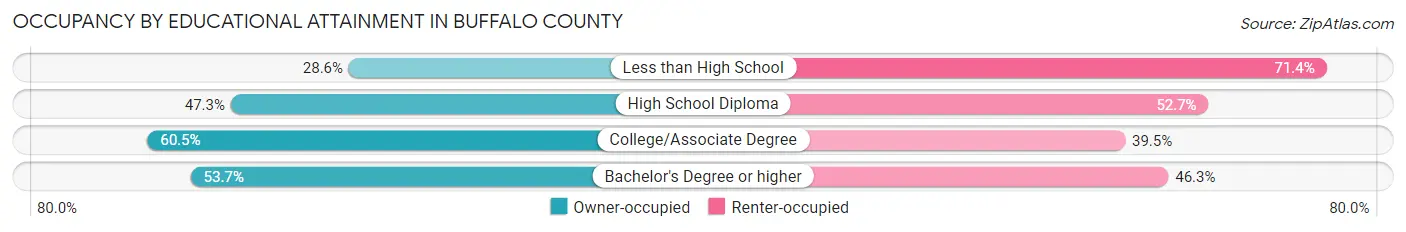
| Household Size | Owner-occupied | Renter-occupied |
| Less than High School | 22 (28.6%) | 55 (71.4%) |
| High School Diploma | 105 (47.3%) | 117 (52.7%) |
| College/Associate Degree | 92 (60.5%) | 60 (39.5%) |
| Bachelor's Degree or higher | 22 (53.7%) | 19 (46.3%) |
Occupancy by Age of Householder in Buffalo County

| Age Bracket | # Households | % Households |
| Under 35 Years | 94 | 19.1% |
| 35 to 44 Years | 97 | 19.7% |
| 45 to 54 Years | 57 | 11.6% |
| 55 to 64 Years | 140 | 28.5% |
| 65 to 74 Years | 59 | 12.0% |
| 75 to 84 Years | 40 | 8.1% |
| 85 Years and Over | 5 | 1.0% |
| Total | 492 | 100.0% |
Housing Finances in Buffalo County
Median Income by Occupancy in Buffalo County
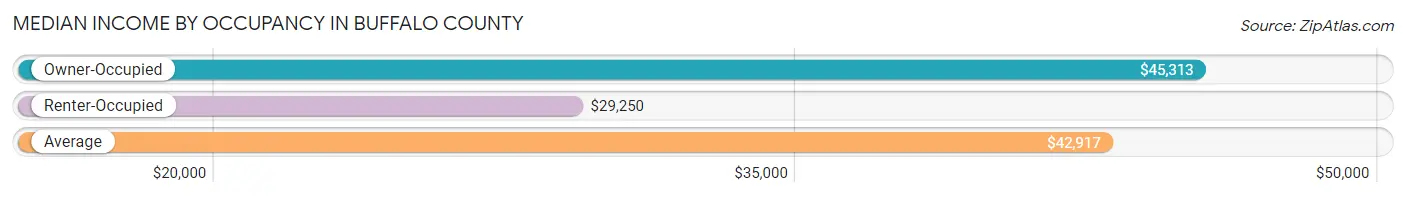
| Occupancy Type | # Households | Median Income |
| Owner-Occupied | 241 (49.0%) | $45,313 |
| Renter-Occupied | 251 (51.0%) | $29,250 |
| Average | 492 (100.0%) | $42,917 |
Occupancy by Householder Income Bracket in Buffalo County

| Income Bracket | Owner-occupied | Renter-occupied |
| Less than $5,000 | 32 (13.3%) | 30 (11.9%) |
| $5,000 to $9,999 | 10 (4.2%) | 28 (11.2%) |
| $10,000 to $14,999 | 20 (8.3%) | 26 (10.4%) |
| $15,000 to $19,999 | 13 (5.4%) | 29 (11.6%) |
| $20,000 to $24,999 | 4 (1.7%) | 7 (2.8%) |
| $25,000 to $34,999 | 8 (3.3%) | 7 (2.8%) |
| $35,000 to $49,999 | 44 (18.3%) | 24 (9.6%) |
| $50,000 to $74,999 | 44 (18.3%) | 57 (22.7%) |
| $75,000 to $99,999 | 23 (9.5%) | 34 (13.6%) |
| $100,000 to $149,999 | 37 (15.3%) | 6 (2.4%) |
| $150,000 or more | 6 (2.5%) | 3 (1.2%) |
| Total | 241 (100.0%) | 251 (100.0%) |
Monthly Housing Cost Tiers in Buffalo County
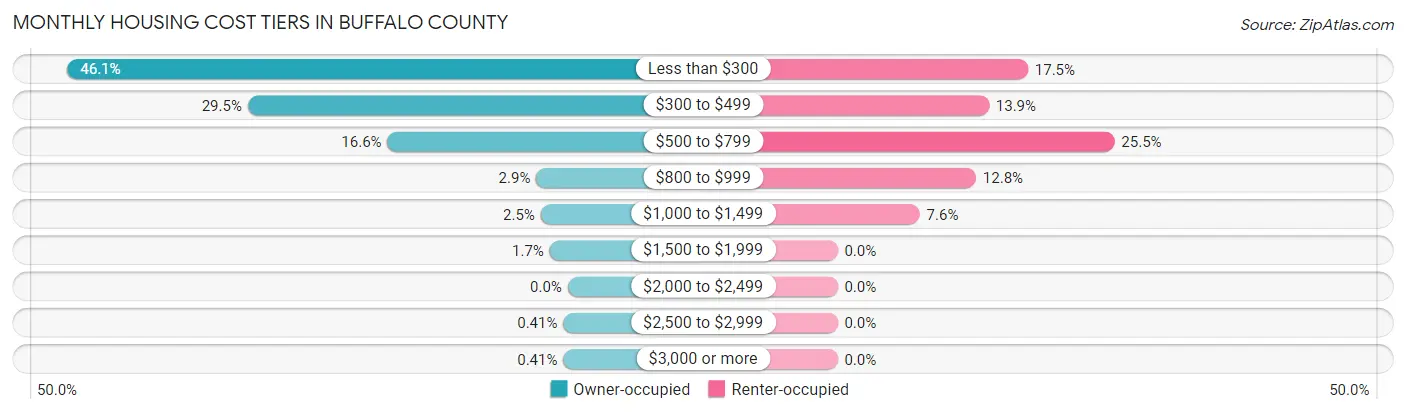
| Monthly Cost | Owner-occupied | Renter-occupied |
| Less than $300 | 111 (46.1%) | 44 (17.5%) |
| $300 to $499 | 71 (29.5%) | 35 (13.9%) |
| $500 to $799 | 40 (16.6%) | 64 (25.5%) |
| $800 to $999 | 7 (2.9%) | 32 (12.8%) |
| $1,000 to $1,499 | 6 (2.5%) | 19 (7.6%) |
| $1,500 to $1,999 | 4 (1.7%) | 0 (0.0%) |
| $2,000 to $2,499 | 0 (0.0%) | 0 (0.0%) |
| $2,500 to $2,999 | 1 (0.4%) | 0 (0.0%) |
| $3,000 or more | 1 (0.4%) | 0 (0.0%) |
| Total | 241 (100.0%) | 251 (100.0%) |
Physical Housing Characteristics in Buffalo County
Housing Structures in Buffalo County
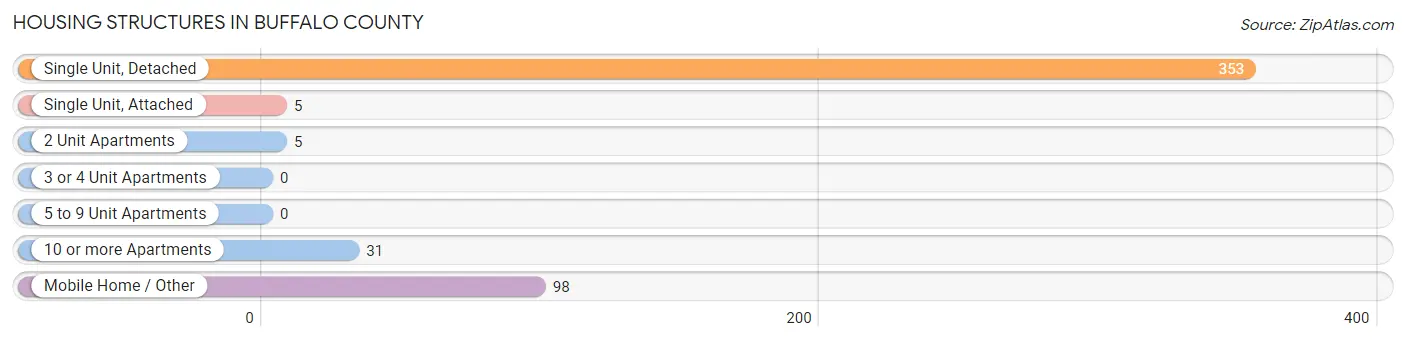
| Structure Type | # Housing Units | % Housing Units |
| Single Unit, Detached | 353 | 71.8% |
| Single Unit, Attached | 5 | 1.0% |
| 2 Unit Apartments | 5 | 1.0% |
| 3 or 4 Unit Apartments | 0 | 0.0% |
| 5 to 9 Unit Apartments | 0 | 0.0% |
| 10 or more Apartments | 31 | 6.3% |
| Mobile Home / Other | 98 | 19.9% |
| Total | 492 | 100.0% |
Housing Structures by Occupancy in Buffalo County

| Structure Type | Owner-occupied | Renter-occupied |
| Single Unit, Detached | 170 (48.2%) | 183 (51.8%) |
| Single Unit, Attached | 0 (0.0%) | 5 (100.0%) |
| 2 Unit Apartments | 0 (0.0%) | 5 (100.0%) |
| 3 or 4 Unit Apartments | 0 (0.0%) | 0 (0.0%) |
| 5 to 9 Unit Apartments | 0 (0.0%) | 0 (0.0%) |
| 10 or more Apartments | 0 (0.0%) | 31 (100.0%) |
| Mobile Home / Other | 71 (72.5%) | 27 (27.6%) |
| Total | 241 (49.0%) | 251 (51.0%) |
Housing Structures by Number of Rooms in Buffalo County
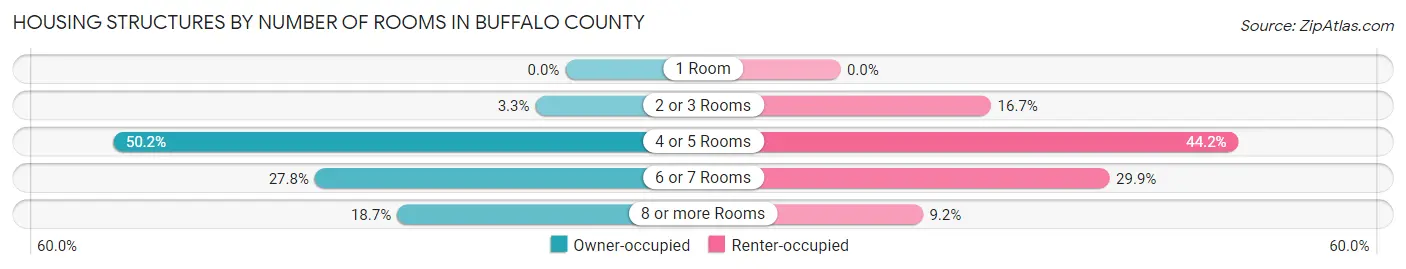
| Number of Rooms | Owner-occupied | Renter-occupied |
| 1 Room | 0 (0.0%) | 0 (0.0%) |
| 2 or 3 Rooms | 8 (3.3%) | 42 (16.7%) |
| 4 or 5 Rooms | 121 (50.2%) | 111 (44.2%) |
| 6 or 7 Rooms | 67 (27.8%) | 75 (29.9%) |
| 8 or more Rooms | 45 (18.7%) | 23 (9.2%) |
| Total | 241 (100.0%) | 251 (100.0%) |
Housing Structure by Heating Type in Buffalo County

| Heating Type | Owner-occupied | Renter-occupied |
| Utility Gas | 5 (2.1%) | 4 (1.6%) |
| Bottled, Tank, or LP Gas | 190 (78.8%) | 156 (62.2%) |
| Electricity | 36 (14.9%) | 87 (34.7%) |
| Fuel Oil or Kerosene | 0 (0.0%) | 0 (0.0%) |
| Coal or Coke | 0 (0.0%) | 0 (0.0%) |
| All other Fuels | 8 (3.3%) | 4 (1.6%) |
| No Fuel Used | 2 (0.8%) | 0 (0.0%) |
| Total | 241 (100.0%) | 251 (100.0%) |
Household Vehicle Usage in Buffalo County

| Vehicles per Household | Owner-occupied | Renter-occupied |
| No Vehicle | 24 (10.0%) | 46 (18.3%) |
| 1 Vehicle | 30 (12.4%) | 124 (49.4%) |
| 2 Vehicles | 131 (54.4%) | 36 (14.3%) |
| 3 or more Vehicles | 56 (23.2%) | 45 (17.9%) |
| Total | 241 (100.0%) | 251 (100.0%) |
Real Estate & Mortgages in Buffalo County
Real Estate and Mortgage Overview in Buffalo County
| Characteristic | Without Mortgage | With Mortgage |
| Housing Units | 230 | 11 |
| Median Property Value | $103,600 | $0 |
| Median Household Income | $45,208 | $0 |
| Monthly Housing Costs | $323 | $1 |
| Real Estate Taxes | $541 | $5 |
Property Value by Mortgage Status in Buffalo County

| Property Value | Without Mortgage | With Mortgage |
| Less than $50,000 | 87 (37.8%) | 5 (45.5%) |
| $50,000 to $99,999 | 23 (10.0%) | 0 (0.0%) |
| $100,000 to $299,999 | 120 (52.2%) | 5 (45.5%) |
| $300,000 to $499,999 | 0 (0.0%) | 1 (9.1%) |
| $500,000 to $749,999 | 0 (0.0%) | 0 (0.0%) |
| $750,000 to $999,999 | 0 (0.0%) | 0 (0.0%) |
| $1,000,000 or more | 0 (0.0%) | 0 (0.0%) |
| Total | 230 (100.0%) | 11 (100.0%) |
Household Income by Mortgage Status in Buffalo County
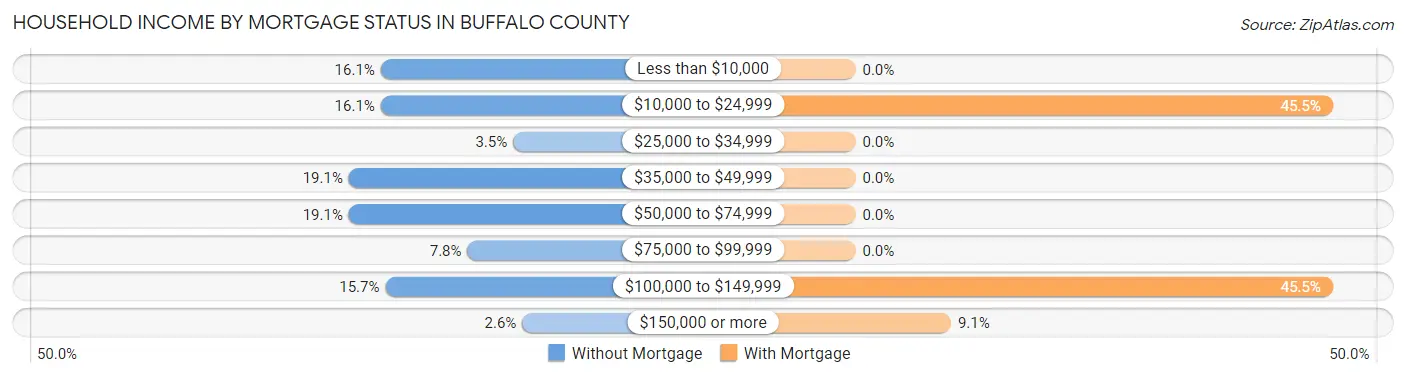
| Household Income | Without Mortgage | With Mortgage |
| Less than $10,000 | 37 (16.1%) | 0 (0.0%) |
| $10,000 to $24,999 | 37 (16.1%) | 5 (45.5%) |
| $25,000 to $34,999 | 8 (3.5%) | 0 (0.0%) |
| $35,000 to $49,999 | 44 (19.1%) | 0 (0.0%) |
| $50,000 to $74,999 | 44 (19.1%) | 0 (0.0%) |
| $75,000 to $99,999 | 18 (7.8%) | 0 (0.0%) |
| $100,000 to $149,999 | 36 (15.7%) | 5 (45.5%) |
| $150,000 or more | 6 (2.6%) | 1 (9.1%) |
| Total | 230 (100.0%) | 11 (100.0%) |
Property Value to Household Income Ratio in Buffalo County

| Value-to-Income Ratio | Without Mortgage | With Mortgage |
| Less than 2.0x | 122 (53.0%) | 0 (0.0%) |
| 2.0x to 2.9x | 32 (13.9%) | 1 (9.1%) |
| 3.0x to 3.9x | 21 (9.1%) | 0 (0.0%) |
| 4.0x or more | 52 (22.6%) | 5 (45.5%) |
| Total | 230 (100.0%) | 11 (100.0%) |
Real Estate Taxes by Mortgage Status in Buffalo County
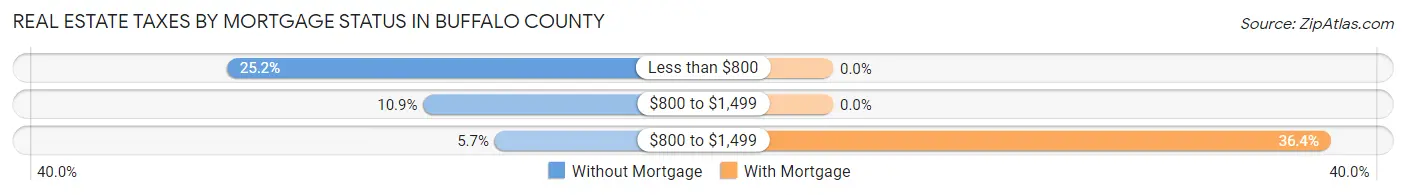
| Property Taxes | Without Mortgage | With Mortgage |
| Less than $800 | 58 (25.2%) | 0 (0.0%) |
| $800 to $1,499 | 25 (10.9%) | 0 (0.0%) |
| $800 to $1,499 | 13 (5.7%) | 4 (36.4%) |
| Total | 230 (100.0%) | 11 (100.0%) |
Health & Disability in Buffalo County
Health Insurance Coverage by Age in Buffalo County
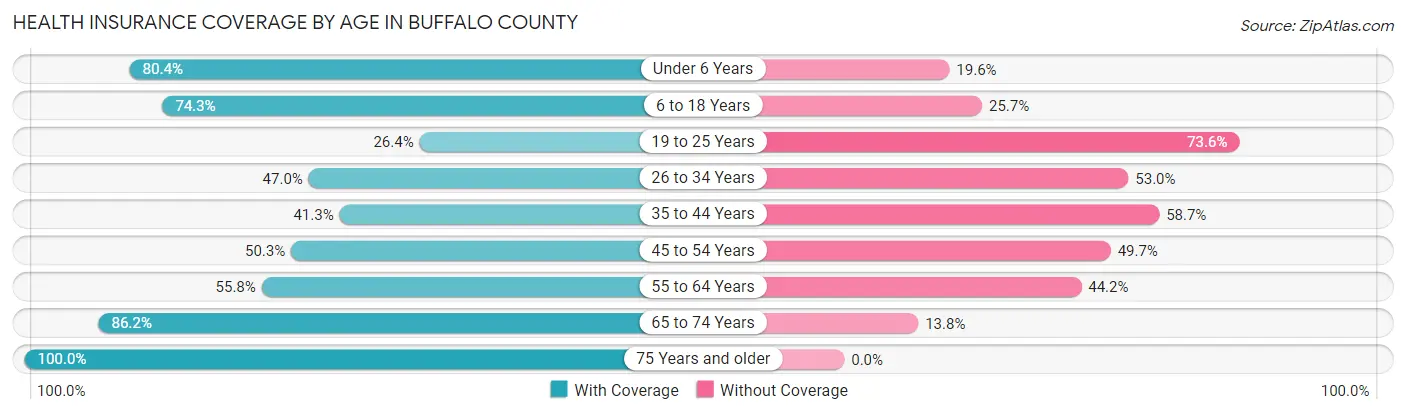
| Age Bracket | With Coverage | Without Coverage |
| Under 6 Years | 201 (80.4%) | 49 (19.6%) |
| 6 to 18 Years | 379 (74.3%) | 131 (25.7%) |
| 19 to 25 Years | 58 (26.4%) | 162 (73.6%) |
| 26 to 34 Years | 87 (47.0%) | 98 (53.0%) |
| 35 to 44 Years | 90 (41.3%) | 128 (58.7%) |
| 45 to 54 Years | 78 (50.3%) | 77 (49.7%) |
| 55 to 64 Years | 101 (55.8%) | 80 (44.2%) |
| 65 to 74 Years | 75 (86.2%) | 12 (13.8%) |
| 75 Years and older | 53 (100.0%) | 0 (0.0%) |
| Total | 1,122 (60.4%) | 737 (39.6%) |
Health Insurance Coverage by Citizenship Status in Buffalo County

| Citizenship Status | With Coverage | Without Coverage |
| Native Born | 201 (80.4%) | 49 (19.6%) |
| Foreign Born, Citizen | 379 (74.3%) | 131 (25.7%) |
| Foreign Born, not a Citizen | 58 (26.4%) | 162 (73.6%) |
Health Insurance Coverage by Household Income in Buffalo County
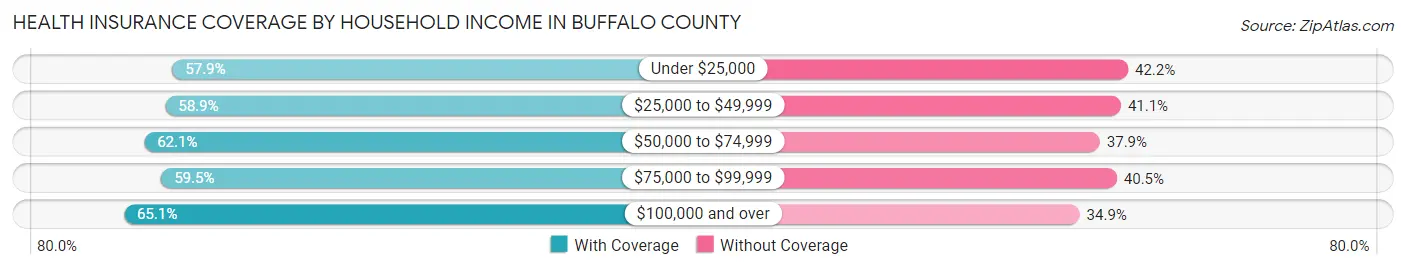
| Household Income | With Coverage | Without Coverage |
| Under $25,000 | 339 (57.9%) | 247 (42.1%) |
| $25,000 to $49,999 | 152 (58.9%) | 106 (41.1%) |
| $50,000 to $74,999 | 288 (62.1%) | 176 (37.9%) |
| $75,000 to $99,999 | 175 (59.5%) | 119 (40.5%) |
| $100,000 and over | 166 (65.1%) | 89 (34.9%) |
Public vs Private Health Insurance Coverage by Age in Buffalo County
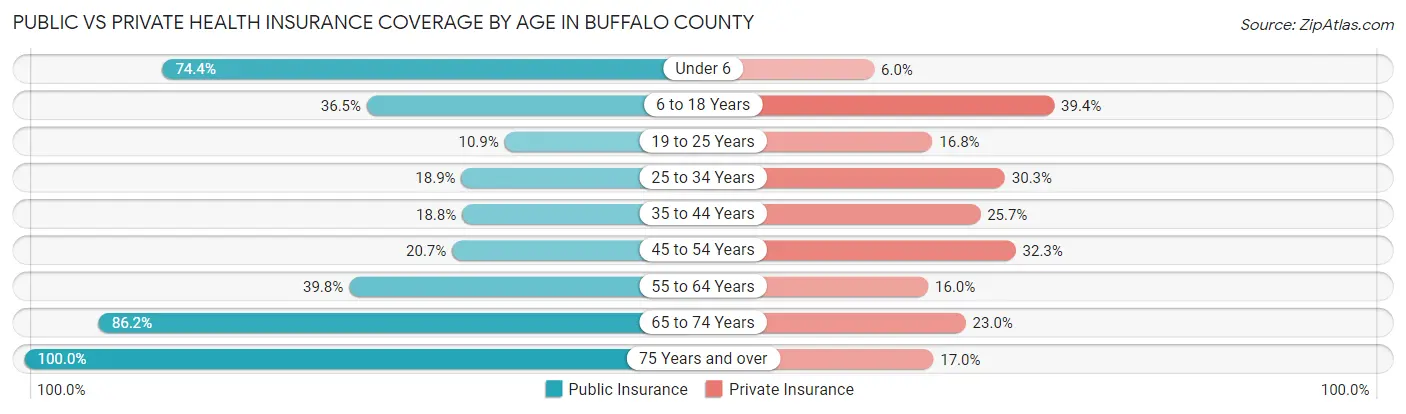
| Age Bracket | Public Insurance | Private Insurance |
| Under 6 | 186 (74.4%) | 15 (6.0%) |
| 6 to 18 Years | 186 (36.5%) | 201 (39.4%) |
| 19 to 25 Years | 24 (10.9%) | 37 (16.8%) |
| 25 to 34 Years | 35 (18.9%) | 56 (30.3%) |
| 35 to 44 Years | 41 (18.8%) | 56 (25.7%) |
| 45 to 54 Years | 32 (20.6%) | 50 (32.3%) |
| 55 to 64 Years | 72 (39.8%) | 29 (16.0%) |
| 65 to 74 Years | 75 (86.2%) | 20 (23.0%) |
| 75 Years and over | 53 (100.0%) | 9 (17.0%) |
| Total | 704 (37.9%) | 473 (25.4%) |
Disability Status by Sex by Age in Buffalo County
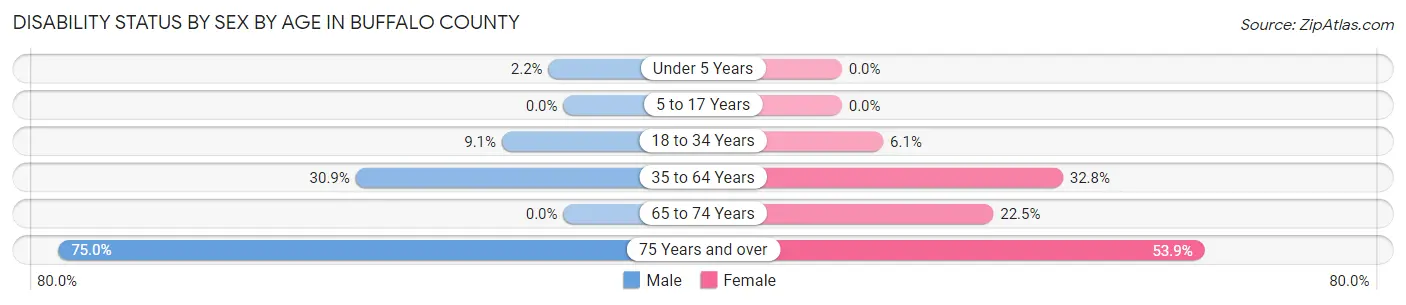
| Age Bracket | Male | Female |
| Under 5 Years | 3 (2.2%) | 0 (0.0%) |
| 5 to 17 Years | 0 (0.0%) | 0 (0.0%) |
| 18 to 34 Years | 21 (9.1%) | 14 (6.1%) |
| 35 to 64 Years | 91 (30.8%) | 85 (32.8%) |
| 65 to 74 Years | 0 (0.0%) | 9 (22.5%) |
| 75 Years and over | 30 (75.0%) | 7 (53.8%) |
Disability Class by Sex by Age in Buffalo County
Disability Class: Hearing Difficulty
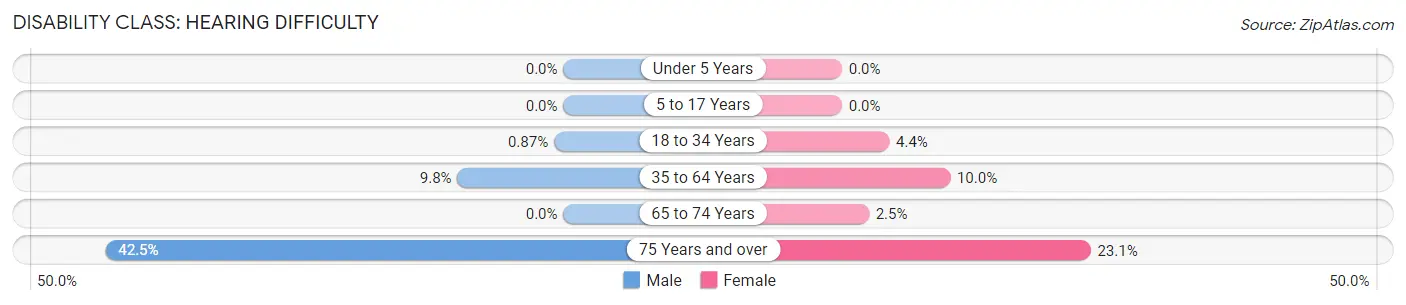
| Age Bracket | Male | Female |
| Under 5 Years | 0 (0.0%) | 0 (0.0%) |
| 5 to 17 Years | 0 (0.0%) | 0 (0.0%) |
| 18 to 34 Years | 2 (0.9%) | 10 (4.4%) |
| 35 to 64 Years | 29 (9.8%) | 26 (10.0%) |
| 65 to 74 Years | 0 (0.0%) | 1 (2.5%) |
| 75 Years and over | 17 (42.5%) | 3 (23.1%) |
Disability Class: Vision Difficulty

| Age Bracket | Male | Female |
| Under 5 Years | 3 (2.2%) | 0 (0.0%) |
| 5 to 17 Years | 0 (0.0%) | 0 (0.0%) |
| 18 to 34 Years | 3 (1.3%) | 7 (3.1%) |
| 35 to 64 Years | 45 (15.2%) | 21 (8.1%) |
| 65 to 74 Years | 0 (0.0%) | 0 (0.0%) |
| 75 Years and over | 0 (0.0%) | 0 (0.0%) |
Disability Class: Cognitive Difficulty

| Age Bracket | Male | Female |
| 5 to 17 Years | 0 (0.0%) | 0 (0.0%) |
| 18 to 34 Years | 19 (8.3%) | 7 (3.1%) |
| 35 to 64 Years | 28 (9.5%) | 13 (5.0%) |
| 65 to 74 Years | 0 (0.0%) | 0 (0.0%) |
| 75 Years and over | 0 (0.0%) | 0 (0.0%) |
Disability Class: Ambulatory Difficulty
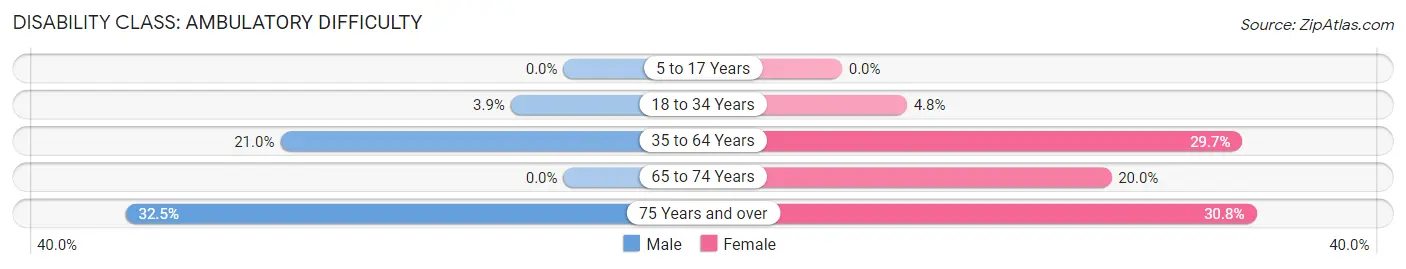
| Age Bracket | Male | Female |
| 5 to 17 Years | 0 (0.0%) | 0 (0.0%) |
| 18 to 34 Years | 9 (3.9%) | 11 (4.8%) |
| 35 to 64 Years | 62 (21.0%) | 77 (29.7%) |
| 65 to 74 Years | 0 (0.0%) | 8 (20.0%) |
| 75 Years and over | 13 (32.5%) | 4 (30.8%) |
Disability Class: Self-Care Difficulty

| Age Bracket | Male | Female |
| 5 to 17 Years | 0 (0.0%) | 0 (0.0%) |
| 18 to 34 Years | 9 (3.9%) | 7 (3.1%) |
| 35 to 64 Years | 16 (5.4%) | 23 (8.9%) |
| 65 to 74 Years | 0 (0.0%) | 0 (0.0%) |
| 75 Years and over | 3 (7.5%) | 0 (0.0%) |
Technology Access in Buffalo County
Computing Device Access in Buffalo County

| Device Type | # Households | % Households |
| Desktop or Laptop | 178 | 36.2% |
| Smartphone | 332 | 67.5% |
| Tablet | 171 | 34.8% |
| No Computing Device | 119 | 24.2% |
| Total | 492 | 100.0% |
Internet Access in Buffalo County
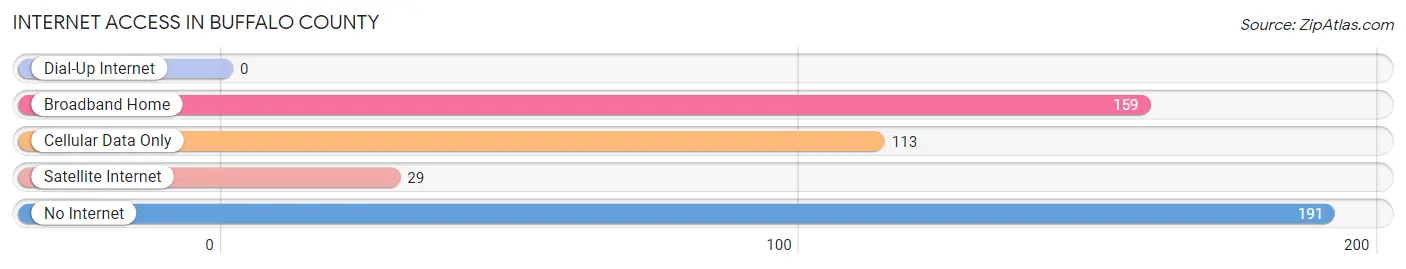
| Internet Type | # Households | % Households |
| Dial-Up Internet | 0 | 0.0% |
| Broadband Home | 159 | 32.3% |
| Cellular Data Only | 113 | 23.0% |
| Satellite Internet | 29 | 5.9% |
| No Internet | 191 | 38.8% |
| Total | 492 | 100.0% |
Buffalo County Summary
Buffalo County, South Dakota is located in the southeastern corner of the state and is bordered by the Missouri River to the east and the James River to the west. The county seat is Gann Valley, and the county is home to a population of just over 2,000 people.
Buffalo County was established in 1873 and was named after the buffalo that roamed the area. The county was originally part of the Dakota Territory, and it was one of the original counties in the state when South Dakota became a state in 1889.
Geography
Buffalo County is located in the southeastern corner of South Dakota and is bordered by the Missouri River to the east and the James River to the west. The county covers an area of 1,072 square miles and is mostly rural, with only a few small towns and villages. The terrain is mostly flat, with rolling hills in the western part of the county. The highest point in the county is located in the western part of the county, at an elevation of 1,890 feet.
The county is home to several lakes, including Lake Oahe, which is the largest lake in the state. The lake is a popular destination for fishing, boating, and other recreational activities.
Economy
The economy of Buffalo County is largely based on agriculture. The county is home to several large farms, and the main crops grown in the area are corn, soybeans, and wheat. The county is also home to several small businesses, including restaurants, retail stores, and other services.
The county is also home to several manufacturing companies, including a large meat processing plant and a furniture factory. The county is also home to several wind farms, which provide renewable energy to the area.
Demographics
As of the 2010 census, the population of Buffalo County was 2,072. The population is mostly white, with a small percentage of African Americans, Native Americans, and other races. The median household income in the county is $41,000, and the median age is 44.
The county is home to several small towns and villages, including Gann Valley, Fort Thompson, and White Lake. The county is also home to several Native American reservations, including the Lower Brule Sioux Reservation and the Crow Creek Sioux Reservation.
Conclusion
Buffalo County, South Dakota is a rural county located in the southeastern corner of the state. The county is home to a population of just over 2,000 people, and the economy is largely based on agriculture. The county is also home to several small towns and villages, as well as several Native American reservations. The county is a popular destination for fishing, boating, and other recreational activities, and it is home to several wind farms, which provide renewable energy to the area.
Common Questions
What is the Total Population of Buffalo County?
Total Population of Buffalo County is 1,859.
What is the Total Male Population of Buffalo County?
Total Male Population of Buffalo County is 992.
What is the Total Female Population of Buffalo County?
Total Female Population of Buffalo County is 867.
What is the Ratio of Males per 100 Females in Buffalo County?
There are 114.42 Males per 100 Females in Buffalo County.
What is the Ratio of Females per 100 Males in Buffalo County?
There are 87.40 Females per 100 Males in Buffalo County.
What is the Median Population Age in Buffalo County?
Median Population Age in Buffalo County is 24.0 Years.
What is the Average Family Size in Buffalo County
Average Family Size in Buffalo County is 4.7 People.
What is the Average Household Size in Buffalo County
Average Household Size in Buffalo County is 3.8 People.
What is Per Capita Income in Buffalo County?
Per Capita income in Buffalo County is $13,731.
What is the Median Family Income in Buffalo County?
Median Family Income in Buffalo County is $44,297.
What is the Median Household income in Buffalo County?
Median Household Income in Buffalo County is $42,917.
What is Income or Wage Gap in Buffalo County?
Income or Wage Gap in Buffalo County is 6.4%.
Women in Buffalo County earn 93.6 cents for every dollar earned by a man.
What is Family Income Deficit in Buffalo County?
Family Income Deficit in Buffalo County is $18,844.
Families that are below poverty line in Buffalo County earn $18,844 less on average than the poverty threshold level.
What is Inequality or Gini Index in Buffalo County?
Inequality or Gini Index in Buffalo County is 0.47.
How Large is the Labor Force in Buffalo County?
There are 696 People in the Labor Forcein in Buffalo County.
What is the Percentage of People in the Labor Force in Buffalo County?
56.0% of People are in the Labor Force in Buffalo County.
What is the Unemployment Rate in Buffalo County?
Unemployment Rate in Buffalo County is 14.9%.