Brule County, SD
Brule County Map
Brule County Overview
5,247
TOTAL POPULATION
2,676
MALE POPULATION
2,571
FEMALE POPULATION
104.08
MALES / 100 FEMALES
96.08
FEMALES / 100 MALES
41.5
MEDIAN AGE
3.3
AVG FAMILY SIZE
2.5
AVG HOUSEHOLD SIZE
$34,629
PER CAPITA INCOME
$86,071
AVG FAMILY INCOME
$64,821
AVG HOUSEHOLD INCOME
29.7%
WAGE / INCOME GAP [ % ]
70.3¢/ $1
WAGE / INCOME GAP [ $ ]
0.44
INEQUALITY / GINI INDEX
2,745
LABOR FORCE [ PEOPLE ]
66.1%
PERCENT IN LABOR FORCE
3.2%
UNEMPLOYMENT RATE
Brule County Area Codes
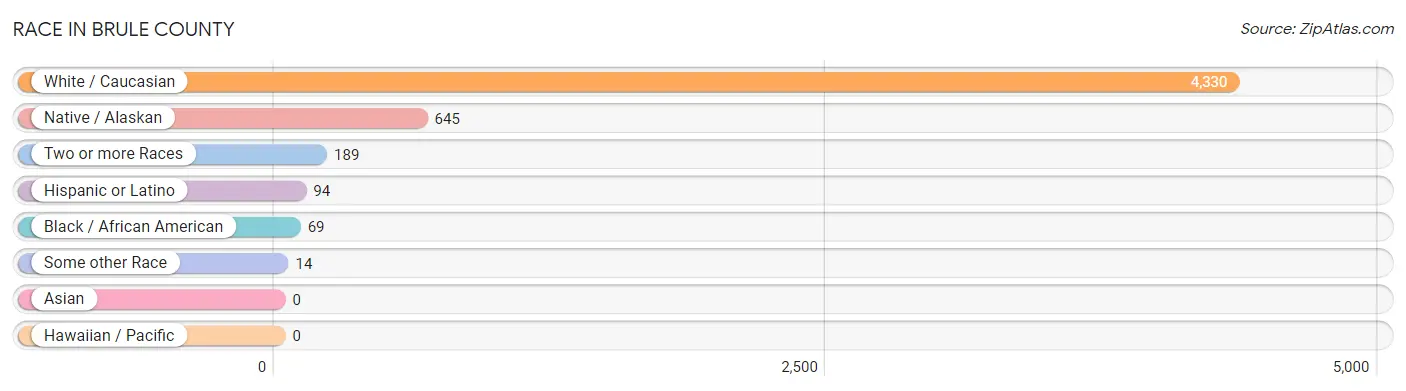
Race in Brule County
The most populous races in Brule County are White / Caucasian (4,330 | 82.5%), Native / Alaskan (645 | 12.3%), and Two or more Races (189 | 3.6%).
| Race | # Population | % Population |
| Asian | 0 | 0.0% |
| Black / African American | 69 | 1.3% |
| Hawaiian / Pacific | 0 | 0.0% |
| Hispanic or Latino | 94 | 1.8% |
| Native / Alaskan | 645 | 12.3% |
| White / Caucasian | 4,330 | 82.5% |
| Two or more Races | 189 | 3.6% |
| Some other Race | 14 | 0.3% |
| Total | 5,247 | 100.0% |
Ancestry in Brule County
The most populous ancestries reported in Brule County are German (1,633 | 31.1%), Sioux (560 | 10.7%), Irish (505 | 9.6%), Czech (440 | 8.4%), and American (390 | 7.4%), together accounting for 67.2% of all Brule County residents.

| Ancestry | # Population | % Population |
| American | 390 | 7.4% |
| Apache | 1 | 0.0% |
| Arab | 28 | 0.5% |
| Austrian | 1 | 0.0% |
| British | 2 | 0.0% |
| Celtic | 3 | 0.1% |
| Cherokee | 6 | 0.1% |
| Chippewa | 94 | 1.8% |
| Crow | 21 | 0.4% |
| Czech | 440 | 8.4% |
| Czechoslovakian | 3 | 0.1% |
| Danish | 76 | 1.5% |
| Dutch | 186 | 3.5% |
| Eastern European | 4 | 0.1% |
| English | 261 | 5.0% |
| European | 124 | 2.4% |
| Finnish | 6 | 0.1% |
| French | 42 | 0.8% |
| French Canadian | 22 | 0.4% |
| German | 1,633 | 31.1% |
| Greek | 4 | 0.1% |
| Irish | 505 | 9.6% |
| Iroquois | 107 | 2.0% |
| Italian | 23 | 0.4% |
| Korean | 11 | 0.2% |
| Mexican | 89 | 1.7% |
| Norwegian | 324 | 6.2% |
| Pennsylvania German | 3 | 0.1% |
| Polish | 38 | 0.7% |
| Russian | 14 | 0.3% |
| Scandinavian | 4 | 0.1% |
| Scotch-Irish | 14 | 0.3% |
| Scottish | 60 | 1.1% |
| Sioux | 560 | 10.7% |
| Spanish | 5 | 0.1% |
| Swedish | 115 | 2.2% |
| Swiss | 11 | 0.2% |
| Welsh | 6 | 0.1% | View All 38 Rows |
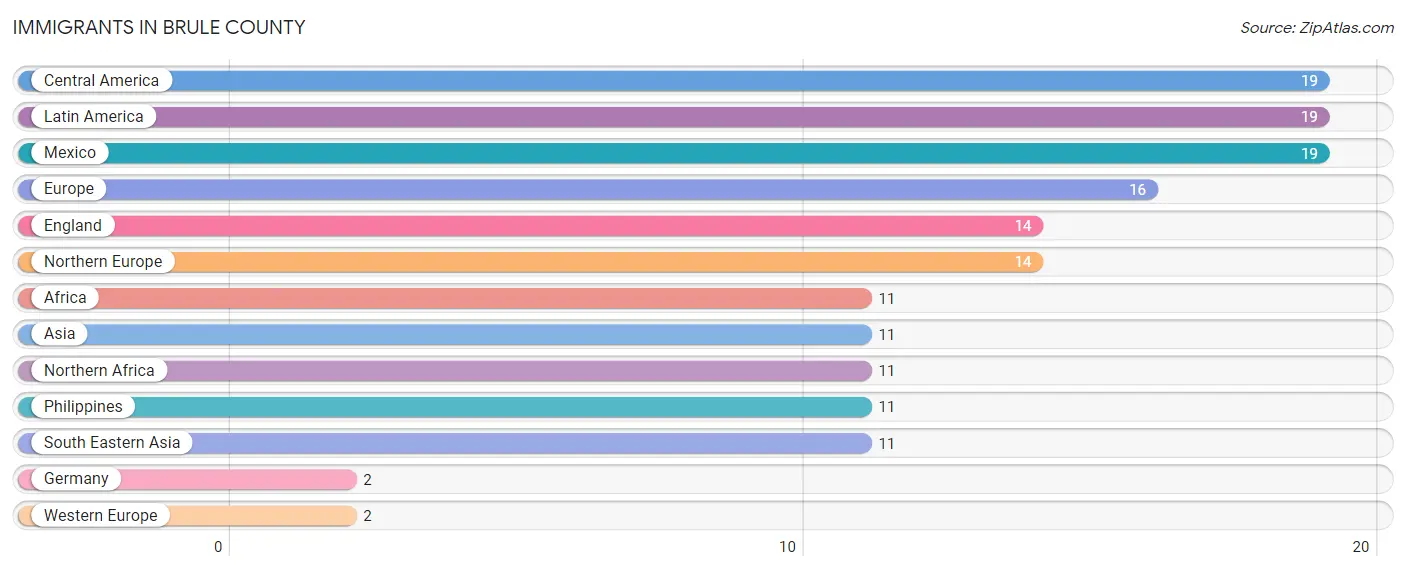
Immigrants in Brule County
The most numerous immigrant groups reported in Brule County came from Central America (19 | 0.4%), Latin America (19 | 0.4%), Mexico (19 | 0.4%), Europe (16 | 0.3%), and England (14 | 0.3%), together accounting for 1.7% of all Brule County residents.
| Immigration Origin | # Population | % Population |
| Africa | 11 | 0.2% |
| Asia | 11 | 0.2% |
| Central America | 19 | 0.4% |
| England | 14 | 0.3% |
| Europe | 16 | 0.3% |
| Germany | 2 | 0.0% |
| Latin America | 19 | 0.4% |
| Mexico | 19 | 0.4% |
| Northern Africa | 11 | 0.2% |
| Northern Europe | 14 | 0.3% |
| Philippines | 11 | 0.2% |
| South Eastern Asia | 11 | 0.2% |
| Western Europe | 2 | 0.0% | View All 13 Rows |
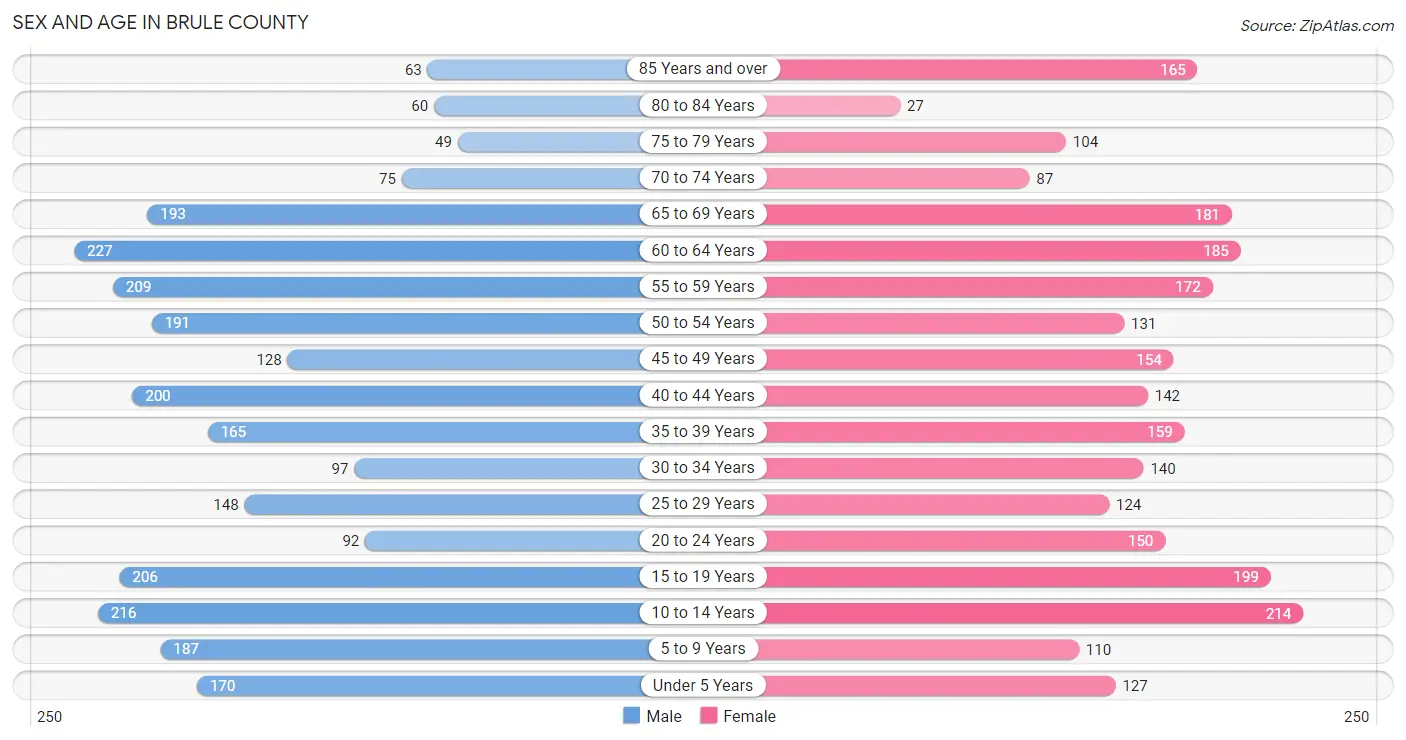
Sex and Age in Brule County
Sex and Age in Brule County
The most populous age groups in Brule County are 60 to 64 Years (227 | 8.5%) for men and 10 to 14 Years (214 | 8.3%) for women.
| Age Bracket | Male | Female |
| Under 5 Years | 170 (6.4%) | 127 (4.9%) |
| 5 to 9 Years | 187 (7.0%) | 110 (4.3%) |
| 10 to 14 Years | 216 (8.1%) | 214 (8.3%) |
| 15 to 19 Years | 206 (7.7%) | 199 (7.7%) |
| 20 to 24 Years | 92 (3.4%) | 150 (5.8%) |
| 25 to 29 Years | 148 (5.5%) | 124 (4.8%) |
| 30 to 34 Years | 97 (3.6%) | 140 (5.4%) |
| 35 to 39 Years | 165 (6.2%) | 159 (6.2%) |
| 40 to 44 Years | 200 (7.5%) | 142 (5.5%) |
| 45 to 49 Years | 128 (4.8%) | 154 (6.0%) |
| 50 to 54 Years | 191 (7.1%) | 131 (5.1%) |
| 55 to 59 Years | 209 (7.8%) | 172 (6.7%) |
| 60 to 64 Years | 227 (8.5%) | 185 (7.2%) |
| 65 to 69 Years | 193 (7.2%) | 181 (7.0%) |
| 70 to 74 Years | 75 (2.8%) | 87 (3.4%) |
| 75 to 79 Years | 49 (1.8%) | 104 (4.1%) |
| 80 to 84 Years | 60 (2.2%) | 27 (1.1%) |
| 85 Years and over | 63 (2.4%) | 165 (6.4%) |
| Total | 2,676 (100.0%) | 2,571 (100.0%) |
Families and Households in Brule County
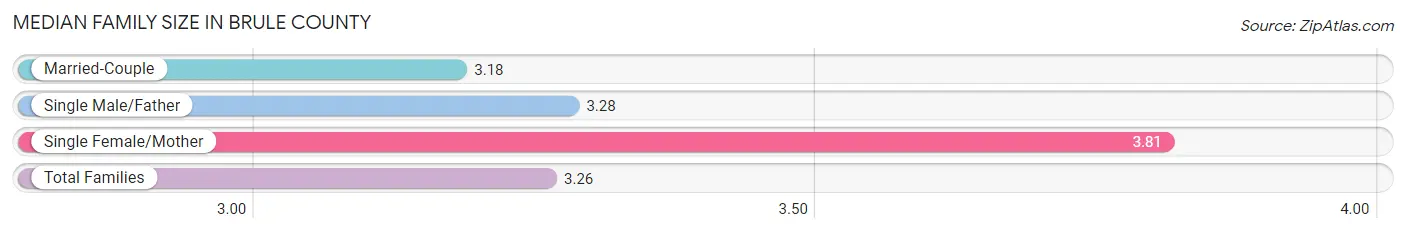
Median Family Size in Brule County
The median family size in Brule County is 3.26 persons per family, with single female/mother families (136 | 11.2%) accounting for the largest median family size of 3.81 persons per family. On the other hand, married-couple families (992 | 81.4%) represent the smallest median family size with 3.18 persons per family.
| Family Type | # Families | Family Size |
| Married-Couple | 992 (81.4%) | 3.18 |
| Single Male/Father | 90 (7.4%) | 3.28 |
| Single Female/Mother | 136 (11.2%) | 3.81 |
| Total Families | 1,218 (100.0%) | 3.26 |
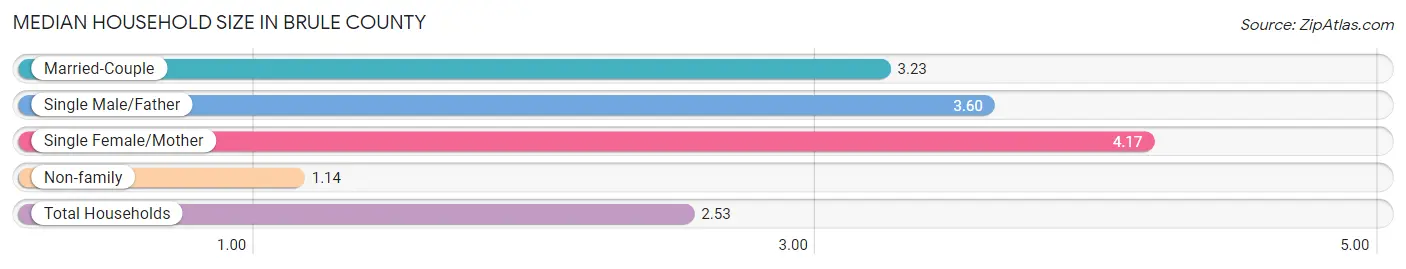
Median Household Size in Brule County
The median household size in Brule County is 2.53 persons per household, with single female/mother households (136 | 7.0%) accounting for the largest median household size of 4.17 persons per household. non-family households (740 | 37.8%) represent the smallest median household size with 1.14 persons per household.
| Household Type | # Households | Household Size |
| Married-Couple | 992 (50.7%) | 3.23 |
| Single Male/Father | 90 (4.6%) | 3.60 |
| Single Female/Mother | 136 (7.0%) | 4.17 |
| Non-family | 740 (37.8%) | 1.14 |
| Total Households | 1,958 (100.0%) | 2.53 |
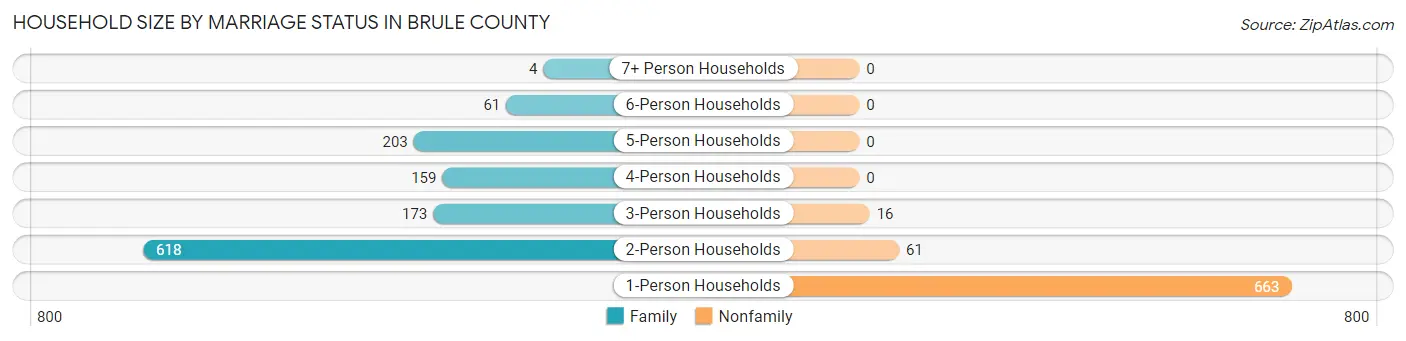
Household Size by Marriage Status in Brule County
Out of a total of 1,958 households in Brule County, 1,218 (62.2%) are family households, while 740 (37.8%) are nonfamily households. The most numerous type of family households are 2-person households, comprising 618, and the most common type of nonfamily households are 1-person households, comprising 663.
| Household Size | Family Households | Nonfamily Households |
| 1-Person Households | - | 663 (33.9%) |
| 2-Person Households | 618 (31.6%) | 61 (3.1%) |
| 3-Person Households | 173 (8.8%) | 16 (0.8%) |
| 4-Person Households | 159 (8.1%) | 0 (0.0%) |
| 5-Person Households | 203 (10.4%) | 0 (0.0%) |
| 6-Person Households | 61 (3.1%) | 0 (0.0%) |
| 7+ Person Households | 4 (0.2%) | 0 (0.0%) |
| Total | 1,218 (62.2%) | 740 (37.8%) |
Female Fertility in Brule County
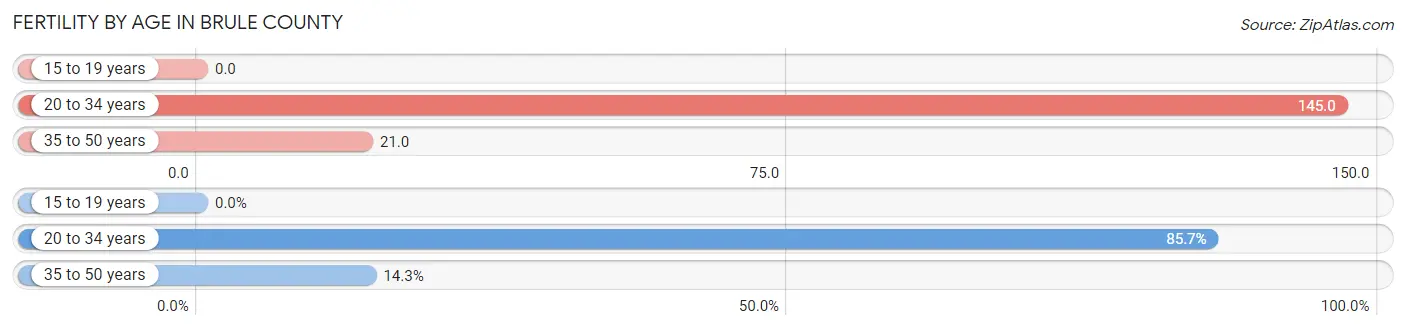
Fertility by Age in Brule County
Average fertility rate in Brule County is 64.0 births per 1,000 women. Women in the age bracket of 20 to 34 years have the highest fertility rate with 145.0 births per 1,000 women. Women in the age bracket of 20 to 34 years acount for 85.7% of all women with births.
| Age Bracket | Women with Births | Births / 1,000 Women |
| 15 to 19 years | 0 (0.0%) | 0.0 |
| 20 to 34 years | 60 (85.7%) | 145.0 |
| 35 to 50 years | 10 (14.3%) | 21.0 |
| Total | 70 (100.0%) | 64.0 |
Fertility by Age by Marriage Status in Brule County
70.0% of women with births (70) in Brule County are married. The highest percentage of unmarried women with births falls into 20 to 34 years age bracket with 30.0% of them unmarried at the time of birth, while the lowest percentage of unmarried women with births belong to 20 to 34 years age bracket with 30.0% of them unmarried.
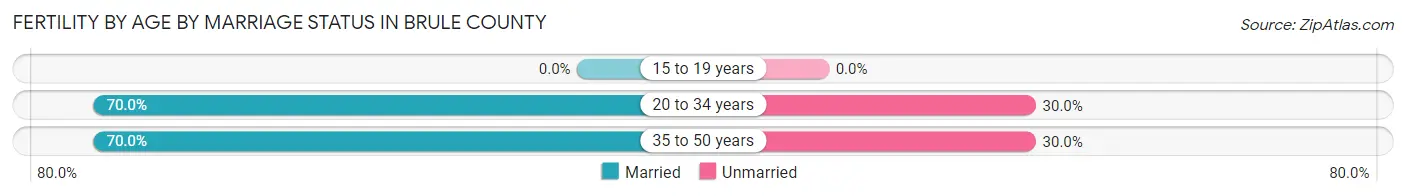
| Age Bracket | Married | Unmarried |
| 15 to 19 years | 0 (0.0%) | 0 (0.0%) |
| 20 to 34 years | 42 (70.0%) | 18 (30.0%) |
| 35 to 50 years | 7 (70.0%) | 3 (30.0%) |
| Total | 49 (70.0%) | 21 (30.0%) |
Fertility by Education in Brule County
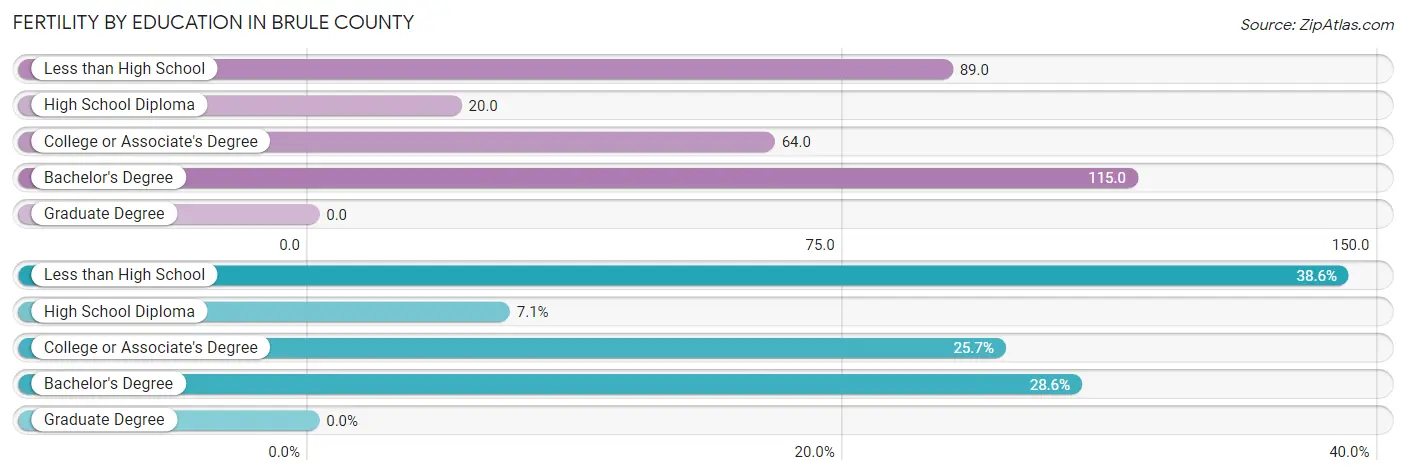
| Educational Attainment | Women with Births | Births / 1,000 Women |
| Less than High School | 27 (38.6%) | 89.0 |
| High School Diploma | 5 (7.1%) | 20.0 |
| College or Associate's Degree | 18 (25.7%) | 64.0 |
| Bachelor's Degree | 20 (28.6%) | 115.0 |
| Graduate Degree | 0 (0.0%) | 0.0 |
| Total | 70 (100.0%) | 64.0 |
Fertility by Education by Marriage Status in Brule County
30.0% of women with births in Brule County are unmarried. Women with the educational attainment of less than high school are most likely to be married with 100.0% of them married at childbirth, while women with the educational attainment of high school diploma are least likely to be married with 100.0% of them unmarried at childbirth.
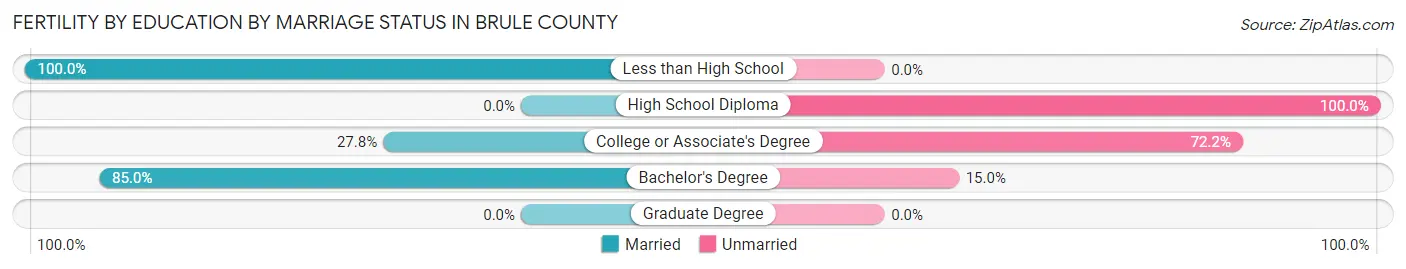
| Educational Attainment | Married | Unmarried |
| Less than High School | 27 (100.0%) | 0 (0.0%) |
| High School Diploma | 0 (0.0%) | 5 (100.0%) |
| College or Associate's Degree | 5 (27.8%) | 13 (72.2%) |
| Bachelor's Degree | 17 (85.0%) | 3 (15.0%) |
| Graduate Degree | 0 (0.0%) | 0 (0.0%) |
| Total | 49 (70.0%) | 21 (30.0%) |
Income in Brule County
Income Overview in Brule County
Per Capita Income in Brule County is $34,629, while median incomes of families and households are $86,071 and $64,821 respectively.
| Characteristic | Number | Measure |
| Per Capita Income | 5,247 | $34,629 |
| Median Family Income | 1,218 | $86,071 |
| Mean Family Income | 1,218 | $105,363 |
| Median Household Income | 1,958 | $64,821 |
| Mean Household Income | 1,958 | $84,452 |
| Income Deficit | 1,218 | $0 |
| Wage / Income Gap (%) | 5,247 | 29.70% |
| Wage / Income Gap ($) | 5,247 | 70.30¢ per $1 |
| Gini / Inequality Index | 5,247 | 0.44 |
Earnings by Sex in Brule County
Average Earnings in Brule County are $33,966, $41,060 for men and $28,864 for women, a difference of 29.7%.
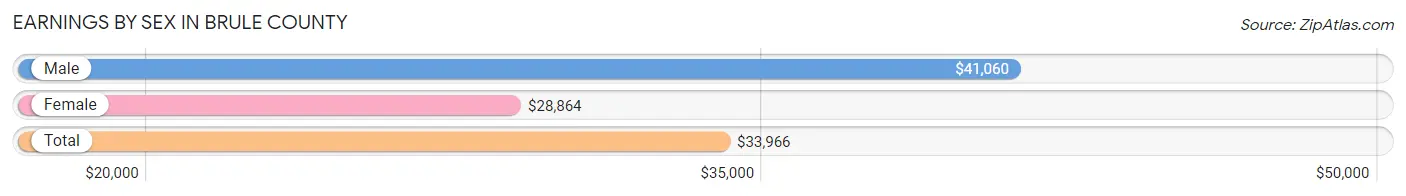
| Sex | Number | Average Earnings |
| Male | 1,625 (54.4%) | $41,060 |
| Female | 1,364 (45.6%) | $28,864 |
| Total | 2,989 (100.0%) | $33,966 |
Earnings by Sex by Income Bracket in Brule County
The most common earnings brackets in Brule County are $100,000+ for men (221 | 13.6%) and $25,000 to $29,999 for women (131 | 9.6%).
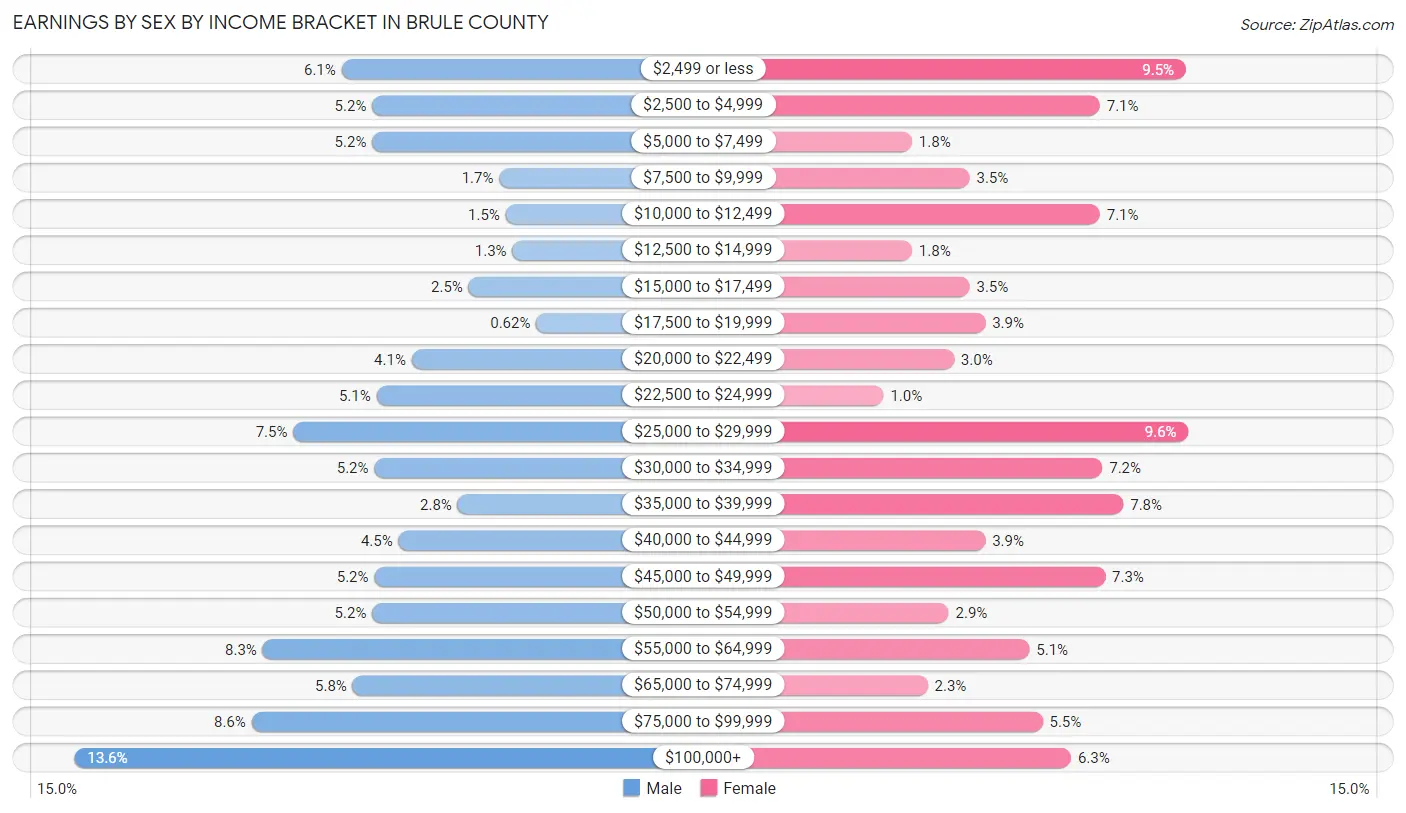
| Income | Male | Female |
| $2,499 or less | 99 (6.1%) | 130 (9.5%) |
| $2,500 to $4,999 | 85 (5.2%) | 97 (7.1%) |
| $5,000 to $7,499 | 85 (5.2%) | 25 (1.8%) |
| $7,500 to $9,999 | 27 (1.7%) | 47 (3.5%) |
| $10,000 to $12,499 | 24 (1.5%) | 97 (7.1%) |
| $12,500 to $14,999 | 21 (1.3%) | 25 (1.8%) |
| $15,000 to $17,499 | 41 (2.5%) | 47 (3.5%) |
| $17,500 to $19,999 | 10 (0.6%) | 53 (3.9%) |
| $20,000 to $22,499 | 67 (4.1%) | 41 (3.0%) |
| $22,500 to $24,999 | 83 (5.1%) | 14 (1.0%) |
| $25,000 to $29,999 | 121 (7.4%) | 131 (9.6%) |
| $30,000 to $34,999 | 84 (5.2%) | 98 (7.2%) |
| $35,000 to $39,999 | 46 (2.8%) | 106 (7.8%) |
| $40,000 to $44,999 | 73 (4.5%) | 53 (3.9%) |
| $45,000 to $49,999 | 84 (5.2%) | 99 (7.3%) |
| $50,000 to $54,999 | 85 (5.2%) | 39 (2.9%) |
| $55,000 to $64,999 | 135 (8.3%) | 70 (5.1%) |
| $65,000 to $74,999 | 94 (5.8%) | 31 (2.3%) |
| $75,000 to $99,999 | 140 (8.6%) | 75 (5.5%) |
| $100,000+ | 221 (13.6%) | 86 (6.3%) |
| Total | 1,625 (100.0%) | 1,364 (100.0%) |
Earnings by Sex by Educational Attainment in Brule County
Average earnings in Brule County are $47,442 for men and $36,116 for women, a difference of 23.9%. Men with an educational attainment of graduate degree enjoy the highest average annual earnings of $71,875, while those with less than high school education earn the least with $21,548. Women with an educational attainment of graduate degree earn the most with the average annual earnings of $62,679, while those with high school diploma education have the smallest earnings of $29,643.
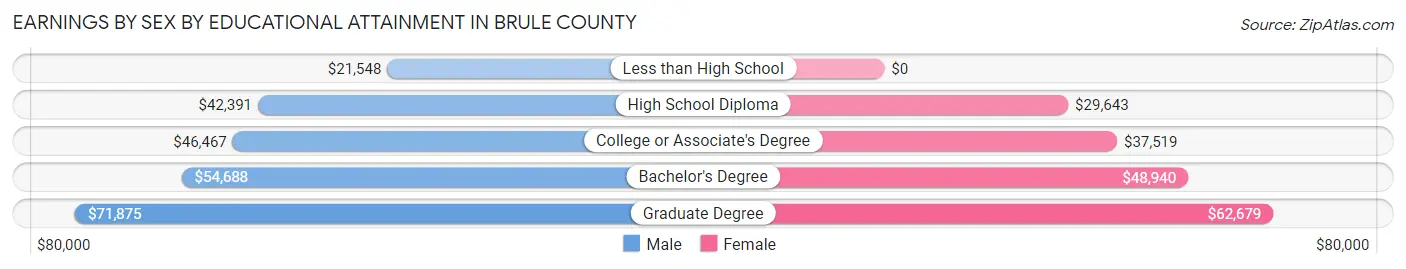
| Educational Attainment | Male Income | Female Income |
| Less than High School | $21,548 | $0 |
| High School Diploma | $42,391 | $29,643 |
| College or Associate's Degree | $46,467 | $37,519 |
| Bachelor's Degree | $54,688 | $48,940 |
| Graduate Degree | $71,875 | $62,679 |
| Total | $47,442 | $36,116 |
Family Income in Brule County
Family Income Brackets in Brule County
According to the Brule County family income data, there are 244 families falling into the $100,000 to $149,999 income range, which is the most common income bracket and makes up 20.0% of all families. Conversely, the $10,000 to $14,999 income bracket is the least frequent group with only 5 families (0.4%) belonging to this category.
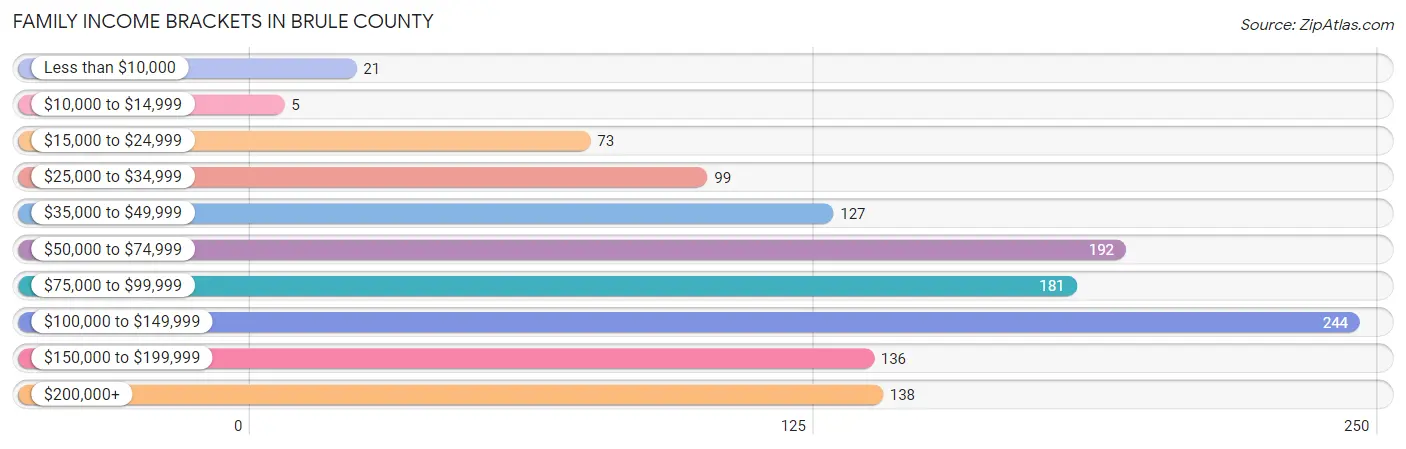
| Income Bracket | # Families | % Families |
| Less than $10,000 | 21 | 1.7% |
| $10,000 to $14,999 | 5 | 0.4% |
| $15,000 to $24,999 | 73 | 6.0% |
| $25,000 to $34,999 | 99 | 8.1% |
| $35,000 to $49,999 | 127 | 10.4% |
| $50,000 to $74,999 | 192 | 15.8% |
| $75,000 to $99,999 | 181 | 14.9% |
| $100,000 to $149,999 | 244 | 20.0% |
| $150,000 to $199,999 | 136 | 11.2% |
| $200,000+ | 138 | 11.3% |
Family Income by Famaliy Size in Brule County
4-person families (148 | 12.1%) account for the highest median family income in Brule County with $116,500 per family, while 2-person families (644 | 52.9%) have the highest median income of $43,360 per family member.
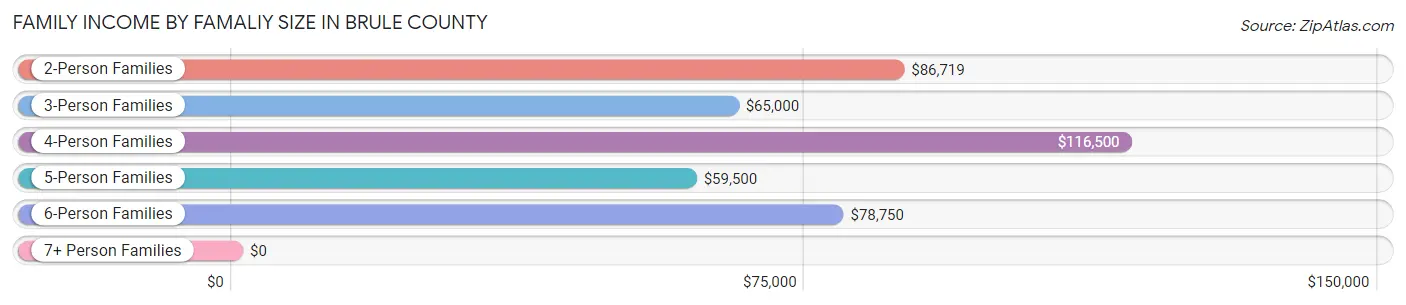
| Income Bracket | # Families | Median Income |
| 2-Person Families | 644 (52.9%) | $86,719 |
| 3-Person Families | 174 (14.3%) | $65,000 |
| 4-Person Families | 148 (12.1%) | $116,500 |
| 5-Person Families | 196 (16.1%) | $59,500 |
| 6-Person Families | 52 (4.3%) | $78,750 |
| 7+ Person Families | 4 (0.3%) | $0 |
| Total | 1,218 (100.0%) | $86,071 |
Family Income by Number of Earners in Brule County
The median family income in Brule County is $86,071, with families comprising 3+ earners (188) having the highest median family income of $137,667, while families with 1 earner (355) have the lowest median family income of $41,442, accounting for 15.4% and 29.1% of families, respectively.
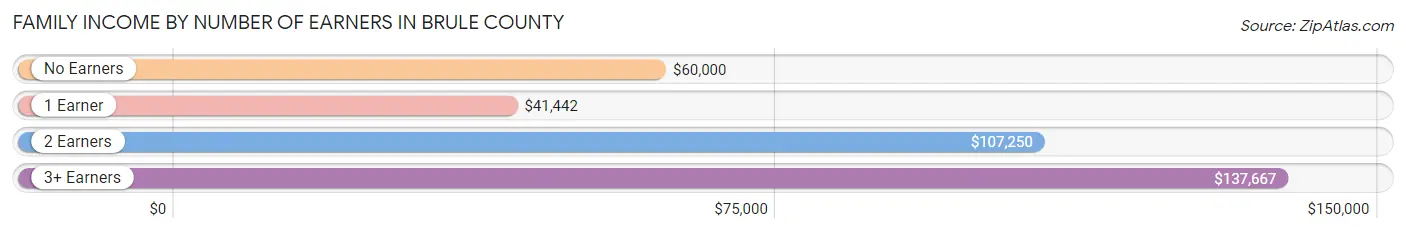
| Number of Earners | # Families | Median Income |
| No Earners | 98 (8.1%) | $60,000 |
| 1 Earner | 355 (29.1%) | $41,442 |
| 2 Earners | 577 (47.4%) | $107,250 |
| 3+ Earners | 188 (15.4%) | $137,667 |
| Total | 1,218 (100.0%) | $86,071 |
Household Income in Brule County
Household Income Brackets in Brule County
With 335 households falling in the category, the $100,000 to $149,999 income range is the most frequent in Brule County, accounting for 17.1% of all households. In contrast, only 76 households (3.9%) fall into the $10,000 to $14,999 income bracket, making it the least populous group.
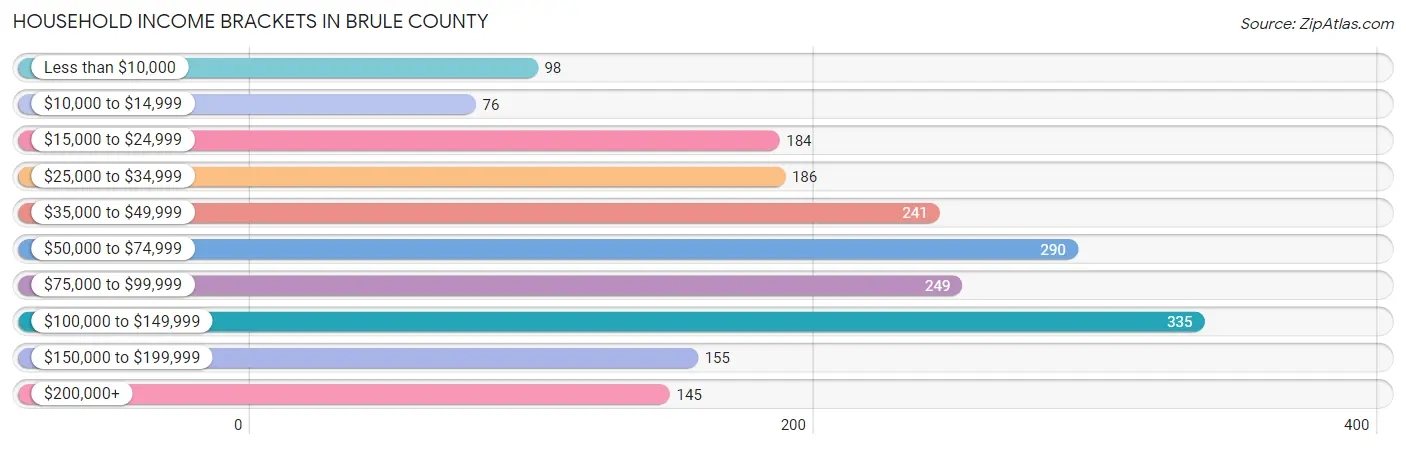
| Income Bracket | # Households | % Households |
| Less than $10,000 | 98 | 5.0% |
| $10,000 to $14,999 | 76 | 3.9% |
| $15,000 to $24,999 | 184 | 9.4% |
| $25,000 to $34,999 | 186 | 9.5% |
| $35,000 to $49,999 | 241 | 12.3% |
| $50,000 to $74,999 | 290 | 14.8% |
| $75,000 to $99,999 | 249 | 12.7% |
| $100,000 to $149,999 | 335 | 17.1% |
| $150,000 to $199,999 | 155 | 7.9% |
| $200,000+ | 145 | 7.4% |
Household Income by Householder Age in Brule County
The median household income in Brule County is $64,821, with the highest median household income of $86,420 found in the 45 to 64 years age bracket for the primary householder. A total of 737 households (37.6%) fall into this category. Meanwhile, the 15 to 24 years age bracket for the primary householder has the lowest median household income of $40,500, with 30 households (1.5%) in this group.

| Income Bracket | # Households | Median Income |
| 15 to 24 Years | 30 (1.5%) | $40,500 |
| 25 to 44 Years | 529 (27.0%) | $57,481 |
| 45 to 64 Years | 737 (37.6%) | $86,420 |
| 65+ Years | 662 (33.8%) | $48,438 |
| Total | 1,958 (100.0%) | $64,821 |
Poverty in Brule County
Income Below Poverty by Sex and Age in Brule County
With 12.7% poverty level for males and 15.2% for females among the residents of Brule County, 12 to 14 year old males and under 5 year old females are the most vulnerable to poverty, with 33 males (24.8%) and 58 females (45.7%) in their respective age groups living below the poverty level.
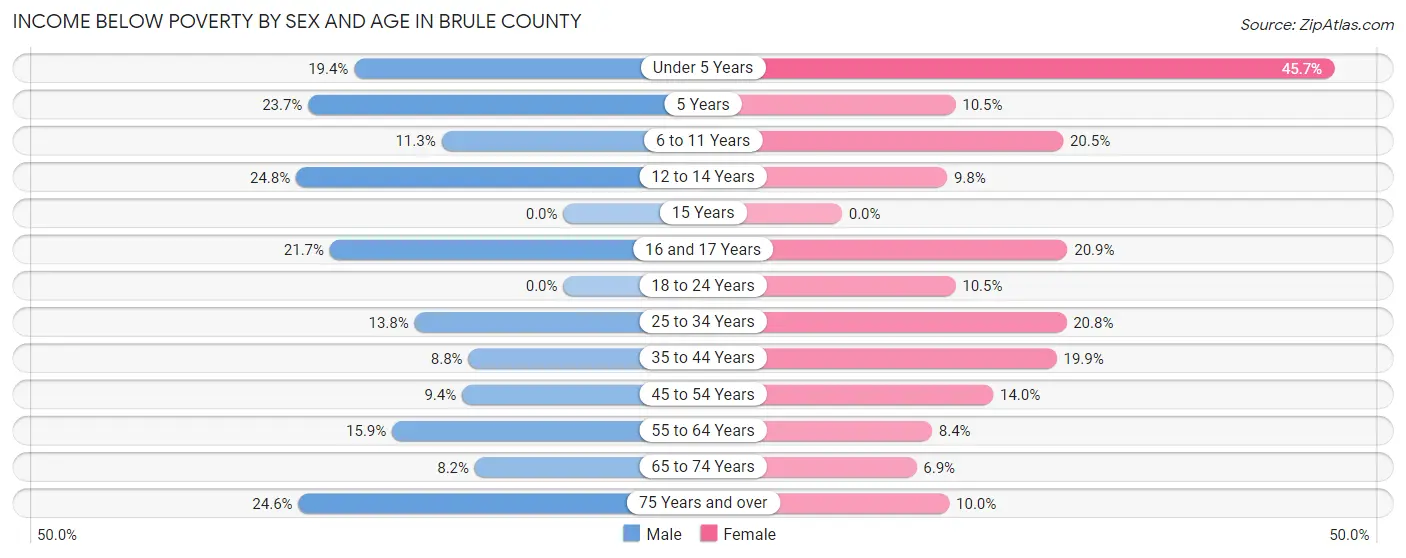
| Age Bracket | Male | Female |
| Under 5 Years | 33 (19.4%) | 58 (45.7%) |
| 5 Years | 9 (23.7%) | 4 (10.5%) |
| 6 to 11 Years | 25 (11.3%) | 31 (20.5%) |
| 12 to 14 Years | 33 (24.8%) | 12 (9.8%) |
| 15 Years | 0 (0.0%) | 0 (0.0%) |
| 16 and 17 Years | 13 (21.7%) | 27 (20.9%) |
| 18 to 24 Years | 0 (0.0%) | 20 (10.5%) |
| 25 to 34 Years | 33 (13.8%) | 55 (20.8%) |
| 35 to 44 Years | 31 (8.8%) | 60 (19.9%) |
| 45 to 54 Years | 30 (9.4%) | 40 (14.0%) |
| 55 to 64 Years | 68 (15.9%) | 29 (8.4%) |
| 65 to 74 Years | 22 (8.2%) | 18 (6.9%) |
| 75 Years and over | 30 (24.6%) | 26 (10.0%) |
| Total | 327 (12.7%) | 380 (15.2%) |
Income Above Poverty by Sex and Age in Brule County
According to the poverty statistics in Brule County, males aged 15 years and females aged 15 years are the age groups that are most secure financially, with 100.0% of males and 100.0% of females in these age groups living above the poverty line.
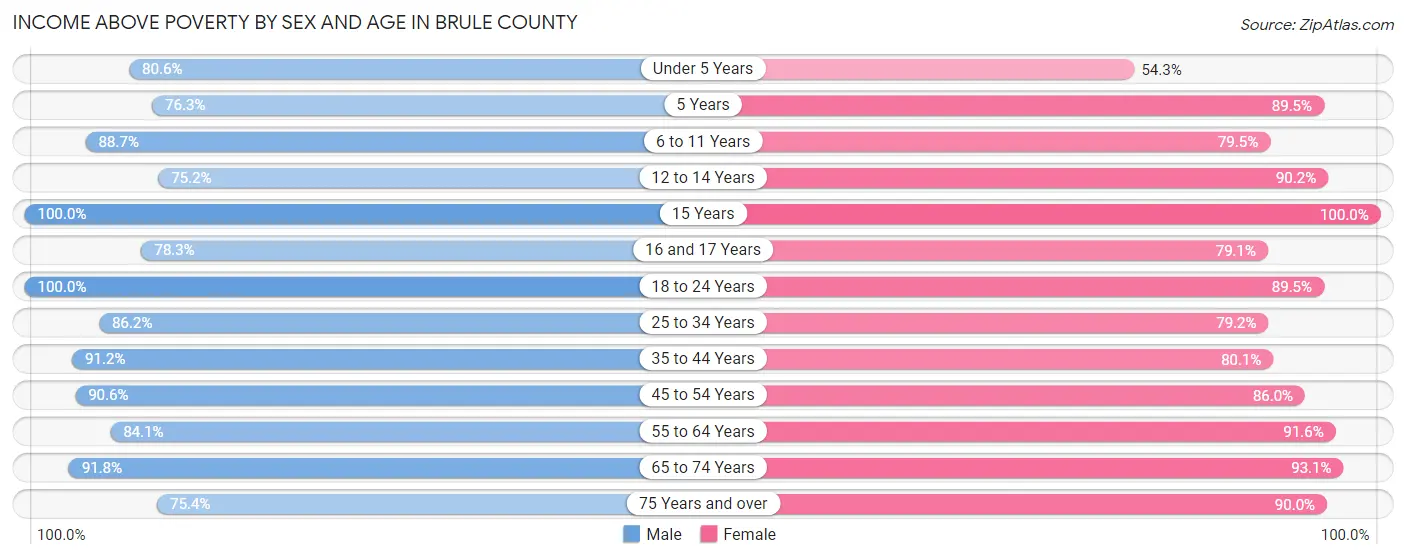
| Age Bracket | Male | Female |
| Under 5 Years | 137 (80.6%) | 69 (54.3%) |
| 5 Years | 29 (76.3%) | 34 (89.5%) |
| 6 to 11 Years | 196 (88.7%) | 120 (79.5%) |
| 12 to 14 Years | 100 (75.2%) | 111 (90.2%) |
| 15 Years | 45 (100.0%) | 25 (100.0%) |
| 16 and 17 Years | 47 (78.3%) | 102 (79.1%) |
| 18 to 24 Years | 180 (100.0%) | 170 (89.5%) |
| 25 to 34 Years | 206 (86.2%) | 209 (79.2%) |
| 35 to 44 Years | 321 (91.2%) | 241 (80.1%) |
| 45 to 54 Years | 289 (90.6%) | 245 (86.0%) |
| 55 to 64 Years | 360 (84.1%) | 318 (91.6%) |
| 65 to 74 Years | 246 (91.8%) | 242 (93.1%) |
| 75 Years and over | 92 (75.4%) | 235 (90.0%) |
| Total | 2,248 (87.3%) | 2,121 (84.8%) |
Income Below Poverty Among Married-Couple Families in Brule County
The poverty statistics for married-couple families in Brule County show that 6.6% or 65 of the total 992 families live below the poverty line. Families with 3 or 4 children have the highest poverty rate of 22.0%, comprising of 41 families. On the other hand, families with 1 or 2 children have the lowest poverty rate of 2.5%, which includes 7 families.
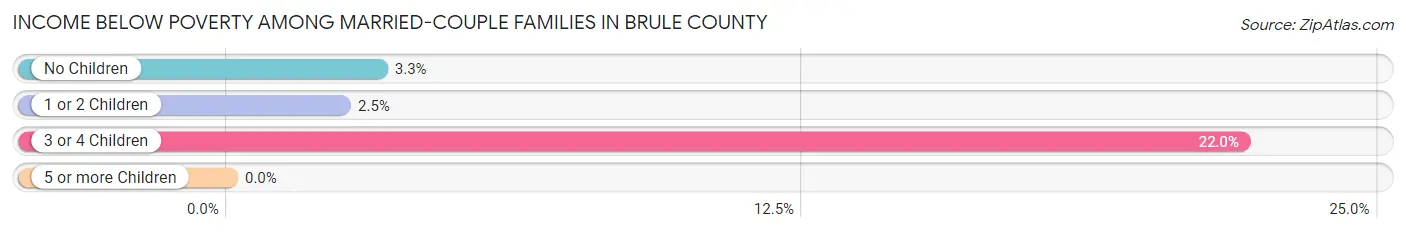
| Children | Above Poverty | Below Poverty |
| No Children | 505 (96.7%) | 17 (3.3%) |
| 1 or 2 Children | 277 (97.5%) | 7 (2.5%) |
| 3 or 4 Children | 145 (78.0%) | 41 (22.0%) |
| 5 or more Children | 0 (0.0%) | 0 (0.0%) |
| Total | 927 (93.4%) | 65 (6.6%) |
Income Below Poverty Among Single-Parent Households in Brule County
According to the poverty data in Brule County, 6.7% or 6 single-father households and 16.9% or 23 single-mother households are living below the poverty line. Among single-father households, those with 1 or 2 children have the highest poverty rate, with 6 households (10.9%) experiencing poverty. Likewise, among single-mother households, those with 1 or 2 children have the highest poverty rate, with 23 households (37.7%) falling below the poverty line.

| Children | Single Father | Single Mother |
| No Children | 0 (0.0%) | 0 (0.0%) |
| 1 or 2 Children | 6 (10.9%) | 23 (37.7%) |
| 3 or 4 Children | 0 (0.0%) | 0 (0.0%) |
| 5 or more Children | 0 (0.0%) | 0 (0.0%) |
| Total | 6 (6.7%) | 23 (16.9%) |
Income Below Poverty Among Married-Couple vs Single-Parent Households in Brule County
The poverty data for Brule County shows that 65 of the married-couple family households (6.6%) and 29 of the single-parent households (12.8%) are living below the poverty level. Within the married-couple family households, those with 3 or 4 children have the highest poverty rate, with 41 households (22.0%) falling below the poverty line. Among the single-parent households, those with 1 or 2 children have the highest poverty rate, with 29 household (25.0%) living below poverty.
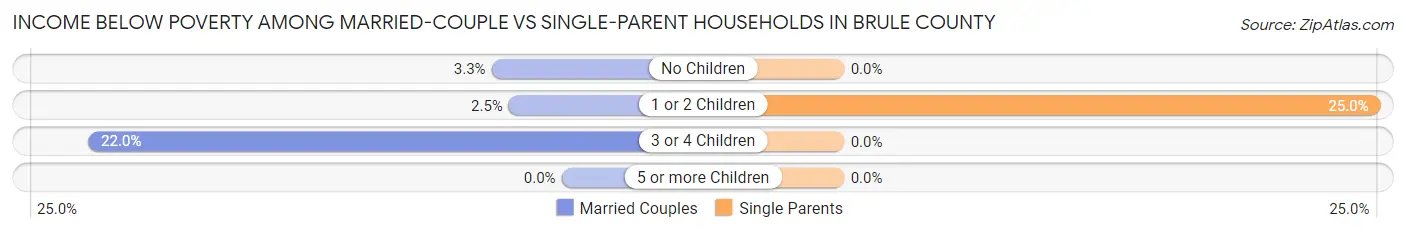
| Children | Married-Couple Families | Single-Parent Households |
| No Children | 17 (3.3%) | 0 (0.0%) |
| 1 or 2 Children | 7 (2.5%) | 29 (25.0%) |
| 3 or 4 Children | 41 (22.0%) | 0 (0.0%) |
| 5 or more Children | 0 (0.0%) | 0 (0.0%) |
| Total | 65 (6.6%) | 29 (12.8%) |
Employment Characteristics in Brule County
Employment by Class of Employer in Brule County
Among the 2,608 employed individuals in Brule County, private company employees (1,125 | 43.1%), not-for-profit organizations (431 | 16.5%), and self-employed (not incorporated) (419 | 16.1%) make up the most common classes of employment.
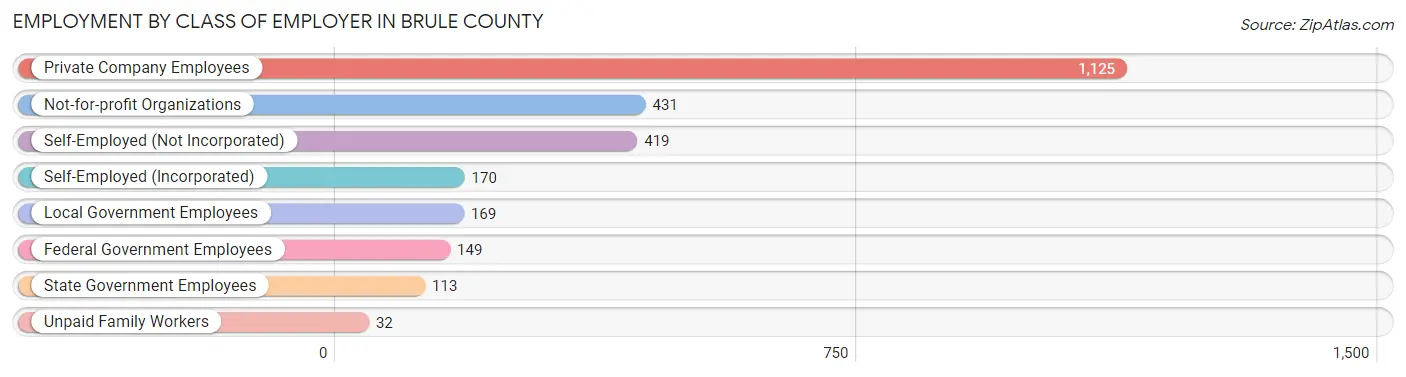
| Employer Class | # Employees | % Employees |
| Private Company Employees | 1,125 | 43.1% |
| Self-Employed (Incorporated) | 170 | 6.5% |
| Self-Employed (Not Incorporated) | 419 | 16.1% |
| Not-for-profit Organizations | 431 | 16.5% |
| Local Government Employees | 169 | 6.5% |
| State Government Employees | 113 | 4.3% |
| Federal Government Employees | 149 | 5.7% |
| Unpaid Family Workers | 32 | 1.2% |
| Total | 2,608 | 100.0% |
Employment Status by Age in Brule County
According to the labor force statistics for Brule County, out of the total population over 16 years of age (4,153), 66.1% or 2,745 individuals are in the labor force, with 3.2% or 88 of them unemployed. The age group with the highest labor force participation rate is 25 to 29 years, with 91.5% or 249 individuals in the labor force. Within the labor force, the 16 to 19 years age range has the highest percentage of unemployed individuals, with 23.1% or 51 of them being unemployed.

| Age Bracket | In Labor Force | Unemployed |
| 16 to 19 Years | 221 (66.0%) | 51 (23.1%) |
| 20 to 24 Years | 199 (82.2%) | 0 (0.0%) |
| 25 to 29 Years | 249 (91.5%) | 12 (4.8%) |
| 30 to 34 Years | 133 (56.1%) | 0 (0.0%) |
| 35 to 44 Years | 580 (87.1%) | 22 (3.8%) |
| 45 to 54 Years | 508 (84.1%) | 0 (0.0%) |
| 55 to 59 Years | 342 (89.8%) | 3 (0.9%) |
| 60 to 64 Years | 274 (66.5%) | 0 (0.0%) |
| 65 to 74 Years | 218 (40.7%) | 0 (0.0%) |
| 75 Years and over | 23 (4.9%) | 0 (0.0%) |
| Total | 2,745 (66.1%) | 88 (3.2%) |
Employment Status by Educational Attainment in Brule County
According to labor force statistics for Brule County, 81.1% of individuals (2,086) out of the total population between 25 and 64 years of age (2,572) are in the labor force, with 1.8% or 38 of them being unemployed. The group with the highest labor force participation rate are those with the educational attainment of college / associate degree, with 90.6% or 616 individuals in the labor force. Within the labor force, individuals with college / associate degree education have the highest percentage of unemployment, with 5.6% or 34 of them being unemployed.
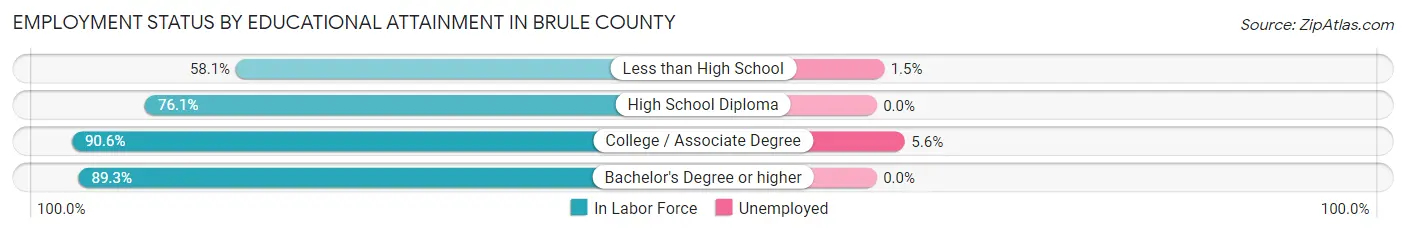
| Educational Attainment | In Labor Force | Unemployed |
| Less than High School | 200 (58.1%) | 5 (1.5%) |
| High School Diploma | 651 (76.1%) | 0 (0.0%) |
| College / Associate Degree | 616 (90.6%) | 38 (5.6%) |
| Bachelor's Degree or higher | 619 (89.3%) | 0 (0.0%) |
| Total | 2,086 (81.1%) | 46 (1.8%) |
Employment Occupations by Sex in Brule County
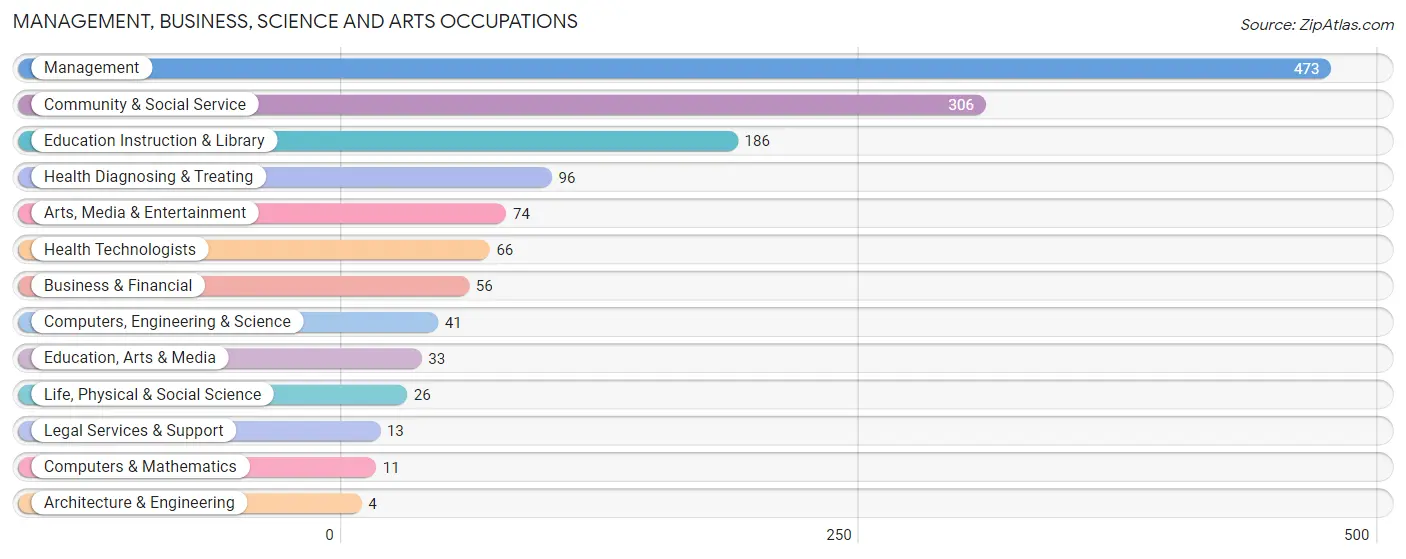
Management, Business, Science and Arts Occupations
The most common Management, Business, Science and Arts occupations in Brule County are Management (473 | 17.8%), Community & Social Service (306 | 11.6%), Education Instruction & Library (186 | 7.0%), Health Diagnosing & Treating (96 | 3.6%), and Arts, Media & Entertainment (74 | 2.8%).
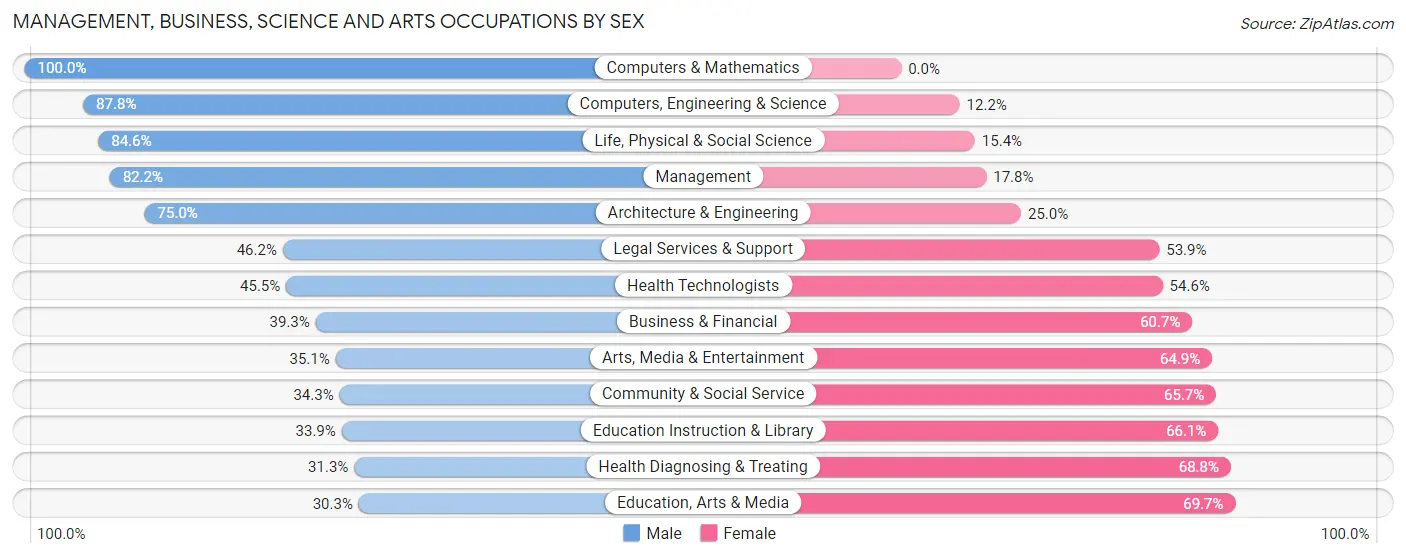
Management, Business, Science and Arts Occupations by Sex
Within the Management, Business, Science and Arts occupations in Brule County, the most male-oriented occupations are Computers & Mathematics (100.0%), Computers, Engineering & Science (87.8%), and Life, Physical & Social Science (84.6%), while the most female-oriented occupations are Education, Arts & Media (69.7%), Health Diagnosing & Treating (68.8%), and Education Instruction & Library (66.1%).
| Occupation | Male | Female |
| Management | 389 (82.2%) | 84 (17.8%) |
| Business & Financial | 22 (39.3%) | 34 (60.7%) |
| Computers, Engineering & Science | 36 (87.8%) | 5 (12.2%) |
| Computers & Mathematics | 11 (100.0%) | 0 (0.0%) |
| Architecture & Engineering | 3 (75.0%) | 1 (25.0%) |
| Life, Physical & Social Science | 22 (84.6%) | 4 (15.4%) |
| Community & Social Service | 105 (34.3%) | 201 (65.7%) |
| Education, Arts & Media | 10 (30.3%) | 23 (69.7%) |
| Legal Services & Support | 6 (46.2%) | 7 (53.8%) |
| Education Instruction & Library | 63 (33.9%) | 123 (66.1%) |
| Arts, Media & Entertainment | 26 (35.1%) | 48 (64.9%) |
| Health Diagnosing & Treating | 30 (31.2%) | 66 (68.8%) |
| Health Technologists | 30 (45.5%) | 36 (54.5%) |
| Total (Category) | 582 (59.9%) | 390 (40.1%) |
| Total (Overall) | 1,453 (54.8%) | 1,197 (45.2%) |
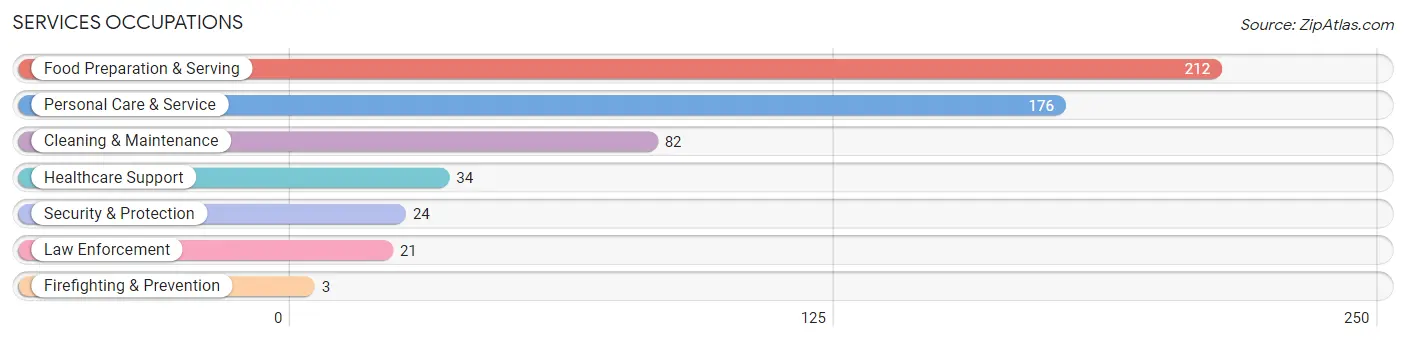
Services Occupations
The most common Services occupations in Brule County are Food Preparation & Serving (212 | 8.0%), Personal Care & Service (176 | 6.6%), Cleaning & Maintenance (82 | 3.1%), Healthcare Support (34 | 1.3%), and Security & Protection (24 | 0.9%).
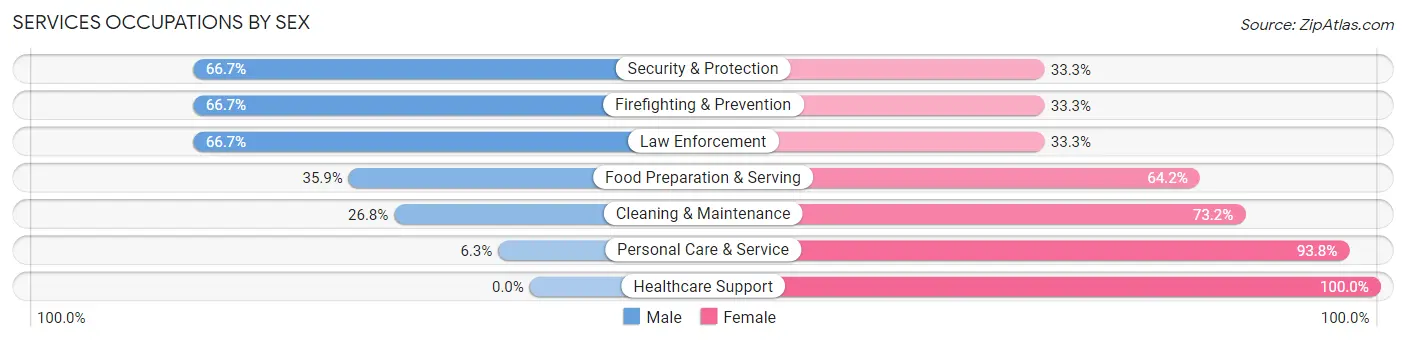
Services Occupations by Sex
Within the Services occupations in Brule County, the most male-oriented occupations are Security & Protection (66.7%), Firefighting & Prevention (66.7%), and Law Enforcement (66.7%), while the most female-oriented occupations are Healthcare Support (100.0%), Personal Care & Service (93.8%), and Cleaning & Maintenance (73.2%).
| Occupation | Male | Female |
| Healthcare Support | 0 (0.0%) | 34 (100.0%) |
| Security & Protection | 16 (66.7%) | 8 (33.3%) |
| Firefighting & Prevention | 2 (66.7%) | 1 (33.3%) |
| Law Enforcement | 14 (66.7%) | 7 (33.3%) |
| Food Preparation & Serving | 76 (35.8%) | 136 (64.1%) |
| Cleaning & Maintenance | 22 (26.8%) | 60 (73.2%) |
| Personal Care & Service | 11 (6.2%) | 165 (93.8%) |
| Total (Category) | 125 (23.7%) | 403 (76.3%) |
| Total (Overall) | 1,453 (54.8%) | 1,197 (45.2%) |
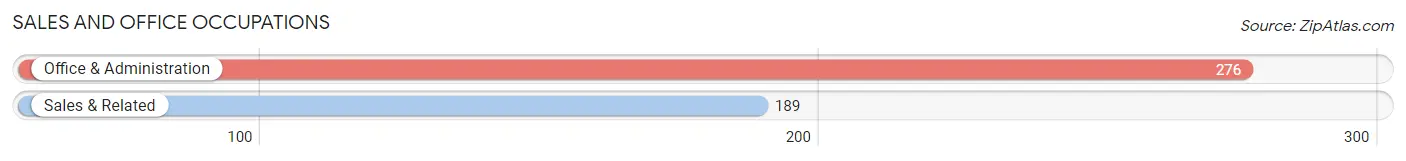
Sales and Office Occupations
The most common Sales and Office occupations in Brule County are Office & Administration (276 | 10.4%), and Sales & Related (189 | 7.1%).
Sales and Office Occupations by Sex
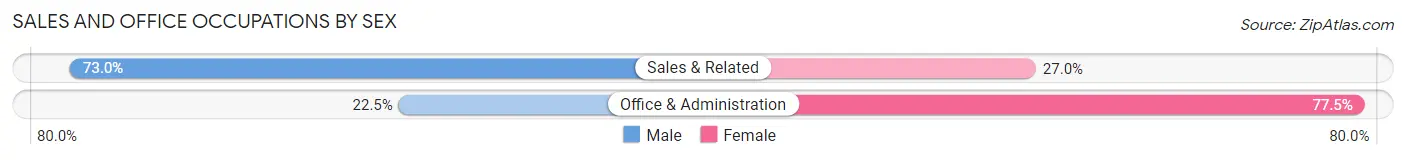
| Occupation | Male | Female |
| Sales & Related | 138 (73.0%) | 51 (27.0%) |
| Office & Administration | 62 (22.5%) | 214 (77.5%) |
| Total (Category) | 200 (43.0%) | 265 (57.0%) |
| Total (Overall) | 1,453 (54.8%) | 1,197 (45.2%) |
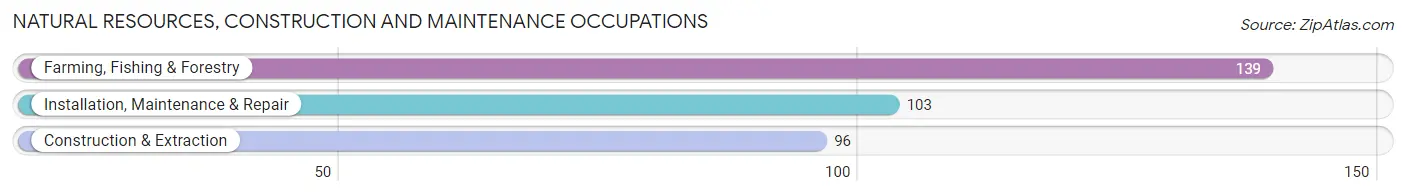
Natural Resources, Construction and Maintenance Occupations
The most common Natural Resources, Construction and Maintenance occupations in Brule County are Farming, Fishing & Forestry (139 | 5.2%), Installation, Maintenance & Repair (103 | 3.9%), and Construction & Extraction (96 | 3.6%).
Natural Resources, Construction and Maintenance Occupations by Sex
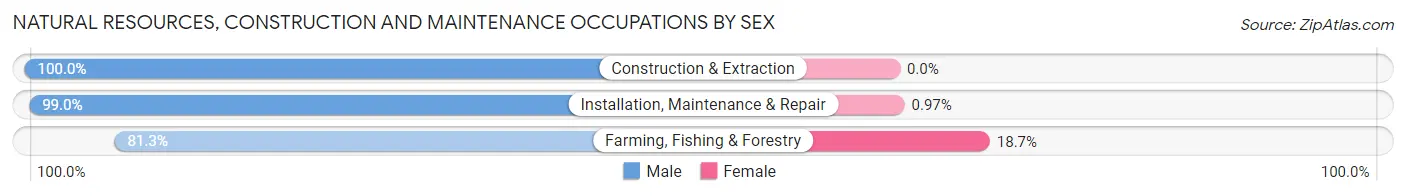
| Occupation | Male | Female |
| Farming, Fishing & Forestry | 113 (81.3%) | 26 (18.7%) |
| Construction & Extraction | 96 (100.0%) | 0 (0.0%) |
| Installation, Maintenance & Repair | 102 (99.0%) | 1 (1.0%) |
| Total (Category) | 311 (92.0%) | 27 (8.0%) |
| Total (Overall) | 1,453 (54.8%) | 1,197 (45.2%) |
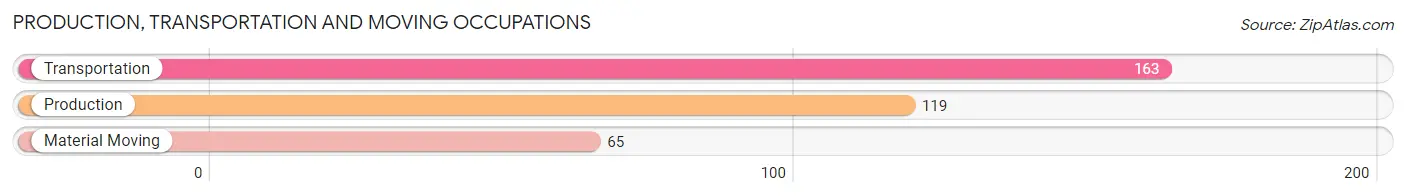
Production, Transportation and Moving Occupations
The most common Production, Transportation and Moving occupations in Brule County are Transportation (163 | 6.1%), Production (119 | 4.5%), and Material Moving (65 | 2.5%).
Production, Transportation and Moving Occupations by Sex
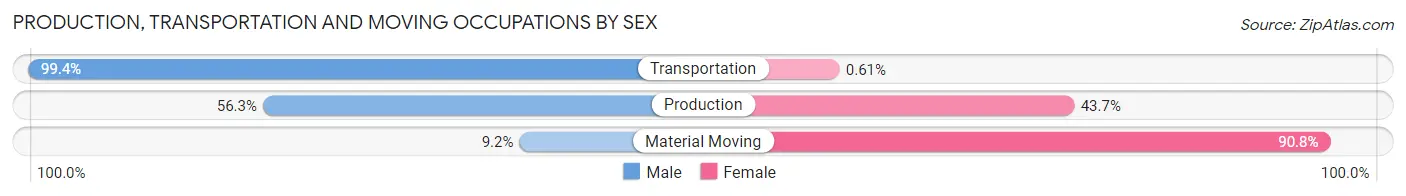
| Occupation | Male | Female |
| Production | 67 (56.3%) | 52 (43.7%) |
| Transportation | 162 (99.4%) | 1 (0.6%) |
| Material Moving | 6 (9.2%) | 59 (90.8%) |
| Total (Category) | 235 (67.7%) | 112 (32.3%) |
| Total (Overall) | 1,453 (54.8%) | 1,197 (45.2%) |
Employment Industries by Sex in Brule County
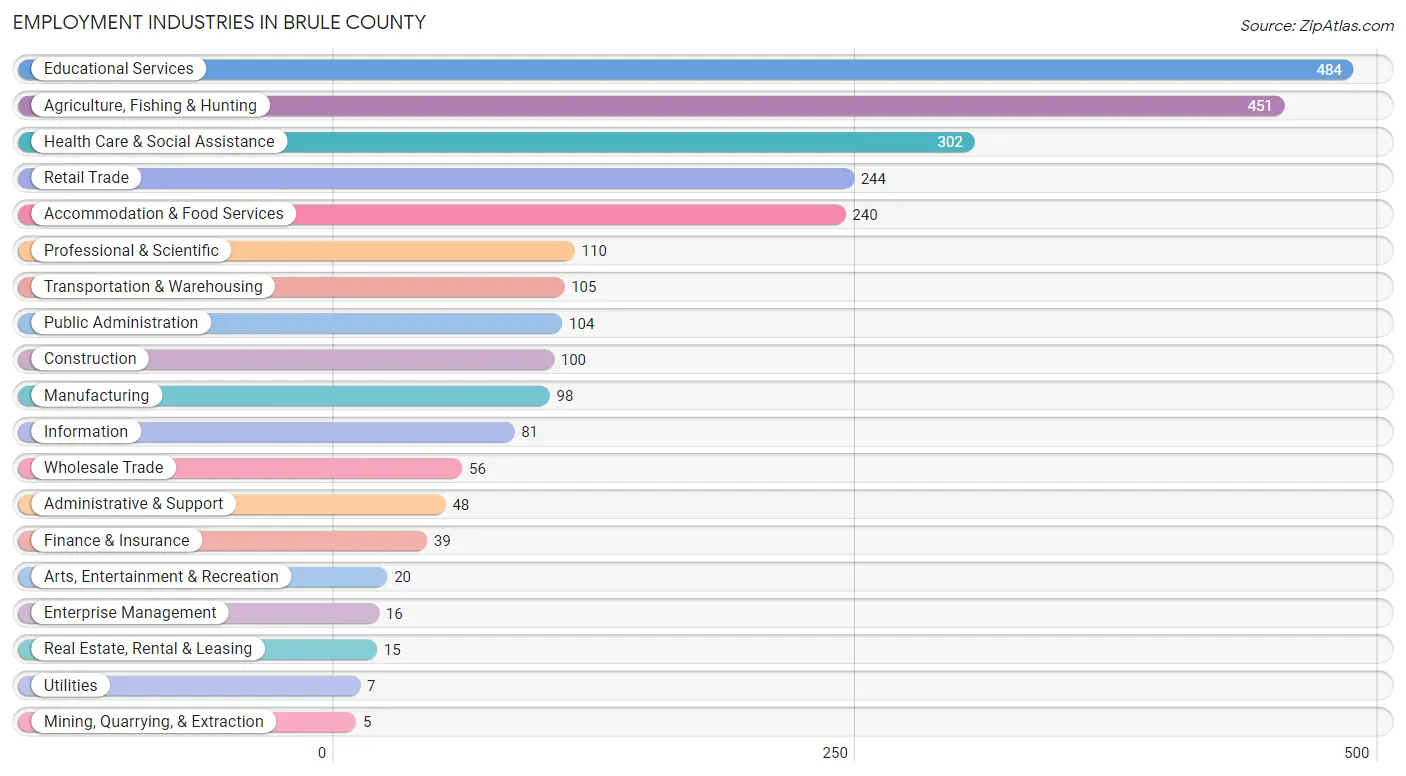
Employment Industries in Brule County
The major employment industries in Brule County include Educational Services (484 | 18.3%), Agriculture, Fishing & Hunting (451 | 17.0%), Health Care & Social Assistance (302 | 11.4%), Retail Trade (244 | 9.2%), and Accommodation & Food Services (240 | 9.1%).
Employment Industries by Sex in Brule County
The Brule County industries that see more men than women are Mining, Quarrying, & Extraction (100.0%), Construction (100.0%), and Real Estate, Rental & Leasing (100.0%), whereas the industries that tend to have a higher number of women are Health Care & Social Assistance (91.4%), Finance & Insurance (79.5%), and Information (74.1%).

| Industry | Male | Female |
| Agriculture, Fishing & Hunting | 391 (86.7%) | 60 (13.3%) |
| Mining, Quarrying, & Extraction | 5 (100.0%) | 0 (0.0%) |
| Construction | 100 (100.0%) | 0 (0.0%) |
| Manufacturing | 57 (58.2%) | 41 (41.8%) |
| Wholesale Trade | 53 (94.6%) | 3 (5.4%) |
| Retail Trade | 177 (72.5%) | 67 (27.5%) |
| Transportation & Warehousing | 95 (90.5%) | 10 (9.5%) |
| Utilities | 2 (28.6%) | 5 (71.4%) |
| Information | 21 (25.9%) | 60 (74.1%) |
| Finance & Insurance | 8 (20.5%) | 31 (79.5%) |
| Real Estate, Rental & Leasing | 15 (100.0%) | 0 (0.0%) |
| Professional & Scientific | 65 (59.1%) | 45 (40.9%) |
| Enterprise Management | 16 (100.0%) | 0 (0.0%) |
| Administrative & Support | 30 (62.5%) | 18 (37.5%) |
| Educational Services | 156 (32.2%) | 328 (67.8%) |
| Health Care & Social Assistance | 26 (8.6%) | 276 (91.4%) |
| Arts, Entertainment & Recreation | 18 (90.0%) | 2 (10.0%) |
| Accommodation & Food Services | 94 (39.2%) | 146 (60.8%) |
| Public Administration | 61 (58.7%) | 43 (41.3%) |
| Total | 1,453 (54.8%) | 1,197 (45.2%) |
Education in Brule County
School Enrollment in Brule County
The most common levels of schooling among the 1,170 students in Brule County are high school (377 | 32.2%), middle school (357 | 30.5%), and elementary school (222 | 19.0%).

| School Level | # Students | % Students |
| Nursery / Preschool | 70 | 6.0% |
| Kindergarten | 58 | 5.0% |
| Elementary School | 222 | 19.0% |
| Middle School | 357 | 30.5% |
| High School | 377 | 32.2% |
| College / Undergraduate | 83 | 7.1% |
| Graduate / Professional | 3 | 0.3% |
| Total | 1,170 | 100.0% |
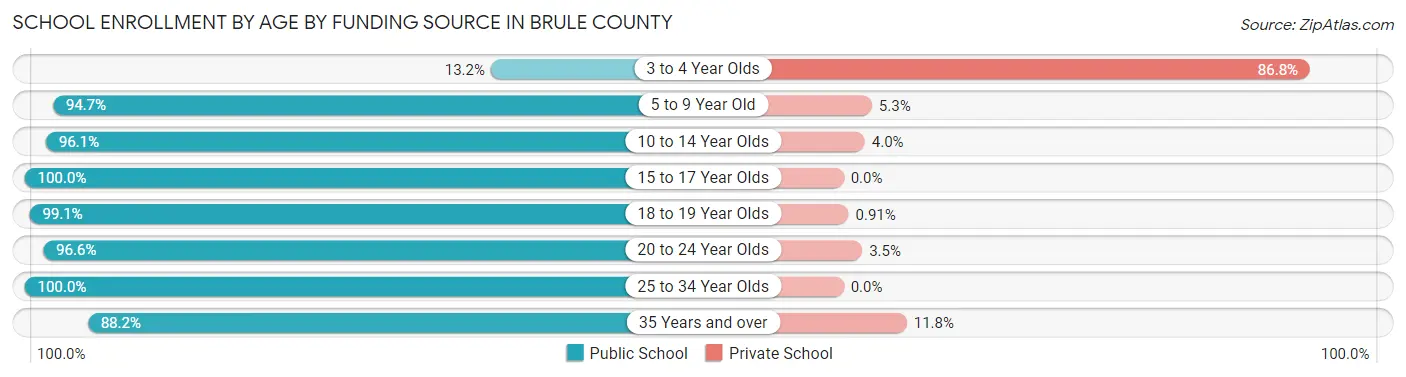
School Enrollment by Age by Funding Source in Brule County
Out of a total of 1,170 students who are enrolled in schools in Brule County, 69 (5.9%) attend a private institution, while the remaining 1,101 (94.1%) are enrolled in public schools. The age group of 3 to 4 year olds has the highest likelihood of being enrolled in private schools, with 33 (86.8% in the age bracket) enrolled. Conversely, the age group of 15 to 17 year olds has the lowest likelihood of being enrolled in a private school, with 249 (100.0% in the age bracket) attending a public institution.
| Age Bracket | Public School | Private School |
| 3 to 4 Year Olds | 5 (13.2%) | 33 (86.8%) |
| 5 to 9 Year Old | 252 (94.7%) | 14 (5.3%) |
| 10 to 14 Year Olds | 413 (96.1%) | 17 (4.0%) |
| 15 to 17 Year Olds | 249 (100.0%) | 0 (0.0%) |
| 18 to 19 Year Olds | 109 (99.1%) | 1 (0.9%) |
| 20 to 24 Year Olds | 56 (96.6%) | 2 (3.5%) |
| 25 to 34 Year Olds | 2 (100.0%) | 0 (0.0%) |
| 35 Years and over | 15 (88.2%) | 2 (11.8%) |
| Total | 1,101 (94.1%) | 69 (5.9%) |
Educational Attainment by Field of Study in Brule County
Education (272 | 26.2%), bio, nature & agricultural (186 | 17.9%), business (150 | 14.5%), arts & humanities (111 | 10.7%), and science & technology (89 | 8.6%) are the most common fields of study among 1,037 individuals in Brule County who have obtained a bachelor's degree or higher.

| Field of Study | # Graduates | % Graduates |
| Computers & Mathematics | 0 | 0.0% |
| Bio, Nature & Agricultural | 186 | 17.9% |
| Physical & Health Sciences | 31 | 3.0% |
| Psychology | 65 | 6.3% |
| Social Sciences | 13 | 1.3% |
| Engineering | 38 | 3.7% |
| Multidisciplinary Studies | 18 | 1.7% |
| Science & Technology | 89 | 8.6% |
| Business | 150 | 14.5% |
| Education | 272 | 26.2% |
| Literature & Languages | 11 | 1.1% |
| Liberal Arts & History | 7 | 0.7% |
| Visual & Performing Arts | 21 | 2.0% |
| Communications | 25 | 2.4% |
| Arts & Humanities | 111 | 10.7% |
| Total | 1,037 | 100.0% |
Transportation & Commute in Brule County
Vehicle Availability by Sex in Brule County
The most prevalent vehicle ownership categories in Brule County are males with 2 vehicles (451, accounting for 32.3%) and females with 2 vehicles (350, making up 39.4%).

| Vehicles Available | Male | Female |
| No Vehicle | 33 (2.4%) | 10 (0.9%) |
| 1 Vehicle | 130 (9.3%) | 185 (16.2%) |
| 2 Vehicles | 451 (32.3%) | 350 (30.6%) |
| 3 Vehicles | 368 (26.3%) | 339 (29.6%) |
| 4 Vehicles | 243 (17.4%) | 170 (14.8%) |
| 5 or more Vehicles | 173 (12.4%) | 91 (8.0%) |
| Total | 1,398 (100.0%) | 1,145 (100.0%) |
Commute Time in Brule County
The most frequently occuring commute durations in Brule County are 5 to 9 minutes (519 commuters, 22.7%), less than 5 minutes (515 commuters, 22.5%), and 10 to 14 minutes (456 commuters, 20.0%).
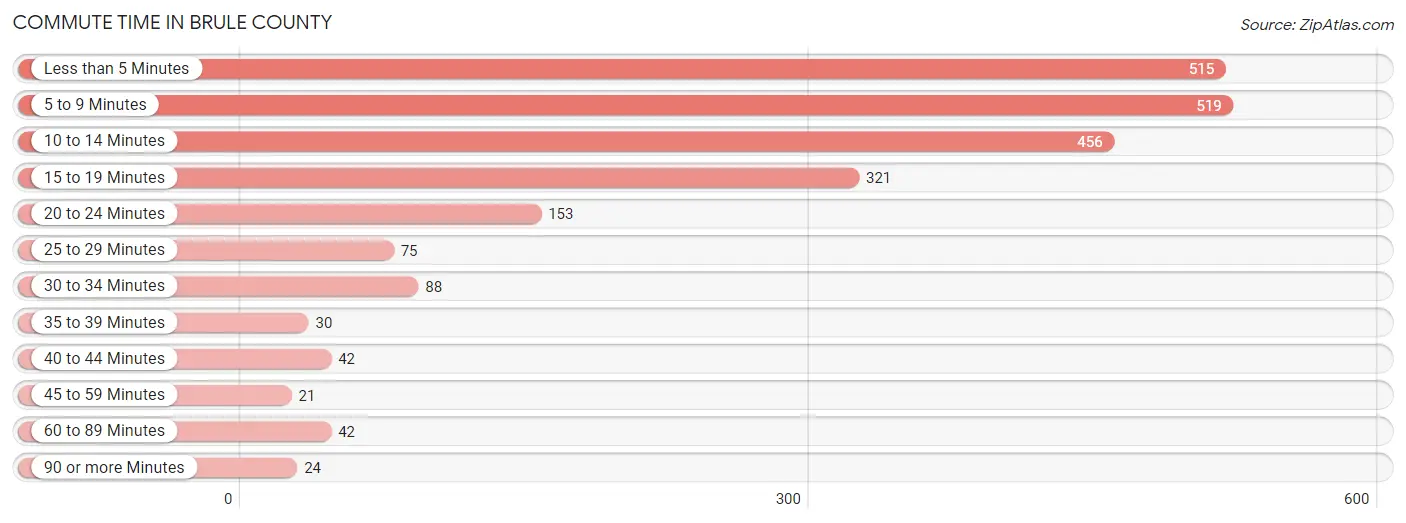
| Commute Time | # Commuters | % Commuters |
| Less than 5 Minutes | 515 | 22.5% |
| 5 to 9 Minutes | 519 | 22.7% |
| 10 to 14 Minutes | 456 | 20.0% |
| 15 to 19 Minutes | 321 | 14.0% |
| 20 to 24 Minutes | 153 | 6.7% |
| 25 to 29 Minutes | 75 | 3.3% |
| 30 to 34 Minutes | 88 | 3.8% |
| 35 to 39 Minutes | 30 | 1.3% |
| 40 to 44 Minutes | 42 | 1.8% |
| 45 to 59 Minutes | 21 | 0.9% |
| 60 to 89 Minutes | 42 | 1.8% |
| 90 or more Minutes | 24 | 1.1% |
Commute Time by Sex in Brule County
The most common commute times in Brule County are less than 5 minutes (319 commuters, 26.5%) for males and 5 to 9 minutes (256 commuters, 23.7%) for females.
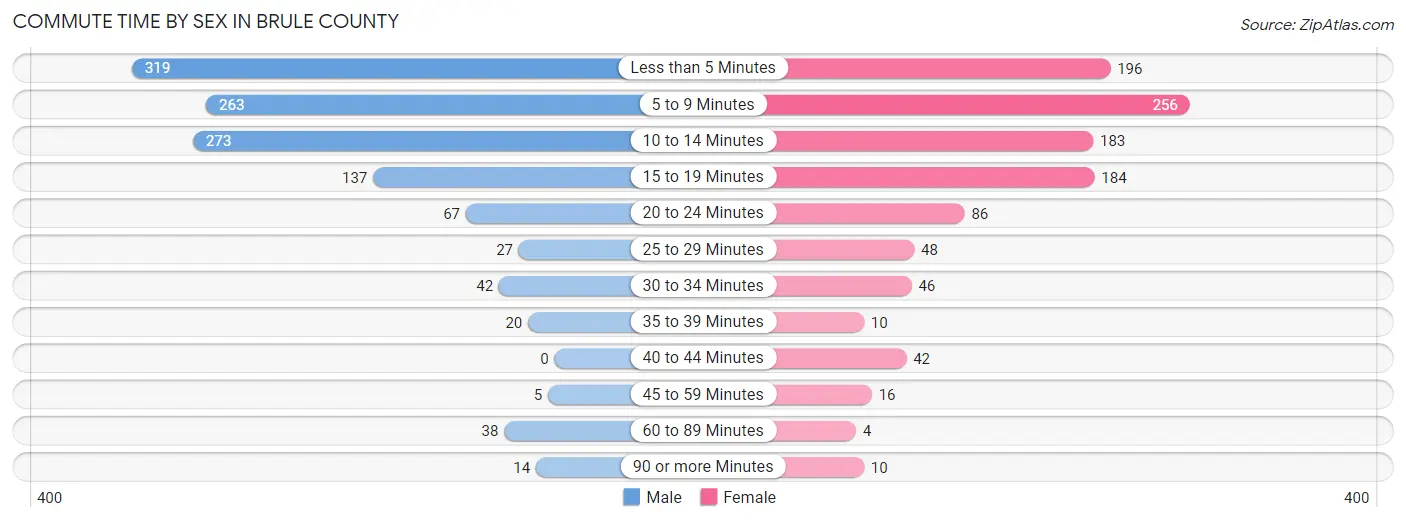
| Commute Time | Male | Female |
| Less than 5 Minutes | 319 (26.5%) | 196 (18.1%) |
| 5 to 9 Minutes | 263 (21.8%) | 256 (23.7%) |
| 10 to 14 Minutes | 273 (22.7%) | 183 (16.9%) |
| 15 to 19 Minutes | 137 (11.4%) | 184 (17.0%) |
| 20 to 24 Minutes | 67 (5.6%) | 86 (8.0%) |
| 25 to 29 Minutes | 27 (2.2%) | 48 (4.4%) |
| 30 to 34 Minutes | 42 (3.5%) | 46 (4.3%) |
| 35 to 39 Minutes | 20 (1.7%) | 10 (0.9%) |
| 40 to 44 Minutes | 0 (0.0%) | 42 (3.9%) |
| 45 to 59 Minutes | 5 (0.4%) | 16 (1.5%) |
| 60 to 89 Minutes | 38 (3.2%) | 4 (0.4%) |
| 90 or more Minutes | 14 (1.2%) | 10 (0.9%) |
Time of Departure to Work by Sex in Brule County
The most frequent times of departure to work in Brule County are 7:30 AM to 7:59 AM (223, 18.5%) for males and 7:30 AM to 7:59 AM (337, 31.2%) for females.
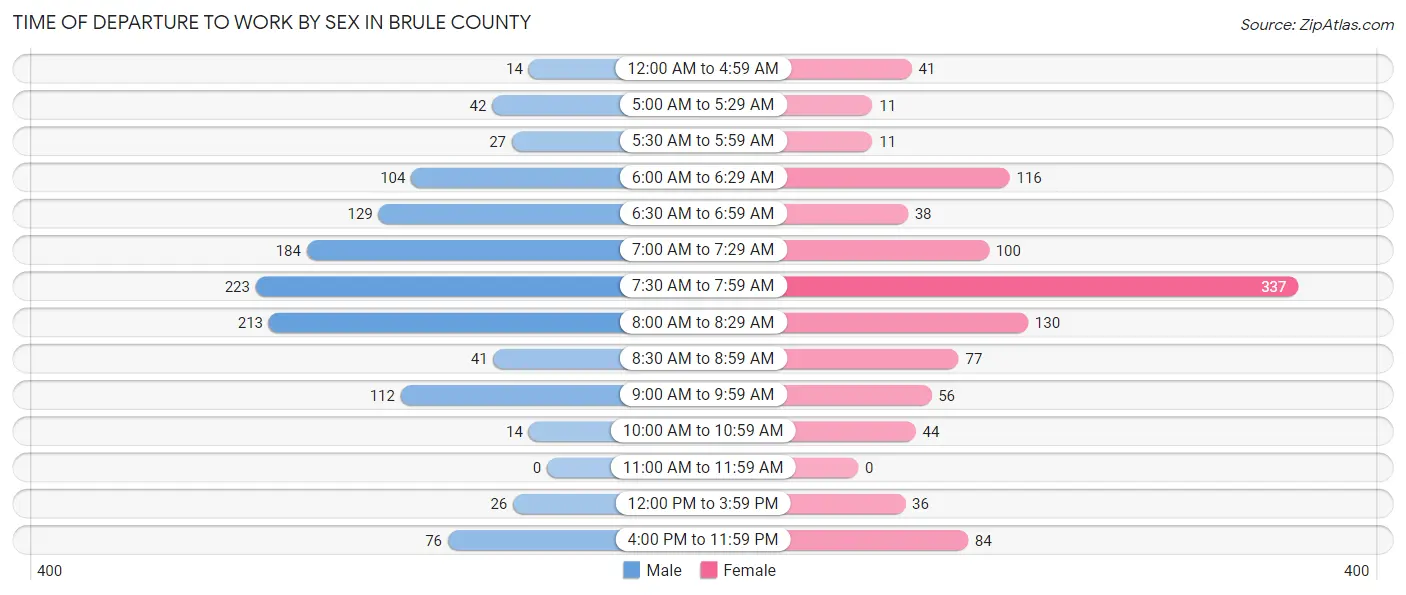
| Time of Departure | Male | Female |
| 12:00 AM to 4:59 AM | 14 (1.2%) | 41 (3.8%) |
| 5:00 AM to 5:29 AM | 42 (3.5%) | 11 (1.0%) |
| 5:30 AM to 5:59 AM | 27 (2.2%) | 11 (1.0%) |
| 6:00 AM to 6:29 AM | 104 (8.6%) | 116 (10.7%) |
| 6:30 AM to 6:59 AM | 129 (10.7%) | 38 (3.5%) |
| 7:00 AM to 7:29 AM | 184 (15.3%) | 100 (9.2%) |
| 7:30 AM to 7:59 AM | 223 (18.5%) | 337 (31.2%) |
| 8:00 AM to 8:29 AM | 213 (17.7%) | 130 (12.0%) |
| 8:30 AM to 8:59 AM | 41 (3.4%) | 77 (7.1%) |
| 9:00 AM to 9:59 AM | 112 (9.3%) | 56 (5.2%) |
| 10:00 AM to 10:59 AM | 14 (1.2%) | 44 (4.1%) |
| 11:00 AM to 11:59 AM | 0 (0.0%) | 0 (0.0%) |
| 12:00 PM to 3:59 PM | 26 (2.2%) | 36 (3.3%) |
| 4:00 PM to 11:59 PM | 76 (6.3%) | 84 (7.8%) |
| Total | 1,205 (100.0%) | 1,081 (100.0%) |
Housing Occupancy in Brule County
Occupancy by Ownership in Brule County
Of the total 1,958 dwellings in Brule County, owner-occupied units account for 1,273 (65.0%), while renter-occupied units make up 685 (35.0%).

| Occupancy | # Housing Units | % Housing Units |
| Owner Occupied Housing Units | 1,273 | 65.0% |
| Renter-Occupied Housing Units | 685 | 35.0% |
| Total Occupied Housing Units | 1,958 | 100.0% |
Occupancy by Household Size in Brule County
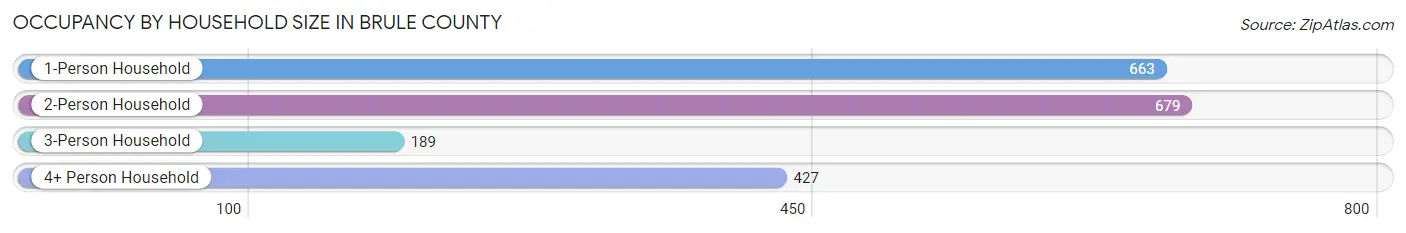
| Household Size | # Housing Units | % Housing Units |
| 1-Person Household | 663 | 33.9% |
| 2-Person Household | 679 | 34.7% |
| 3-Person Household | 189 | 9.7% |
| 4+ Person Household | 427 | 21.8% |
| Total Housing Units | 1,958 | 100.0% |
Occupancy by Ownership by Household Size in Brule County

| Household Size | Owner-occupied | Renter-occupied |
| 1-Person Household | 399 (60.2%) | 264 (39.8%) |
| 2-Person Household | 470 (69.2%) | 209 (30.8%) |
| 3-Person Household | 131 (69.3%) | 58 (30.7%) |
| 4+ Person Household | 273 (63.9%) | 154 (36.1%) |
| Total Housing Units | 1,273 (65.0%) | 685 (35.0%) |
Occupancy by Educational Attainment in Brule County
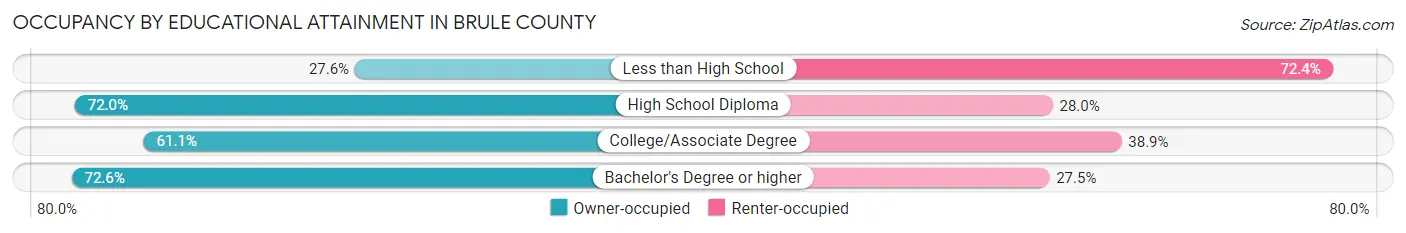
| Household Size | Owner-occupied | Renter-occupied |
| Less than High School | 53 (27.6%) | 139 (72.4%) |
| High School Diploma | 497 (72.0%) | 193 (28.0%) |
| College/Associate Degree | 308 (61.1%) | 196 (38.9%) |
| Bachelor's Degree or higher | 415 (72.6%) | 157 (27.5%) |
Occupancy by Age of Householder in Brule County
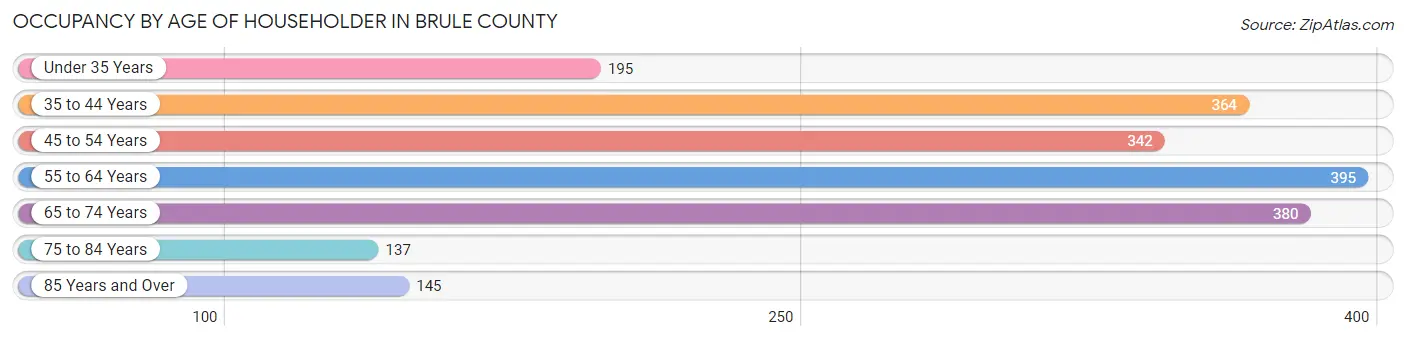
| Age Bracket | # Households | % Households |
| Under 35 Years | 195 | 10.0% |
| 35 to 44 Years | 364 | 18.6% |
| 45 to 54 Years | 342 | 17.5% |
| 55 to 64 Years | 395 | 20.2% |
| 65 to 74 Years | 380 | 19.4% |
| 75 to 84 Years | 137 | 7.0% |
| 85 Years and Over | 145 | 7.4% |
| Total | 1,958 | 100.0% |
Housing Finances in Brule County
Median Income by Occupancy in Brule County
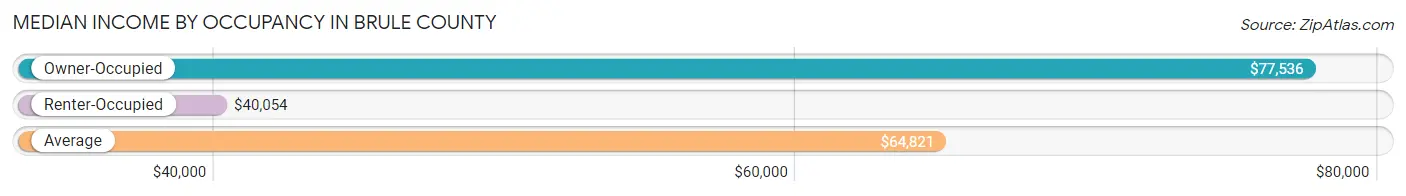
| Occupancy Type | # Households | Median Income |
| Owner-Occupied | 1,273 (65.0%) | $77,536 |
| Renter-Occupied | 685 (35.0%) | $40,054 |
| Average | 1,958 (100.0%) | $64,821 |
Occupancy by Householder Income Bracket in Brule County

| Income Bracket | Owner-occupied | Renter-occupied |
| Less than $5,000 | 35 (2.8%) | 15 (2.2%) |
| $5,000 to $9,999 | 6 (0.5%) | 42 (6.1%) |
| $10,000 to $14,999 | 19 (1.5%) | 58 (8.5%) |
| $15,000 to $19,999 | 32 (2.5%) | 79 (11.5%) |
| $20,000 to $24,999 | 42 (3.3%) | 32 (4.7%) |
| $25,000 to $34,999 | 91 (7.1%) | 95 (13.9%) |
| $35,000 to $49,999 | 159 (12.5%) | 82 (12.0%) |
| $50,000 to $74,999 | 216 (17.0%) | 73 (10.7%) |
| $75,000 to $99,999 | 187 (14.7%) | 62 (9.0%) |
| $100,000 to $149,999 | 269 (21.1%) | 65 (9.5%) |
| $150,000 or more | 217 (17.1%) | 82 (12.0%) |
| Total | 1,273 (100.0%) | 685 (100.0%) |
Monthly Housing Cost Tiers in Brule County
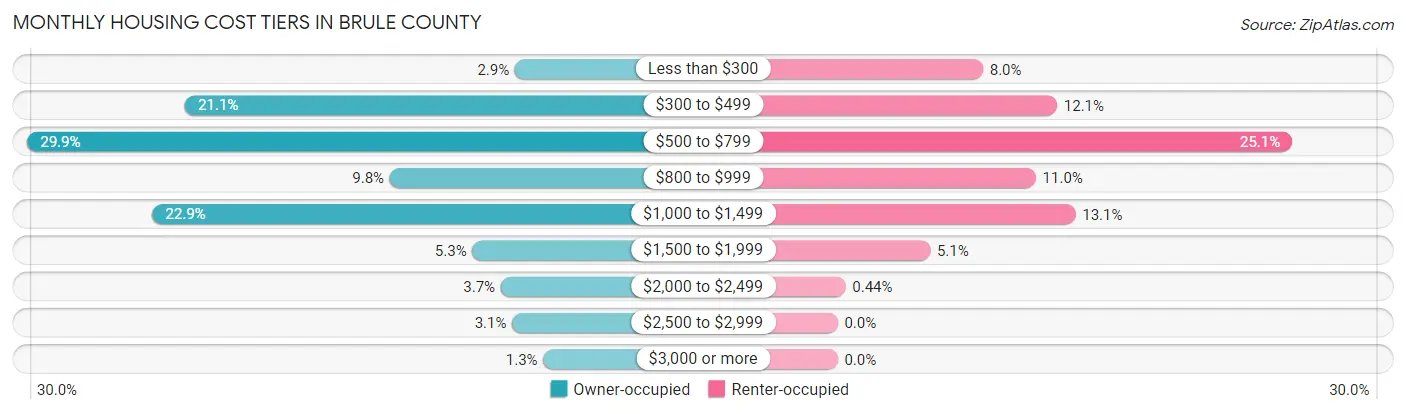
| Monthly Cost | Owner-occupied | Renter-occupied |
| Less than $300 | 37 (2.9%) | 55 (8.0%) |
| $300 to $499 | 269 (21.1%) | 83 (12.1%) |
| $500 to $799 | 380 (29.8%) | 172 (25.1%) |
| $800 to $999 | 125 (9.8%) | 75 (11.0%) |
| $1,000 to $1,499 | 292 (22.9%) | 90 (13.1%) |
| $1,500 to $1,999 | 67 (5.3%) | 35 (5.1%) |
| $2,000 to $2,499 | 47 (3.7%) | 3 (0.4%) |
| $2,500 to $2,999 | 39 (3.1%) | 0 (0.0%) |
| $3,000 or more | 17 (1.3%) | 0 (0.0%) |
| Total | 1,273 (100.0%) | 685 (100.0%) |
Physical Housing Characteristics in Brule County
Housing Structures in Brule County

| Structure Type | # Housing Units | % Housing Units |
| Single Unit, Detached | 1,383 | 70.6% |
| Single Unit, Attached | 31 | 1.6% |
| 2 Unit Apartments | 10 | 0.5% |
| 3 or 4 Unit Apartments | 109 | 5.6% |
| 5 to 9 Unit Apartments | 117 | 6.0% |
| 10 or more Apartments | 137 | 7.0% |
| Mobile Home / Other | 171 | 8.7% |
| Total | 1,958 | 100.0% |
Housing Structures by Occupancy in Brule County
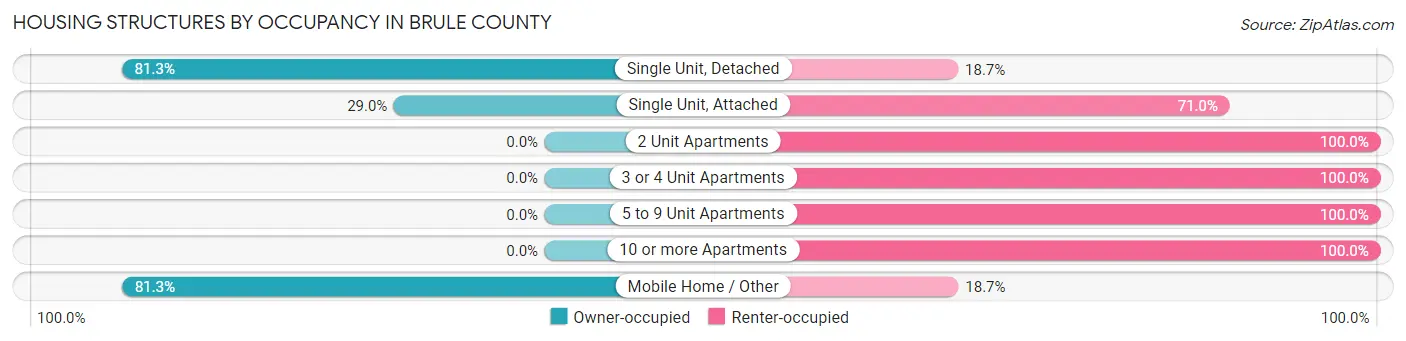
| Structure Type | Owner-occupied | Renter-occupied |
| Single Unit, Detached | 1,125 (81.3%) | 258 (18.7%) |
| Single Unit, Attached | 9 (29.0%) | 22 (71.0%) |
| 2 Unit Apartments | 0 (0.0%) | 10 (100.0%) |
| 3 or 4 Unit Apartments | 0 (0.0%) | 109 (100.0%) |
| 5 to 9 Unit Apartments | 0 (0.0%) | 117 (100.0%) |
| 10 or more Apartments | 0 (0.0%) | 137 (100.0%) |
| Mobile Home / Other | 139 (81.3%) | 32 (18.7%) |
| Total | 1,273 (65.0%) | 685 (35.0%) |
Housing Structures by Number of Rooms in Brule County
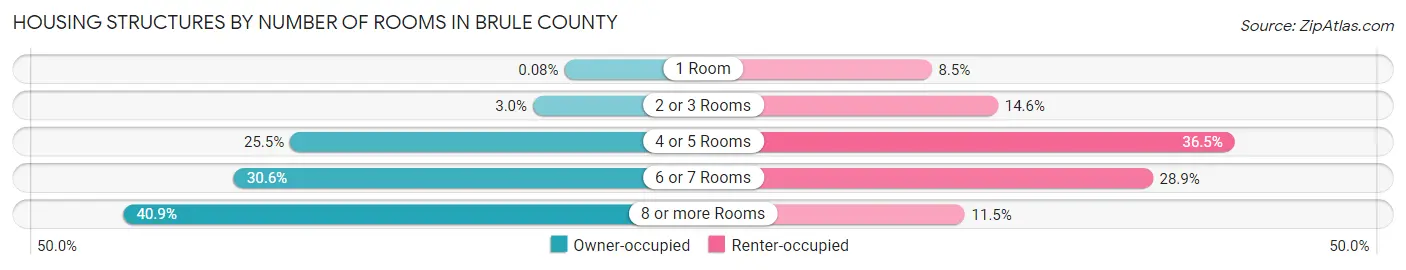
| Number of Rooms | Owner-occupied | Renter-occupied |
| 1 Room | 1 (0.1%) | 58 (8.5%) |
| 2 or 3 Rooms | 38 (3.0%) | 100 (14.6%) |
| 4 or 5 Rooms | 324 (25.5%) | 250 (36.5%) |
| 6 or 7 Rooms | 390 (30.6%) | 198 (28.9%) |
| 8 or more Rooms | 520 (40.8%) | 79 (11.5%) |
| Total | 1,273 (100.0%) | 685 (100.0%) |
Housing Structure by Heating Type in Brule County

| Heating Type | Owner-occupied | Renter-occupied |
| Utility Gas | 93 (7.3%) | 25 (3.6%) |
| Bottled, Tank, or LP Gas | 478 (37.6%) | 127 (18.5%) |
| Electricity | 603 (47.4%) | 447 (65.3%) |
| Fuel Oil or Kerosene | 49 (3.8%) | 18 (2.6%) |
| Coal or Coke | 0 (0.0%) | 64 (9.3%) |
| All other Fuels | 38 (3.0%) | 0 (0.0%) |
| No Fuel Used | 12 (0.9%) | 4 (0.6%) |
| Total | 1,273 (100.0%) | 685 (100.0%) |
Household Vehicle Usage in Brule County
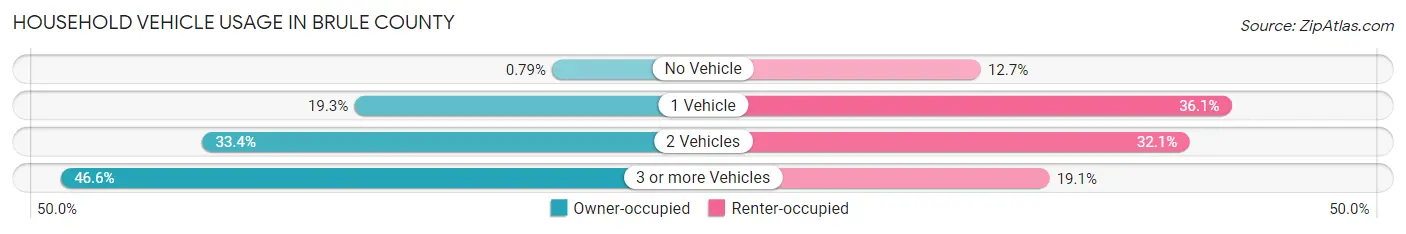
| Vehicles per Household | Owner-occupied | Renter-occupied |
| No Vehicle | 10 (0.8%) | 87 (12.7%) |
| 1 Vehicle | 245 (19.3%) | 247 (36.1%) |
| 2 Vehicles | 425 (33.4%) | 220 (32.1%) |
| 3 or more Vehicles | 593 (46.6%) | 131 (19.1%) |
| Total | 1,273 (100.0%) | 685 (100.0%) |
Real Estate & Mortgages in Brule County
Real Estate and Mortgage Overview in Brule County
| Characteristic | Without Mortgage | With Mortgage |
| Housing Units | 817 | 456 |
| Median Property Value | $182,500 | $193,000 |
| Median Household Income | $69,583 | $86 |
| Monthly Housing Costs | $559 | $17 |
| Real Estate Taxes | $1,517 | $4 |
Property Value by Mortgage Status in Brule County

| Property Value | Without Mortgage | With Mortgage |
| Less than $50,000 | 95 (11.6%) | 12 (2.6%) |
| $50,000 to $99,999 | 91 (11.1%) | 45 (9.9%) |
| $100,000 to $299,999 | 413 (50.5%) | 328 (71.9%) |
| $300,000 to $499,999 | 153 (18.7%) | 71 (15.6%) |
| $500,000 to $749,999 | 19 (2.3%) | 0 (0.0%) |
| $750,000 to $999,999 | 9 (1.1%) | 0 (0.0%) |
| $1,000,000 or more | 37 (4.5%) | 0 (0.0%) |
| Total | 817 (100.0%) | 456 (100.0%) |
Household Income by Mortgage Status in Brule County

| Household Income | Without Mortgage | With Mortgage |
| Less than $10,000 | 33 (4.0%) | 6 (1.3%) |
| $10,000 to $24,999 | 83 (10.2%) | 8 (1.8%) |
| $25,000 to $34,999 | 69 (8.5%) | 10 (2.2%) |
| $35,000 to $49,999 | 119 (14.6%) | 22 (4.8%) |
| $50,000 to $74,999 | 110 (13.5%) | 40 (8.8%) |
| $75,000 to $99,999 | 106 (13.0%) | 106 (23.3%) |
| $100,000 to $149,999 | 166 (20.3%) | 81 (17.8%) |
| $150,000 or more | 131 (16.0%) | 103 (22.6%) |
| Total | 817 (100.0%) | 456 (100.0%) |
Property Value to Household Income Ratio in Brule County
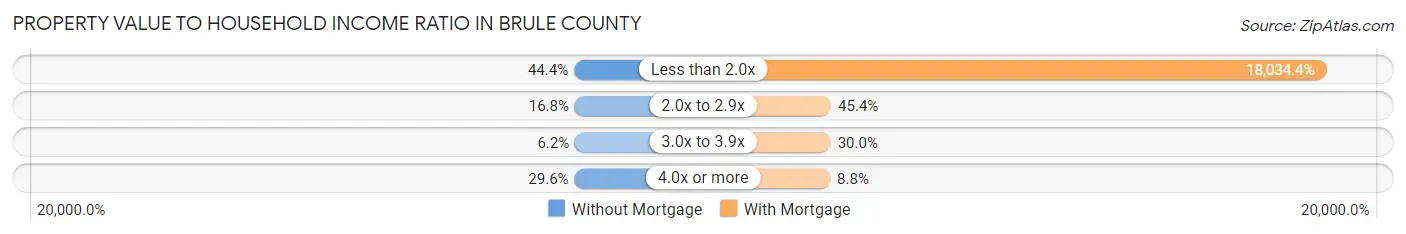
| Value-to-Income Ratio | Without Mortgage | With Mortgage |
| Less than 2.0x | 363 (44.4%) | 82,237 (18,034.4%) |
| 2.0x to 2.9x | 137 (16.8%) | 207 (45.4%) |
| 3.0x to 3.9x | 51 (6.2%) | 137 (30.0%) |
| 4.0x or more | 242 (29.6%) | 40 (8.8%) |
| Total | 817 (100.0%) | 456 (100.0%) |
Real Estate Taxes by Mortgage Status in Brule County
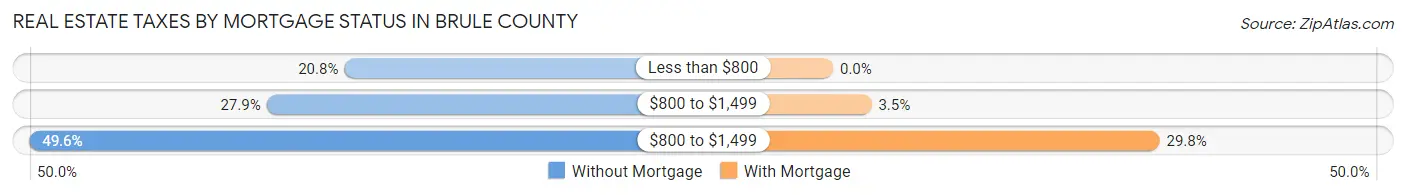
| Property Taxes | Without Mortgage | With Mortgage |
| Less than $800 | 170 (20.8%) | 0 (0.0%) |
| $800 to $1,499 | 228 (27.9%) | 16 (3.5%) |
| $800 to $1,499 | 405 (49.6%) | 136 (29.8%) |
| Total | 817 (100.0%) | 456 (100.0%) |
Health & Disability in Brule County
Health Insurance Coverage by Age in Brule County
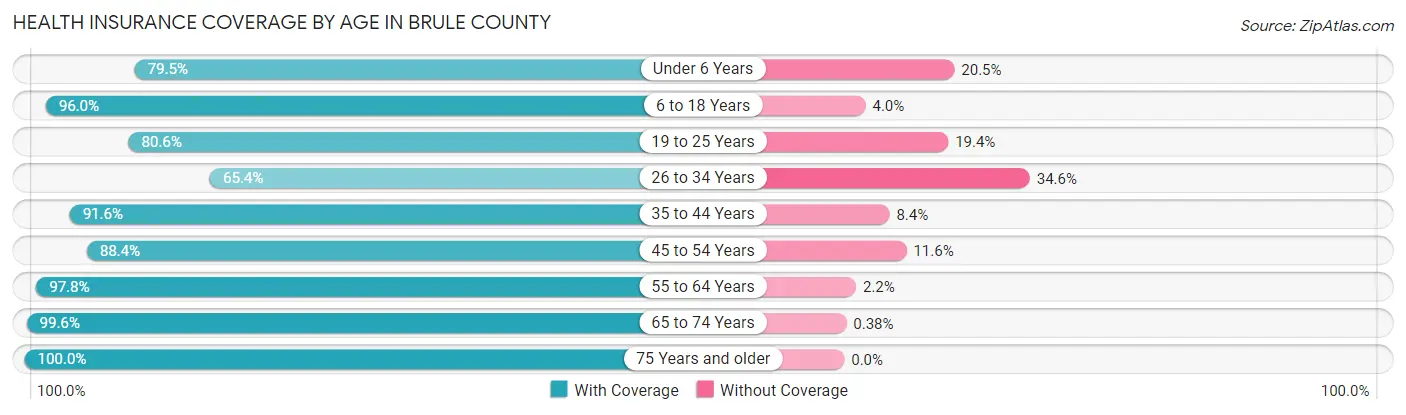
| Age Bracket | With Coverage | Without Coverage |
| Under 6 Years | 298 (79.5%) | 77 (20.5%) |
| 6 to 18 Years | 969 (96.0%) | 40 (4.0%) |
| 19 to 25 Years | 258 (80.6%) | 62 (19.4%) |
| 26 to 34 Years | 295 (65.4%) | 156 (34.6%) |
| 35 to 44 Years | 598 (91.6%) | 55 (8.4%) |
| 45 to 54 Years | 526 (88.4%) | 69 (11.6%) |
| 55 to 64 Years | 758 (97.8%) | 17 (2.2%) |
| 65 to 74 Years | 526 (99.6%) | 2 (0.4%) |
| 75 Years and older | 383 (100.0%) | 0 (0.0%) |
| Total | 4,611 (90.6%) | 478 (9.4%) |
Health Insurance Coverage by Citizenship Status in Brule County
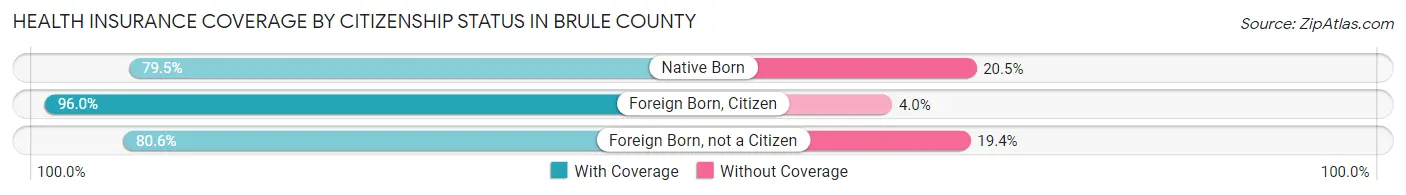
| Citizenship Status | With Coverage | Without Coverage |
| Native Born | 298 (79.5%) | 77 (20.5%) |
| Foreign Born, Citizen | 969 (96.0%) | 40 (4.0%) |
| Foreign Born, not a Citizen | 258 (80.6%) | 62 (19.4%) |
Health Insurance Coverage by Household Income in Brule County

| Household Income | With Coverage | Without Coverage |
| Under $25,000 | 387 (65.8%) | 201 (34.2%) |
| $25,000 to $49,999 | 907 (90.1%) | 100 (9.9%) |
| $50,000 to $74,999 | 746 (96.5%) | 27 (3.5%) |
| $75,000 to $99,999 | 694 (88.1%) | 94 (11.9%) |
| $100,000 and over | 1,724 (96.9%) | 55 (3.1%) |
Public vs Private Health Insurance Coverage by Age in Brule County

| Age Bracket | Public Insurance | Private Insurance |
| Under 6 | 116 (30.9%) | 194 (51.7%) |
| 6 to 18 Years | 320 (31.7%) | 706 (70.0%) |
| 19 to 25 Years | 12 (3.7%) | 246 (76.9%) |
| 25 to 34 Years | 19 (4.2%) | 278 (61.6%) |
| 35 to 44 Years | 58 (8.9%) | 569 (87.1%) |
| 45 to 54 Years | 80 (13.5%) | 479 (80.5%) |
| 55 to 64 Years | 154 (19.9%) | 627 (80.9%) |
| 65 to 74 Years | 448 (84.9%) | 311 (58.9%) |
| 75 Years and over | 378 (98.7%) | 148 (38.6%) |
| Total | 1,585 (31.1%) | 3,558 (69.9%) |
Disability Status by Sex by Age in Brule County
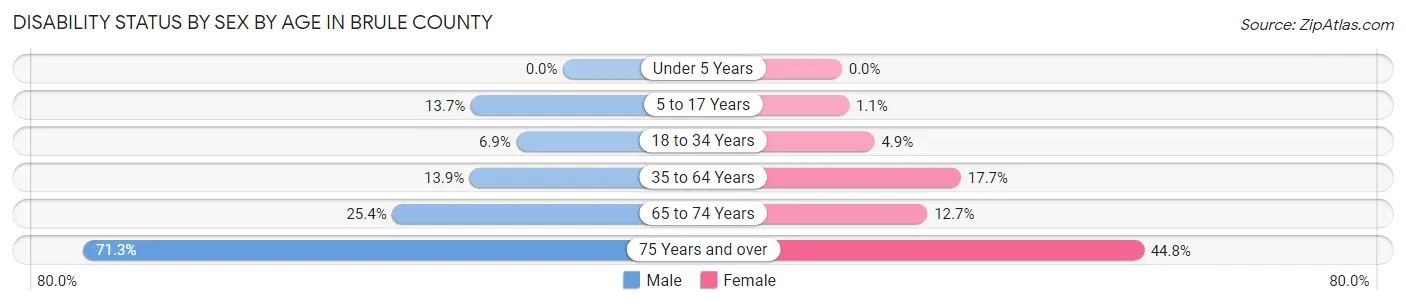
| Age Bracket | Male | Female |
| Under 5 Years | 0 (0.0%) | 0 (0.0%) |
| 5 to 17 Years | 69 (13.7%) | 5 (1.1%) |
| 18 to 34 Years | 30 (6.9%) | 22 (4.9%) |
| 35 to 64 Years | 151 (13.9%) | 165 (17.7%) |
| 65 to 74 Years | 68 (25.4%) | 33 (12.7%) |
| 75 Years and over | 87 (71.3%) | 117 (44.8%) |
Disability Class by Sex by Age in Brule County
Disability Class: Hearing Difficulty
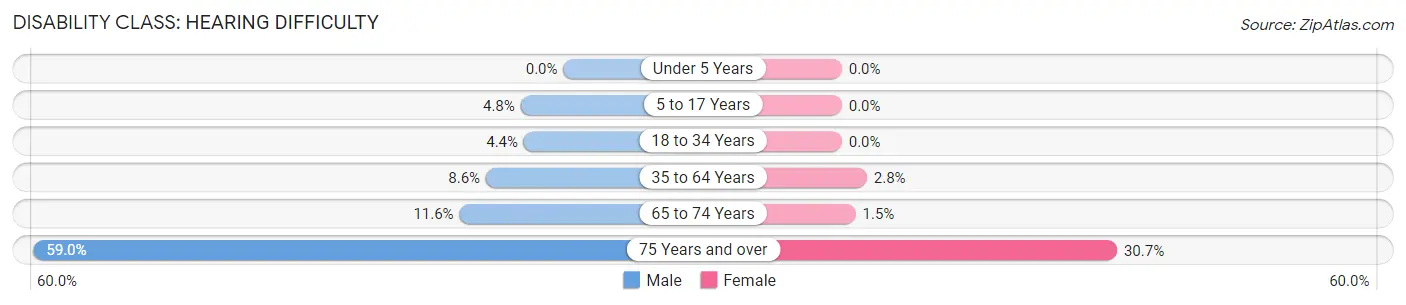
| Age Bracket | Male | Female |
| Under 5 Years | 0 (0.0%) | 0 (0.0%) |
| 5 to 17 Years | 24 (4.8%) | 0 (0.0%) |
| 18 to 34 Years | 19 (4.4%) | 0 (0.0%) |
| 35 to 64 Years | 94 (8.6%) | 26 (2.8%) |
| 65 to 74 Years | 31 (11.6%) | 4 (1.5%) |
| 75 Years and over | 72 (59.0%) | 80 (30.6%) |
Disability Class: Vision Difficulty
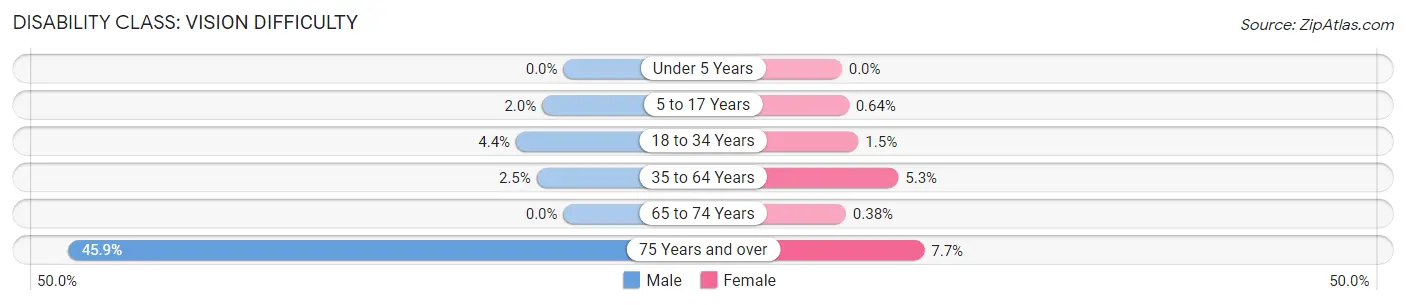
| Age Bracket | Male | Female |
| Under 5 Years | 0 (0.0%) | 0 (0.0%) |
| 5 to 17 Years | 10 (2.0%) | 3 (0.6%) |
| 18 to 34 Years | 19 (4.4%) | 7 (1.5%) |
| 35 to 64 Years | 27 (2.5%) | 49 (5.2%) |
| 65 to 74 Years | 0 (0.0%) | 1 (0.4%) |
| 75 Years and over | 56 (45.9%) | 20 (7.7%) |
Disability Class: Cognitive Difficulty
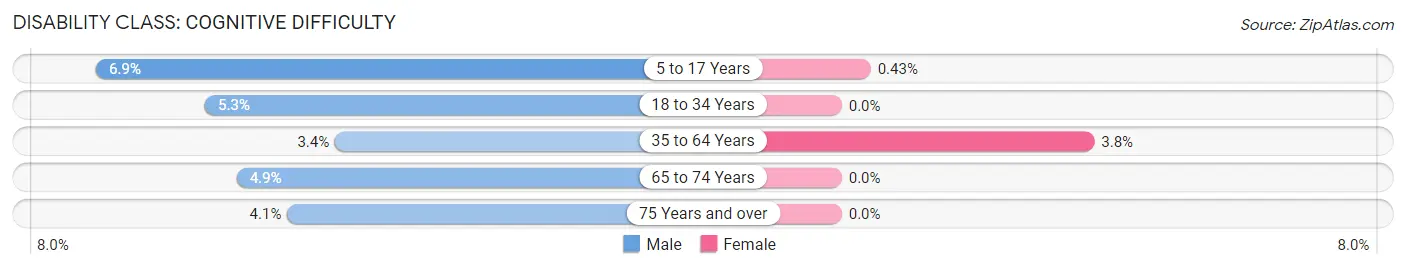
| Age Bracket | Male | Female |
| 5 to 17 Years | 35 (6.9%) | 2 (0.4%) |
| 18 to 34 Years | 23 (5.3%) | 0 (0.0%) |
| 35 to 64 Years | 37 (3.4%) | 35 (3.7%) |
| 65 to 74 Years | 13 (4.9%) | 0 (0.0%) |
| 75 Years and over | 5 (4.1%) | 0 (0.0%) |
Disability Class: Ambulatory Difficulty

| Age Bracket | Male | Female |
| 5 to 17 Years | 0 (0.0%) | 0 (0.0%) |
| 18 to 34 Years | 25 (5.8%) | 0 (0.0%) |
| 35 to 64 Years | 46 (4.2%) | 76 (8.2%) |
| 65 to 74 Years | 32 (11.9%) | 29 (11.2%) |
| 75 Years and over | 31 (25.4%) | 57 (21.8%) |
Disability Class: Self-Care Difficulty
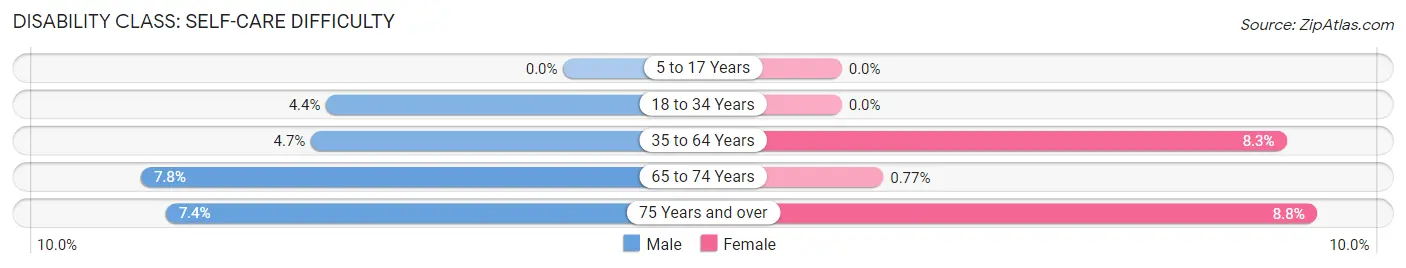
| Age Bracket | Male | Female |
| 5 to 17 Years | 0 (0.0%) | 0 (0.0%) |
| 18 to 34 Years | 19 (4.4%) | 0 (0.0%) |
| 35 to 64 Years | 51 (4.7%) | 77 (8.3%) |
| 65 to 74 Years | 21 (7.8%) | 2 (0.8%) |
| 75 Years and over | 9 (7.4%) | 23 (8.8%) |
Technology Access in Brule County
Computing Device Access in Brule County
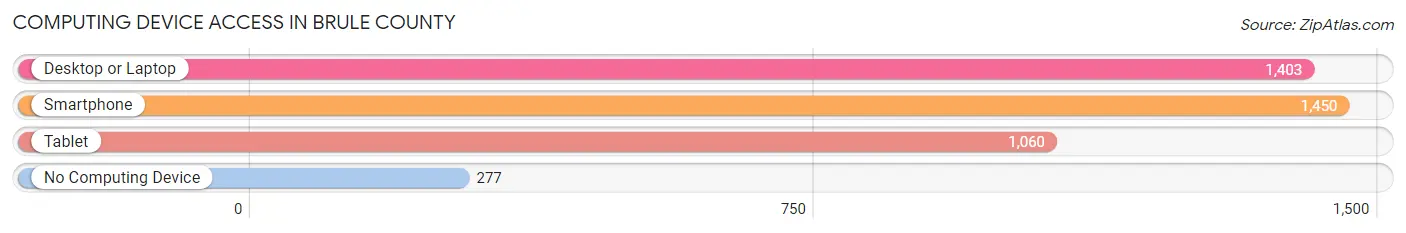
| Device Type | # Households | % Households |
| Desktop or Laptop | 1,403 | 71.7% |
| Smartphone | 1,450 | 74.1% |
| Tablet | 1,060 | 54.1% |
| No Computing Device | 277 | 14.1% |
| Total | 1,958 | 100.0% |
Internet Access in Brule County
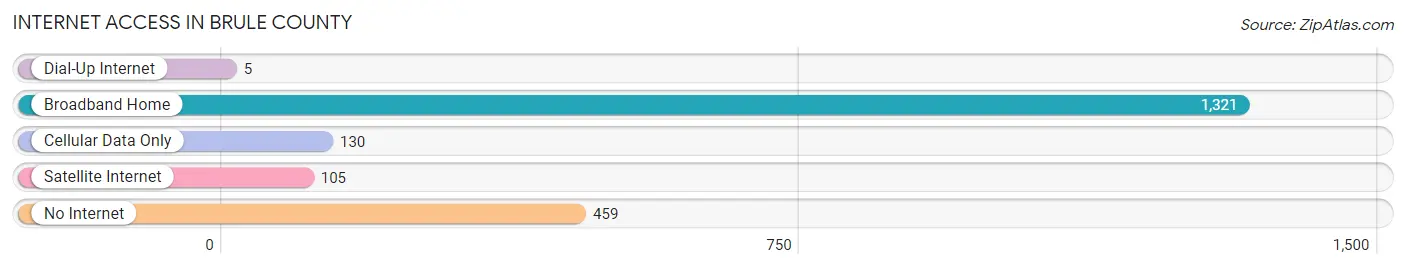
| Internet Type | # Households | % Households |
| Dial-Up Internet | 5 | 0.3% |
| Broadband Home | 1,321 | 67.5% |
| Cellular Data Only | 130 | 6.6% |
| Satellite Internet | 105 | 5.4% |
| No Internet | 459 | 23.4% |
| Total | 1,958 | 100.0% |
Brule County Summary
Brule County, South Dakota is located in the southeastern corner of the state and is bordered by Charles Mix County to the north, Gregory County to the east, and Hutchinson County to the south. The county seat is Chamberlain, and the county is named after Pierre-Jean De Smet's Brule River. The county has a total area of 1,845 square miles, of which 1,843 square miles is land and 2 square miles is water.
As of the 2010 United States Census, the population of Brule County was 5,255, with a population density of 2.8 people per square mile. The racial makeup of the county was 94.2% White, 0.2% Black or African American, 3.3% Native American, 0.2% Asian, 0.1% Pacific Islander, 0.3% from other races, and 1.7% from two or more races. Hispanic or Latino of any race were 1.3% of the population.
The median household income in Brule County was $41,944 in 2019, and the median family income was $50,938. The per capita income for the county was $20,945. About 11.2% of families and 14.7% of the population were below the poverty line, including 19.2% of those under age 18 and 8.2% of those age 65 or over.
The economy of Brule County is largely based on agriculture, with the majority of the county's land being used for farming and ranching. The county is home to several large farms, including the Brule County Farm, which is the largest farm in the state. Other major industries in the county include manufacturing, retail, and tourism.
The county is served by two school districts, the Chamberlain School District and the Kimball School District. The county also has several private schools, including the Chamberlain Christian School and the Kimball Christian School.
Brule County is home to several parks and recreational areas, including the Brule River State Park, the Chamberlain Recreation Area, and the Kimball Recreation Area. The county also has several museums, including the Brule County Historical Museum and the Chamberlain Museum.
Brule County is a great place to live, work, and play. With its rich history, diverse economy, and beautiful scenery, it is a great place to call home.
Common Questions
What is the Total Population of Brule County?
Total Population of Brule County is 5,247.
What is the Total Male Population of Brule County?
Total Male Population of Brule County is 2,676.
What is the Total Female Population of Brule County?
Total Female Population of Brule County is 2,571.
What is the Ratio of Males per 100 Females in Brule County?
There are 104.08 Males per 100 Females in Brule County.
What is the Ratio of Females per 100 Males in Brule County?
There are 96.08 Females per 100 Males in Brule County.
What is the Median Population Age in Brule County?
Median Population Age in Brule County is 41.5 Years.
What is the Average Family Size in Brule County
Average Family Size in Brule County is 3.3 People.
What is the Average Household Size in Brule County
Average Household Size in Brule County is 2.5 People.
What is Per Capita Income in Brule County?
Per Capita income in Brule County is $34,629.
What is the Median Family Income in Brule County?
Median Family Income in Brule County is $86,071.
What is the Median Household income in Brule County?
Median Household Income in Brule County is $64,821.
What is Income or Wage Gap in Brule County?
Income or Wage Gap in Brule County is 29.7%.
Women in Brule County earn 70.3 cents for every dollar earned by a man.
What is Inequality or Gini Index in Brule County?
Inequality or Gini Index in Brule County is 0.44.
How Large is the Labor Force in Brule County?
There are 2,745 People in the Labor Forcein in Brule County.
What is the Percentage of People in the Labor Force in Brule County?
66.1% of People are in the Labor Force in Brule County.
What is the Unemployment Rate in Brule County?
Unemployment Rate in Brule County is 3.2%.