Brown County, SD
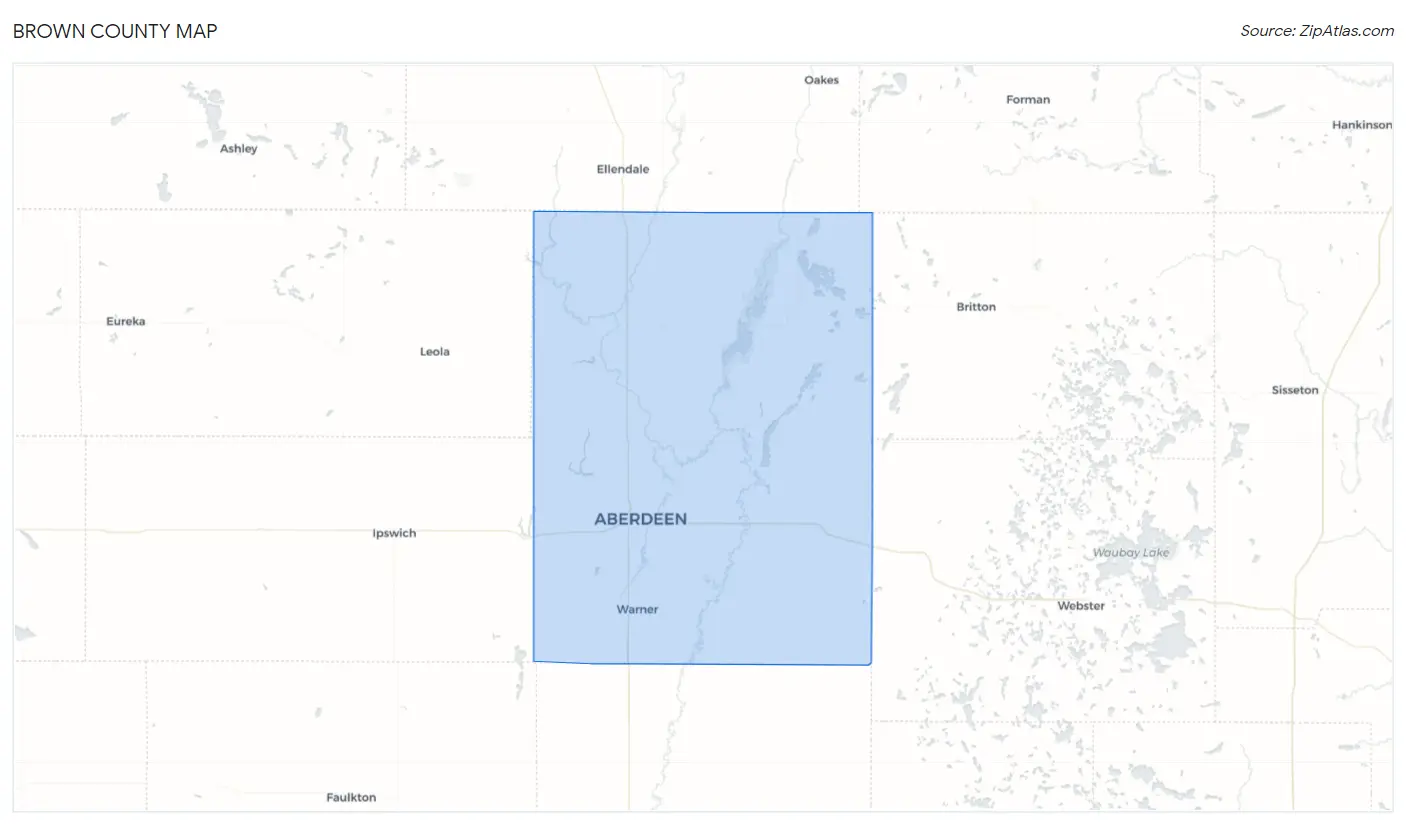
Brown County Map
Brown County Overview
38,278
TOTAL POPULATION
18,974
MALE POPULATION
19,304
FEMALE POPULATION
98.29
MALES / 100 FEMALES
101.74
FEMALES / 100 MALES
37.3
MEDIAN AGE
3.1
AVG FAMILY SIZE
2.3
AVG HOUSEHOLD SIZE
$38,035
PER CAPITA INCOME
$96,494
AVG FAMILY INCOME
$70,379
AVG HOUSEHOLD INCOME
27.1%
WAGE / INCOME GAP [ % ]
72.9¢/ $1
WAGE / INCOME GAP [ $ ]
$8,715
FAMILY INCOME DEFICIT
0.43
INEQUALITY / GINI INDEX
21,568
LABOR FORCE [ PEOPLE ]
70.8%
PERCENT IN LABOR FORCE
3.6%
UNEMPLOYMENT RATE
Brown County Area Codes
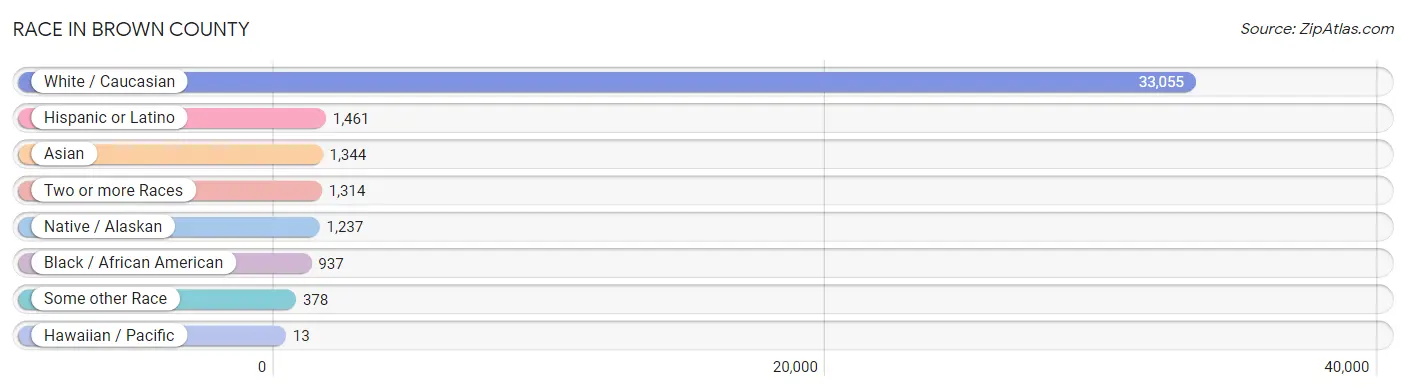
Race in Brown County
The most populous races in Brown County are White / Caucasian (33,055 | 86.4%), Hispanic or Latino (1,461 | 3.8%), and Asian (1,344 | 3.5%).
| Race | # Population | % Population |
| Asian | 1,344 | 3.5% |
| Black / African American | 937 | 2.5% |
| Hawaiian / Pacific | 13 | 0.0% |
| Hispanic or Latino | 1,461 | 3.8% |
| Native / Alaskan | 1,237 | 3.2% |
| White / Caucasian | 33,055 | 86.4% |
| Two or more Races | 1,314 | 3.4% |
| Some other Race | 378 | 1.0% |
| Total | 38,278 | 100.0% |
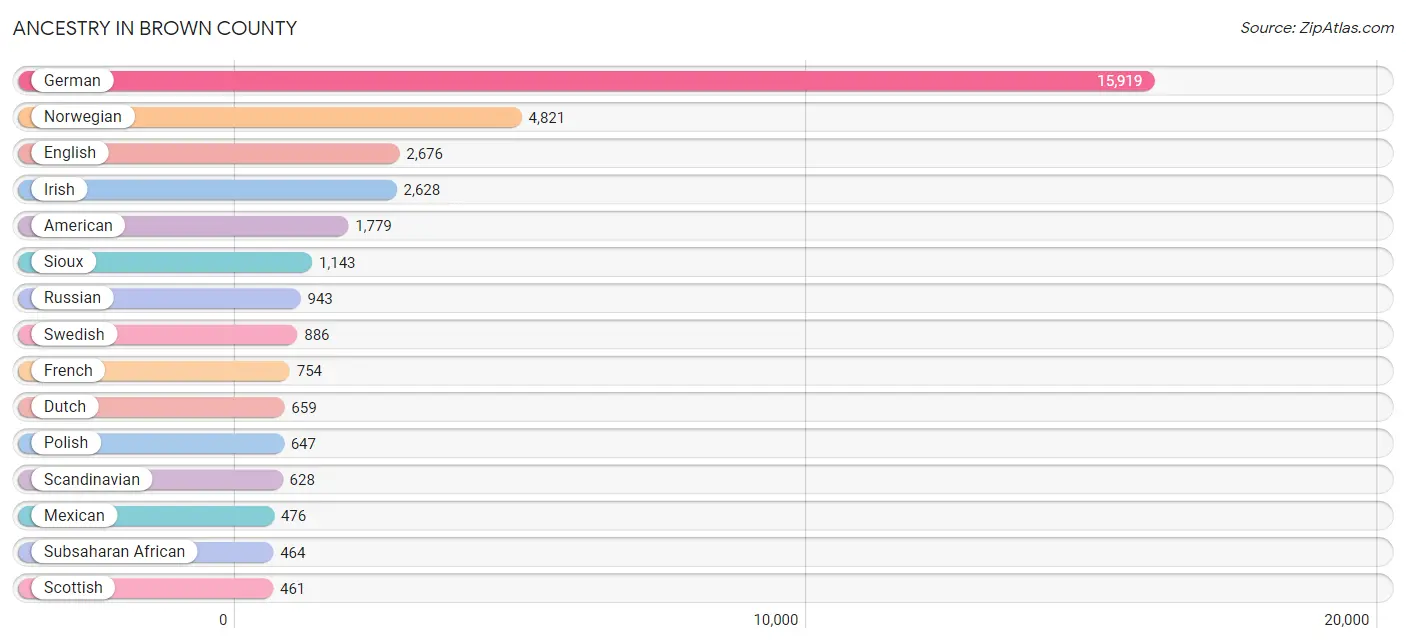
Ancestry in Brown County
The most populous ancestries reported in Brown County are German (15,919 | 41.6%), Norwegian (4,821 | 12.6%), English (2,676 | 7.0%), Irish (2,628 | 6.9%), and American (1,779 | 4.6%), together accounting for 72.7% of all Brown County residents.
| Ancestry | # Population | % Population |
| African | 18 | 0.1% |
| American | 1,779 | 4.6% |
| Arab | 59 | 0.2% |
| Austrian | 20 | 0.1% |
| Belgian | 13 | 0.0% |
| Blackfeet | 35 | 0.1% |
| British | 92 | 0.2% |
| Bulgarian | 28 | 0.1% |
| Burmese | 222 | 0.6% |
| Celtic | 3 | 0.0% |
| Central American | 238 | 0.6% |
| Cherokee | 4 | 0.0% |
| Cheyenne | 60 | 0.2% |
| Chippewa | 155 | 0.4% |
| Colombian | 2 | 0.0% |
| Croatian | 5 | 0.0% |
| Crow | 89 | 0.2% |
| Cuban | 163 | 0.4% |
| Czech | 340 | 0.9% |
| Czechoslovakian | 34 | 0.1% |
| Danish | 257 | 0.7% |
| Dominican | 88 | 0.2% |
| Dutch | 659 | 1.7% |
| English | 2,676 | 7.0% |
| Ethiopian | 20 | 0.1% |
| European | 167 | 0.4% |
| Finnish | 224 | 0.6% |
| French | 754 | 2.0% |
| French Canadian | 111 | 0.3% |
| German | 15,919 | 41.6% |
| German Russian | 40 | 0.1% |
| Greek | 7 | 0.0% |
| Guatemalan | 225 | 0.6% |
| Guyanese | 33 | 0.1% |
| Hungarian | 94 | 0.3% |
| Indian (Asian) | 243 | 0.6% |
| Indonesian | 332 | 0.9% |
| Irish | 2,628 | 6.9% |
| Iroquois | 55 | 0.1% |
| Italian | 330 | 0.9% |
| Jamaican | 8 | 0.0% |
| Korean | 236 | 0.6% |
| Lebanese | 5 | 0.0% |
| Luxembourger | 2 | 0.0% |
| Mexican | 476 | 1.2% |
| Mexican American Indian | 38 | 0.1% |
| Navajo | 14 | 0.0% |
| Northern European | 20 | 0.1% |
| Norwegian | 4,821 | 12.6% |
| Pakistani | 206 | 0.5% |
| Pennsylvania German | 13 | 0.0% |
| Polish | 647 | 1.7% |
| Portuguese | 7 | 0.0% |
| Puerto Rican | 402 | 1.1% |
| Romanian | 109 | 0.3% |
| Russian | 943 | 2.5% |
| Salvadoran | 13 | 0.0% |
| Scandinavian | 628 | 1.6% |
| Scotch-Irish | 103 | 0.3% |
| Scottish | 461 | 1.2% |
| Sioux | 1,143 | 3.0% |
| Slovak | 19 | 0.1% |
| Somali | 342 | 0.9% |
| South African | 84 | 0.2% |
| South American | 2 | 0.0% |
| Spanish | 36 | 0.1% |
| Subsaharan African | 464 | 1.2% |
| Swedish | 886 | 2.3% |
| Swiss | 151 | 0.4% |
| Thai | 6 | 0.0% |
| Welsh | 160 | 0.4% | View All 71 Rows |
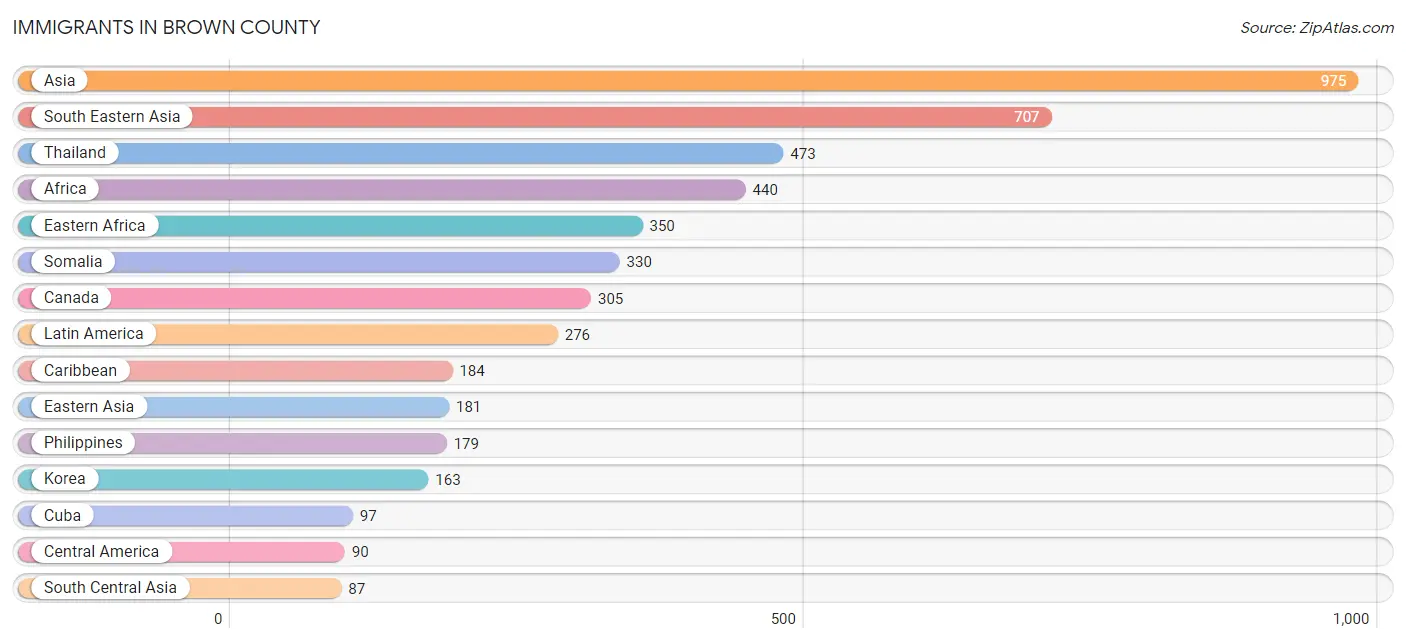
Immigrants in Brown County
The most numerous immigrant groups reported in Brown County came from Asia (975 | 2.5%), South Eastern Asia (707 | 1.8%), Thailand (473 | 1.2%), Africa (440 | 1.1%), and Eastern Africa (350 | 0.9%), together accounting for 7.7% of all Brown County residents.
| Immigration Origin | # Population | % Population |
| Africa | 440 | 1.1% |
| Asia | 975 | 2.5% |
| Canada | 305 | 0.8% |
| Caribbean | 184 | 0.5% |
| Central America | 90 | 0.2% |
| China | 18 | 0.1% |
| Colombia | 2 | 0.0% |
| Cuba | 97 | 0.3% |
| Denmark | 1 | 0.0% |
| Dominican Republic | 79 | 0.2% |
| Eastern Africa | 350 | 0.9% |
| Eastern Asia | 181 | 0.5% |
| Eastern Europe | 9 | 0.0% |
| El Salvador | 13 | 0.0% |
| England | 25 | 0.1% |
| Ethiopia | 20 | 0.1% |
| Europe | 54 | 0.1% |
| Guatemala | 22 | 0.1% |
| India | 64 | 0.2% |
| Jamaica | 8 | 0.0% |
| Korea | 163 | 0.4% |
| Latin America | 276 | 0.7% |
| Mexico | 55 | 0.1% |
| Northern Africa | 54 | 0.1% |
| Northern Europe | 45 | 0.1% |
| Pakistan | 23 | 0.1% |
| Philippines | 179 | 0.5% |
| Russia | 9 | 0.0% |
| Somalia | 330 | 0.9% |
| South Africa | 36 | 0.1% |
| South America | 2 | 0.0% |
| South Central Asia | 87 | 0.2% |
| South Eastern Asia | 707 | 1.8% |
| Sweden | 4 | 0.0% |
| Thailand | 473 | 1.2% | View All 35 Rows |
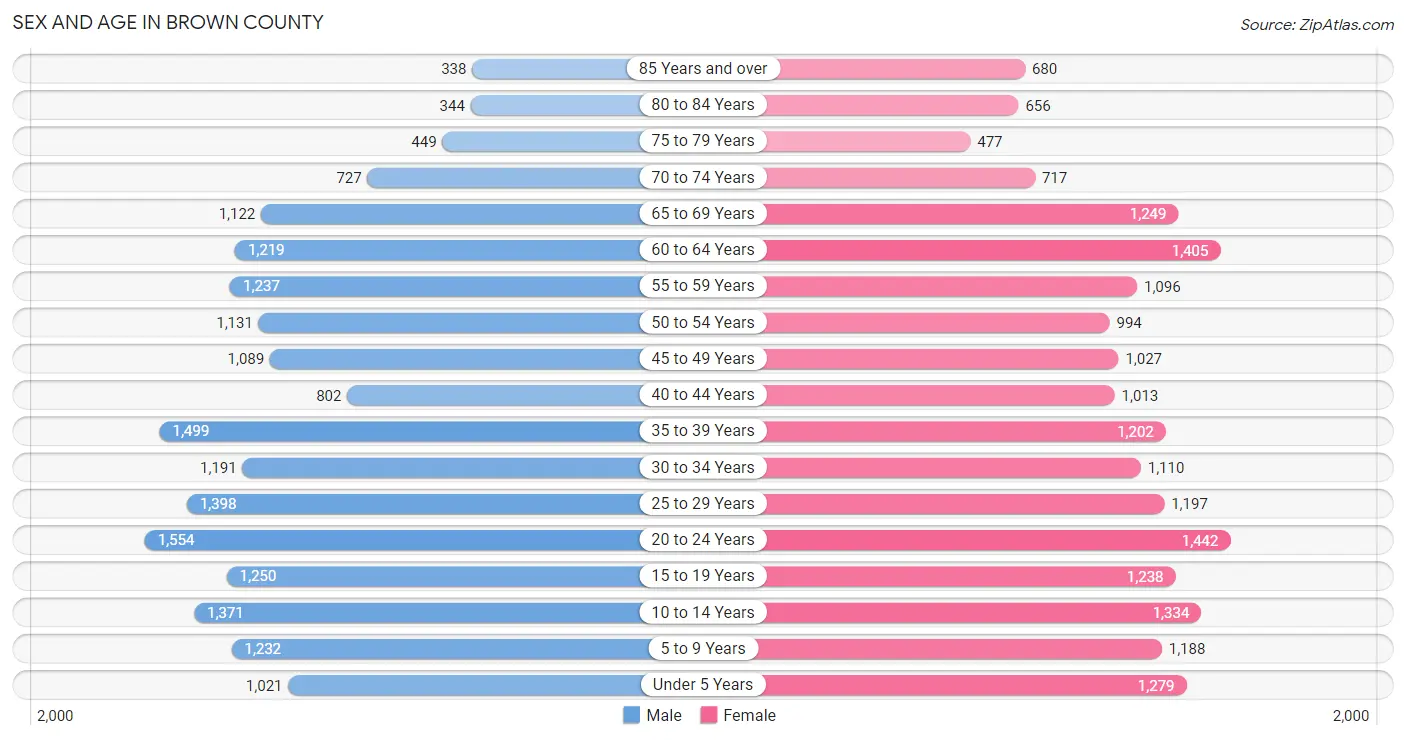
Sex and Age in Brown County
Sex and Age in Brown County
The most populous age groups in Brown County are 20 to 24 Years (1,554 | 8.2%) for men and 20 to 24 Years (1,442 | 7.5%) for women.
| Age Bracket | Male | Female |
| Under 5 Years | 1,021 (5.4%) | 1,279 (6.6%) |
| 5 to 9 Years | 1,232 (6.5%) | 1,188 (6.1%) |
| 10 to 14 Years | 1,371 (7.2%) | 1,334 (6.9%) |
| 15 to 19 Years | 1,250 (6.6%) | 1,238 (6.4%) |
| 20 to 24 Years | 1,554 (8.2%) | 1,442 (7.5%) |
| 25 to 29 Years | 1,398 (7.4%) | 1,197 (6.2%) |
| 30 to 34 Years | 1,191 (6.3%) | 1,110 (5.8%) |
| 35 to 39 Years | 1,499 (7.9%) | 1,202 (6.2%) |
| 40 to 44 Years | 802 (4.2%) | 1,013 (5.2%) |
| 45 to 49 Years | 1,089 (5.7%) | 1,027 (5.3%) |
| 50 to 54 Years | 1,131 (6.0%) | 994 (5.1%) |
| 55 to 59 Years | 1,237 (6.5%) | 1,096 (5.7%) |
| 60 to 64 Years | 1,219 (6.4%) | 1,405 (7.3%) |
| 65 to 69 Years | 1,122 (5.9%) | 1,249 (6.5%) |
| 70 to 74 Years | 727 (3.8%) | 717 (3.7%) |
| 75 to 79 Years | 449 (2.4%) | 477 (2.5%) |
| 80 to 84 Years | 344 (1.8%) | 656 (3.4%) |
| 85 Years and over | 338 (1.8%) | 680 (3.5%) |
| Total | 18,974 (100.0%) | 19,304 (100.0%) |
Families and Households in Brown County
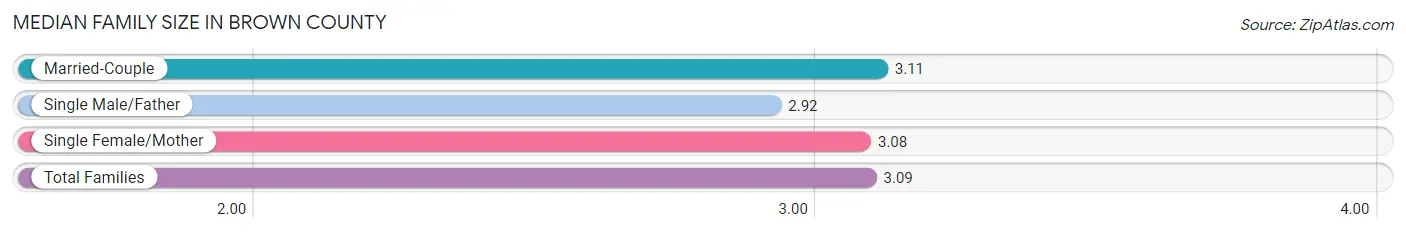
Median Family Size in Brown County
The median family size in Brown County is 3.09 persons per family, with married-couple families (7,256 | 81.2%) accounting for the largest median family size of 3.11 persons per family. On the other hand, single male/father families (683 | 7.6%) represent the smallest median family size with 2.92 persons per family.
| Family Type | # Families | Family Size |
| Married-Couple | 7,256 (81.2%) | 3.11 |
| Single Male/Father | 683 (7.6%) | 2.92 |
| Single Female/Mother | 1,001 (11.2%) | 3.08 |
| Total Families | 8,940 (100.0%) | 3.09 |
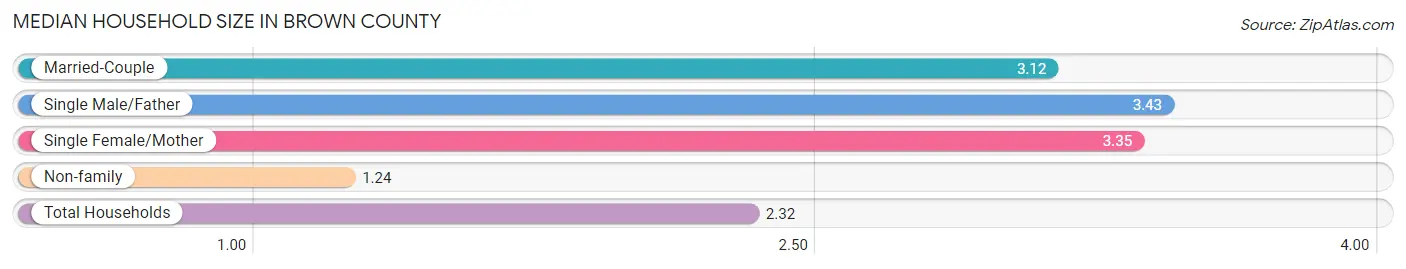
Median Household Size in Brown County
The median household size in Brown County is 2.32 persons per household, with single male/father households (683 | 4.3%) accounting for the largest median household size of 3.43 persons per household. non-family households (7,095 | 44.3%) represent the smallest median household size with 1.24 persons per household.
| Household Type | # Households | Household Size |
| Married-Couple | 7,256 (45.3%) | 3.12 |
| Single Male/Father | 683 (4.3%) | 3.43 |
| Single Female/Mother | 1,001 (6.2%) | 3.35 |
| Non-family | 7,095 (44.3%) | 1.24 |
| Total Households | 16,035 (100.0%) | 2.32 |
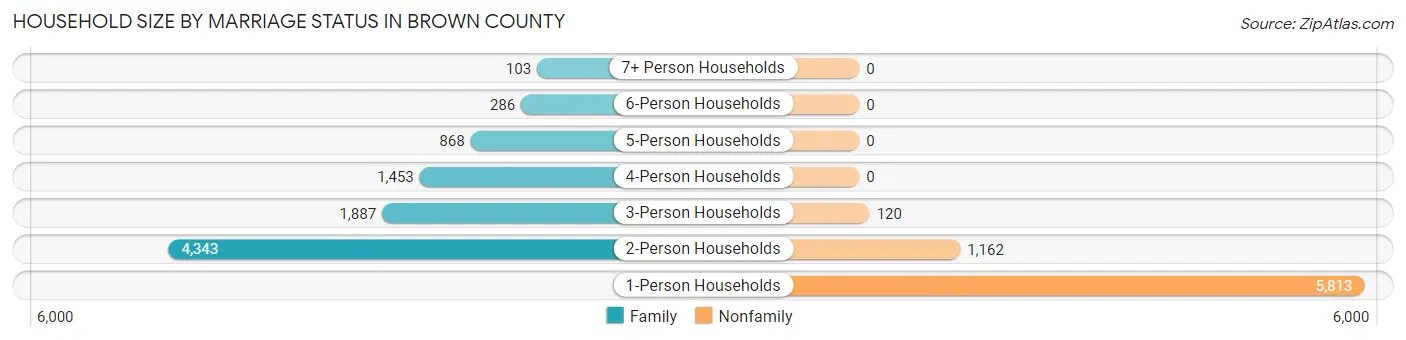
Household Size by Marriage Status in Brown County
Out of a total of 16,035 households in Brown County, 8,940 (55.7%) are family households, while 7,095 (44.3%) are nonfamily households. The most numerous type of family households are 2-person households, comprising 4,343, and the most common type of nonfamily households are 1-person households, comprising 5,813.
| Household Size | Family Households | Nonfamily Households |
| 1-Person Households | - | 5,813 (36.2%) |
| 2-Person Households | 4,343 (27.1%) | 1,162 (7.2%) |
| 3-Person Households | 1,887 (11.8%) | 120 (0.7%) |
| 4-Person Households | 1,453 (9.1%) | 0 (0.0%) |
| 5-Person Households | 868 (5.4%) | 0 (0.0%) |
| 6-Person Households | 286 (1.8%) | 0 (0.0%) |
| 7+ Person Households | 103 (0.6%) | 0 (0.0%) |
| Total | 8,940 (55.7%) | 7,095 (44.3%) |
Female Fertility in Brown County
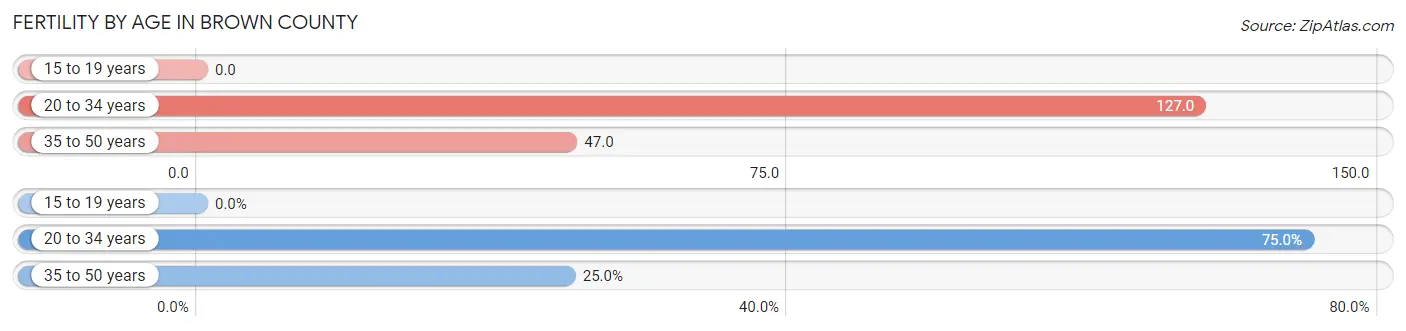
Fertility by Age in Brown County
Average fertility rate in Brown County is 76.0 births per 1,000 women. Women in the age bracket of 20 to 34 years have the highest fertility rate with 127.0 births per 1,000 women. Women in the age bracket of 20 to 34 years acount for 75.0% of all women with births.
| Age Bracket | Women with Births | Births / 1,000 Women |
| 15 to 19 years | 0 (0.0%) | 0.0 |
| 20 to 34 years | 475 (75.0%) | 127.0 |
| 35 to 50 years | 158 (25.0%) | 47.0 |
| Total | 633 (100.0%) | 76.0 |
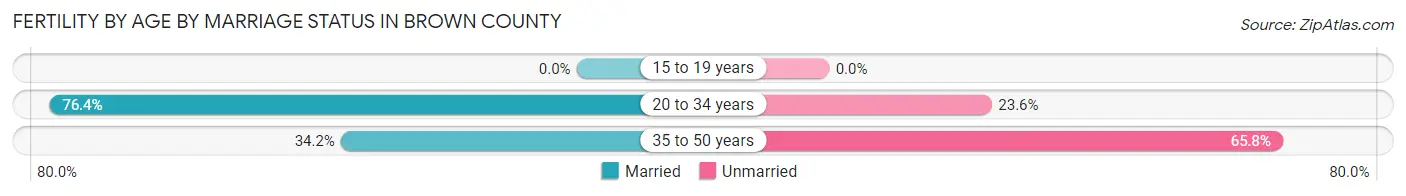
Fertility by Age by Marriage Status in Brown County
65.9% of women with births (633) in Brown County are married. The highest percentage of unmarried women with births falls into 35 to 50 years age bracket with 65.8% of them unmarried at the time of birth, while the lowest percentage of unmarried women with births belong to 20 to 34 years age bracket with 23.6% of them unmarried.
| Age Bracket | Married | Unmarried |
| 15 to 19 years | 0 (0.0%) | 0 (0.0%) |
| 20 to 34 years | 363 (76.4%) | 112 (23.6%) |
| 35 to 50 years | 54 (34.2%) | 104 (65.8%) |
| Total | 417 (65.9%) | 216 (34.1%) |
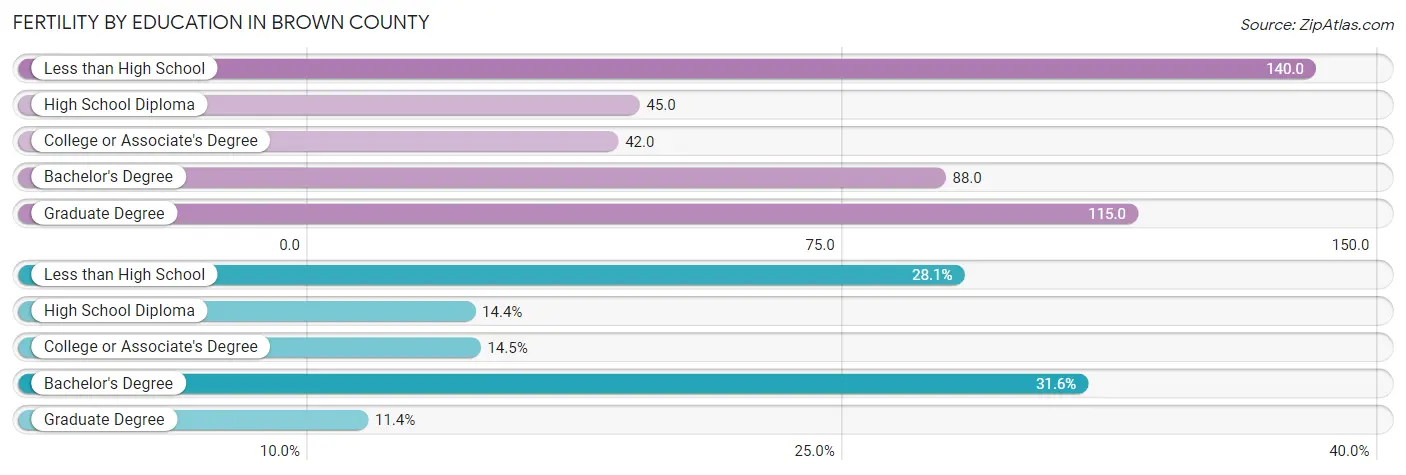
Fertility by Education in Brown County
Average fertility rate in Brown County is 76.0 births per 1,000 women. Women with the education attainment of less than high school have the highest fertility rate of 140.0 births per 1,000 women, while women with the education attainment of college or associate's degree have the lowest fertility at 42.0 births per 1,000 women. Women with the education attainment of bachelor's degree represent 31.6% of all women with births.
| Educational Attainment | Women with Births | Births / 1,000 Women |
| Less than High School | 178 (28.1%) | 140.0 |
| High School Diploma | 91 (14.4%) | 45.0 |
| College or Associate's Degree | 92 (14.5%) | 42.0 |
| Bachelor's Degree | 200 (31.6%) | 88.0 |
| Graduate Degree | 72 (11.4%) | 115.0 |
| Total | 633 (100.0%) | 76.0 |
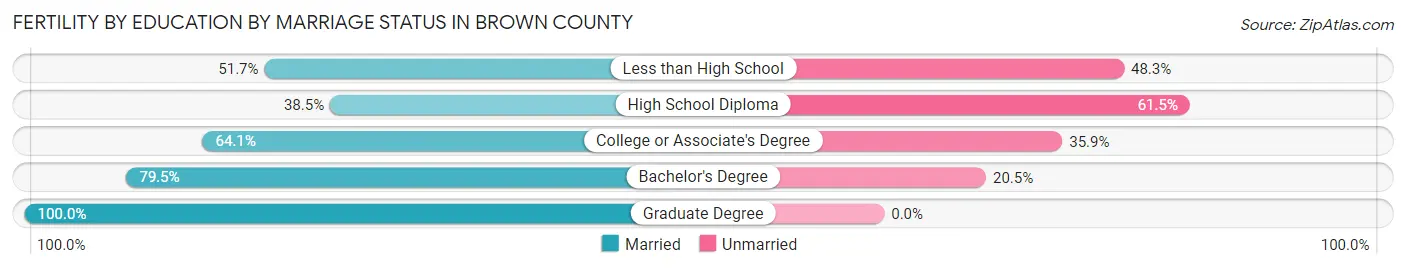
Fertility by Education by Marriage Status in Brown County
34.1% of women with births in Brown County are unmarried. Women with the educational attainment of graduate degree are most likely to be married with 100.0% of them married at childbirth, while women with the educational attainment of high school diploma are least likely to be married with 61.5% of them unmarried at childbirth.
| Educational Attainment | Married | Unmarried |
| Less than High School | 92 (51.7%) | 86 (48.3%) |
| High School Diploma | 35 (38.5%) | 56 (61.5%) |
| College or Associate's Degree | 59 (64.1%) | 33 (35.9%) |
| Bachelor's Degree | 159 (79.5%) | 41 (20.5%) |
| Graduate Degree | 72 (100.0%) | 0 (0.0%) |
| Total | 417 (65.9%) | 216 (34.1%) |
Income in Brown County
Income Overview in Brown County
Per Capita Income in Brown County is $38,035, while median incomes of families and households are $96,494 and $70,379 respectively.
| Characteristic | Number | Measure |
| Per Capita Income | 38,278 | $38,035 |
| Median Family Income | 8,940 | $96,494 |
| Mean Family Income | 8,940 | $113,758 |
| Median Household Income | 16,035 | $70,379 |
| Mean Household Income | 16,035 | $87,751 |
| Income Deficit | 8,940 | $8,715 |
| Wage / Income Gap (%) | 38,278 | 27.11% |
| Wage / Income Gap ($) | 38,278 | 72.89¢ per $1 |
| Gini / Inequality Index | 38,278 | 0.43 |
Earnings by Sex in Brown County
Average Earnings in Brown County are $40,096, $45,872 for men and $33,438 for women, a difference of 27.1%.
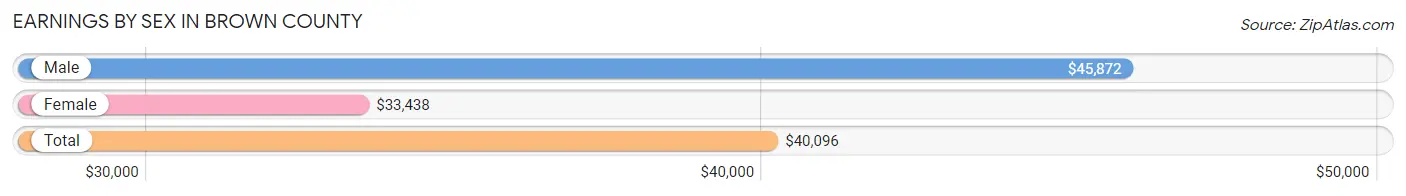
| Sex | Number | Average Earnings |
| Male | 12,064 (53.1%) | $45,872 |
| Female | 10,637 (46.9%) | $33,438 |
| Total | 22,701 (100.0%) | $40,096 |
Earnings by Sex by Income Bracket in Brown County
The most common earnings brackets in Brown County are $100,000+ for men (1,585 | 13.1%) and $55,000 to $64,999 for women (934 | 8.8%).
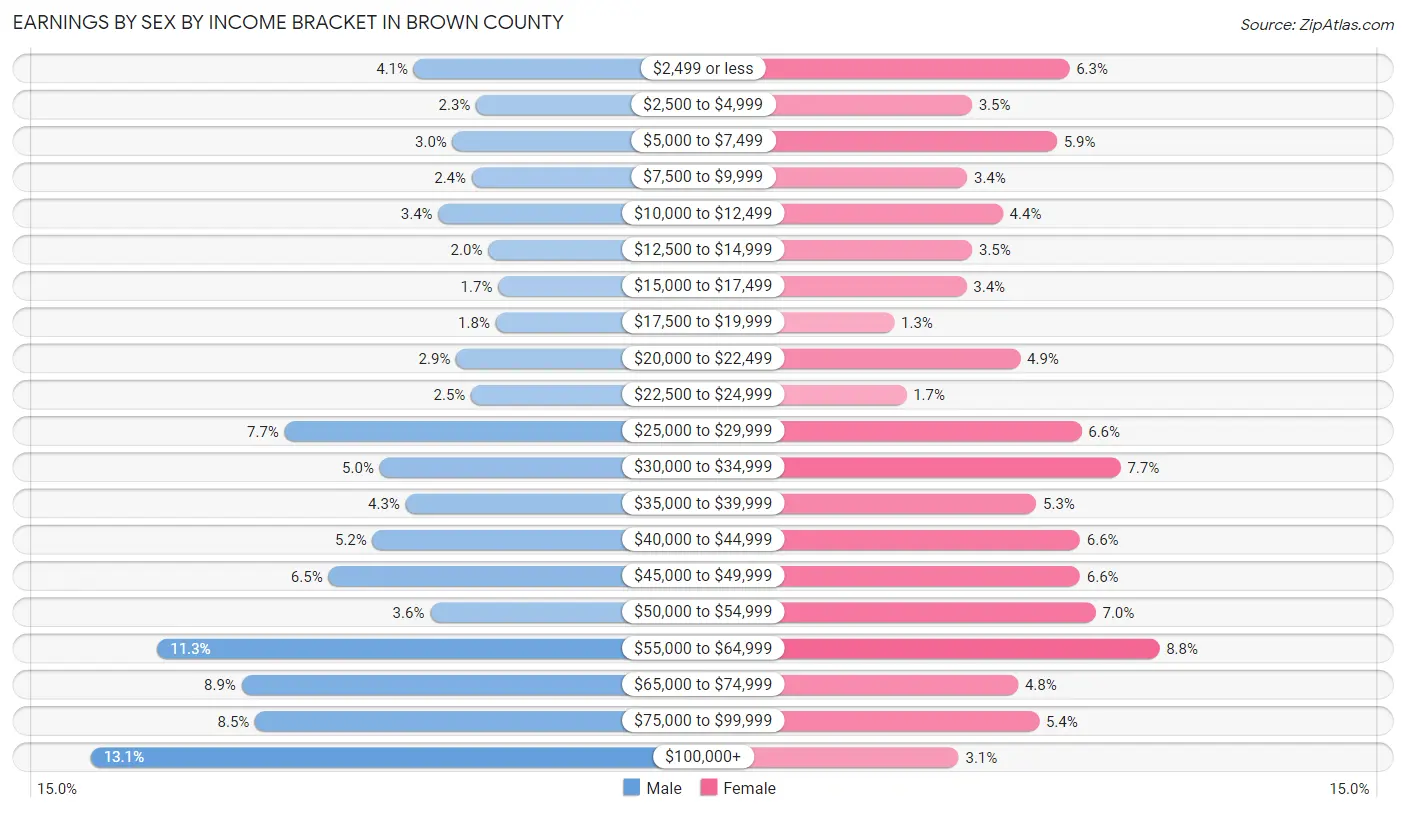
| Income | Male | Female |
| $2,499 or less | 490 (4.1%) | 665 (6.2%) |
| $2,500 to $4,999 | 279 (2.3%) | 373 (3.5%) |
| $5,000 to $7,499 | 358 (3.0%) | 628 (5.9%) |
| $7,500 to $9,999 | 293 (2.4%) | 360 (3.4%) |
| $10,000 to $12,499 | 407 (3.4%) | 466 (4.4%) |
| $12,500 to $14,999 | 238 (2.0%) | 374 (3.5%) |
| $15,000 to $17,499 | 204 (1.7%) | 357 (3.4%) |
| $17,500 to $19,999 | 212 (1.8%) | 141 (1.3%) |
| $20,000 to $22,499 | 346 (2.9%) | 518 (4.9%) |
| $22,500 to $24,999 | 295 (2.5%) | 178 (1.7%) |
| $25,000 to $29,999 | 928 (7.7%) | 701 (6.6%) |
| $30,000 to $34,999 | 606 (5.0%) | 818 (7.7%) |
| $35,000 to $39,999 | 518 (4.3%) | 566 (5.3%) |
| $40,000 to $44,999 | 630 (5.2%) | 697 (6.6%) |
| $45,000 to $49,999 | 779 (6.5%) | 697 (6.6%) |
| $50,000 to $54,999 | 434 (3.6%) | 744 (7.0%) |
| $55,000 to $64,999 | 1,360 (11.3%) | 934 (8.8%) |
| $65,000 to $74,999 | 1,074 (8.9%) | 512 (4.8%) |
| $75,000 to $99,999 | 1,028 (8.5%) | 574 (5.4%) |
| $100,000+ | 1,585 (13.1%) | 334 (3.1%) |
| Total | 12,064 (100.0%) | 10,637 (100.0%) |
Earnings by Sex by Educational Attainment in Brown County
Average earnings in Brown County are $54,808 for men and $39,858 for women, a difference of 27.3%. Men with an educational attainment of graduate degree enjoy the highest average annual earnings of $77,688, while those with less than high school education earn the least with $34,167. Women with an educational attainment of graduate degree earn the most with the average annual earnings of $62,143, while those with less than high school education have the smallest earnings of $29,321.
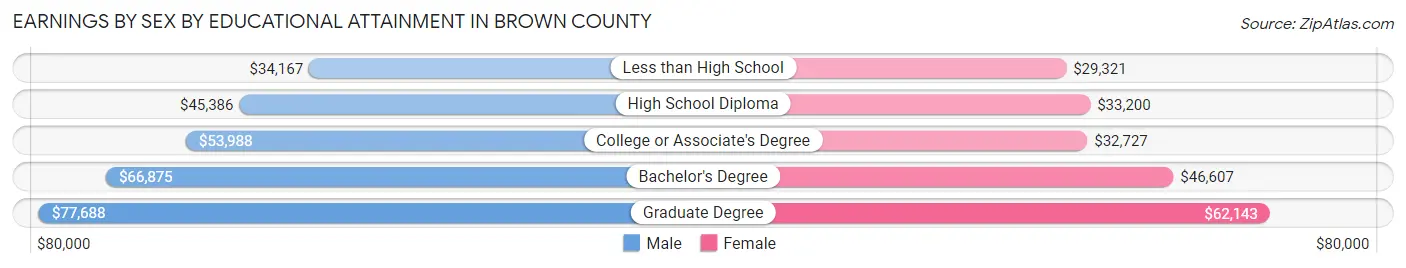
| Educational Attainment | Male Income | Female Income |
| Less than High School | $34,167 | $29,321 |
| High School Diploma | $45,386 | $33,200 |
| College or Associate's Degree | $53,988 | $32,727 |
| Bachelor's Degree | $66,875 | $46,607 |
| Graduate Degree | $77,688 | $62,143 |
| Total | $54,808 | $39,858 |
Family Income in Brown County
Family Income Brackets in Brown County
According to the Brown County family income data, there are 2,324 families falling into the $100,000 to $149,999 income range, which is the most common income bracket and makes up 26.0% of all families. Conversely, the $10,000 to $14,999 income bracket is the least frequent group with only 134 families (1.5%) belonging to this category.
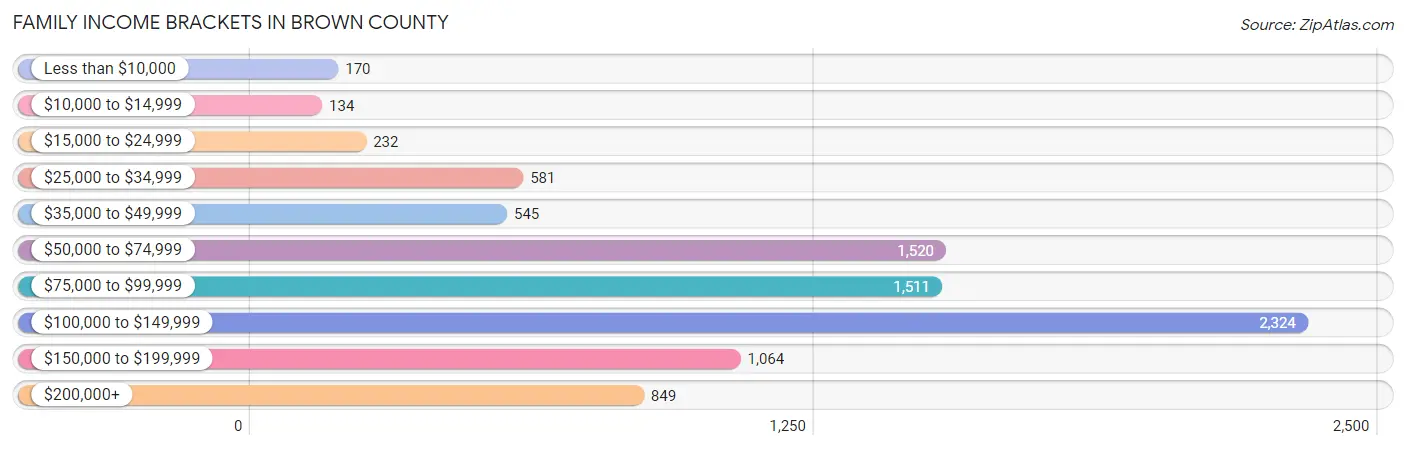
| Income Bracket | # Families | % Families |
| Less than $10,000 | 170 | 1.9% |
| $10,000 to $14,999 | 134 | 1.5% |
| $15,000 to $24,999 | 232 | 2.6% |
| $25,000 to $34,999 | 581 | 6.5% |
| $35,000 to $49,999 | 545 | 6.1% |
| $50,000 to $74,999 | 1,520 | 17.0% |
| $75,000 to $99,999 | 1,511 | 16.9% |
| $100,000 to $149,999 | 2,324 | 26.0% |
| $150,000 to $199,999 | 1,064 | 11.9% |
| $200,000+ | 849 | 9.5% |
Family Income by Famaliy Size in Brown County
5-person families (784 | 8.8%) account for the highest median family income in Brown County with $130,349 per family, while 2-person families (4,601 | 51.5%) have the highest median income of $44,018 per family member.
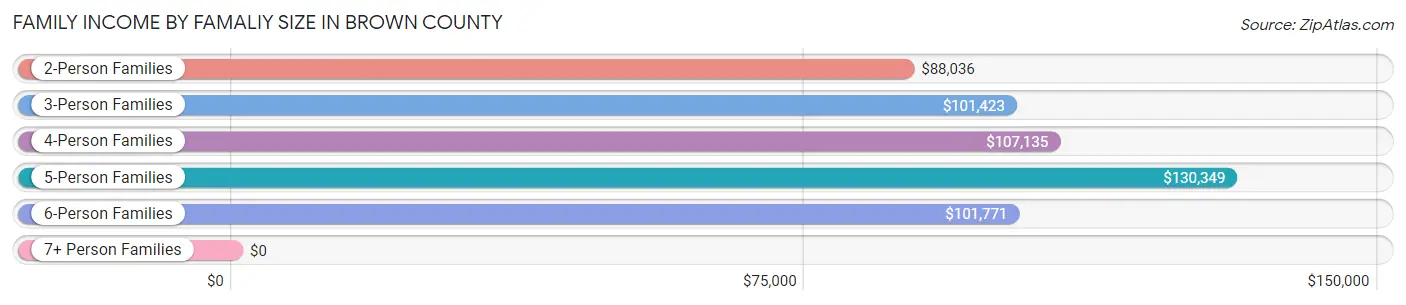
| Income Bracket | # Families | Median Income |
| 2-Person Families | 4,601 (51.5%) | $88,036 |
| 3-Person Families | 1,811 (20.3%) | $101,423 |
| 4-Person Families | 1,431 (16.0%) | $107,135 |
| 5-Person Families | 784 (8.8%) | $130,349 |
| 6-Person Families | 271 (3.0%) | $101,771 |
| 7+ Person Families | 42 (0.5%) | $0 |
| Total | 8,940 (100.0%) | $96,494 |
Family Income by Number of Earners in Brown County
The median family income in Brown County is $96,494, with families comprising 3+ earners (1,109) having the highest median family income of $141,372, while families with no earners (1,101) have the lowest median family income of $55,819, accounting for 12.4% and 12.3% of families, respectively.
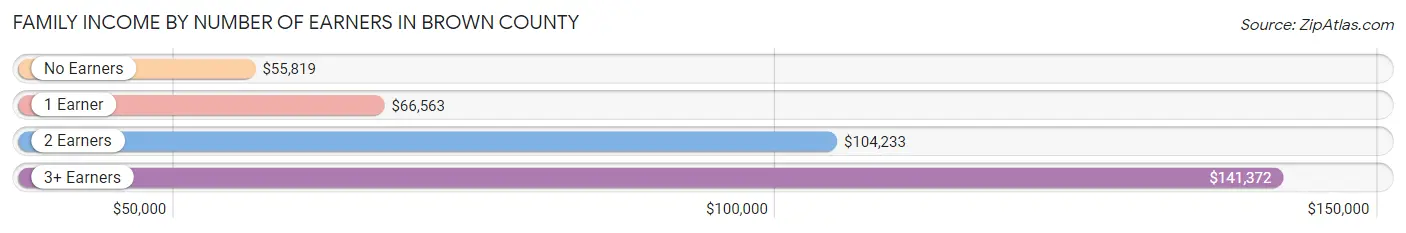
| Number of Earners | # Families | Median Income |
| No Earners | 1,101 (12.3%) | $55,819 |
| 1 Earner | 2,223 (24.9%) | $66,563 |
| 2 Earners | 4,507 (50.4%) | $104,233 |
| 3+ Earners | 1,109 (12.4%) | $141,372 |
| Total | 8,940 (100.0%) | $96,494 |
Household Income in Brown County
Household Income Brackets in Brown County
With 3,111 households falling in the category, the $50,000 to $74,999 income range is the most frequent in Brown County, accounting for 19.4% of all households. In contrast, only 529 households (3.3%) fall into the $10,000 to $14,999 income bracket, making it the least populous group.
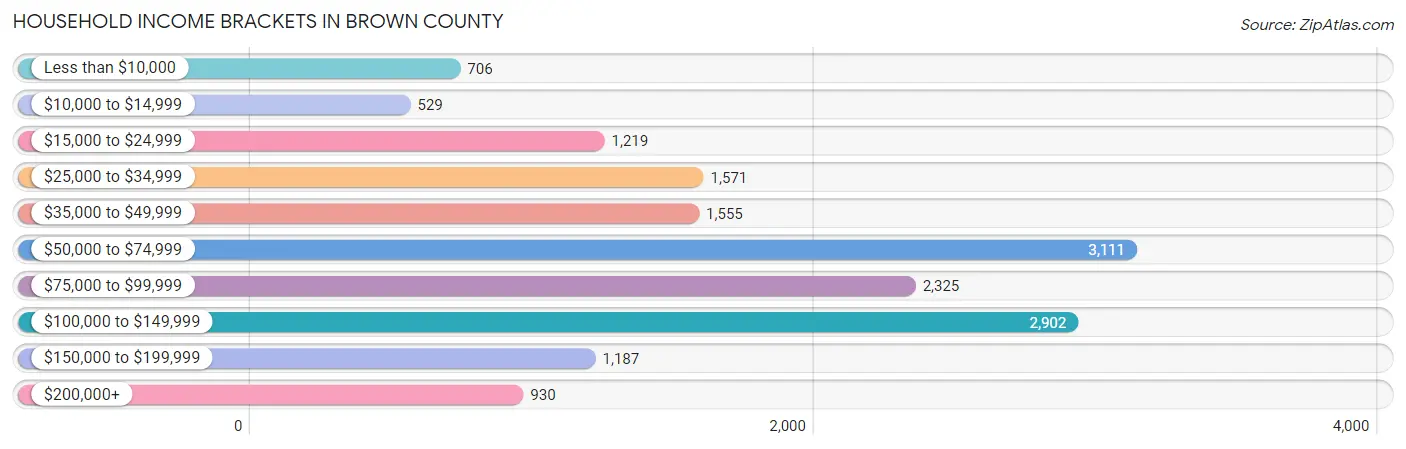
| Income Bracket | # Households | % Households |
| Less than $10,000 | 706 | 4.4% |
| $10,000 to $14,999 | 529 | 3.3% |
| $15,000 to $24,999 | 1,219 | 7.6% |
| $25,000 to $34,999 | 1,571 | 9.8% |
| $35,000 to $49,999 | 1,555 | 9.7% |
| $50,000 to $74,999 | 3,111 | 19.4% |
| $75,000 to $99,999 | 2,325 | 14.5% |
| $100,000 to $149,999 | 2,902 | 18.1% |
| $150,000 to $199,999 | 1,187 | 7.4% |
| $200,000+ | 930 | 5.8% |
Household Income by Householder Age in Brown County
The median household income in Brown County is $70,379, with the highest median household income of $84,737 found in the 45 to 64 years age bracket for the primary householder. A total of 5,173 households (32.3%) fall into this category. Meanwhile, the 15 to 24 years age bracket for the primary householder has the lowest median household income of $39,677, with 1,214 households (7.6%) in this group.
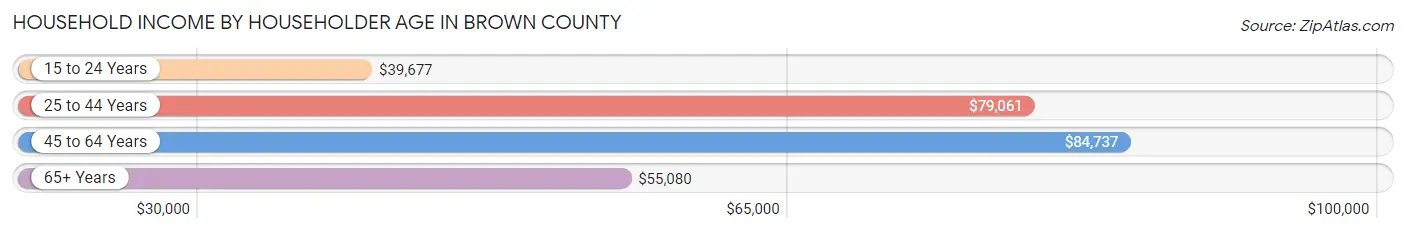
| Income Bracket | # Households | Median Income |
| 15 to 24 Years | 1,214 (7.6%) | $39,677 |
| 25 to 44 Years | 5,290 (33.0%) | $79,061 |
| 45 to 64 Years | 5,173 (32.3%) | $84,737 |
| 65+ Years | 4,358 (27.2%) | $55,080 |
| Total | 16,035 (100.0%) | $70,379 |
Poverty in Brown County
Income Below Poverty by Sex and Age in Brown County
With 8.2% poverty level for males and 12.9% for females among the residents of Brown County, 15 year old males and 12 to 14 year old females are the most vulnerable to poverty, with 48 males (27.3%) and 238 females (31.7%) in their respective age groups living below the poverty level.
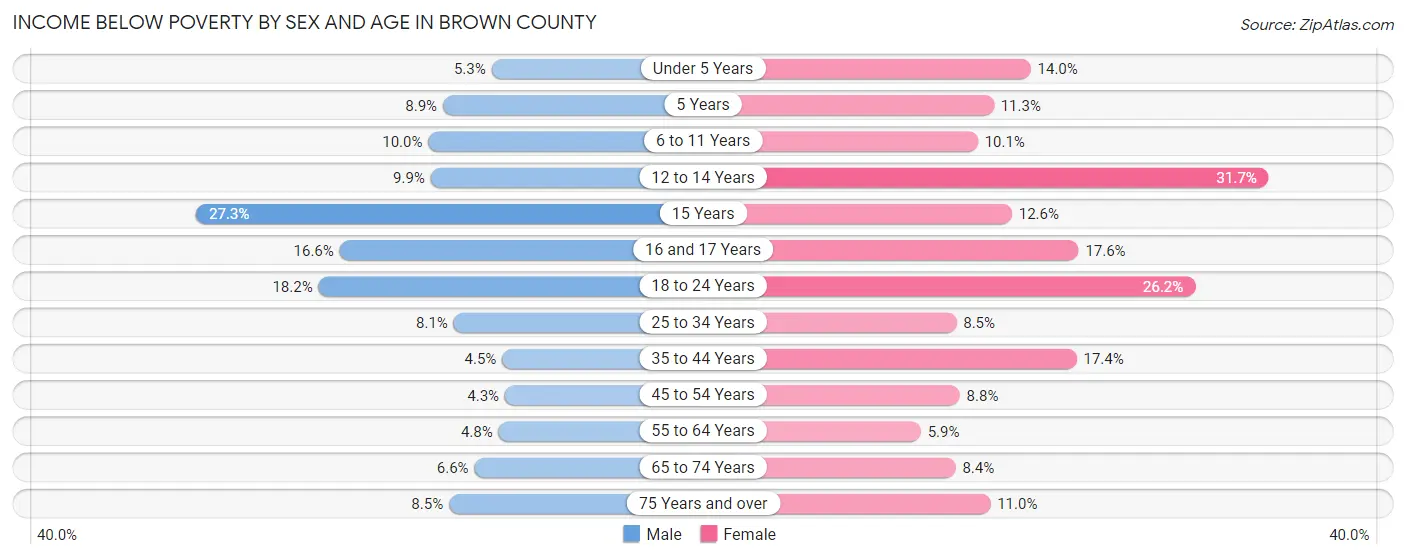
| Age Bracket | Male | Female |
| Under 5 Years | 53 (5.3%) | 176 (14.0%) |
| 5 Years | 16 (8.9%) | 22 (11.3%) |
| 6 to 11 Years | 150 (10.0%) | 151 (10.1%) |
| 12 to 14 Years | 85 (9.9%) | 238 (31.7%) |
| 15 Years | 48 (27.3%) | 27 (12.6%) |
| 16 and 17 Years | 97 (16.6%) | 84 (17.6%) |
| 18 to 24 Years | 329 (18.2%) | 475 (26.2%) |
| 25 to 34 Years | 210 (8.1%) | 196 (8.5%) |
| 35 to 44 Years | 104 (4.5%) | 385 (17.4%) |
| 45 to 54 Years | 96 (4.3%) | 176 (8.7%) |
| 55 to 64 Years | 117 (4.8%) | 146 (5.9%) |
| 65 to 74 Years | 122 (6.6%) | 165 (8.4%) |
| 75 Years and over | 88 (8.5%) | 167 (11.0%) |
| Total | 1,515 (8.2%) | 2,408 (12.9%) |
Income Above Poverty by Sex and Age in Brown County
According to the poverty statistics in Brown County, males aged 45 to 54 years and females aged 55 to 64 years are the age groups that are most secure financially, with 95.7% of males and 94.1% of females in these age groups living above the poverty line.
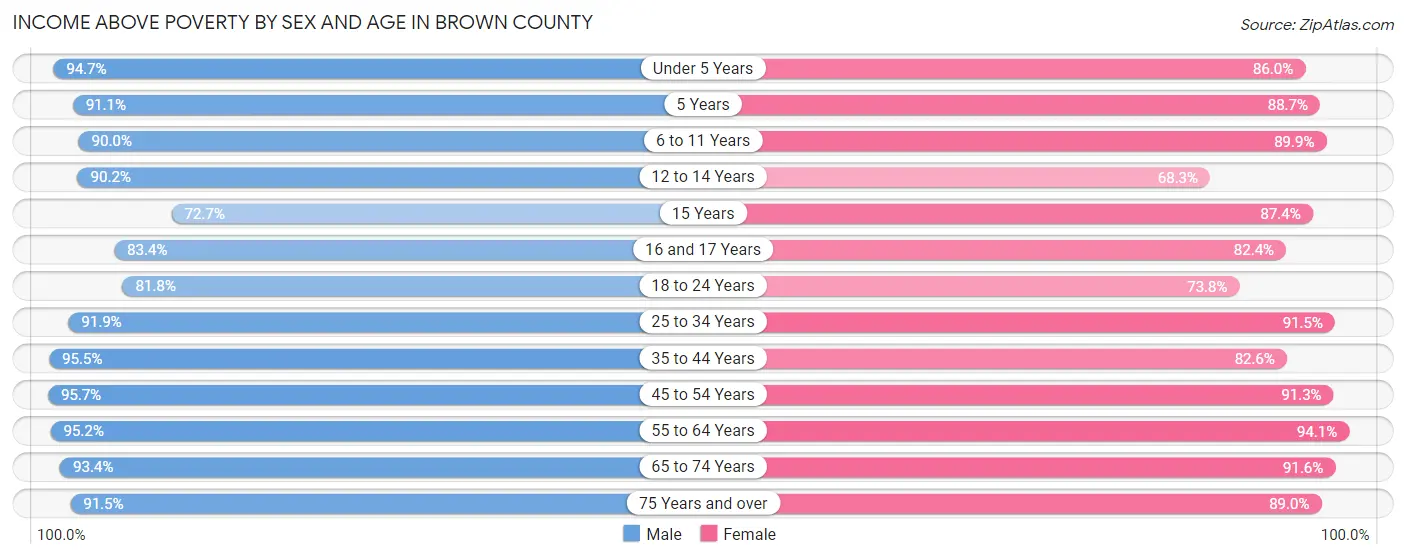
| Age Bracket | Male | Female |
| Under 5 Years | 942 (94.7%) | 1,079 (86.0%) |
| 5 Years | 163 (91.1%) | 173 (88.7%) |
| 6 to 11 Years | 1,345 (90.0%) | 1,346 (89.9%) |
| 12 to 14 Years | 778 (90.1%) | 513 (68.3%) |
| 15 Years | 128 (72.7%) | 187 (87.4%) |
| 16 and 17 Years | 487 (83.4%) | 394 (82.4%) |
| 18 to 24 Years | 1,481 (81.8%) | 1,336 (73.8%) |
| 25 to 34 Years | 2,369 (91.9%) | 2,111 (91.5%) |
| 35 to 44 Years | 2,188 (95.5%) | 1,824 (82.6%) |
| 45 to 54 Years | 2,114 (95.7%) | 1,835 (91.2%) |
| 55 to 64 Years | 2,317 (95.2%) | 2,345 (94.1%) |
| 65 to 74 Years | 1,727 (93.4%) | 1,790 (91.6%) |
| 75 Years and over | 949 (91.5%) | 1,349 (89.0%) |
| Total | 16,988 (91.8%) | 16,282 (87.1%) |
Income Below Poverty Among Married-Couple Families in Brown County
The poverty statistics for married-couple families in Brown County show that 2.6% or 187 of the total 7,256 families live below the poverty line. Families with 1 or 2 children have the highest poverty rate of 2.9%, comprising of 61 families. On the other hand, families with 5 or more children have the lowest poverty rate of 0.0%, which includes 0 families.
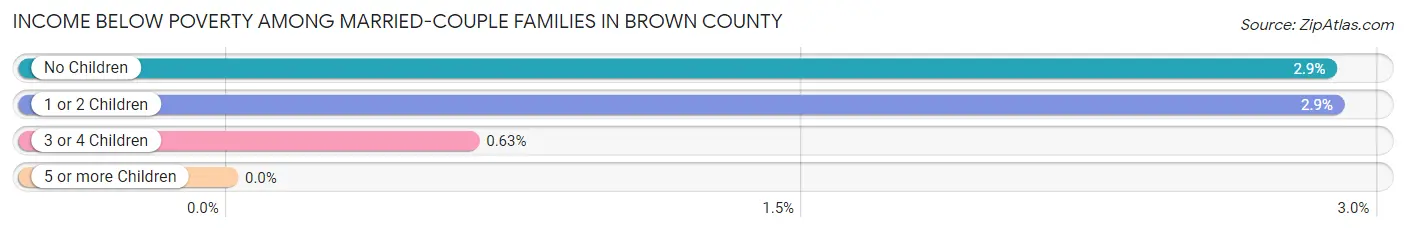
| Children | Above Poverty | Below Poverty |
| No Children | 4,058 (97.1%) | 120 (2.9%) |
| 1 or 2 Children | 2,047 (97.1%) | 61 (2.9%) |
| 3 or 4 Children | 941 (99.4%) | 6 (0.6%) |
| 5 or more Children | 23 (100.0%) | 0 (0.0%) |
| Total | 7,069 (97.4%) | 187 (2.6%) |
Income Below Poverty Among Single-Parent Households in Brown County
According to the poverty data in Brown County, 5.7% or 39 single-father households and 32.5% or 325 single-mother households are living below the poverty line. Among single-father households, those with 1 or 2 children have the highest poverty rate, with 25 households (8.3%) experiencing poverty. Likewise, among single-mother households, those with 5 or more children have the highest poverty rate, with 2 households (100.0%) falling below the poverty line.
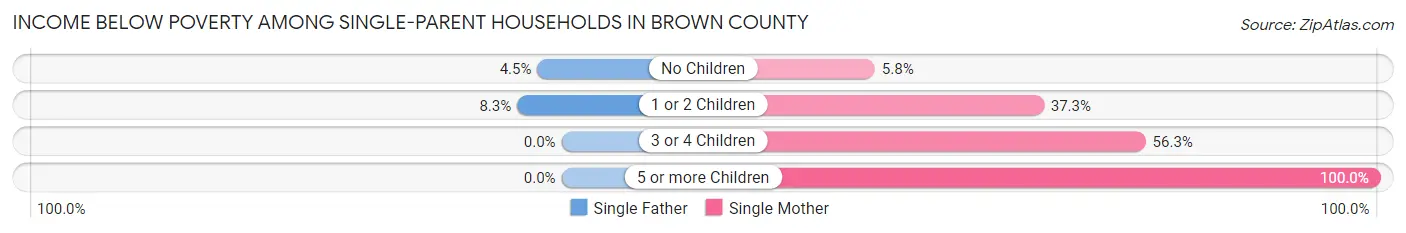
| Children | Single Father | Single Mother |
| No Children | 14 (4.5%) | 17 (5.8%) |
| 1 or 2 Children | 25 (8.3%) | 180 (37.3%) |
| 3 or 4 Children | 0 (0.0%) | 126 (56.2%) |
| 5 or more Children | 0 (0.0%) | 2 (100.0%) |
| Total | 39 (5.7%) | 325 (32.5%) |
Income Below Poverty Among Married-Couple vs Single-Parent Households in Brown County
The poverty data for Brown County shows that 187 of the married-couple family households (2.6%) and 364 of the single-parent households (21.6%) are living below the poverty level. Within the married-couple family households, those with 1 or 2 children have the highest poverty rate, with 61 households (2.9%) falling below the poverty line. Among the single-parent households, those with 5 or more children have the highest poverty rate, with 2 household (100.0%) living below poverty.
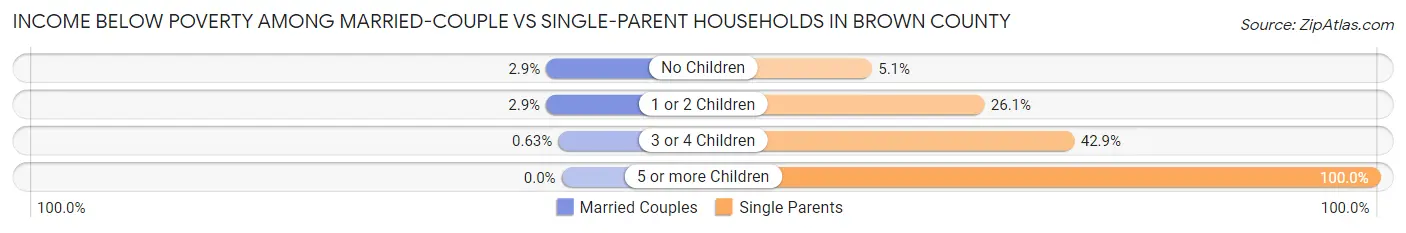
| Children | Married-Couple Families | Single-Parent Households |
| No Children | 120 (2.9%) | 31 (5.1%) |
| 1 or 2 Children | 61 (2.9%) | 205 (26.1%) |
| 3 or 4 Children | 6 (0.6%) | 126 (42.9%) |
| 5 or more Children | 0 (0.0%) | 2 (100.0%) |
| Total | 187 (2.6%) | 364 (21.6%) |
Employment Characteristics in Brown County
Employment by Class of Employer in Brown County
Among the 20,522 employed individuals in Brown County, private company employees (13,138 | 64.0%), not-for-profit organizations (2,209 | 10.8%), and self-employed (not incorporated) (1,563 | 7.6%) make up the most common classes of employment.
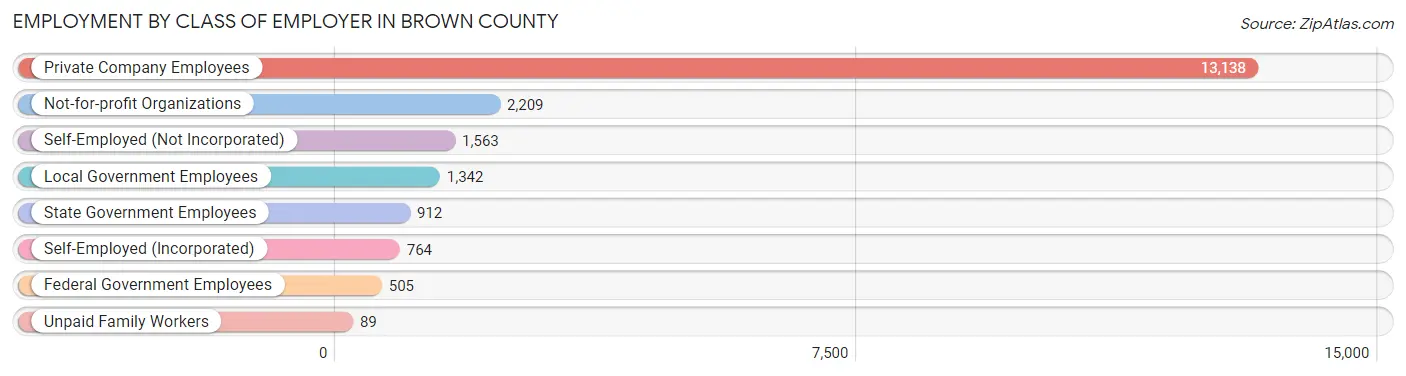
| Employer Class | # Employees | % Employees |
| Private Company Employees | 13,138 | 64.0% |
| Self-Employed (Incorporated) | 764 | 3.7% |
| Self-Employed (Not Incorporated) | 1,563 | 7.6% |
| Not-for-profit Organizations | 2,209 | 10.8% |
| Local Government Employees | 1,342 | 6.5% |
| State Government Employees | 912 | 4.4% |
| Federal Government Employees | 505 | 2.5% |
| Unpaid Family Workers | 89 | 0.4% |
| Total | 20,522 | 100.0% |
Employment Status by Age in Brown County
According to the labor force statistics for Brown County, out of the total population over 16 years of age (30,463), 70.8% or 21,568 individuals are in the labor force, with 3.6% or 776 of them unemployed. The age group with the highest labor force participation rate is 30 to 34 years, with 94.4% or 2,172 individuals in the labor force. Within the labor force, the 16 to 19 years age range has the highest percentage of unemployed individuals, with 9.6% or 129 of them being unemployed.
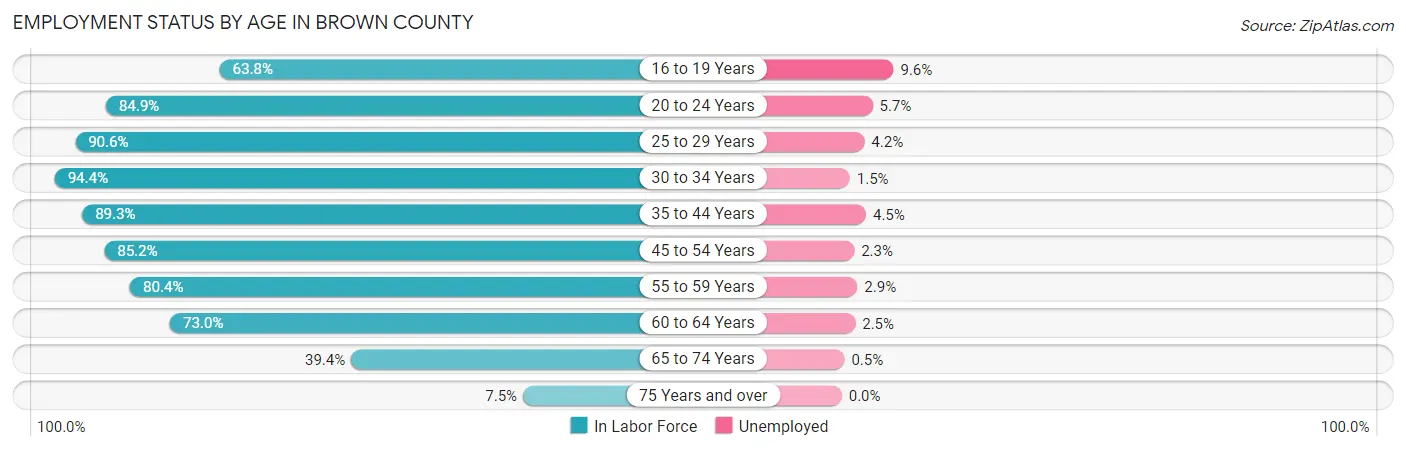
| Age Bracket | In Labor Force | Unemployed |
| 16 to 19 Years | 1,339 (63.8%) | 129 (9.6%) |
| 20 to 24 Years | 2,544 (84.9%) | 145 (5.7%) |
| 25 to 29 Years | 2,351 (90.6%) | 99 (4.2%) |
| 30 to 34 Years | 2,172 (94.4%) | 33 (1.5%) |
| 35 to 44 Years | 4,033 (89.3%) | 181 (4.5%) |
| 45 to 54 Years | 3,613 (85.2%) | 83 (2.3%) |
| 55 to 59 Years | 1,876 (80.4%) | 54 (2.9%) |
| 60 to 64 Years | 1,916 (73.0%) | 48 (2.5%) |
| 65 to 74 Years | 1,503 (39.4%) | 8 (0.5%) |
| 75 Years and over | 221 (7.5%) | 0 (0.0%) |
| Total | 21,568 (70.8%) | 776 (3.6%) |
Employment Status by Educational Attainment in Brown County
According to labor force statistics for Brown County, 85.8% of individuals (15,967) out of the total population between 25 and 64 years of age (18,610) are in the labor force, with 3.1% or 495 of them being unemployed. The group with the highest labor force participation rate are those with the educational attainment of bachelor's degree or higher, with 89.7% or 5,967 individuals in the labor force. Within the labor force, individuals with high school diploma education have the highest percentage of unemployment, with 5.7% or 243 of them being unemployed.
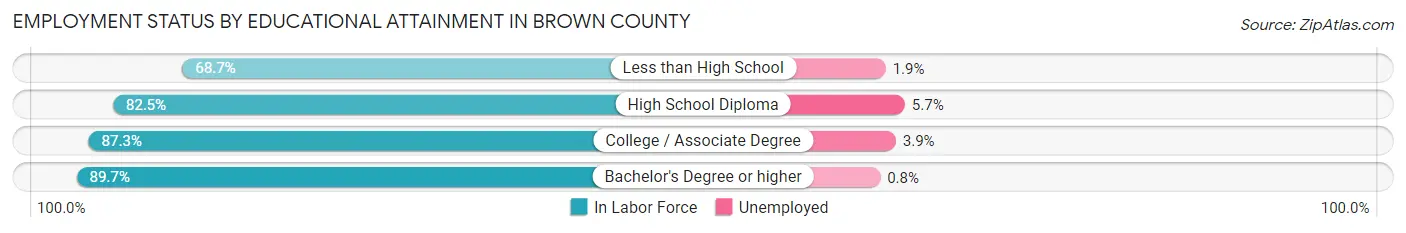
| Educational Attainment | In Labor Force | Unemployed |
| Less than High School | 753 (68.7%) | 21 (1.9%) |
| High School Diploma | 4,262 (82.5%) | 294 (5.7%) |
| College / Associate Degree | 4,973 (87.3%) | 222 (3.9%) |
| Bachelor's Degree or higher | 5,967 (89.7%) | 53 (0.8%) |
| Total | 15,967 (85.8%) | 577 (3.1%) |
Employment Occupations by Sex in Brown County
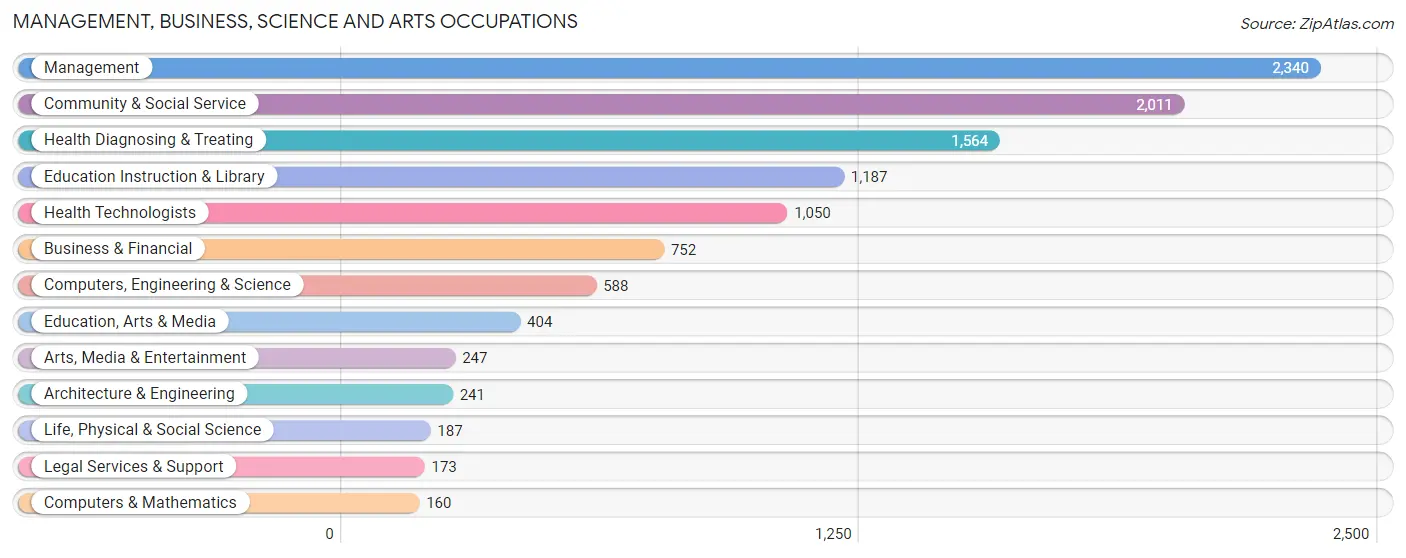
Management, Business, Science and Arts Occupations
The most common Management, Business, Science and Arts occupations in Brown County are Management (2,340 | 11.3%), Community & Social Service (2,011 | 9.7%), Health Diagnosing & Treating (1,564 | 7.5%), Education Instruction & Library (1,187 | 5.7%), and Health Technologists (1,050 | 5.1%).
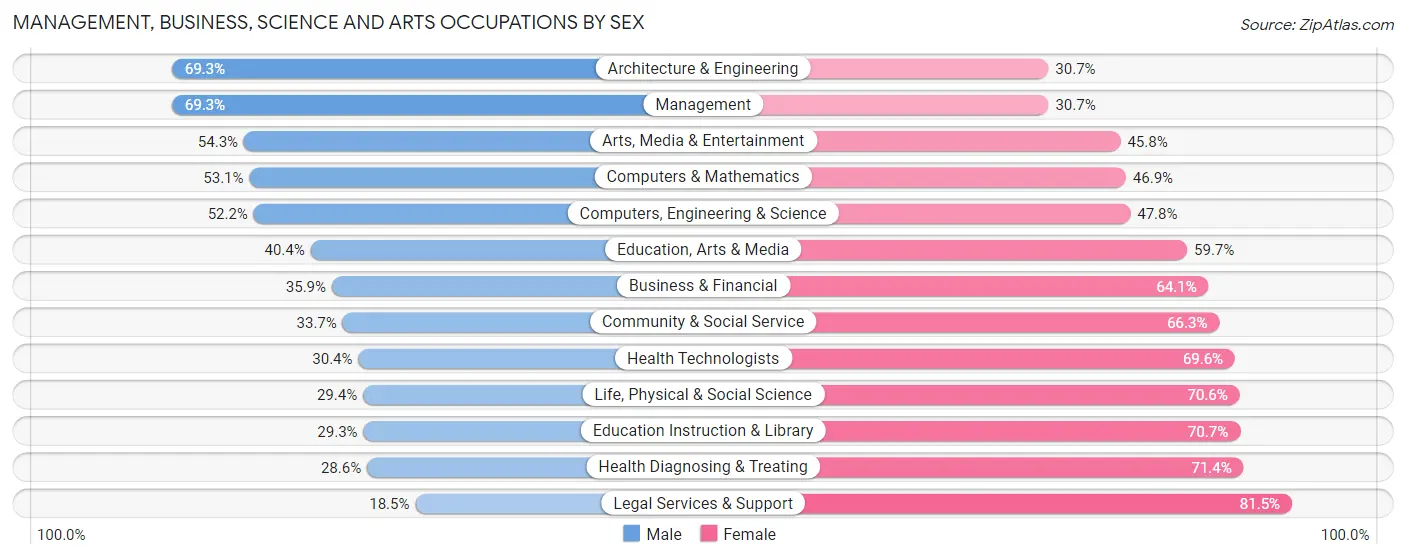
Management, Business, Science and Arts Occupations by Sex
Within the Management, Business, Science and Arts occupations in Brown County, the most male-oriented occupations are Architecture & Engineering (69.3%), Management (69.3%), and Arts, Media & Entertainment (54.2%), while the most female-oriented occupations are Legal Services & Support (81.5%), Health Diagnosing & Treating (71.4%), and Education Instruction & Library (70.7%).
| Occupation | Male | Female |
| Management | 1,621 (69.3%) | 719 (30.7%) |
| Business & Financial | 270 (35.9%) | 482 (64.1%) |
| Computers, Engineering & Science | 307 (52.2%) | 281 (47.8%) |
| Computers & Mathematics | 85 (53.1%) | 75 (46.9%) |
| Architecture & Engineering | 167 (69.3%) | 74 (30.7%) |
| Life, Physical & Social Science | 55 (29.4%) | 132 (70.6%) |
| Community & Social Service | 677 (33.7%) | 1,334 (66.3%) |
| Education, Arts & Media | 163 (40.4%) | 241 (59.7%) |
| Legal Services & Support | 32 (18.5%) | 141 (81.5%) |
| Education Instruction & Library | 348 (29.3%) | 839 (70.7%) |
| Arts, Media & Entertainment | 134 (54.2%) | 113 (45.8%) |
| Health Diagnosing & Treating | 447 (28.6%) | 1,117 (71.4%) |
| Health Technologists | 319 (30.4%) | 731 (69.6%) |
| Total (Category) | 3,322 (45.8%) | 3,933 (54.2%) |
| Total (Overall) | 10,914 (52.6%) | 9,846 (47.4%) |
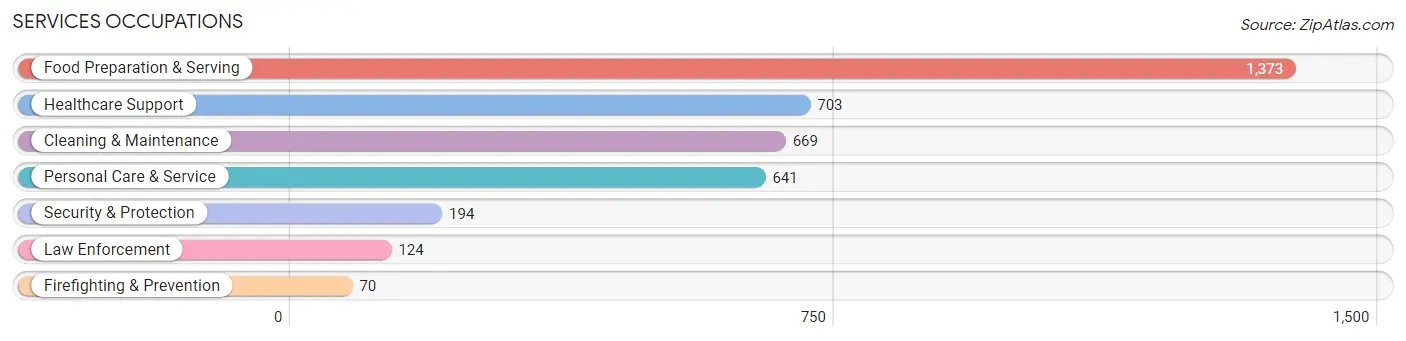
Services Occupations
The most common Services occupations in Brown County are Food Preparation & Serving (1,373 | 6.6%), Healthcare Support (703 | 3.4%), Cleaning & Maintenance (669 | 3.2%), Personal Care & Service (641 | 3.1%), and Security & Protection (194 | 0.9%).
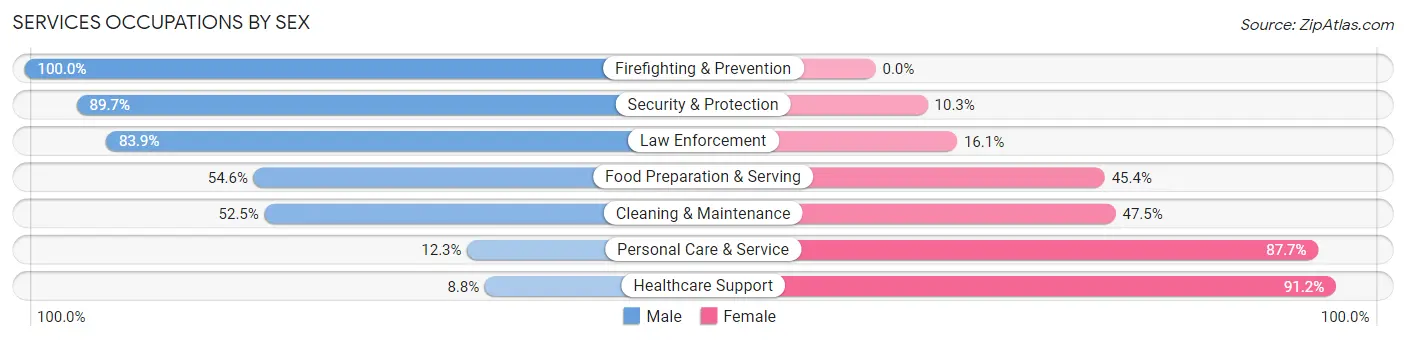
Services Occupations by Sex
Within the Services occupations in Brown County, the most male-oriented occupations are Firefighting & Prevention (100.0%), Security & Protection (89.7%), and Law Enforcement (83.9%), while the most female-oriented occupations are Healthcare Support (91.2%), Personal Care & Service (87.7%), and Cleaning & Maintenance (47.5%).
| Occupation | Male | Female |
| Healthcare Support | 62 (8.8%) | 641 (91.2%) |
| Security & Protection | 174 (89.7%) | 20 (10.3%) |
| Firefighting & Prevention | 70 (100.0%) | 0 (0.0%) |
| Law Enforcement | 104 (83.9%) | 20 (16.1%) |
| Food Preparation & Serving | 750 (54.6%) | 623 (45.4%) |
| Cleaning & Maintenance | 351 (52.5%) | 318 (47.5%) |
| Personal Care & Service | 79 (12.3%) | 562 (87.7%) |
| Total (Category) | 1,416 (39.6%) | 2,164 (60.5%) |
| Total (Overall) | 10,914 (52.6%) | 9,846 (47.4%) |
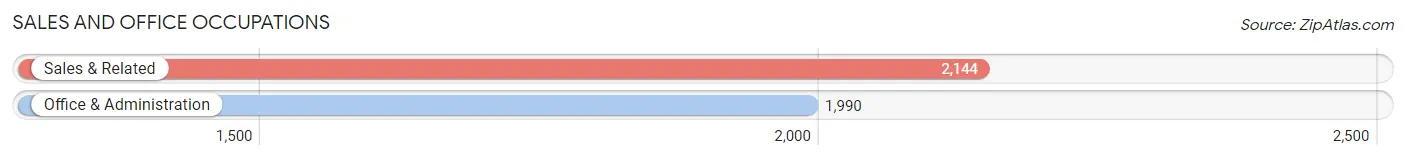
Sales and Office Occupations
The most common Sales and Office occupations in Brown County are Sales & Related (2,144 | 10.3%), and Office & Administration (1,990 | 9.6%).
Sales and Office Occupations by Sex
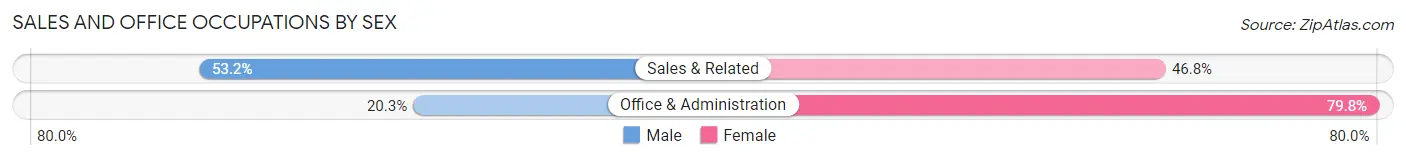
| Occupation | Male | Female |
| Sales & Related | 1,140 (53.2%) | 1,004 (46.8%) |
| Office & Administration | 403 (20.3%) | 1,587 (79.7%) |
| Total (Category) | 1,543 (37.3%) | 2,591 (62.7%) |
| Total (Overall) | 10,914 (52.6%) | 9,846 (47.4%) |
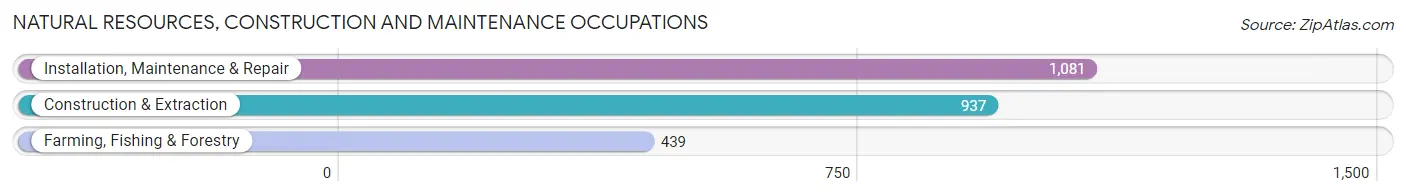
Natural Resources, Construction and Maintenance Occupations
The most common Natural Resources, Construction and Maintenance occupations in Brown County are Installation, Maintenance & Repair (1,081 | 5.2%), Construction & Extraction (937 | 4.5%), and Farming, Fishing & Forestry (439 | 2.1%).
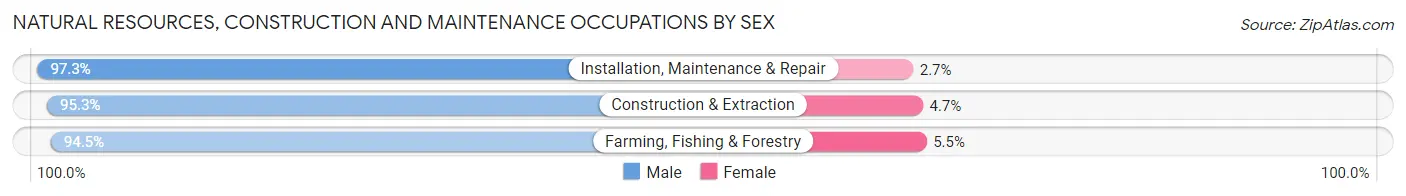
Natural Resources, Construction and Maintenance Occupations by Sex
| Occupation | Male | Female |
| Farming, Fishing & Forestry | 415 (94.5%) | 24 (5.5%) |
| Construction & Extraction | 893 (95.3%) | 44 (4.7%) |
| Installation, Maintenance & Repair | 1,052 (97.3%) | 29 (2.7%) |
| Total (Category) | 2,360 (96.1%) | 97 (4.0%) |
| Total (Overall) | 10,914 (52.6%) | 9,846 (47.4%) |
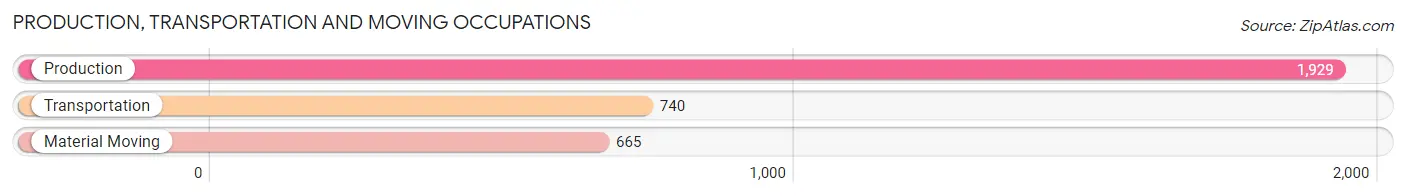
Production, Transportation and Moving Occupations
The most common Production, Transportation and Moving occupations in Brown County are Production (1,929 | 9.3%), Transportation (740 | 3.6%), and Material Moving (665 | 3.2%).
Production, Transportation and Moving Occupations by Sex
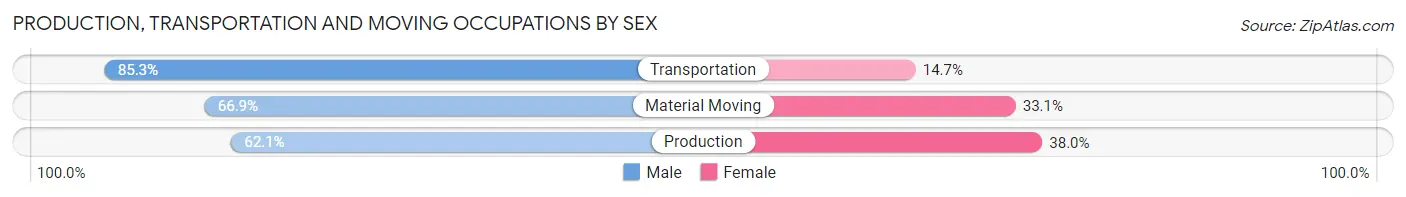
| Occupation | Male | Female |
| Production | 1,197 (62.1%) | 732 (38.0%) |
| Transportation | 631 (85.3%) | 109 (14.7%) |
| Material Moving | 445 (66.9%) | 220 (33.1%) |
| Total (Category) | 2,273 (68.2%) | 1,061 (31.8%) |
| Total (Overall) | 10,914 (52.6%) | 9,846 (47.4%) |
Employment Industries by Sex in Brown County
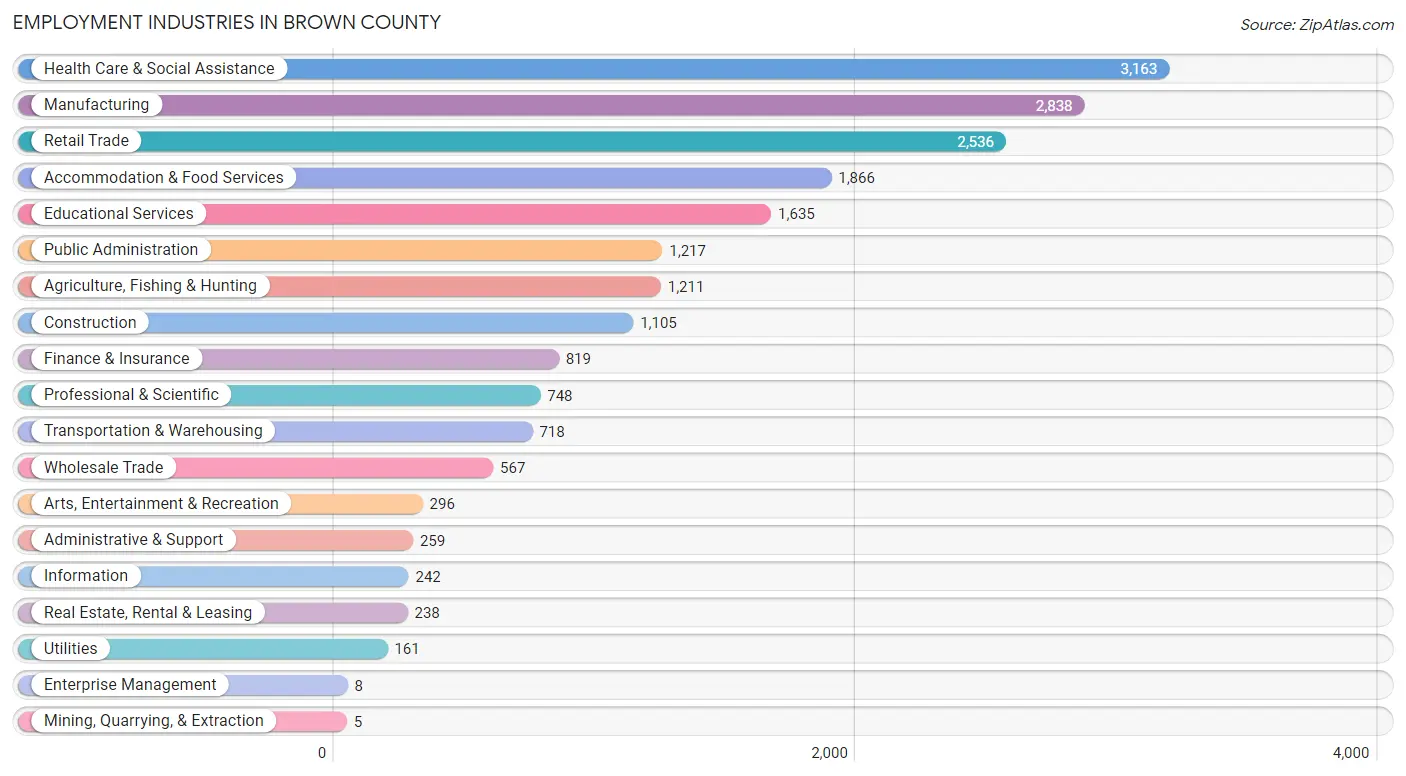
Employment Industries in Brown County
The major employment industries in Brown County include Health Care & Social Assistance (3,163 | 15.2%), Manufacturing (2,838 | 13.7%), Retail Trade (2,536 | 12.2%), Accommodation & Food Services (1,866 | 9.0%), and Educational Services (1,635 | 7.9%).
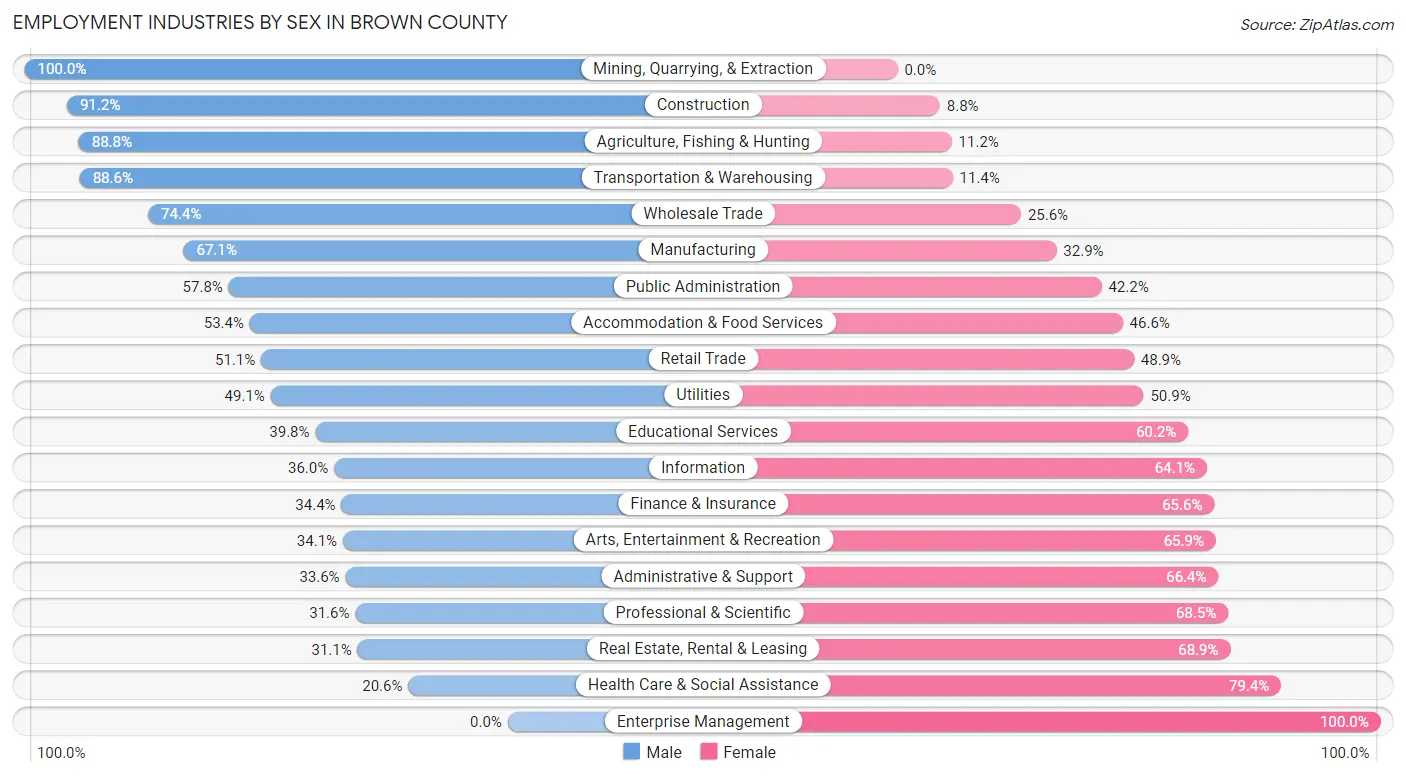
Employment Industries by Sex in Brown County
The Brown County industries that see more men than women are Mining, Quarrying, & Extraction (100.0%), Construction (91.2%), and Agriculture, Fishing & Hunting (88.8%), whereas the industries that tend to have a higher number of women are Enterprise Management (100.0%), Health Care & Social Assistance (79.4%), and Real Estate, Rental & Leasing (68.9%).
| Industry | Male | Female |
| Agriculture, Fishing & Hunting | 1,075 (88.8%) | 136 (11.2%) |
| Mining, Quarrying, & Extraction | 5 (100.0%) | 0 (0.0%) |
| Construction | 1,008 (91.2%) | 97 (8.8%) |
| Manufacturing | 1,904 (67.1%) | 934 (32.9%) |
| Wholesale Trade | 422 (74.4%) | 145 (25.6%) |
| Retail Trade | 1,295 (51.1%) | 1,241 (48.9%) |
| Transportation & Warehousing | 636 (88.6%) | 82 (11.4%) |
| Utilities | 79 (49.1%) | 82 (50.9%) |
| Information | 87 (35.9%) | 155 (64.0%) |
| Finance & Insurance | 282 (34.4%) | 537 (65.6%) |
| Real Estate, Rental & Leasing | 74 (31.1%) | 164 (68.9%) |
| Professional & Scientific | 236 (31.6%) | 512 (68.4%) |
| Enterprise Management | 0 (0.0%) | 8 (100.0%) |
| Administrative & Support | 87 (33.6%) | 172 (66.4%) |
| Educational Services | 651 (39.8%) | 984 (60.2%) |
| Health Care & Social Assistance | 651 (20.6%) | 2,512 (79.4%) |
| Arts, Entertainment & Recreation | 101 (34.1%) | 195 (65.9%) |
| Accommodation & Food Services | 996 (53.4%) | 870 (46.6%) |
| Public Administration | 703 (57.8%) | 514 (42.2%) |
| Total | 10,914 (52.6%) | 9,846 (47.4%) |
Education in Brown County
School Enrollment in Brown County
The most common levels of schooling among the 8,996 students in Brown County are elementary school (2,142 | 23.8%), high school (1,972 | 21.9%), and middle school (1,913 | 21.3%).
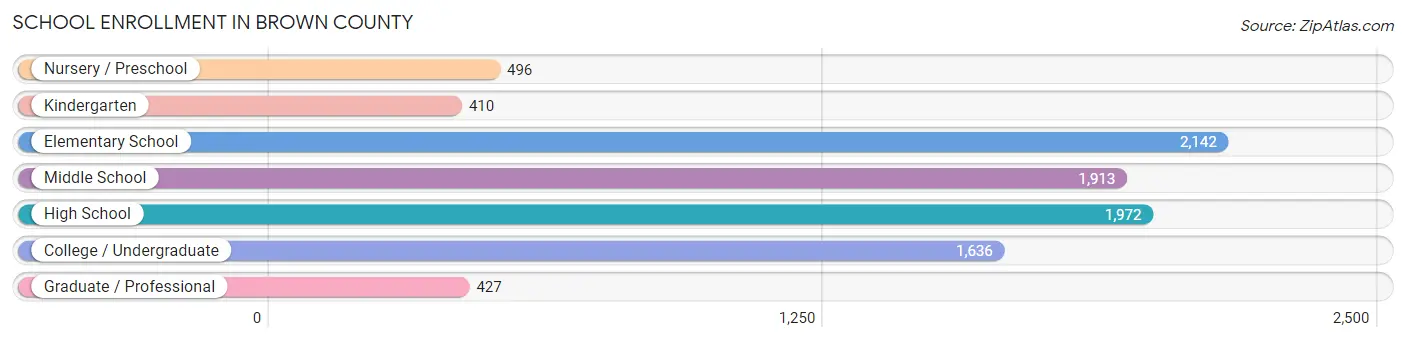
| School Level | # Students | % Students |
| Nursery / Preschool | 496 | 5.5% |
| Kindergarten | 410 | 4.6% |
| Elementary School | 2,142 | 23.8% |
| Middle School | 1,913 | 21.3% |
| High School | 1,972 | 21.9% |
| College / Undergraduate | 1,636 | 18.2% |
| Graduate / Professional | 427 | 4.8% |
| Total | 8,996 | 100.0% |
School Enrollment by Age by Funding Source in Brown County
Out of a total of 8,996 students who are enrolled in schools in Brown County, 1,376 (15.3%) attend a private institution, while the remaining 7,620 (84.7%) are enrolled in public schools. The age group of 35 years and over has the highest likelihood of being enrolled in private schools, with 92 (27.4% in the age bracket) enrolled. Conversely, the age group of 10 to 14 year olds has the lowest likelihood of being enrolled in a private school, with 2,330 (88.0% in the age bracket) attending a public institution.
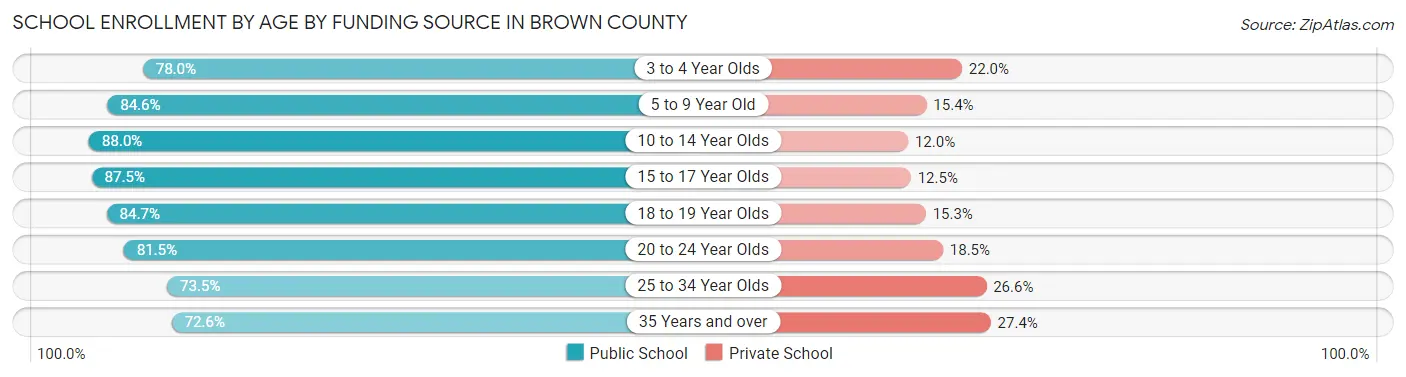
| Age Bracket | Public School | Private School |
| 3 to 4 Year Olds | 255 (78.0%) | 72 (22.0%) |
| 5 to 9 Year Old | 2,003 (84.6%) | 365 (15.4%) |
| 10 to 14 Year Olds | 2,330 (88.0%) | 317 (12.0%) |
| 15 to 17 Year Olds | 1,226 (87.5%) | 175 (12.5%) |
| 18 to 19 Year Olds | 521 (84.7%) | 94 (15.3%) |
| 20 to 24 Year Olds | 825 (81.5%) | 187 (18.5%) |
| 25 to 34 Year Olds | 213 (73.5%) | 77 (26.6%) |
| 35 Years and over | 244 (72.6%) | 92 (27.4%) |
| Total | 7,620 (84.7%) | 1,376 (15.3%) |
Educational Attainment by Field of Study in Brown County
Education (2,113 | 23.0%), business (2,008 | 21.9%), science & technology (971 | 10.6%), bio, nature & agricultural (800 | 8.7%), and arts & humanities (605 | 6.6%) are the most common fields of study among 9,173 individuals in Brown County who have obtained a bachelor's degree or higher.
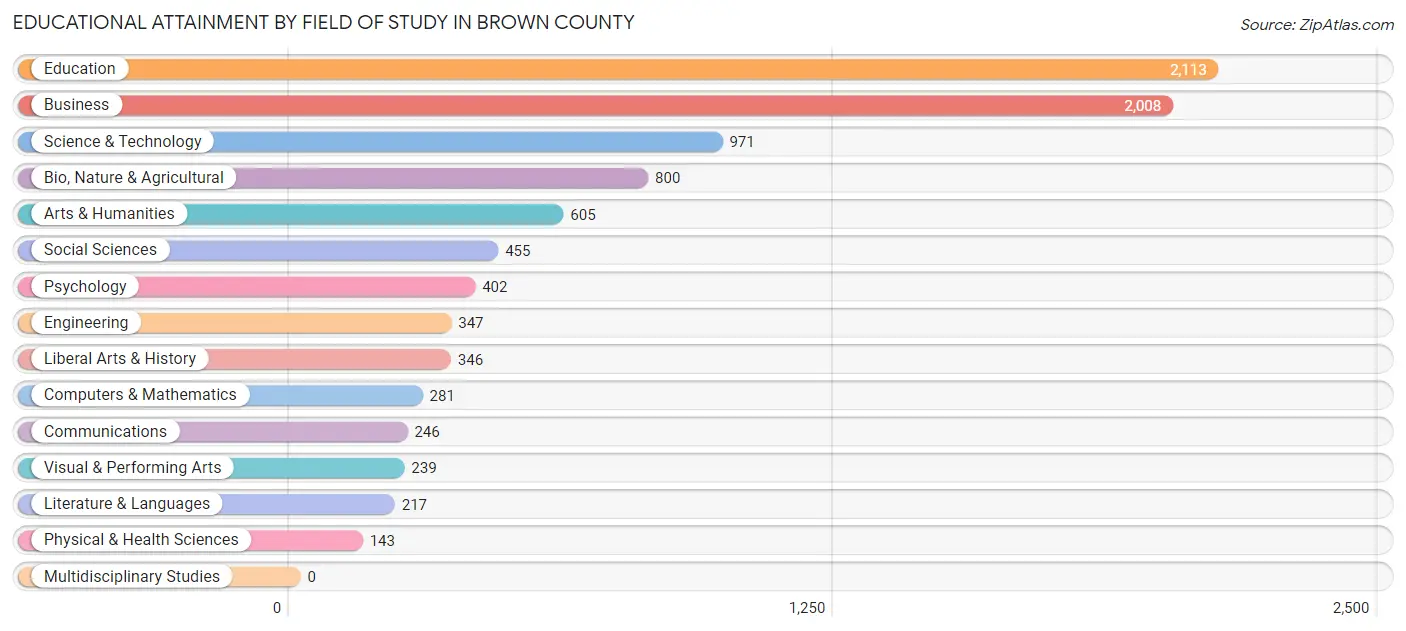
| Field of Study | # Graduates | % Graduates |
| Computers & Mathematics | 281 | 3.1% |
| Bio, Nature & Agricultural | 800 | 8.7% |
| Physical & Health Sciences | 143 | 1.6% |
| Psychology | 402 | 4.4% |
| Social Sciences | 455 | 5.0% |
| Engineering | 347 | 3.8% |
| Multidisciplinary Studies | 0 | 0.0% |
| Science & Technology | 971 | 10.6% |
| Business | 2,008 | 21.9% |
| Education | 2,113 | 23.0% |
| Literature & Languages | 217 | 2.4% |
| Liberal Arts & History | 346 | 3.8% |
| Visual & Performing Arts | 239 | 2.6% |
| Communications | 246 | 2.7% |
| Arts & Humanities | 605 | 6.6% |
| Total | 9,173 | 100.0% |
Transportation & Commute in Brown County
Vehicle Availability by Sex in Brown County
The most prevalent vehicle ownership categories in Brown County are males with 2 vehicles (4,652, accounting for 43.4%) and females with 2 vehicles (3,634, making up 48.3%).
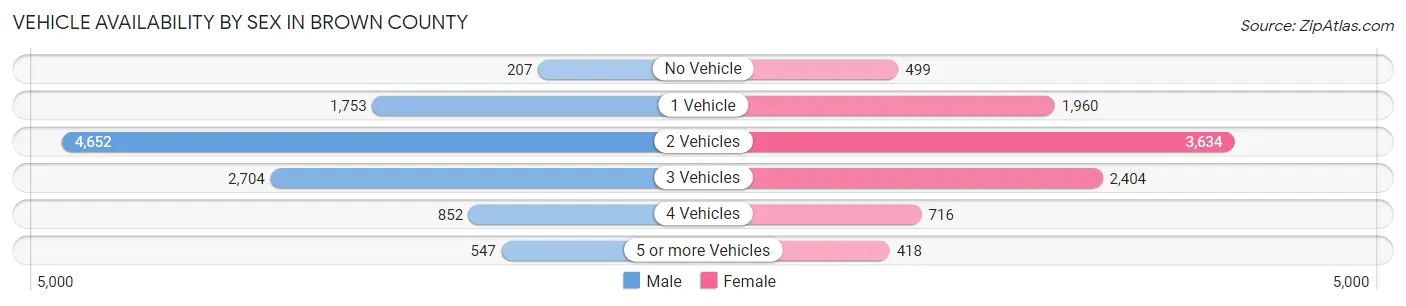
| Vehicles Available | Male | Female |
| No Vehicle | 207 (1.9%) | 499 (5.2%) |
| 1 Vehicle | 1,753 (16.4%) | 1,960 (20.3%) |
| 2 Vehicles | 4,652 (43.4%) | 3,634 (37.7%) |
| 3 Vehicles | 2,704 (25.2%) | 2,404 (25.0%) |
| 4 Vehicles | 852 (8.0%) | 716 (7.4%) |
| 5 or more Vehicles | 547 (5.1%) | 418 (4.3%) |
| Total | 10,715 (100.0%) | 9,631 (100.0%) |
Commute Time in Brown County
The most frequently occuring commute durations in Brown County are 10 to 14 minutes (6,093 commuters, 31.4%), 5 to 9 minutes (5,031 commuters, 25.9%), and 15 to 19 minutes (3,091 commuters, 15.9%).
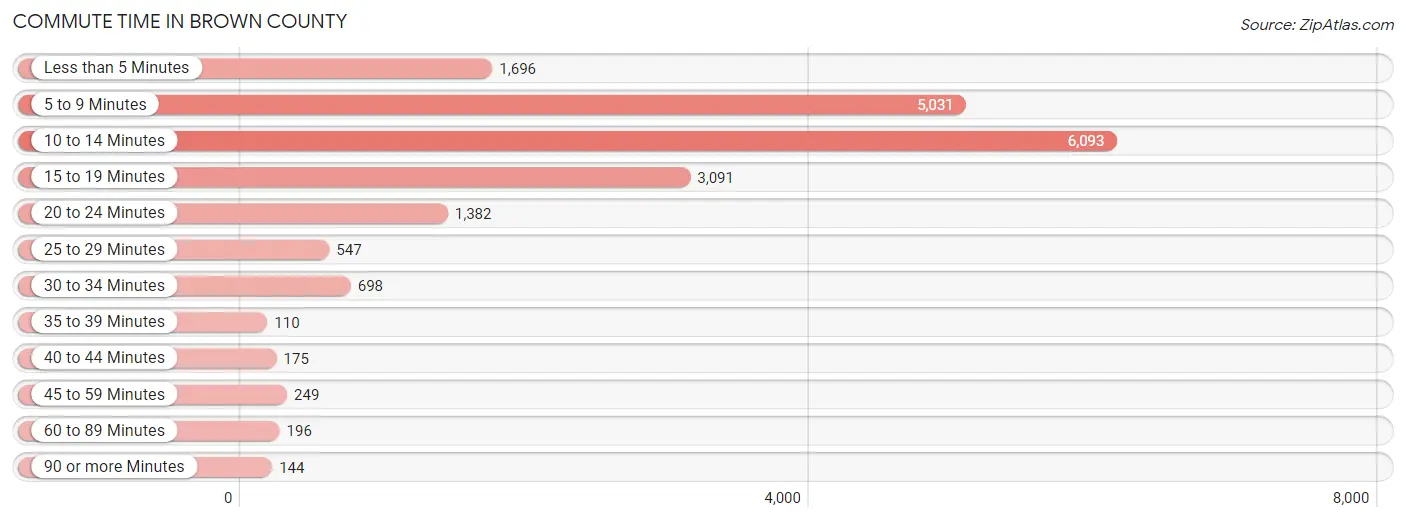
| Commute Time | # Commuters | % Commuters |
| Less than 5 Minutes | 1,696 | 8.7% |
| 5 to 9 Minutes | 5,031 | 25.9% |
| 10 to 14 Minutes | 6,093 | 31.4% |
| 15 to 19 Minutes | 3,091 | 15.9% |
| 20 to 24 Minutes | 1,382 | 7.1% |
| 25 to 29 Minutes | 547 | 2.8% |
| 30 to 34 Minutes | 698 | 3.6% |
| 35 to 39 Minutes | 110 | 0.6% |
| 40 to 44 Minutes | 175 | 0.9% |
| 45 to 59 Minutes | 249 | 1.3% |
| 60 to 89 Minutes | 196 | 1.0% |
| 90 or more Minutes | 144 | 0.7% |
Commute Time by Sex in Brown County
The most common commute times in Brown County are 10 to 14 minutes (3,333 commuters, 32.2%) for males and 10 to 14 minutes (2,760 commuters, 30.4%) for females.
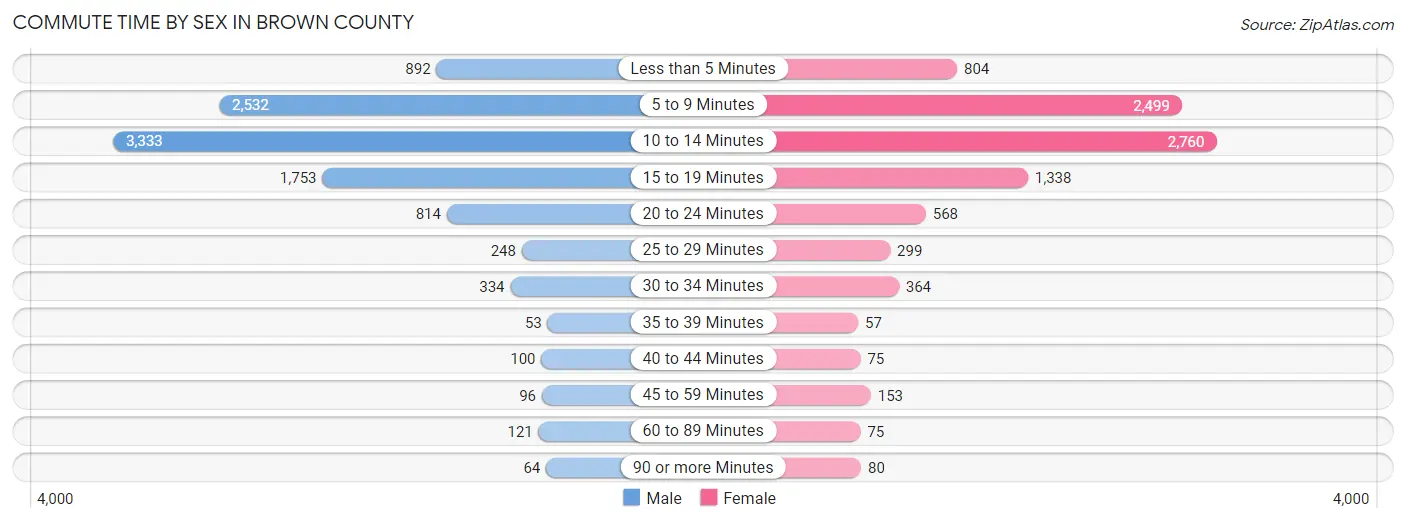
| Commute Time | Male | Female |
| Less than 5 Minutes | 892 (8.6%) | 804 (8.9%) |
| 5 to 9 Minutes | 2,532 (24.5%) | 2,499 (27.6%) |
| 10 to 14 Minutes | 3,333 (32.2%) | 2,760 (30.4%) |
| 15 to 19 Minutes | 1,753 (17.0%) | 1,338 (14.7%) |
| 20 to 24 Minutes | 814 (7.9%) | 568 (6.3%) |
| 25 to 29 Minutes | 248 (2.4%) | 299 (3.3%) |
| 30 to 34 Minutes | 334 (3.2%) | 364 (4.0%) |
| 35 to 39 Minutes | 53 (0.5%) | 57 (0.6%) |
| 40 to 44 Minutes | 100 (1.0%) | 75 (0.8%) |
| 45 to 59 Minutes | 96 (0.9%) | 153 (1.7%) |
| 60 to 89 Minutes | 121 (1.2%) | 75 (0.8%) |
| 90 or more Minutes | 64 (0.6%) | 80 (0.9%) |
Time of Departure to Work by Sex in Brown County
The most frequent times of departure to work in Brown County are 7:30 AM to 7:59 AM (2,474, 23.9%) for males and 7:30 AM to 7:59 AM (2,323, 25.6%) for females.
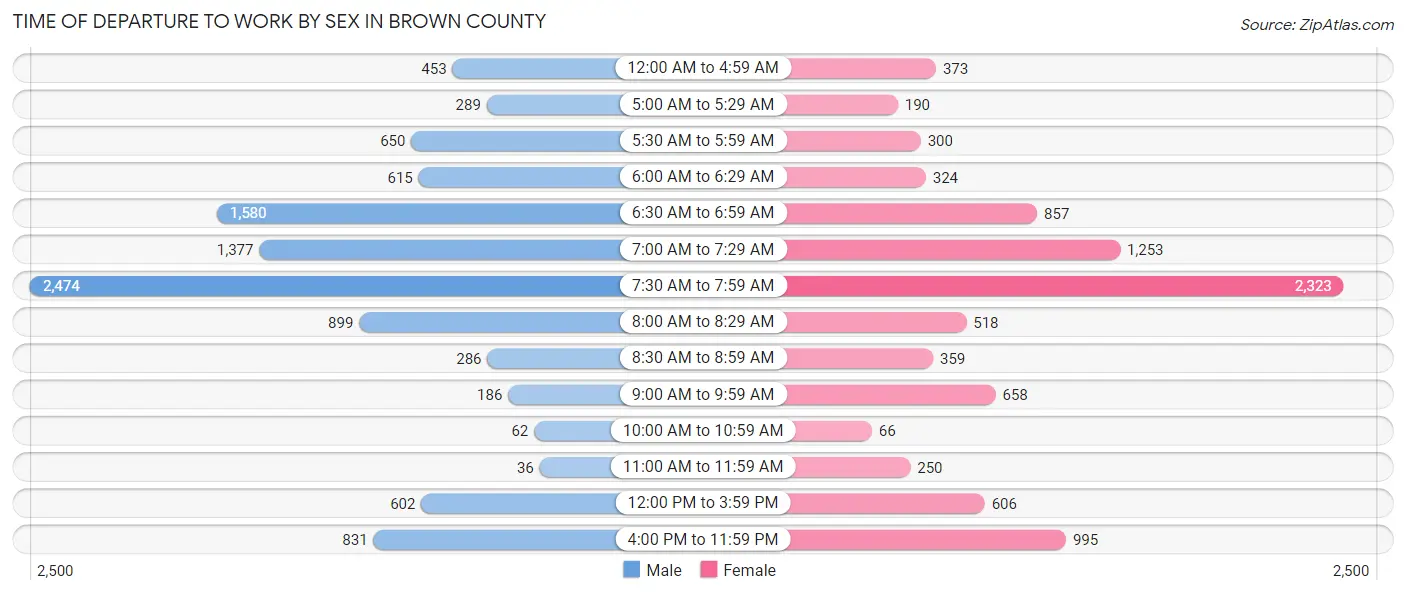
| Time of Departure | Male | Female |
| 12:00 AM to 4:59 AM | 453 (4.4%) | 373 (4.1%) |
| 5:00 AM to 5:29 AM | 289 (2.8%) | 190 (2.1%) |
| 5:30 AM to 5:59 AM | 650 (6.3%) | 300 (3.3%) |
| 6:00 AM to 6:29 AM | 615 (5.9%) | 324 (3.6%) |
| 6:30 AM to 6:59 AM | 1,580 (15.3%) | 857 (9.5%) |
| 7:00 AM to 7:29 AM | 1,377 (13.3%) | 1,253 (13.8%) |
| 7:30 AM to 7:59 AM | 2,474 (23.9%) | 2,323 (25.6%) |
| 8:00 AM to 8:29 AM | 899 (8.7%) | 518 (5.7%) |
| 8:30 AM to 8:59 AM | 286 (2.8%) | 359 (4.0%) |
| 9:00 AM to 9:59 AM | 186 (1.8%) | 658 (7.2%) |
| 10:00 AM to 10:59 AM | 62 (0.6%) | 66 (0.7%) |
| 11:00 AM to 11:59 AM | 36 (0.4%) | 250 (2.8%) |
| 12:00 PM to 3:59 PM | 602 (5.8%) | 606 (6.7%) |
| 4:00 PM to 11:59 PM | 831 (8.0%) | 995 (11.0%) |
| Total | 10,340 (100.0%) | 9,072 (100.0%) |
Housing Occupancy in Brown County
Occupancy by Ownership in Brown County
Of the total 16,035 dwellings in Brown County, owner-occupied units account for 10,568 (65.9%), while renter-occupied units make up 5,467 (34.1%).
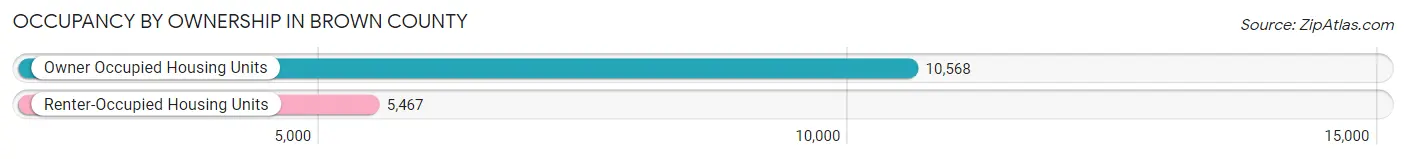
| Occupancy | # Housing Units | % Housing Units |
| Owner Occupied Housing Units | 10,568 | 65.9% |
| Renter-Occupied Housing Units | 5,467 | 34.1% |
| Total Occupied Housing Units | 16,035 | 100.0% |
Occupancy by Household Size in Brown County
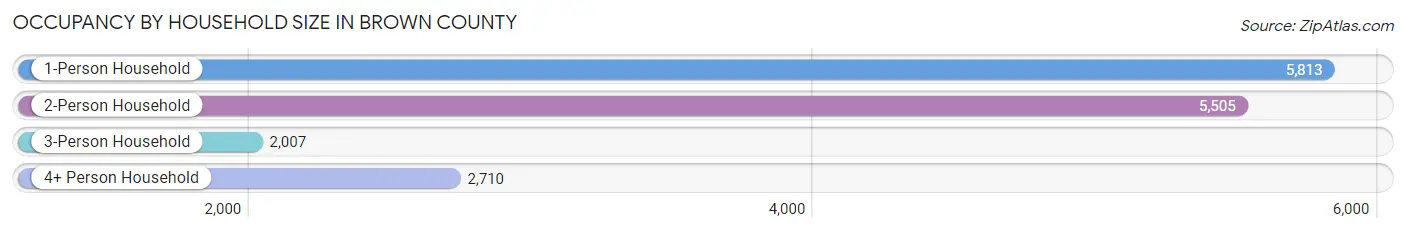
| Household Size | # Housing Units | % Housing Units |
| 1-Person Household | 5,813 | 36.2% |
| 2-Person Household | 5,505 | 34.3% |
| 3-Person Household | 2,007 | 12.5% |
| 4+ Person Household | 2,710 | 16.9% |
| Total Housing Units | 16,035 | 100.0% |
Occupancy by Ownership by Household Size in Brown County
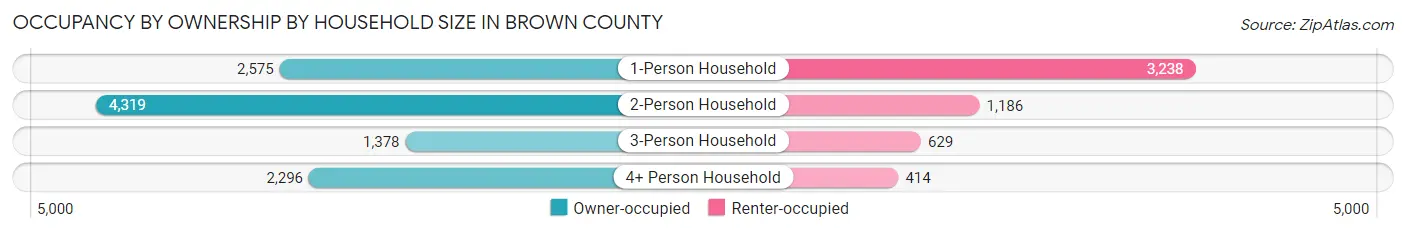
| Household Size | Owner-occupied | Renter-occupied |
| 1-Person Household | 2,575 (44.3%) | 3,238 (55.7%) |
| 2-Person Household | 4,319 (78.5%) | 1,186 (21.5%) |
| 3-Person Household | 1,378 (68.7%) | 629 (31.3%) |
| 4+ Person Household | 2,296 (84.7%) | 414 (15.3%) |
| Total Housing Units | 10,568 (65.9%) | 5,467 (34.1%) |
Occupancy by Educational Attainment in Brown County
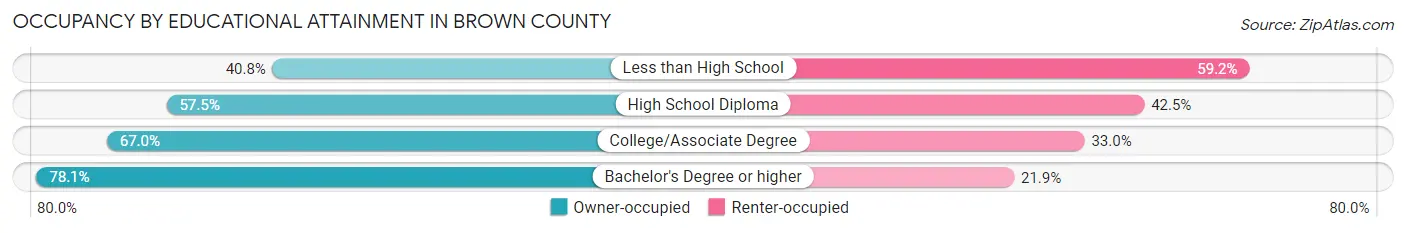
| Household Size | Owner-occupied | Renter-occupied |
| Less than High School | 362 (40.8%) | 525 (59.2%) |
| High School Diploma | 2,988 (57.5%) | 2,209 (42.5%) |
| College/Associate Degree | 3,338 (67.0%) | 1,647 (33.0%) |
| Bachelor's Degree or higher | 3,880 (78.1%) | 1,086 (21.9%) |
Occupancy by Age of Householder in Brown County
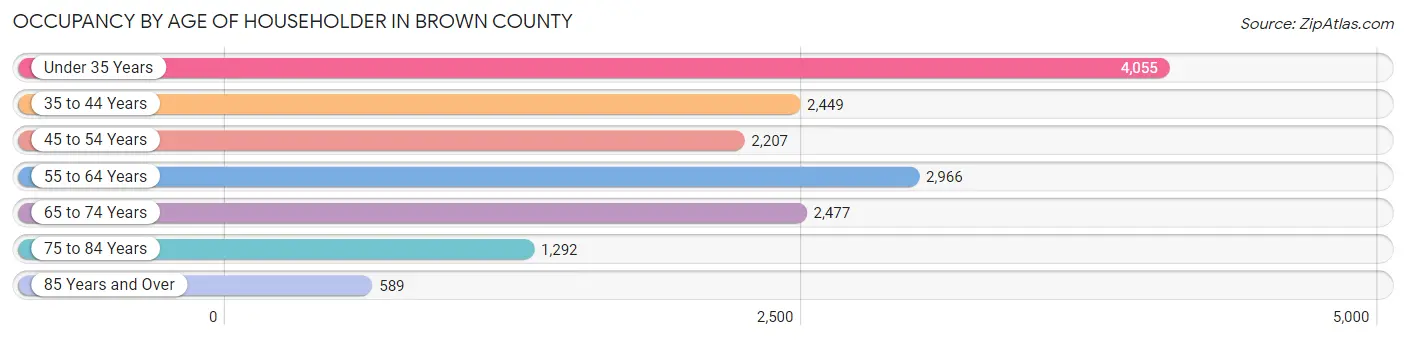
| Age Bracket | # Households | % Households |
| Under 35 Years | 4,055 | 25.3% |
| 35 to 44 Years | 2,449 | 15.3% |
| 45 to 54 Years | 2,207 | 13.8% |
| 55 to 64 Years | 2,966 | 18.5% |
| 65 to 74 Years | 2,477 | 15.4% |
| 75 to 84 Years | 1,292 | 8.1% |
| 85 Years and Over | 589 | 3.7% |
| Total | 16,035 | 100.0% |
Housing Finances in Brown County
Median Income by Occupancy in Brown County
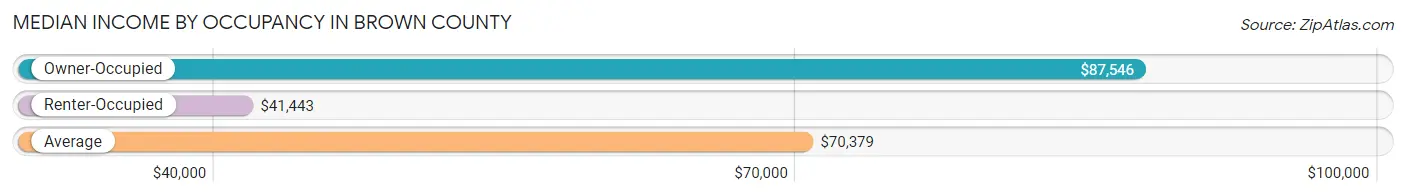
| Occupancy Type | # Households | Median Income |
| Owner-Occupied | 10,568 (65.9%) | $87,546 |
| Renter-Occupied | 5,467 (34.1%) | $41,443 |
| Average | 16,035 (100.0%) | $70,379 |
Occupancy by Householder Income Bracket in Brown County
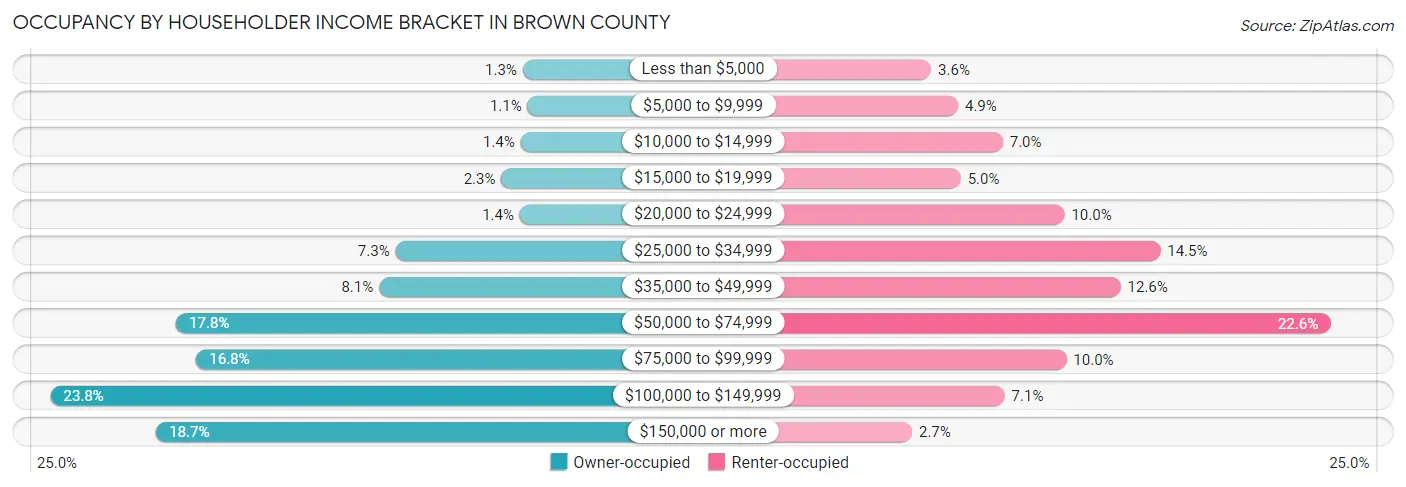
| Income Bracket | Owner-occupied | Renter-occupied |
| Less than $5,000 | 135 (1.3%) | 197 (3.6%) |
| $5,000 to $9,999 | 111 (1.1%) | 267 (4.9%) |
| $10,000 to $14,999 | 146 (1.4%) | 383 (7.0%) |
| $15,000 to $19,999 | 243 (2.3%) | 274 (5.0%) |
| $20,000 to $24,999 | 150 (1.4%) | 544 (10.0%) |
| $25,000 to $34,999 | 776 (7.3%) | 793 (14.5%) |
| $35,000 to $49,999 | 858 (8.1%) | 690 (12.6%) |
| $50,000 to $74,999 | 1,880 (17.8%) | 1,235 (22.6%) |
| $75,000 to $99,999 | 1,778 (16.8%) | 549 (10.0%) |
| $100,000 to $149,999 | 2,512 (23.8%) | 388 (7.1%) |
| $150,000 or more | 1,979 (18.7%) | 147 (2.7%) |
| Total | 10,568 (100.0%) | 5,467 (100.0%) |
Monthly Housing Cost Tiers in Brown County
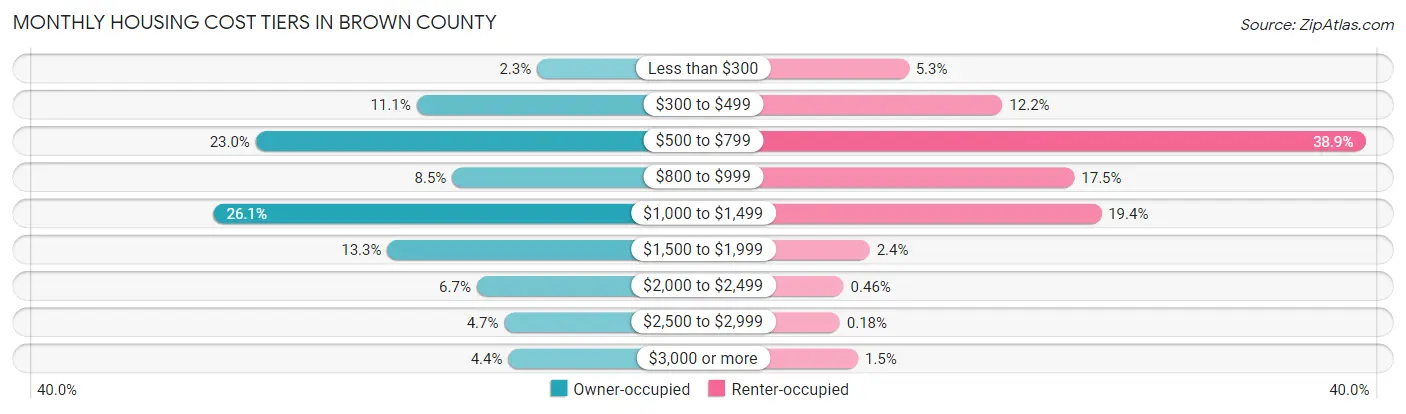
| Monthly Cost | Owner-occupied | Renter-occupied |
| Less than $300 | 239 (2.3%) | 287 (5.2%) |
| $300 to $499 | 1,177 (11.1%) | 664 (12.1%) |
| $500 to $799 | 2,428 (23.0%) | 2,125 (38.9%) |
| $800 to $999 | 899 (8.5%) | 954 (17.4%) |
| $1,000 to $1,499 | 2,756 (26.1%) | 1,062 (19.4%) |
| $1,500 to $1,999 | 1,405 (13.3%) | 130 (2.4%) |
| $2,000 to $2,499 | 708 (6.7%) | 25 (0.5%) |
| $2,500 to $2,999 | 493 (4.7%) | 10 (0.2%) |
| $3,000 or more | 463 (4.4%) | 83 (1.5%) |
| Total | 10,568 (100.0%) | 5,467 (100.0%) |
Physical Housing Characteristics in Brown County
Housing Structures in Brown County
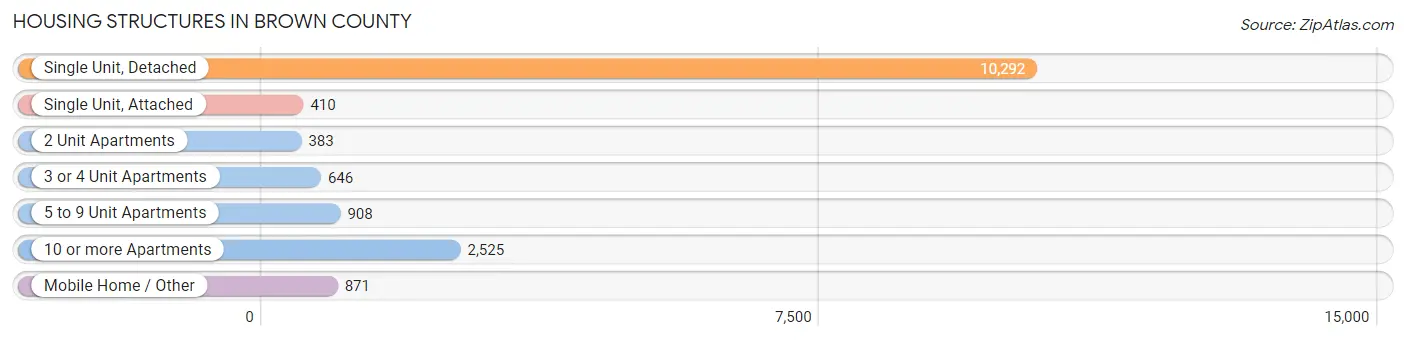
| Structure Type | # Housing Units | % Housing Units |
| Single Unit, Detached | 10,292 | 64.2% |
| Single Unit, Attached | 410 | 2.6% |
| 2 Unit Apartments | 383 | 2.4% |
| 3 or 4 Unit Apartments | 646 | 4.0% |
| 5 to 9 Unit Apartments | 908 | 5.7% |
| 10 or more Apartments | 2,525 | 15.8% |
| Mobile Home / Other | 871 | 5.4% |
| Total | 16,035 | 100.0% |
Housing Structures by Occupancy in Brown County
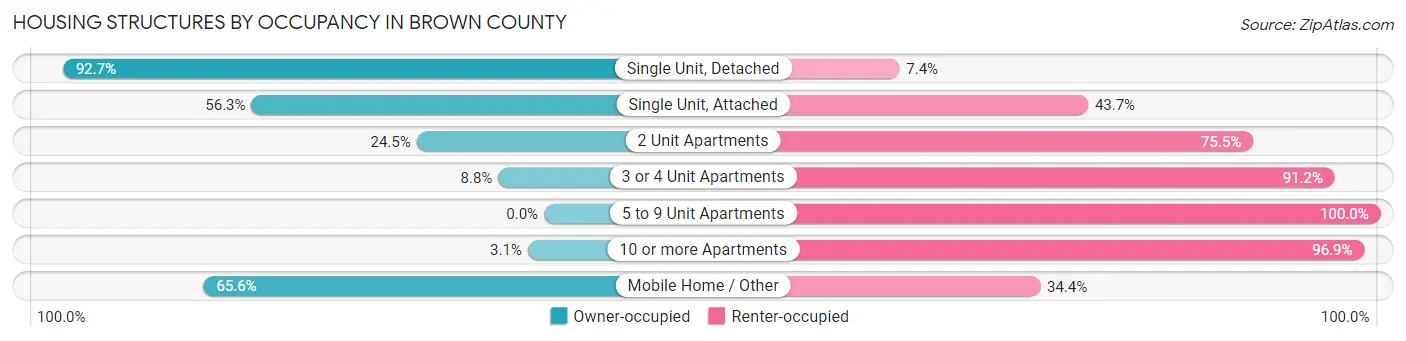
| Structure Type | Owner-occupied | Renter-occupied |
| Single Unit, Detached | 9,536 (92.6%) | 756 (7.3%) |
| Single Unit, Attached | 231 (56.3%) | 179 (43.7%) |
| 2 Unit Apartments | 94 (24.5%) | 289 (75.5%) |
| 3 or 4 Unit Apartments | 57 (8.8%) | 589 (91.2%) |
| 5 to 9 Unit Apartments | 0 (0.0%) | 908 (100.0%) |
| 10 or more Apartments | 79 (3.1%) | 2,446 (96.9%) |
| Mobile Home / Other | 571 (65.6%) | 300 (34.4%) |
| Total | 10,568 (65.9%) | 5,467 (34.1%) |
Housing Structures by Number of Rooms in Brown County
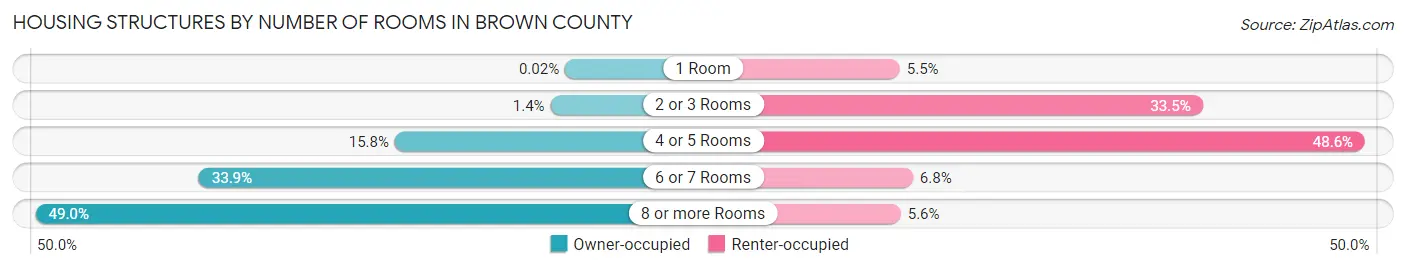
| Number of Rooms | Owner-occupied | Renter-occupied |
| 1 Room | 2 (0.0%) | 303 (5.5%) |
| 2 or 3 Rooms | 145 (1.4%) | 1,833 (33.5%) |
| 4 or 5 Rooms | 1,665 (15.8%) | 2,654 (48.5%) |
| 6 or 7 Rooms | 3,580 (33.9%) | 369 (6.8%) |
| 8 or more Rooms | 5,176 (49.0%) | 308 (5.6%) |
| Total | 10,568 (100.0%) | 5,467 (100.0%) |
Housing Structure by Heating Type in Brown County
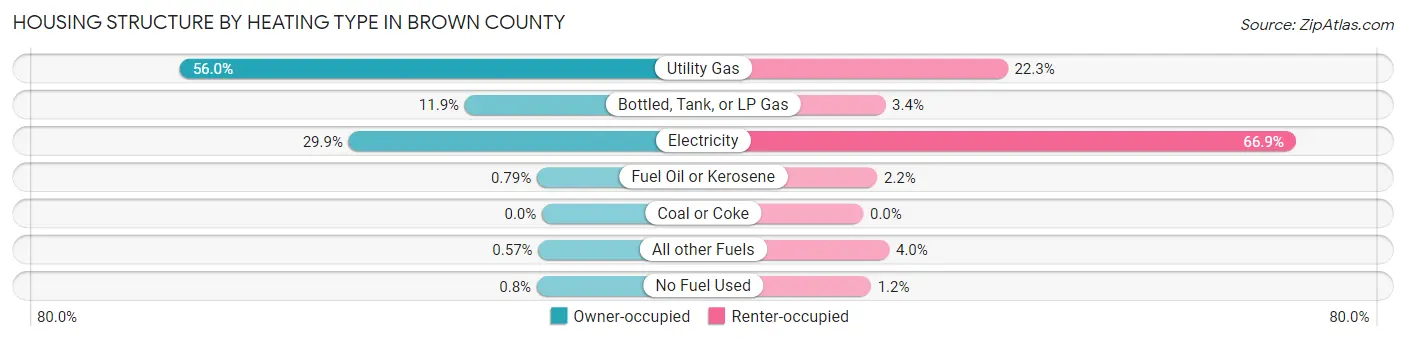
| Heating Type | Owner-occupied | Renter-occupied |
| Utility Gas | 5,919 (56.0%) | 1,221 (22.3%) |
| Bottled, Tank, or LP Gas | 1,261 (11.9%) | 187 (3.4%) |
| Electricity | 3,159 (29.9%) | 3,656 (66.9%) |
| Fuel Oil or Kerosene | 84 (0.8%) | 118 (2.2%) |
| Coal or Coke | 0 (0.0%) | 0 (0.0%) |
| All other Fuels | 60 (0.6%) | 220 (4.0%) |
| No Fuel Used | 85 (0.8%) | 65 (1.2%) |
| Total | 10,568 (100.0%) | 5,467 (100.0%) |
Household Vehicle Usage in Brown County
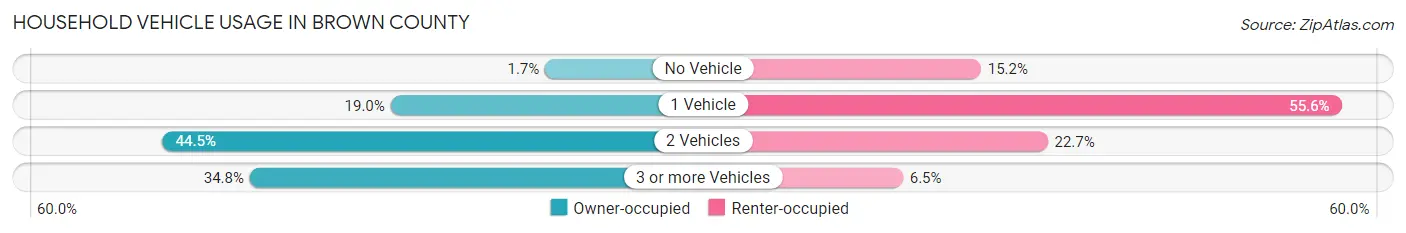
| Vehicles per Household | Owner-occupied | Renter-occupied |
| No Vehicle | 179 (1.7%) | 832 (15.2%) |
| 1 Vehicle | 2,008 (19.0%) | 3,040 (55.6%) |
| 2 Vehicles | 4,706 (44.5%) | 1,241 (22.7%) |
| 3 or more Vehicles | 3,675 (34.8%) | 354 (6.5%) |
| Total | 10,568 (100.0%) | 5,467 (100.0%) |
Real Estate & Mortgages in Brown County
Real Estate and Mortgage Overview in Brown County
| Characteristic | Without Mortgage | With Mortgage |
| Housing Units | 4,429 | 6,139 |
| Median Property Value | $193,200 | $207,300 |
| Median Household Income | $69,849 | $1,331 |
| Monthly Housing Costs | $593 | $463 |
| Real Estate Taxes | $2,299 | $93 |
Property Value by Mortgage Status in Brown County
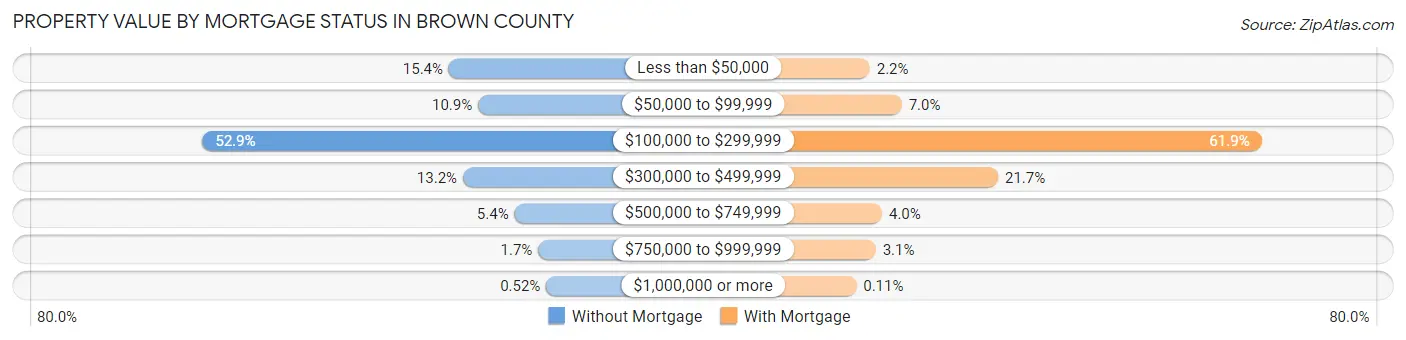
| Property Value | Without Mortgage | With Mortgage |
| Less than $50,000 | 680 (15.3%) | 133 (2.2%) |
| $50,000 to $99,999 | 483 (10.9%) | 432 (7.0%) |
| $100,000 to $299,999 | 2,344 (52.9%) | 3,797 (61.9%) |
| $300,000 to $499,999 | 585 (13.2%) | 1,333 (21.7%) |
| $500,000 to $749,999 | 237 (5.3%) | 248 (4.0%) |
| $750,000 to $999,999 | 77 (1.7%) | 189 (3.1%) |
| $1,000,000 or more | 23 (0.5%) | 7 (0.1%) |
| Total | 4,429 (100.0%) | 6,139 (100.0%) |
Household Income by Mortgage Status in Brown County
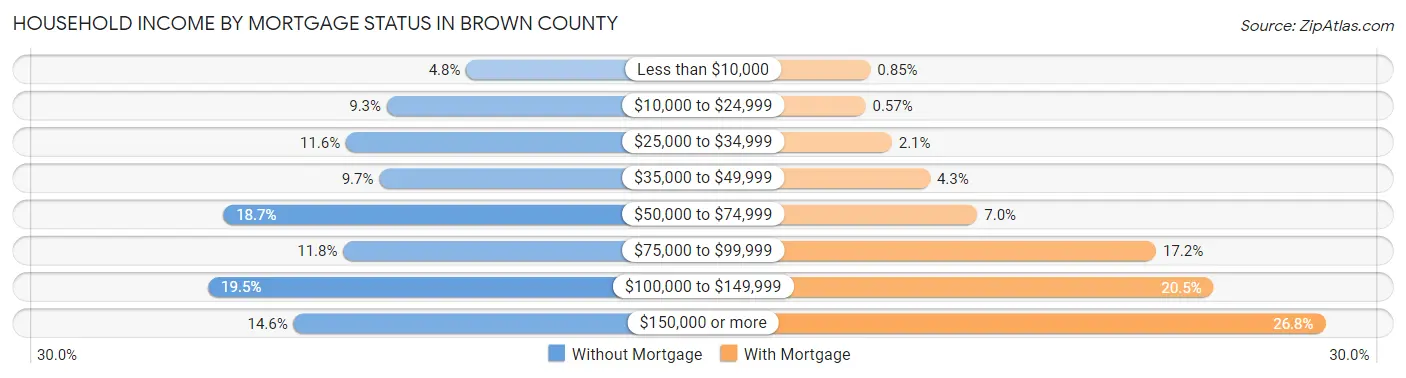
| Household Income | Without Mortgage | With Mortgage |
| Less than $10,000 | 211 (4.8%) | 52 (0.9%) |
| $10,000 to $24,999 | 412 (9.3%) | 35 (0.6%) |
| $25,000 to $34,999 | 515 (11.6%) | 127 (2.1%) |
| $35,000 to $49,999 | 431 (9.7%) | 261 (4.3%) |
| $50,000 to $74,999 | 826 (18.6%) | 427 (7.0%) |
| $75,000 to $99,999 | 522 (11.8%) | 1,054 (17.2%) |
| $100,000 to $149,999 | 864 (19.5%) | 1,256 (20.5%) |
| $150,000 or more | 648 (14.6%) | 1,648 (26.8%) |
| Total | 4,429 (100.0%) | 6,139 (100.0%) |
Property Value to Household Income Ratio in Brown County
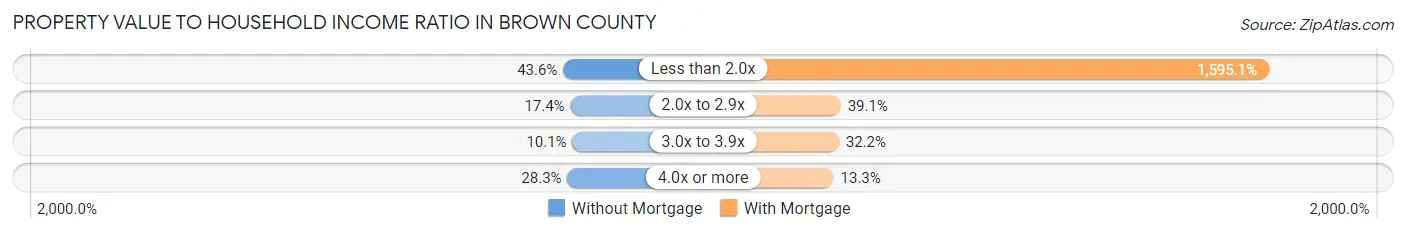
| Value-to-Income Ratio | Without Mortgage | With Mortgage |
| Less than 2.0x | 1,933 (43.6%) | 97,924 (1,595.1%) |
| 2.0x to 2.9x | 772 (17.4%) | 2,402 (39.1%) |
| 3.0x to 3.9x | 447 (10.1%) | 1,974 (32.2%) |
| 4.0x or more | 1,254 (28.3%) | 819 (13.3%) |
| Total | 4,429 (100.0%) | 6,139 (100.0%) |
Real Estate Taxes by Mortgage Status in Brown County
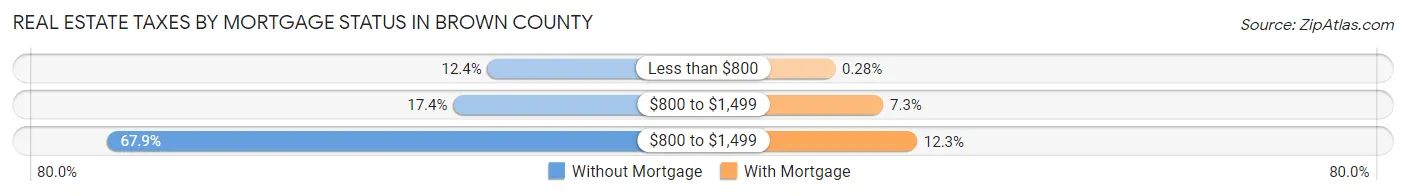
| Property Taxes | Without Mortgage | With Mortgage |
| Less than $800 | 547 (12.3%) | 17 (0.3%) |
| $800 to $1,499 | 769 (17.4%) | 449 (7.3%) |
| $800 to $1,499 | 3,006 (67.9%) | 752 (12.2%) |
| Total | 4,429 (100.0%) | 6,139 (100.0%) |
Health & Disability in Brown County
Health Insurance Coverage by Age in Brown County
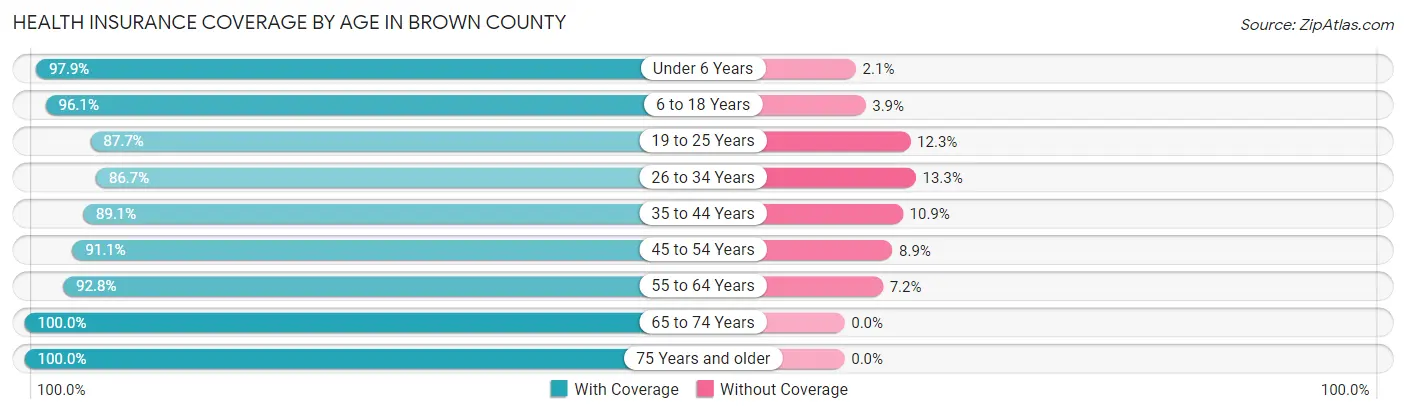
| Age Bracket | With Coverage | Without Coverage |
| Under 6 Years | 2,631 (97.9%) | 57 (2.1%) |
| 6 to 18 Years | 6,438 (96.1%) | 262 (3.9%) |
| 19 to 25 Years | 3,301 (87.7%) | 462 (12.3%) |
| 26 to 34 Years | 3,952 (86.7%) | 605 (13.3%) |
| 35 to 44 Years | 4,002 (89.1%) | 488 (10.9%) |
| 45 to 54 Years | 3,845 (91.1%) | 376 (8.9%) |
| 55 to 64 Years | 4,572 (92.8%) | 353 (7.2%) |
| 65 to 74 Years | 3,804 (100.0%) | 0 (0.0%) |
| 75 Years and older | 2,553 (100.0%) | 0 (0.0%) |
| Total | 35,098 (93.1%) | 2,603 (6.9%) |
Health Insurance Coverage by Citizenship Status in Brown County
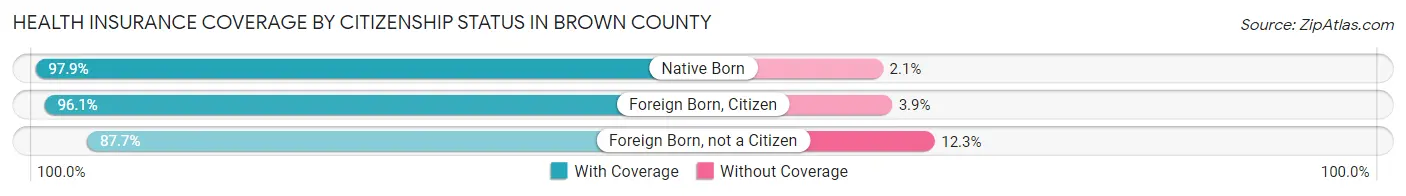
| Citizenship Status | With Coverage | Without Coverage |
| Native Born | 2,631 (97.9%) | 57 (2.1%) |
| Foreign Born, Citizen | 6,438 (96.1%) | 262 (3.9%) |
| Foreign Born, not a Citizen | 3,301 (87.7%) | 462 (12.3%) |
Health Insurance Coverage by Household Income in Brown County
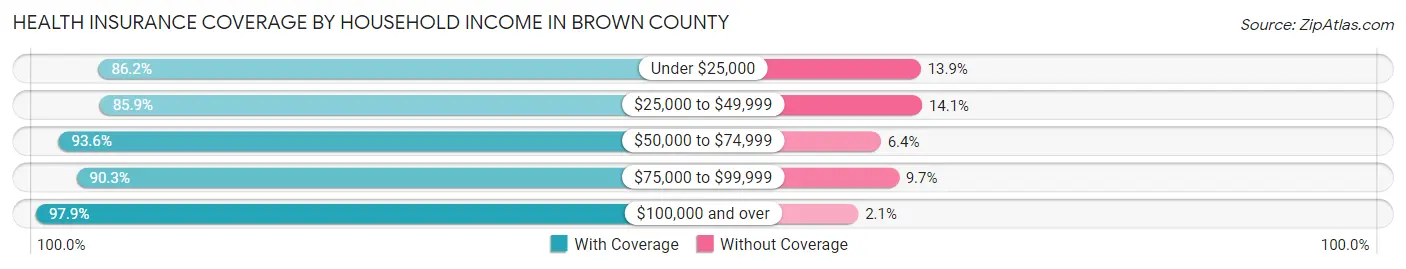
| Household Income | With Coverage | Without Coverage |
| Under $25,000 | 3,147 (86.2%) | 506 (13.9%) |
| $25,000 to $49,999 | 4,564 (85.9%) | 748 (14.1%) |
| $50,000 to $74,999 | 6,520 (93.6%) | 443 (6.4%) |
| $75,000 to $99,999 | 5,260 (90.3%) | 567 (9.7%) |
| $100,000 and over | 15,033 (97.9%) | 329 (2.1%) |
Public vs Private Health Insurance Coverage by Age in Brown County
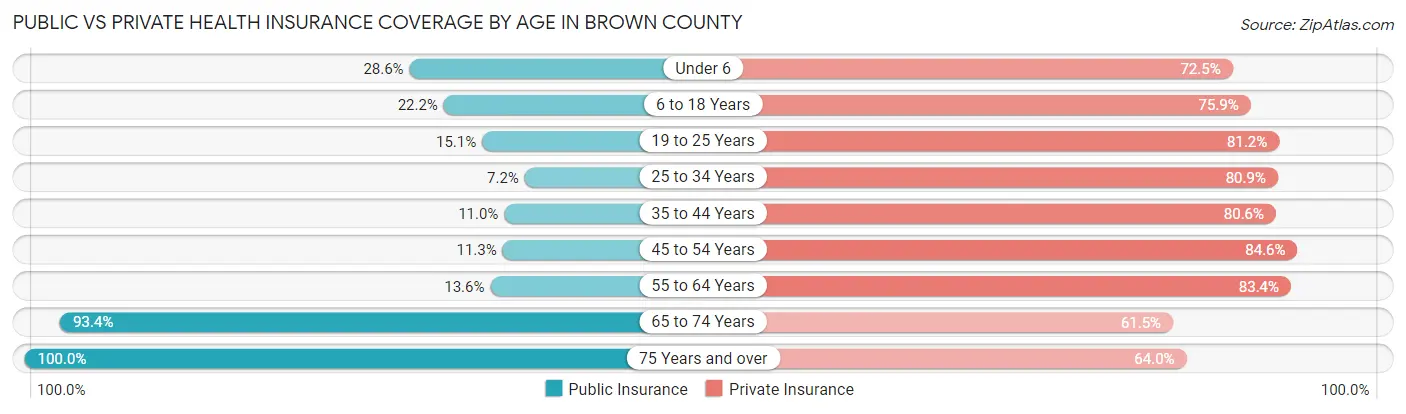
| Age Bracket | Public Insurance | Private Insurance |
| Under 6 | 768 (28.6%) | 1,949 (72.5%) |
| 6 to 18 Years | 1,488 (22.2%) | 5,084 (75.9%) |
| 19 to 25 Years | 568 (15.1%) | 3,054 (81.2%) |
| 25 to 34 Years | 327 (7.2%) | 3,687 (80.9%) |
| 35 to 44 Years | 493 (11.0%) | 3,617 (80.6%) |
| 45 to 54 Years | 476 (11.3%) | 3,569 (84.6%) |
| 55 to 64 Years | 668 (13.6%) | 4,105 (83.4%) |
| 65 to 74 Years | 3,554 (93.4%) | 2,338 (61.5%) |
| 75 Years and over | 2,553 (100.0%) | 1,633 (64.0%) |
| Total | 10,895 (28.9%) | 29,036 (77.0%) |
Disability Status by Sex by Age in Brown County
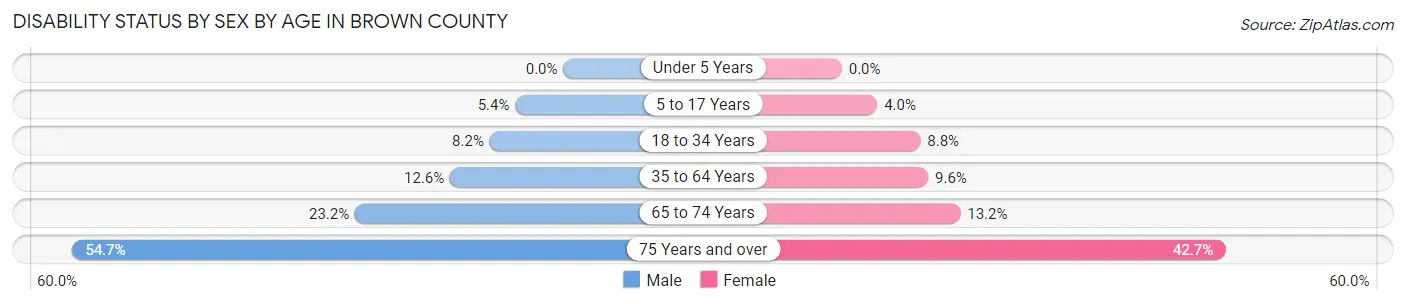
| Age Bracket | Male | Female |
| Under 5 Years | 0 (0.0%) | 0 (0.0%) |
| 5 to 17 Years | 179 (5.3%) | 127 (4.0%) |
| 18 to 34 Years | 374 (8.2%) | 375 (8.7%) |
| 35 to 64 Years | 873 (12.6%) | 645 (9.6%) |
| 65 to 74 Years | 429 (23.2%) | 258 (13.2%) |
| 75 Years and over | 567 (54.7%) | 647 (42.7%) |
Disability Class by Sex by Age in Brown County
Disability Class: Hearing Difficulty
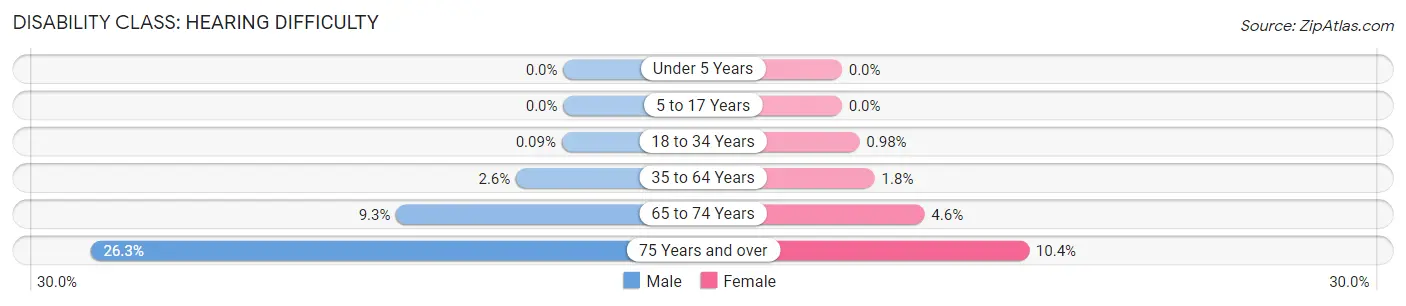
| Age Bracket | Male | Female |
| Under 5 Years | 0 (0.0%) | 0 (0.0%) |
| 5 to 17 Years | 0 (0.0%) | 0 (0.0%) |
| 18 to 34 Years | 4 (0.1%) | 42 (1.0%) |
| 35 to 64 Years | 182 (2.6%) | 123 (1.8%) |
| 65 to 74 Years | 172 (9.3%) | 90 (4.6%) |
| 75 Years and over | 273 (26.3%) | 158 (10.4%) |
Disability Class: Vision Difficulty
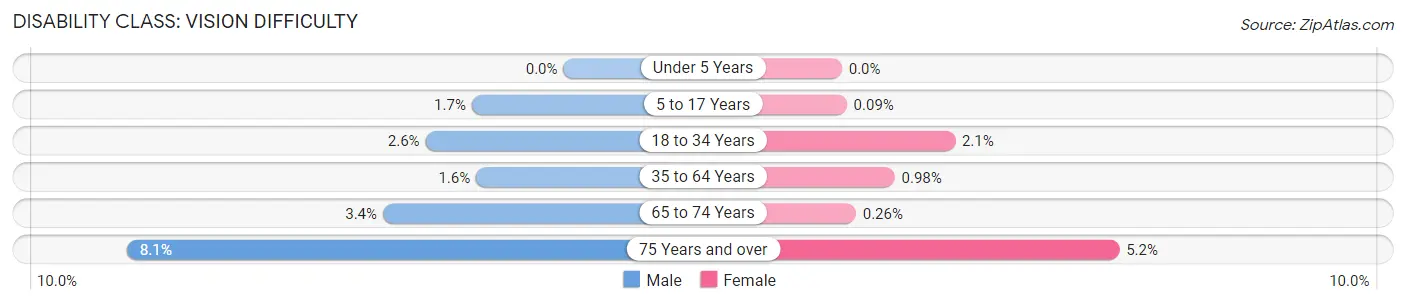
| Age Bracket | Male | Female |
| Under 5 Years | 0 (0.0%) | 0 (0.0%) |
| 5 to 17 Years | 57 (1.7%) | 3 (0.1%) |
| 18 to 34 Years | 117 (2.6%) | 90 (2.1%) |
| 35 to 64 Years | 112 (1.6%) | 66 (1.0%) |
| 65 to 74 Years | 62 (3.4%) | 5 (0.3%) |
| 75 Years and over | 84 (8.1%) | 78 (5.1%) |
Disability Class: Cognitive Difficulty
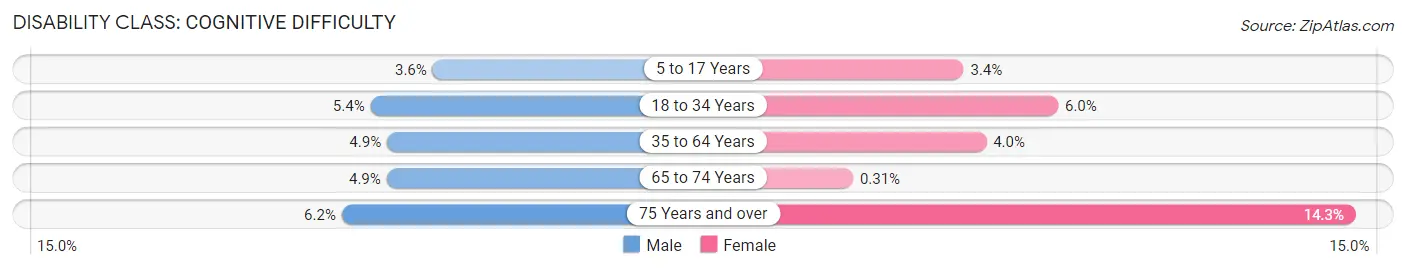
| Age Bracket | Male | Female |
| 5 to 17 Years | 122 (3.6%) | 109 (3.4%) |
| 18 to 34 Years | 245 (5.4%) | 258 (6.0%) |
| 35 to 64 Years | 340 (4.9%) | 270 (4.0%) |
| 65 to 74 Years | 91 (4.9%) | 6 (0.3%) |
| 75 Years and over | 64 (6.2%) | 217 (14.3%) |
Disability Class: Ambulatory Difficulty
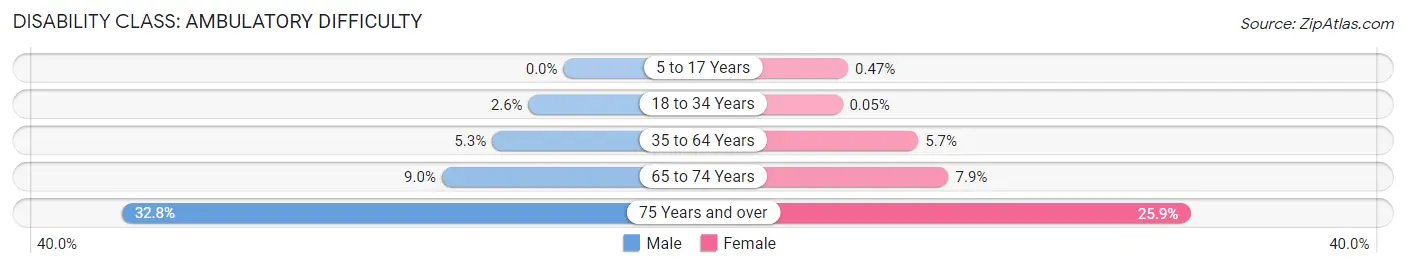
| Age Bracket | Male | Female |
| 5 to 17 Years | 0 (0.0%) | 15 (0.5%) |
| 18 to 34 Years | 118 (2.6%) | 2 (0.1%) |
| 35 to 64 Years | 367 (5.3%) | 381 (5.7%) |
| 65 to 74 Years | 167 (9.0%) | 155 (7.9%) |
| 75 Years and over | 340 (32.8%) | 392 (25.9%) |
Disability Class: Self-Care Difficulty
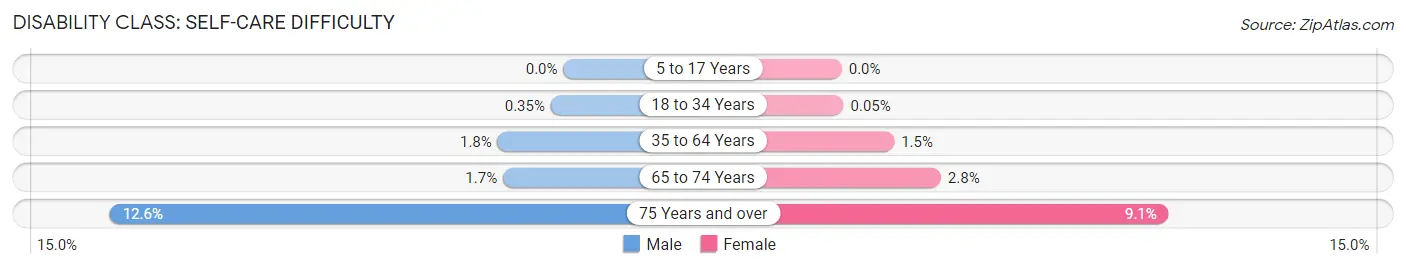
| Age Bracket | Male | Female |
| 5 to 17 Years | 0 (0.0%) | 0 (0.0%) |
| 18 to 34 Years | 16 (0.4%) | 2 (0.1%) |
| 35 to 64 Years | 127 (1.8%) | 98 (1.5%) |
| 65 to 74 Years | 31 (1.7%) | 54 (2.8%) |
| 75 Years and over | 131 (12.6%) | 138 (9.1%) |
Technology Access in Brown County
Computing Device Access in Brown County
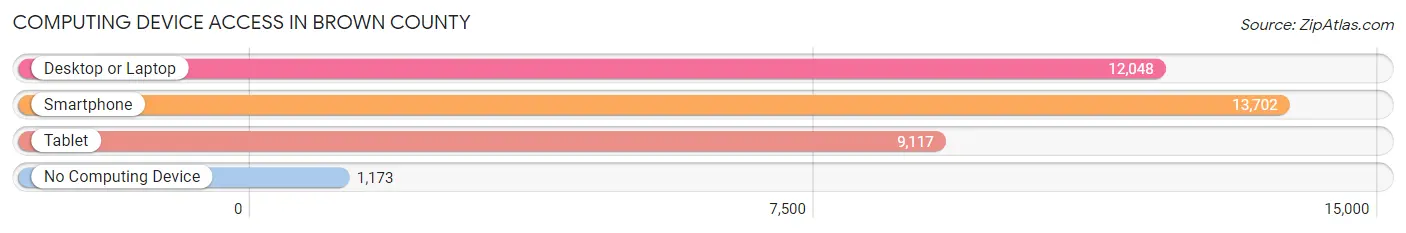
| Device Type | # Households | % Households |
| Desktop or Laptop | 12,048 | 75.1% |
| Smartphone | 13,702 | 85.5% |
| Tablet | 9,117 | 56.9% |
| No Computing Device | 1,173 | 7.3% |
| Total | 16,035 | 100.0% |
Internet Access in Brown County
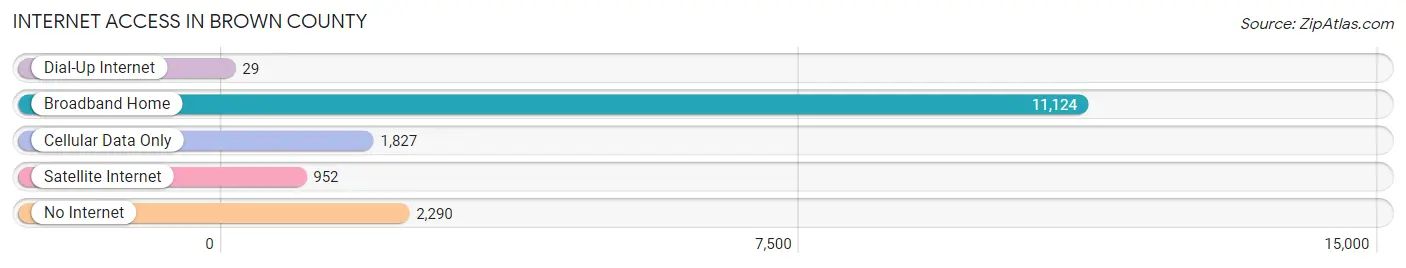
| Internet Type | # Households | % Households |
| Dial-Up Internet | 29 | 0.2% |
| Broadband Home | 11,124 | 69.4% |
| Cellular Data Only | 1,827 | 11.4% |
| Satellite Internet | 952 | 5.9% |
| No Internet | 2,290 | 14.3% |
| Total | 16,035 | 100.0% |
Brown County Summary
Brown County is located in the northeastern corner of South Dakota, and is bordered by Marshall County to the north, Day County to the east, Spink County to the south, and Edmunds County to the west. The county seat is Aberdeen, which is also the largest city in the county. Brown County was established in 1873 and named after Alfred Brown, a former territorial legislator.
Geography
Brown County covers an area of 1,072 square miles, of which 1,068 square miles is land and 4 square miles is water. The county is located in the James River Valley, and is part of the Coteau des Prairies region. The terrain is mostly flat, with some rolling hills in the western part of the county. The highest point in the county is located in the northwest corner, at an elevation of 1,845 feet. The county is drained by the James River, which flows through the center of the county from north to south.
The climate of Brown County is classified as humid continental, with cold, dry winters and hot, humid summers. The average annual temperature is 45°F, and the average annual precipitation is 22 inches.
Economy
The economy of Brown County is largely based on agriculture. The county is home to a variety of crops, including corn, soybeans, wheat, oats, barley, and hay. Livestock production is also important, with cattle, hogs, and sheep being the most common animals raised.
Manufacturing is also an important part of the economy, with the largest employers being the Aberdeen Regional Airport, the Aberdeen Public School District, and the Aberdeen American News. Other major employers include the Northern State University, the Brown County Courthouse, and the Brown County Fairgrounds.
Demographics
As of the 2010 census, there were 36,531 people, 14,845 households, and 9,717 families living in Brown County. The population density was 34 people per square mile. The racial makeup of the county was 94.3% White, 0.7% African American, 0.5% Native American, 0.7% Asian, 0.1% Pacific Islander, 2.2% from other races, and 1.5% from two or more races. Hispanic or Latino of any race were 4.2% of the population.
The median income for a household in the county was $45,837, and the median income for a family was $55,945. The per capita income for the county was $22,845. About 8.2% of families and 11.7% of the population were below the poverty line, including 15.2% of those under age 18 and 8.2% of those age 65 or over.
Brown County is served by the Aberdeen Public School District, which includes seven elementary schools, two middle schools, and one high school. The county is also home to Northern State University, a public university located in Aberdeen.
Brown County is home to a variety of attractions, including the Brown County Fairgrounds, the Brown County Historical Society Museum, and the Storybook Land amusement park. The county is also home to the Aberdeen Regional Airport, which serves the city of Aberdeen and the surrounding area.
Common Questions
What is the Total Population of Brown County?
Total Population of Brown County is 38,278.
What is the Total Male Population of Brown County?
Total Male Population of Brown County is 18,974.
What is the Total Female Population of Brown County?
Total Female Population of Brown County is 19,304.
What is the Ratio of Males per 100 Females in Brown County?
There are 98.29 Males per 100 Females in Brown County.
What is the Ratio of Females per 100 Males in Brown County?
There are 101.74 Females per 100 Males in Brown County.
What is the Median Population Age in Brown County?
Median Population Age in Brown County is 37.3 Years.
What is the Average Family Size in Brown County
Average Family Size in Brown County is 3.1 People.
What is the Average Household Size in Brown County
Average Household Size in Brown County is 2.3 People.
What is Per Capita Income in Brown County?
Per Capita income in Brown County is $38,035.
What is the Median Family Income in Brown County?
Median Family Income in Brown County is $96,494.
What is the Median Household income in Brown County?
Median Household Income in Brown County is $70,379.
What is Income or Wage Gap in Brown County?
Income or Wage Gap in Brown County is 27.1%.
Women in Brown County earn 72.9 cents for every dollar earned by a man.
What is Family Income Deficit in Brown County?
Family Income Deficit in Brown County is $8,715.
Families that are below poverty line in Brown County earn $8,715 less on average than the poverty threshold level.
What is Inequality or Gini Index in Brown County?
Inequality or Gini Index in Brown County is 0.43.
How Large is the Labor Force in Brown County?
There are 21,568 People in the Labor Forcein in Brown County.
What is the Percentage of People in the Labor Force in Brown County?
70.8% of People are in the Labor Force in Brown County.
What is the Unemployment Rate in Brown County?
Unemployment Rate in Brown County is 3.6%.