Brookings County, SD
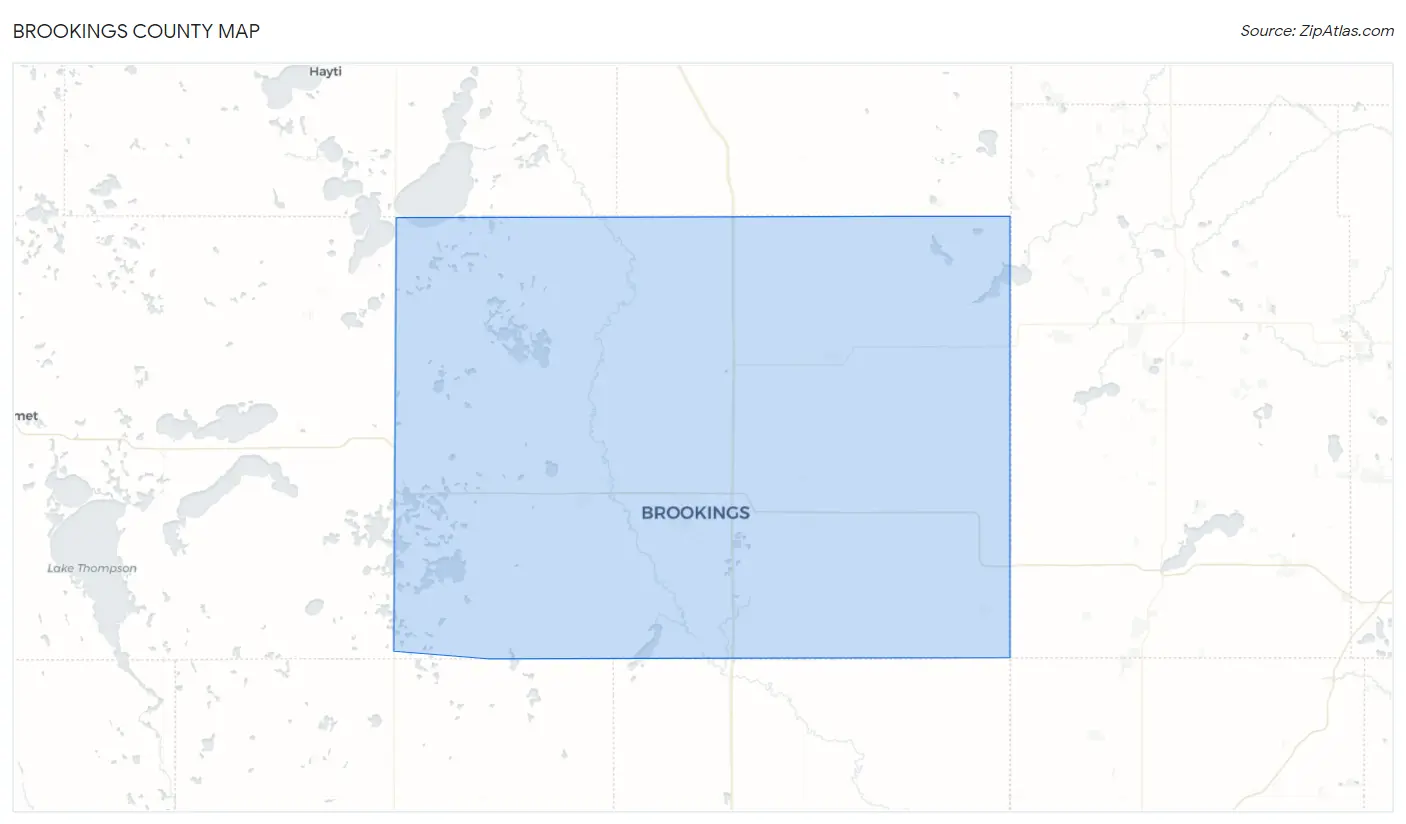
Brookings County Map
Brookings County Overview
34,631
TOTAL POPULATION
17,743
MALE POPULATION
16,888
FEMALE POPULATION
105.06
MALES / 100 FEMALES
95.18
FEMALES / 100 MALES
27.7
MEDIAN AGE
3.1
AVG FAMILY SIZE
2.3
AVG HOUSEHOLD SIZE
$32,778
PER CAPITA INCOME
$100,278
AVG FAMILY INCOME
$64,438
AVG HOUSEHOLD INCOME
24.5%
WAGE / INCOME GAP [ % ]
75.5¢/ $1
WAGE / INCOME GAP [ $ ]
$11,811
FAMILY INCOME DEFICIT
0.41
INEQUALITY / GINI INDEX
20,020
LABOR FORCE [ PEOPLE ]
70.4%
PERCENT IN LABOR FORCE
3.9%
UNEMPLOYMENT RATE
Brookings County Area Codes
Race in Brookings County
The most populous races in Brookings County are White / Caucasian (31,148 | 89.9%), Hispanic or Latino (1,341 | 3.9%), and Two or more Races (1,212 | 3.5%).
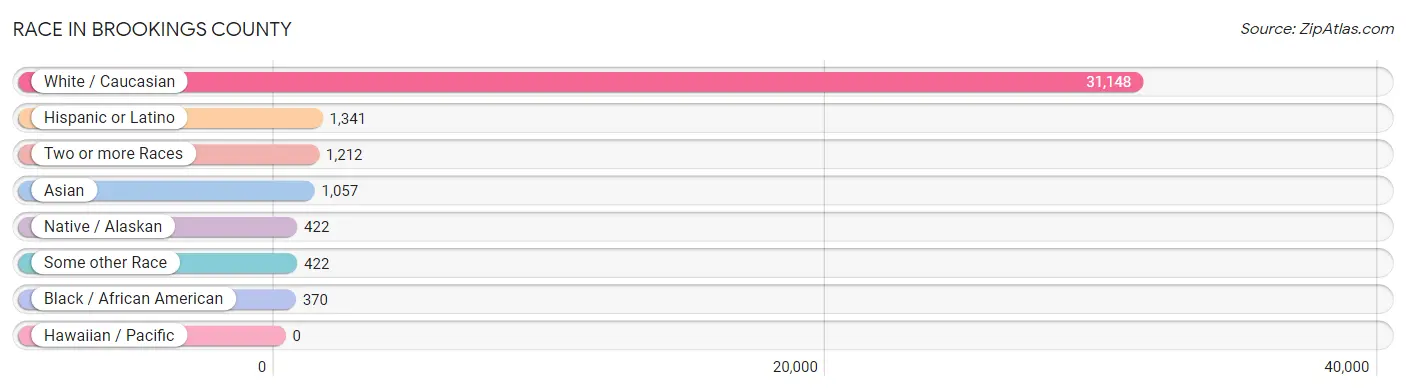
| Race | # Population | % Population |
| Asian | 1,057 | 3.0% |
| Black / African American | 370 | 1.1% |
| Hawaiian / Pacific | 0 | 0.0% |
| Hispanic or Latino | 1,341 | 3.9% |
| Native / Alaskan | 422 | 1.2% |
| White / Caucasian | 31,148 | 89.9% |
| Two or more Races | 1,212 | 3.5% |
| Some other Race | 422 | 1.2% |
| Total | 34,631 | 100.0% |
Ancestry in Brookings County
The most populous ancestries reported in Brookings County are German (13,826 | 39.9%), Norwegian (5,598 | 16.2%), Irish (3,266 | 9.4%), English (2,644 | 7.6%), and Dutch (1,805 | 5.2%), together accounting for 78.4% of all Brookings County residents.
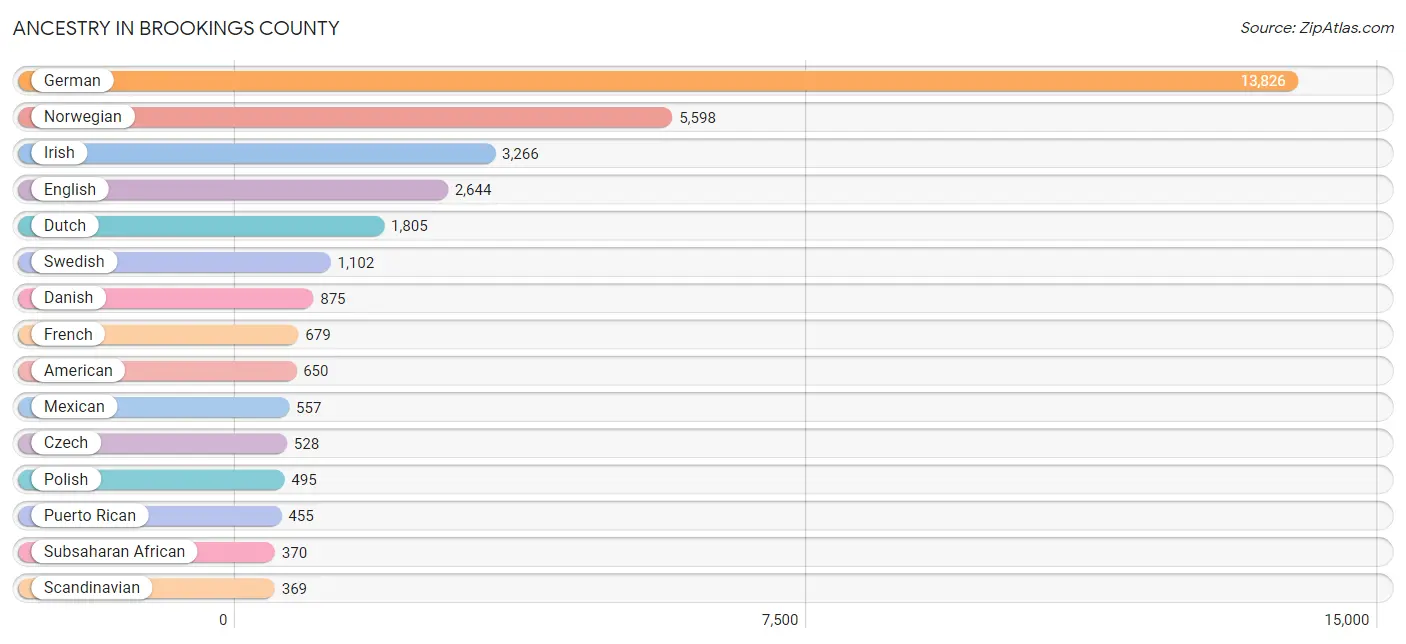
| Ancestry | # Population | % Population |
| African | 87 | 0.3% |
| Alsatian | 3 | 0.0% |
| American | 650 | 1.9% |
| Apache | 2 | 0.0% |
| Arab | 181 | 0.5% |
| Argentinean | 1 | 0.0% |
| Armenian | 15 | 0.0% |
| Austrian | 72 | 0.2% |
| Bahamian | 9 | 0.0% |
| Bangladeshi | 1 | 0.0% |
| Belgian | 144 | 0.4% |
| Bhutanese | 101 | 0.3% |
| Blackfeet | 3 | 0.0% |
| Bolivian | 3 | 0.0% |
| Brazilian | 40 | 0.1% |
| British | 75 | 0.2% |
| Burmese | 158 | 0.5% |
| Canadian | 1 | 0.0% |
| Central American | 181 | 0.5% |
| Central American Indian | 32 | 0.1% |
| Cherokee | 25 | 0.1% |
| Chippewa | 14 | 0.0% |
| Colombian | 65 | 0.2% |
| Croatian | 6 | 0.0% |
| Czech | 528 | 1.5% |
| Czechoslovakian | 10 | 0.0% |
| Danish | 875 | 2.5% |
| Dominican | 6 | 0.0% |
| Dutch | 1,805 | 5.2% |
| Eastern European | 19 | 0.1% |
| Ecuadorian | 8 | 0.0% |
| Egyptian | 47 | 0.1% |
| English | 2,644 | 7.6% |
| Ethiopian | 71 | 0.2% |
| European | 281 | 0.8% |
| Filipino | 1 | 0.0% |
| Finnish | 138 | 0.4% |
| French | 679 | 2.0% |
| French Canadian | 155 | 0.4% |
| German | 13,826 | 39.9% |
| German Russian | 55 | 0.2% |
| Ghanaian | 81 | 0.2% |
| Greek | 23 | 0.1% |
| Guatemalan | 154 | 0.4% |
| Haitian | 7 | 0.0% |
| Honduran | 27 | 0.1% |
| Hungarian | 2 | 0.0% |
| Icelander | 2 | 0.0% |
| Indian (Asian) | 96 | 0.3% |
| Indonesian | 1 | 0.0% |
| Iranian | 11 | 0.0% |
| Iraqi | 55 | 0.2% |
| Irish | 3,266 | 9.4% |
| Italian | 324 | 0.9% |
| Jamaican | 15 | 0.0% |
| Korean | 144 | 0.4% |
| Laotian | 3 | 0.0% |
| Lebanese | 75 | 0.2% |
| Lithuanian | 5 | 0.0% |
| Luxembourger | 10 | 0.0% |
| Mexican | 557 | 1.6% |
| Mexican American Indian | 149 | 0.4% |
| Native Hawaiian | 49 | 0.1% |
| Nigerian | 1 | 0.0% |
| Northern European | 143 | 0.4% |
| Norwegian | 5,598 | 16.2% |
| Palestinian | 4 | 0.0% |
| Pennsylvania German | 25 | 0.1% |
| Peruvian | 3 | 0.0% |
| Polish | 495 | 1.4% |
| Portuguese | 3 | 0.0% |
| Puerto Rican | 455 | 1.3% |
| Russian | 261 | 0.7% |
| Scandinavian | 369 | 1.1% |
| Scotch-Irish | 180 | 0.5% |
| Scottish | 244 | 0.7% |
| Serbian | 46 | 0.1% |
| Sioux | 280 | 0.8% |
| Slavic | 17 | 0.1% |
| Slovene | 3 | 0.0% |
| Somali | 105 | 0.3% |
| South African | 22 | 0.1% |
| South American | 83 | 0.2% |
| Spaniard | 37 | 0.1% |
| Sri Lankan | 40 | 0.1% |
| Subsaharan African | 370 | 1.1% |
| Swedish | 1,102 | 3.2% |
| Swiss | 48 | 0.1% |
| Thai | 339 | 1.0% |
| Ukrainian | 43 | 0.1% |
| Venezuelan | 3 | 0.0% |
| Welsh | 205 | 0.6% |
| Yugoslavian | 7 | 0.0% | View All 93 Rows |
Immigrants in Brookings County
The most numerous immigrant groups reported in Brookings County came from Asia (1,003 | 2.9%), South Central Asia (361 | 1.0%), Africa (339 | 1.0%), Latin America (322 | 0.9%), and Eastern Asia (313 | 0.9%), together accounting for 6.8% of all Brookings County residents.
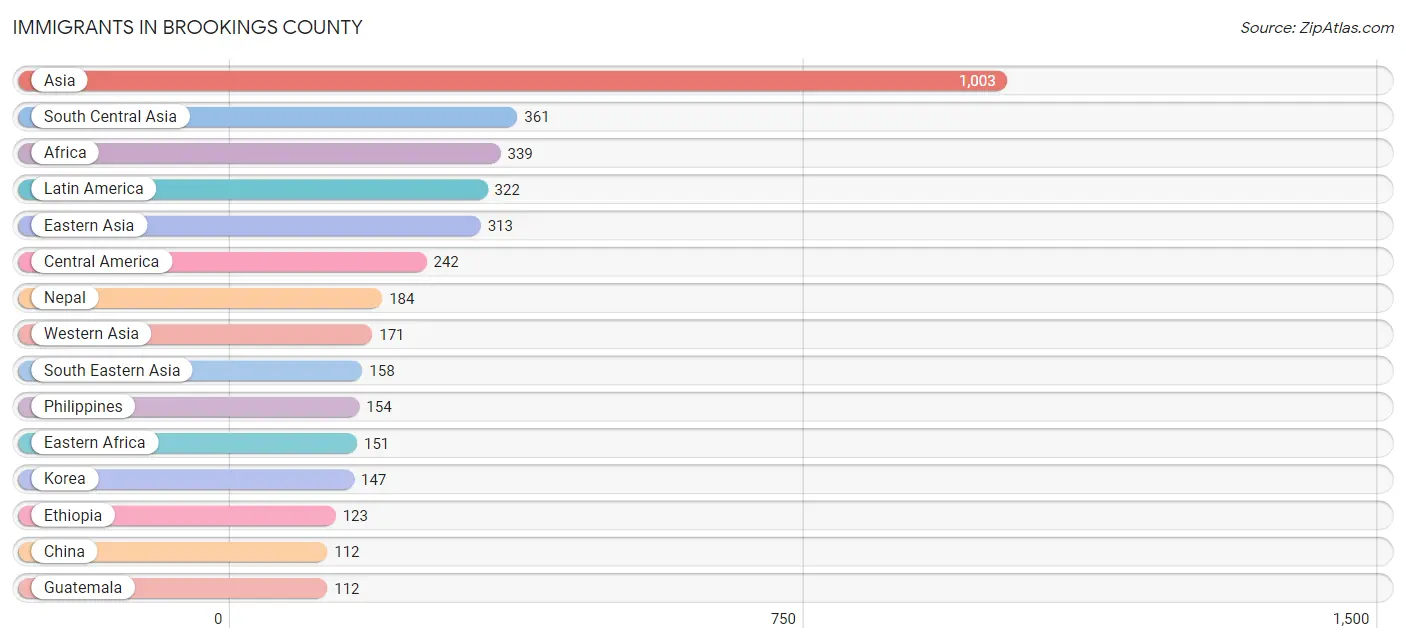
| Immigration Origin | # Population | % Population |
| Africa | 339 | 1.0% |
| Asia | 1,003 | 2.9% |
| Bahamas | 9 | 0.0% |
| Bangladesh | 32 | 0.1% |
| Bolivia | 3 | 0.0% |
| Brazil | 26 | 0.1% |
| Canada | 26 | 0.1% |
| Caribbean | 16 | 0.1% |
| Central America | 242 | 0.7% |
| China | 112 | 0.3% |
| Colombia | 26 | 0.1% |
| Denmark | 7 | 0.0% |
| Eastern Africa | 151 | 0.4% |
| Eastern Asia | 313 | 0.9% |
| Eastern Europe | 30 | 0.1% |
| Egypt | 47 | 0.1% |
| Ethiopia | 123 | 0.4% |
| Europe | 111 | 0.3% |
| Germany | 24 | 0.1% |
| Ghana | 81 | 0.2% |
| Greece | 7 | 0.0% |
| Guatemala | 112 | 0.3% |
| Haiti | 7 | 0.0% |
| Honduras | 23 | 0.1% |
| India | 95 | 0.3% |
| Indonesia | 3 | 0.0% |
| Iran | 11 | 0.0% |
| Iraq | 40 | 0.1% |
| Japan | 54 | 0.2% |
| Korea | 147 | 0.4% |
| Latin America | 322 | 0.9% |
| Lebanon | 86 | 0.3% |
| Mexico | 105 | 0.3% |
| Nepal | 184 | 0.5% |
| Netherlands | 43 | 0.1% |
| Northern Africa | 47 | 0.1% |
| Northern Europe | 7 | 0.0% |
| Oceania | 49 | 0.1% |
| Pakistan | 26 | 0.1% |
| Peru | 6 | 0.0% |
| Philippines | 154 | 0.4% |
| South Africa | 57 | 0.2% |
| South America | 64 | 0.2% |
| South Central Asia | 361 | 1.0% |
| South Eastern Asia | 158 | 0.5% |
| Southern Europe | 7 | 0.0% |
| Thailand | 1 | 0.0% |
| Ukraine | 21 | 0.1% |
| Uzbekistan | 13 | 0.0% |
| Western Africa | 84 | 0.2% |
| Western Asia | 171 | 0.5% |
| Western Europe | 67 | 0.2% | View All 52 Rows |
Sex and Age in Brookings County
Sex and Age in Brookings County
The most populous age groups in Brookings County are 20 to 24 Years (3,019 | 17.0%) for men and 20 to 24 Years (2,941 | 17.4%) for women.
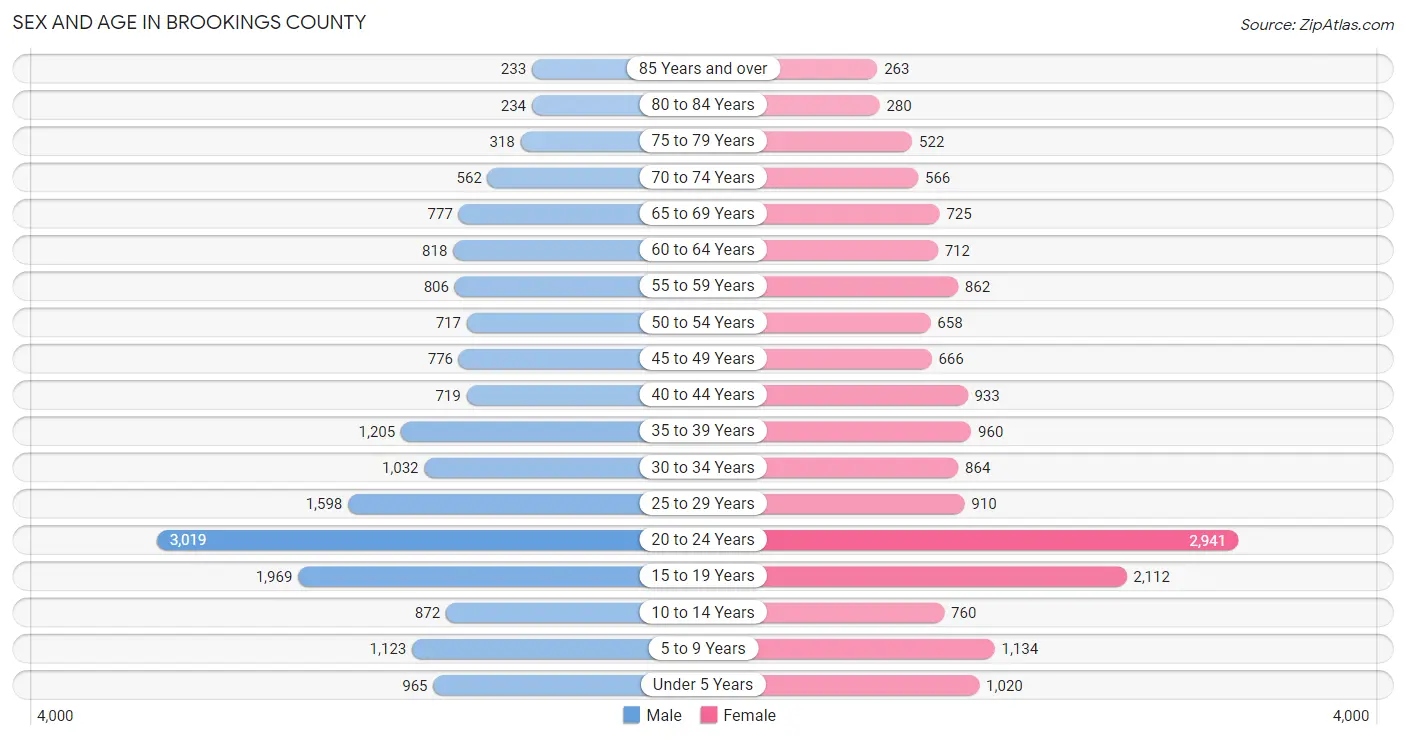
| Age Bracket | Male | Female |
| Under 5 Years | 965 (5.4%) | 1,020 (6.0%) |
| 5 to 9 Years | 1,123 (6.3%) | 1,134 (6.7%) |
| 10 to 14 Years | 872 (4.9%) | 760 (4.5%) |
| 15 to 19 Years | 1,969 (11.1%) | 2,112 (12.5%) |
| 20 to 24 Years | 3,019 (17.0%) | 2,941 (17.4%) |
| 25 to 29 Years | 1,598 (9.0%) | 910 (5.4%) |
| 30 to 34 Years | 1,032 (5.8%) | 864 (5.1%) |
| 35 to 39 Years | 1,205 (6.8%) | 960 (5.7%) |
| 40 to 44 Years | 719 (4.1%) | 933 (5.5%) |
| 45 to 49 Years | 776 (4.4%) | 666 (3.9%) |
| 50 to 54 Years | 717 (4.0%) | 658 (3.9%) |
| 55 to 59 Years | 806 (4.5%) | 862 (5.1%) |
| 60 to 64 Years | 818 (4.6%) | 712 (4.2%) |
| 65 to 69 Years | 777 (4.4%) | 725 (4.3%) |
| 70 to 74 Years | 562 (3.2%) | 566 (3.4%) |
| 75 to 79 Years | 318 (1.8%) | 522 (3.1%) |
| 80 to 84 Years | 234 (1.3%) | 280 (1.7%) |
| 85 Years and over | 233 (1.3%) | 263 (1.6%) |
| Total | 17,743 (100.0%) | 16,888 (100.0%) |
Families and Households in Brookings County
Median Family Size in Brookings County
The median family size in Brookings County is 3.10 persons per family, with single female/mother families (512 | 7.4%) accounting for the largest median family size of 3.19 persons per family. On the other hand, single male/father families (517 | 7.5%) represent the smallest median family size with 2.79 persons per family.
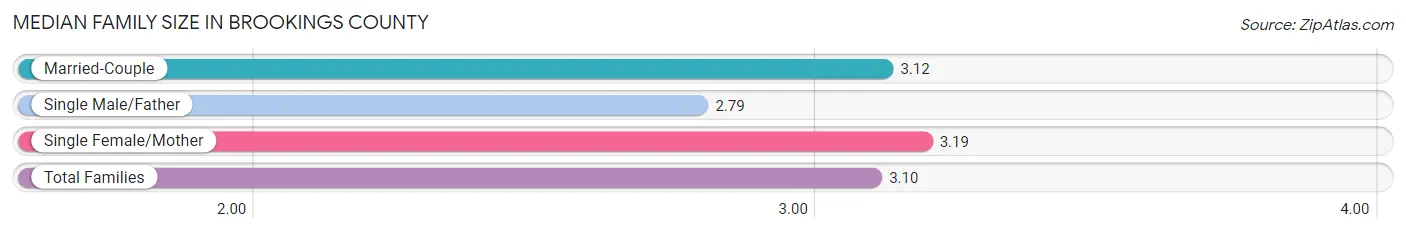
| Family Type | # Families | Family Size |
| Married-Couple | 5,887 (85.1%) | 3.12 |
| Single Male/Father | 517 (7.5%) | 2.79 |
| Single Female/Mother | 512 (7.4%) | 3.19 |
| Total Families | 6,916 (100.0%) | 3.10 |
Median Household Size in Brookings County
The median household size in Brookings County is 2.34 persons per household, with single female/mother households (512 | 3.8%) accounting for the largest median household size of 3.62 persons per household. non-family households (6,450 | 48.3%) represent the smallest median household size with 1.46 persons per household.
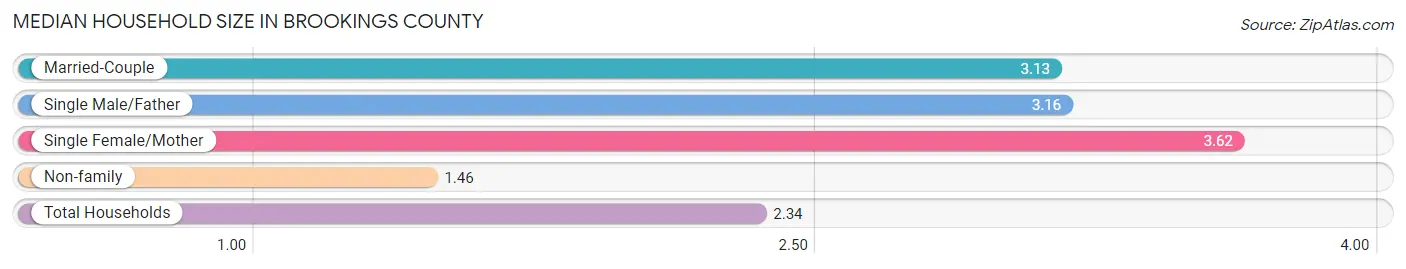
| Household Type | # Households | Household Size |
| Married-Couple | 5,887 (44.0%) | 3.13 |
| Single Male/Father | 517 (3.9%) | 3.16 |
| Single Female/Mother | 512 (3.8%) | 3.62 |
| Non-family | 6,450 (48.3%) | 1.46 |
| Total Households | 13,366 (100.0%) | 2.34 |
Household Size by Marriage Status in Brookings County
Out of a total of 13,366 households in Brookings County, 6,916 (51.7%) are family households, while 6,450 (48.3%) are nonfamily households. The most numerous type of family households are 2-person households, comprising 3,182, and the most common type of nonfamily households are 1-person households, comprising 4,720.
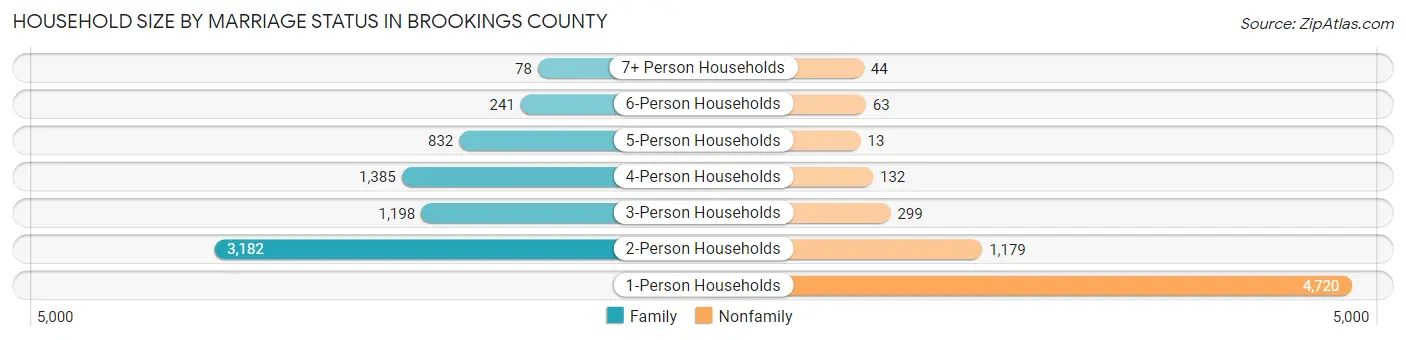
| Household Size | Family Households | Nonfamily Households |
| 1-Person Households | - | 4,720 (35.3%) |
| 2-Person Households | 3,182 (23.8%) | 1,179 (8.8%) |
| 3-Person Households | 1,198 (9.0%) | 299 (2.2%) |
| 4-Person Households | 1,385 (10.4%) | 132 (1.0%) |
| 5-Person Households | 832 (6.2%) | 13 (0.1%) |
| 6-Person Households | 241 (1.8%) | 63 (0.5%) |
| 7+ Person Households | 78 (0.6%) | 44 (0.3%) |
| Total | 6,916 (51.7%) | 6,450 (48.3%) |
Female Fertility in Brookings County
Fertility by Age in Brookings County
Average fertility rate in Brookings County is 27.0 births per 1,000 women. Women in the age bracket of 20 to 34 years have the highest fertility rate with 38.0 births per 1,000 women. Women in the age bracket of 20 to 34 years acount for 70.6% of all women with births.
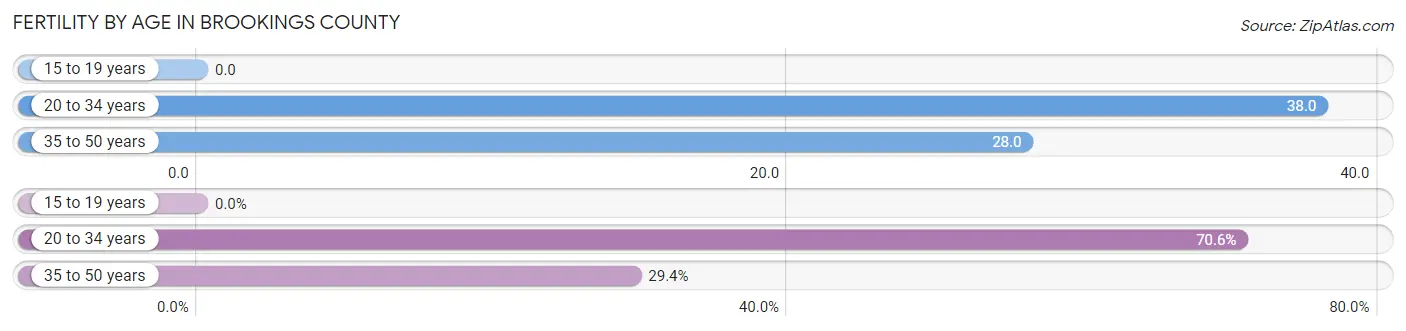
| Age Bracket | Women with Births | Births / 1,000 Women |
| 15 to 19 years | 0 (0.0%) | 0.0 |
| 20 to 34 years | 180 (70.6%) | 38.0 |
| 35 to 50 years | 75 (29.4%) | 28.0 |
| Total | 255 (100.0%) | 27.0 |
Fertility by Age by Marriage Status in Brookings County
94.1% of women with births (255) in Brookings County are married. The highest percentage of unmarried women with births falls into 20 to 34 years age bracket with 8.3% of them unmarried at the time of birth, while the lowest percentage of unmarried women with births belong to 35 to 50 years age bracket with 0.0% of them unmarried.
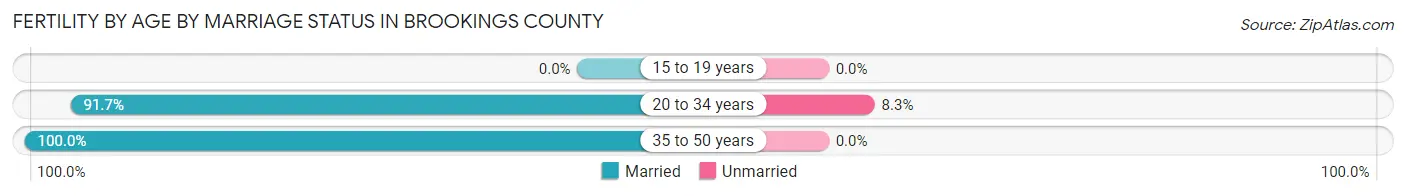
| Age Bracket | Married | Unmarried |
| 15 to 19 years | 0 (0.0%) | 0 (0.0%) |
| 20 to 34 years | 165 (91.7%) | 15 (8.3%) |
| 35 to 50 years | 75 (100.0%) | 0 (0.0%) |
| Total | 240 (94.1%) | 15 (5.9%) |
Fertility by Education in Brookings County
Average fertility rate in Brookings County is 27.0 births per 1,000 women. Women with the education attainment of bachelor's degree have the highest fertility rate of 50.0 births per 1,000 women, while women with the education attainment of high school diploma have the lowest fertility at 15.0 births per 1,000 women. Women with the education attainment of bachelor's degree represent 42.7% of all women with births.
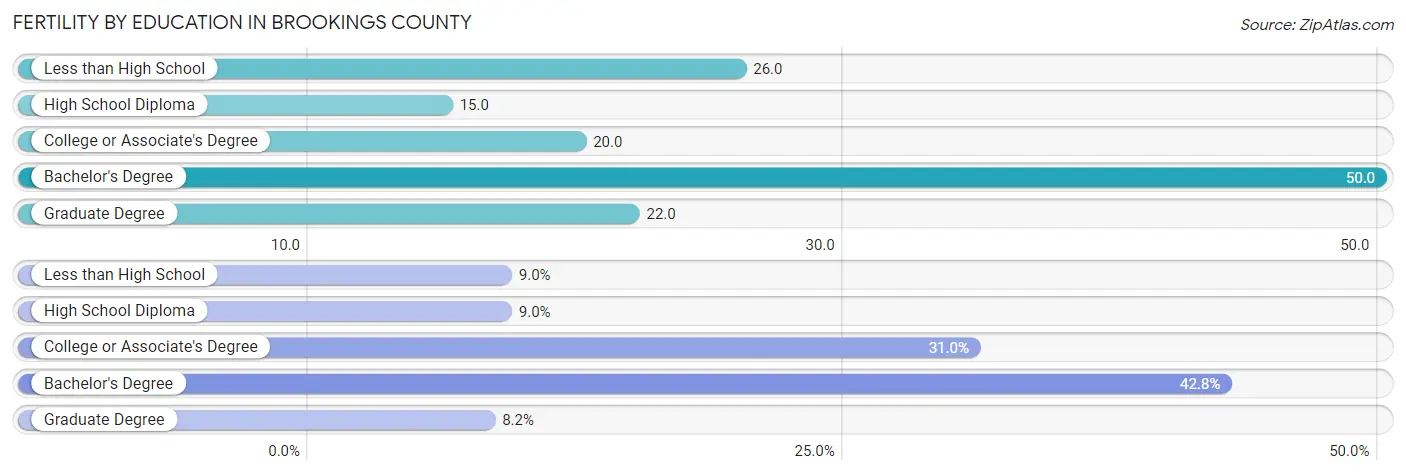
| Educational Attainment | Women with Births | Births / 1,000 Women |
| Less than High School | 23 (9.0%) | 26.0 |
| High School Diploma | 23 (9.0%) | 15.0 |
| College or Associate's Degree | 79 (31.0%) | 20.0 |
| Bachelor's Degree | 109 (42.7%) | 50.0 |
| Graduate Degree | 21 (8.2%) | 22.0 |
| Total | 255 (100.0%) | 27.0 |
Fertility by Education by Marriage Status in Brookings County
5.9% of women with births in Brookings County are unmarried. Women with the educational attainment of bachelor's degree are most likely to be married with 100.0% of them married at childbirth, while women with the educational attainment of less than high school are least likely to be married with 34.8% of them unmarried at childbirth.
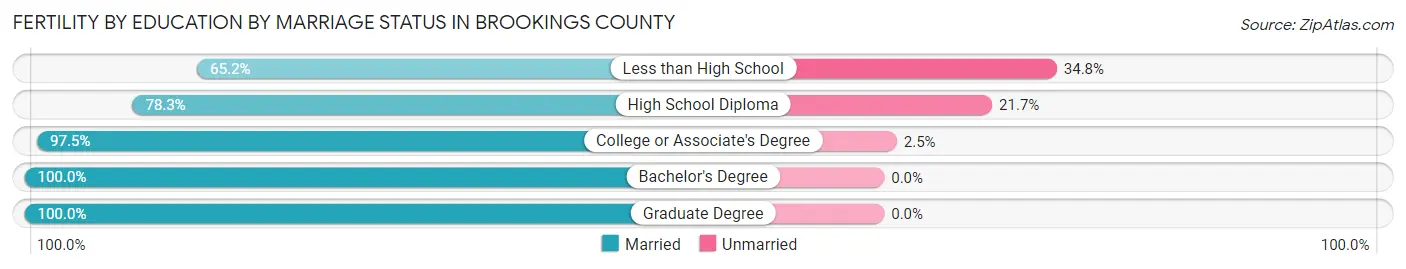
| Educational Attainment | Married | Unmarried |
| Less than High School | 15 (65.2%) | 8 (34.8%) |
| High School Diploma | 18 (78.3%) | 5 (21.7%) |
| College or Associate's Degree | 77 (97.5%) | 2 (2.5%) |
| Bachelor's Degree | 109 (100.0%) | 0 (0.0%) |
| Graduate Degree | 21 (100.0%) | 0 (0.0%) |
| Total | 240 (94.1%) | 15 (5.9%) |
Income in Brookings County
Income Overview in Brookings County
Per Capita Income in Brookings County is $32,778, while median incomes of families and households are $100,278 and $64,438 respectively.
| Characteristic | Number | Measure |
| Per Capita Income | 34,631 | $32,778 |
| Median Family Income | 6,916 | $100,278 |
| Mean Family Income | 6,916 | $110,632 |
| Median Household Income | 13,366 | $64,438 |
| Mean Household Income | 13,366 | $83,191 |
| Income Deficit | 6,916 | $11,811 |
| Wage / Income Gap (%) | 34,631 | 24.55% |
| Wage / Income Gap ($) | 34,631 | 75.45¢ per $1 |
| Gini / Inequality Index | 34,631 | 0.41 |
Earnings by Sex in Brookings County
Average Earnings in Brookings County are $32,169, $37,331 for men and $28,168 for women, a difference of 24.5%.
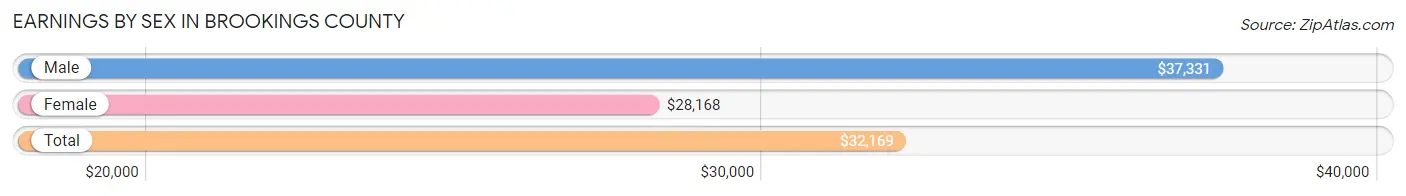
| Sex | Number | Average Earnings |
| Male | 12,074 (53.4%) | $37,331 |
| Female | 10,543 (46.6%) | $28,168 |
| Total | 22,617 (100.0%) | $32,169 |
Earnings by Sex by Income Bracket in Brookings County
The most common earnings brackets in Brookings County are $55,000 to $64,999 for men (1,196 | 9.9%) and $2,499 or less for women (734 | 7.0%).
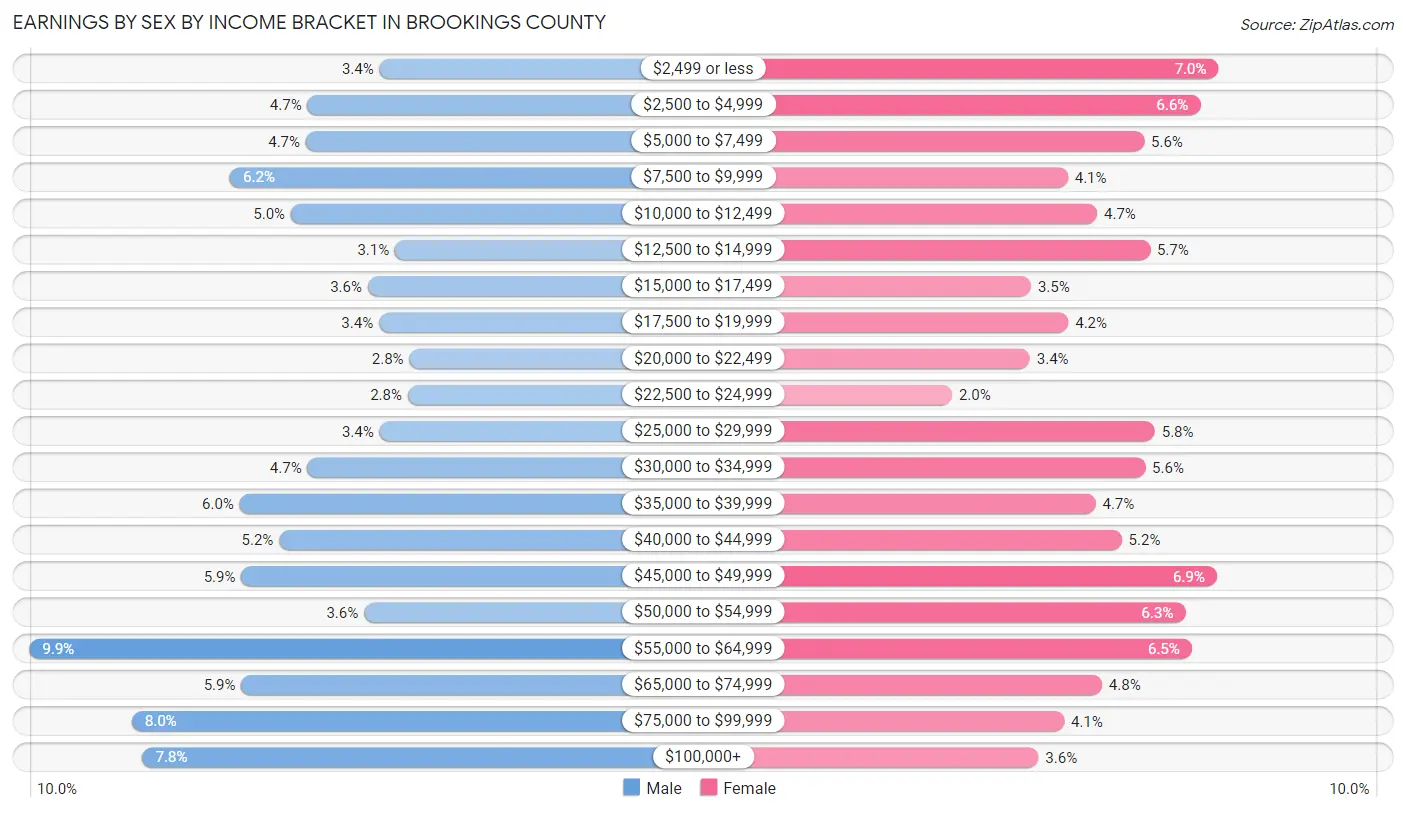
| Income | Male | Female |
| $2,499 or less | 405 (3.4%) | 734 (7.0%) |
| $2,500 to $4,999 | 568 (4.7%) | 698 (6.6%) |
| $5,000 to $7,499 | 571 (4.7%) | 587 (5.6%) |
| $7,500 to $9,999 | 742 (6.1%) | 436 (4.1%) |
| $10,000 to $12,499 | 605 (5.0%) | 494 (4.7%) |
| $12,500 to $14,999 | 370 (3.1%) | 599 (5.7%) |
| $15,000 to $17,499 | 431 (3.6%) | 364 (3.5%) |
| $17,500 to $19,999 | 406 (3.4%) | 438 (4.2%) |
| $20,000 to $22,499 | 337 (2.8%) | 362 (3.4%) |
| $22,500 to $24,999 | 341 (2.8%) | 208 (2.0%) |
| $25,000 to $29,999 | 405 (3.4%) | 608 (5.8%) |
| $30,000 to $34,999 | 567 (4.7%) | 589 (5.6%) |
| $35,000 to $39,999 | 721 (6.0%) | 491 (4.7%) |
| $40,000 to $44,999 | 631 (5.2%) | 543 (5.1%) |
| $45,000 to $49,999 | 717 (5.9%) | 731 (6.9%) |
| $50,000 to $54,999 | 439 (3.6%) | 668 (6.3%) |
| $55,000 to $64,999 | 1,196 (9.9%) | 681 (6.5%) |
| $65,000 to $74,999 | 717 (5.9%) | 504 (4.8%) |
| $75,000 to $99,999 | 965 (8.0%) | 429 (4.1%) |
| $100,000+ | 940 (7.8%) | 379 (3.6%) |
| Total | 12,074 (100.0%) | 10,543 (100.0%) |
Earnings by Sex by Educational Attainment in Brookings County
Average earnings in Brookings County are $52,107 for men and $43,908 for women, a difference of 15.7%. Men with an educational attainment of graduate degree enjoy the highest average annual earnings of $72,069, while those with less than high school education earn the least with $21,815. Women with an educational attainment of graduate degree earn the most with the average annual earnings of $62,704, while those with less than high school education have the smallest earnings of $14,919.
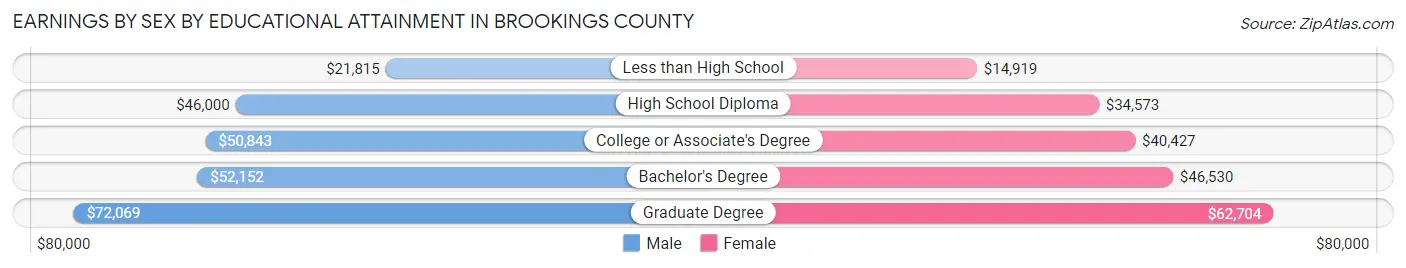
| Educational Attainment | Male Income | Female Income |
| Less than High School | $21,815 | $14,919 |
| High School Diploma | $46,000 | $34,573 |
| College or Associate's Degree | $50,843 | $40,427 |
| Bachelor's Degree | $52,152 | $46,530 |
| Graduate Degree | $72,069 | $62,704 |
| Total | $52,107 | $43,908 |
Family Income in Brookings County
Family Income Brackets in Brookings County
According to the Brookings County family income data, there are 2,137 families falling into the $100,000 to $149,999 income range, which is the most common income bracket and makes up 30.9% of all families. Conversely, the $10,000 to $14,999 income bracket is the least frequent group with only 48 families (0.7%) belonging to this category.
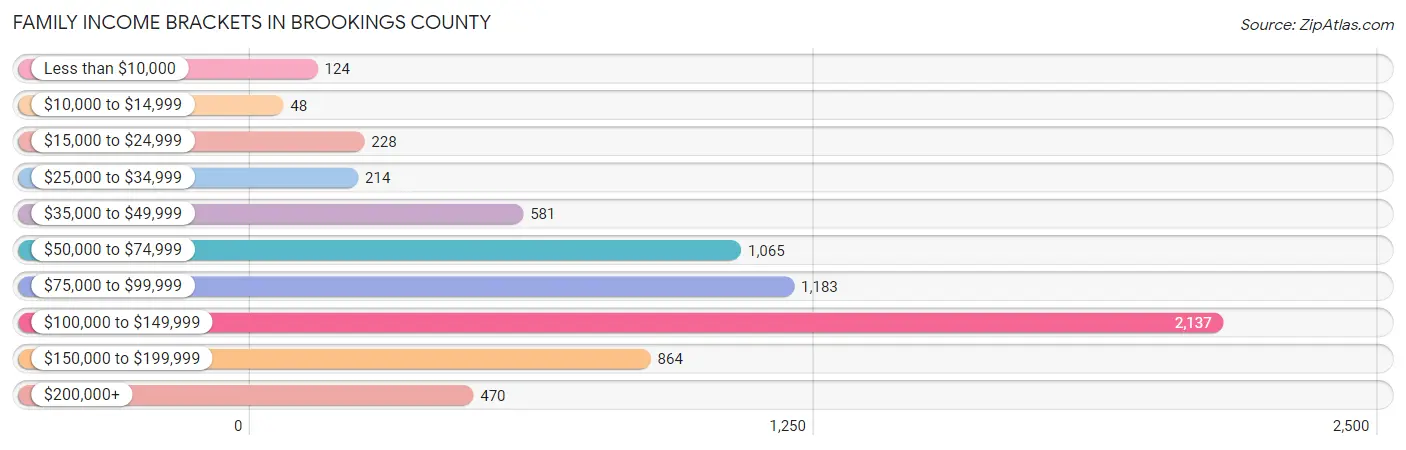
| Income Bracket | # Families | % Families |
| Less than $10,000 | 124 | 1.8% |
| $10,000 to $14,999 | 48 | 0.7% |
| $15,000 to $24,999 | 228 | 3.3% |
| $25,000 to $34,999 | 214 | 3.1% |
| $35,000 to $49,999 | 581 | 8.4% |
| $50,000 to $74,999 | 1,065 | 15.4% |
| $75,000 to $99,999 | 1,183 | 17.1% |
| $100,000 to $149,999 | 2,137 | 30.9% |
| $150,000 to $199,999 | 864 | 12.5% |
| $200,000+ | 470 | 6.8% |
Family Income by Famaliy Size in Brookings County
4-person families (1,395 | 20.2%) account for the highest median family income in Brookings County with $115,387 per family, while 2-person families (3,379 | 48.9%) have the highest median income of $46,142 per family member.
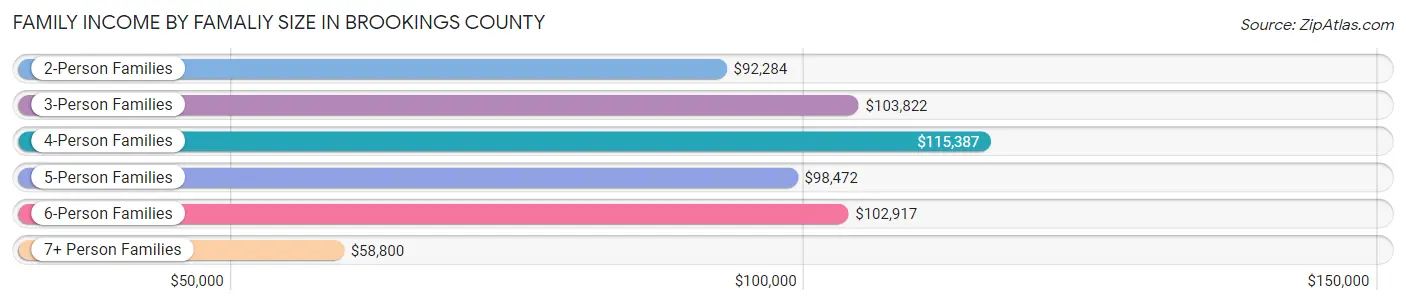
| Income Bracket | # Families | Median Income |
| 2-Person Families | 3,379 (48.9%) | $92,284 |
| 3-Person Families | 1,127 (16.3%) | $103,822 |
| 4-Person Families | 1,395 (20.2%) | $115,387 |
| 5-Person Families | 759 (11.0%) | $98,472 |
| 6-Person Families | 178 (2.6%) | $102,917 |
| 7+ Person Families | 78 (1.1%) | $58,800 |
| Total | 6,916 (100.0%) | $100,278 |
Family Income by Number of Earners in Brookings County
The median family income in Brookings County is $100,278, with families comprising 3+ earners (841) having the highest median family income of $142,188, while families with 1 earner (1,861) have the lowest median family income of $59,121, accounting for 12.2% and 26.9% of families, respectively.
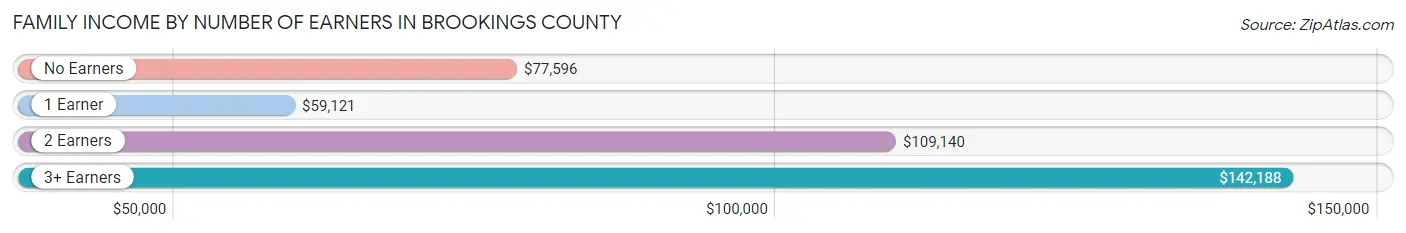
| Number of Earners | # Families | Median Income |
| No Earners | 845 (12.2%) | $77,596 |
| 1 Earner | 1,861 (26.9%) | $59,121 |
| 2 Earners | 3,369 (48.7%) | $109,140 |
| 3+ Earners | 841 (12.2%) | $142,188 |
| Total | 6,916 (100.0%) | $100,278 |
Household Income in Brookings County
Household Income Brackets in Brookings County
With 2,820 households falling in the category, the $50,000 to $74,999 income range is the most frequent in Brookings County, accounting for 21.1% of all households. In contrast, only 495 households (3.7%) fall into the less than $10,000 income bracket, making it the least populous group.
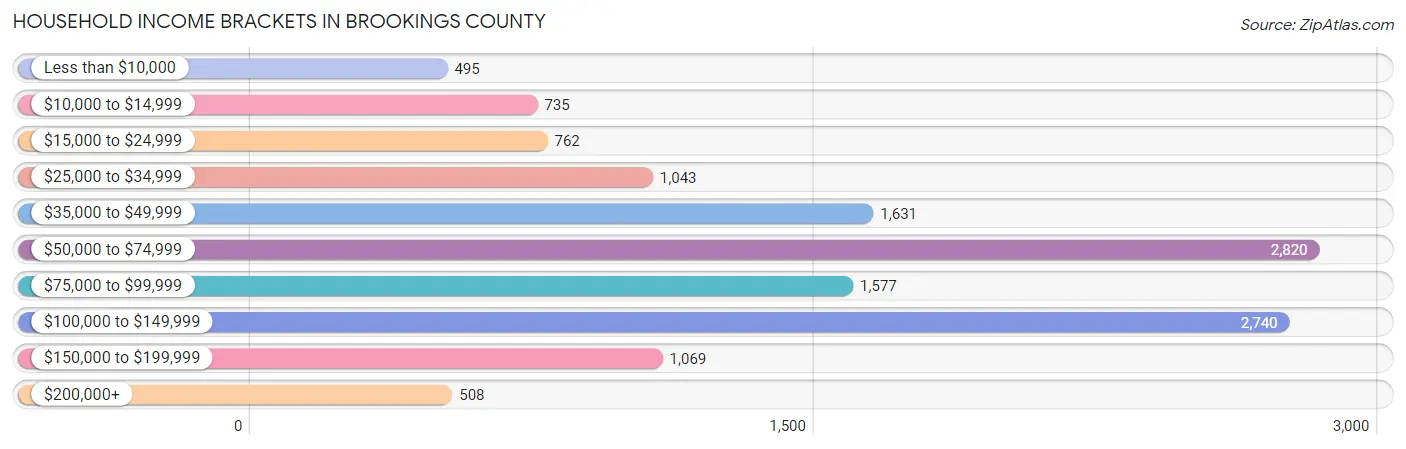
| Income Bracket | # Households | % Households |
| Less than $10,000 | 495 | 3.7% |
| $10,000 to $14,999 | 735 | 5.5% |
| $15,000 to $24,999 | 762 | 5.7% |
| $25,000 to $34,999 | 1,043 | 7.8% |
| $35,000 to $49,999 | 1,631 | 12.2% |
| $50,000 to $74,999 | 2,820 | 21.1% |
| $75,000 to $99,999 | 1,577 | 11.8% |
| $100,000 to $149,999 | 2,740 | 20.5% |
| $150,000 to $199,999 | 1,069 | 8.0% |
| $200,000+ | 508 | 3.8% |
Household Income by Householder Age in Brookings County
The median household income in Brookings County is $64,438, with the highest median household income of $92,604 found in the 45 to 64 years age bracket for the primary householder. A total of 3,770 households (28.2%) fall into this category. Meanwhile, the 15 to 24 years age bracket for the primary householder has the lowest median household income of $39,151, with 2,441 households (18.3%) in this group.
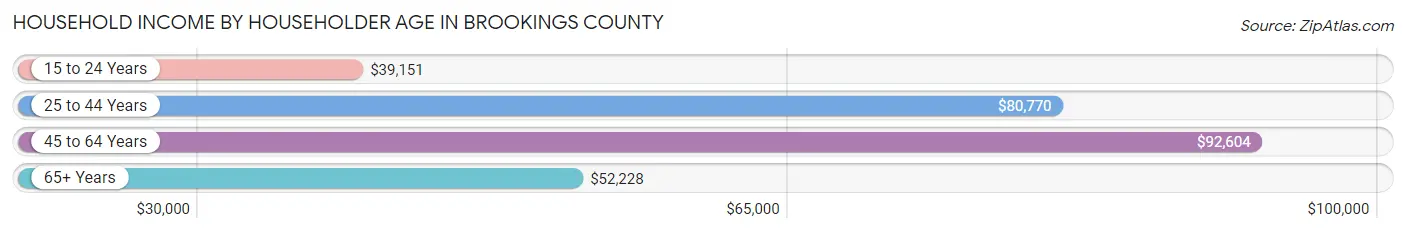
| Income Bracket | # Households | Median Income |
| 15 to 24 Years | 2,441 (18.3%) | $39,151 |
| 25 to 44 Years | 4,349 (32.5%) | $80,770 |
| 45 to 64 Years | 3,770 (28.2%) | $92,604 |
| 65+ Years | 2,806 (21.0%) | $52,228 |
| Total | 13,366 (100.0%) | $64,438 |
Poverty in Brookings County
Income Below Poverty by Sex and Age in Brookings County
With 11.5% poverty level for males and 13.5% for females among the residents of Brookings County, 18 to 24 year old males and 18 to 24 year old females are the most vulnerable to poverty, with 964 males (32.3%) and 1,066 females (37.6%) in their respective age groups living below the poverty level.
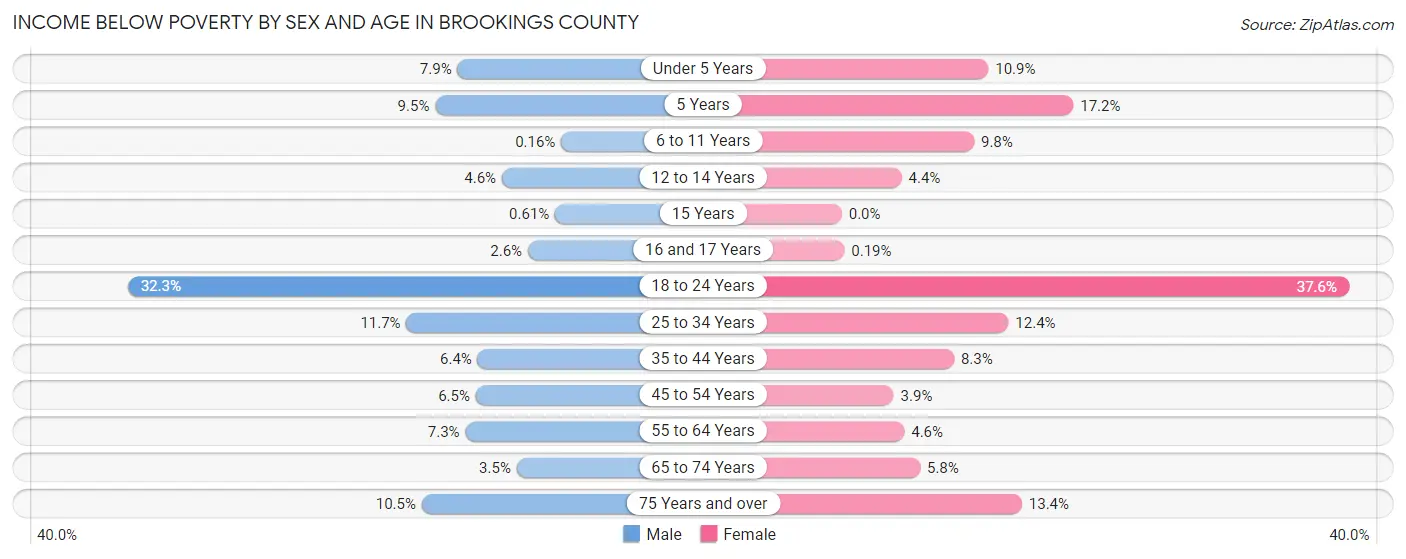
| Age Bracket | Male | Female |
| Under 5 Years | 74 (7.9%) | 111 (10.9%) |
| 5 Years | 25 (9.5%) | 33 (17.2%) |
| 6 to 11 Years | 2 (0.2%) | 113 (9.8%) |
| 12 to 14 Years | 22 (4.6%) | 24 (4.4%) |
| 15 Years | 1 (0.6%) | 0 (0.0%) |
| 16 and 17 Years | 10 (2.6%) | 1 (0.2%) |
| 18 to 24 Years | 964 (32.3%) | 1,066 (37.6%) |
| 25 to 34 Years | 305 (11.7%) | 219 (12.4%) |
| 35 to 44 Years | 122 (6.4%) | 157 (8.3%) |
| 45 to 54 Years | 97 (6.5%) | 51 (3.8%) |
| 55 to 64 Years | 117 (7.3%) | 73 (4.6%) |
| 65 to 74 Years | 46 (3.5%) | 75 (5.8%) |
| 75 Years and over | 79 (10.5%) | 135 (13.4%) |
| Total | 1,864 (11.5%) | 2,058 (13.5%) |
Income Above Poverty by Sex and Age in Brookings County
According to the poverty statistics in Brookings County, males aged 6 to 11 years and females aged 15 years are the age groups that are most secure financially, with 99.8% of males and 100.0% of females in these age groups living above the poverty line.
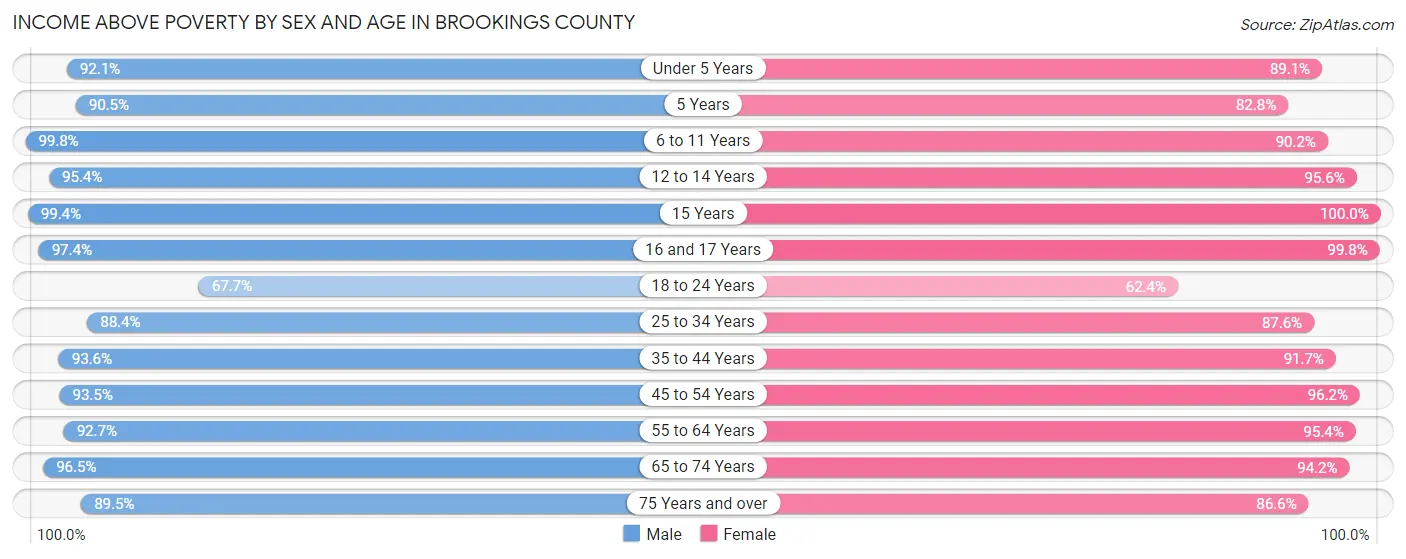
| Age Bracket | Male | Female |
| Under 5 Years | 868 (92.1%) | 909 (89.1%) |
| 5 Years | 238 (90.5%) | 159 (82.8%) |
| 6 to 11 Years | 1,216 (99.8%) | 1,038 (90.2%) |
| 12 to 14 Years | 460 (95.4%) | 516 (95.6%) |
| 15 Years | 163 (99.4%) | 156 (100.0%) |
| 16 and 17 Years | 370 (97.4%) | 526 (99.8%) |
| 18 to 24 Years | 2,017 (67.7%) | 1,766 (62.4%) |
| 25 to 34 Years | 2,314 (88.3%) | 1,552 (87.6%) |
| 35 to 44 Years | 1,795 (93.6%) | 1,728 (91.7%) |
| 45 to 54 Years | 1,396 (93.5%) | 1,273 (96.2%) |
| 55 to 64 Years | 1,492 (92.7%) | 1,501 (95.4%) |
| 65 to 74 Years | 1,285 (96.5%) | 1,216 (94.2%) |
| 75 Years and over | 673 (89.5%) | 875 (86.6%) |
| Total | 14,287 (88.5%) | 13,215 (86.5%) |
Income Below Poverty Among Married-Couple Families in Brookings County
The poverty statistics for married-couple families in Brookings County show that 3.1% or 184 of the total 5,887 families live below the poverty line. Families with 1 or 2 children have the highest poverty rate of 4.2%, comprising of 81 families. On the other hand, families with 5 or more children have the lowest poverty rate of 0.0%, which includes 0 families.
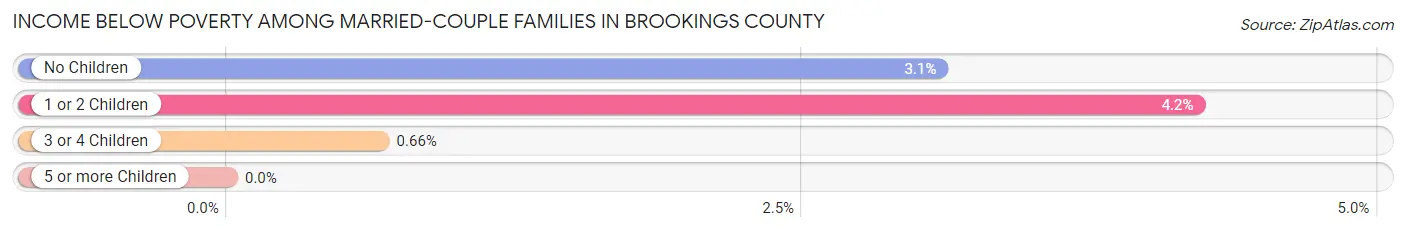
| Children | Above Poverty | Below Poverty |
| No Children | 3,073 (96.9%) | 98 (3.1%) |
| 1 or 2 Children | 1,843 (95.8%) | 81 (4.2%) |
| 3 or 4 Children | 747 (99.3%) | 5 (0.7%) |
| 5 or more Children | 40 (100.0%) | 0 (0.0%) |
| Total | 5,703 (96.9%) | 184 (3.1%) |
Income Below Poverty Among Single-Parent Households in Brookings County
According to the poverty data in Brookings County, 12.8% or 66 single-father households and 14.6% or 75 single-mother households are living below the poverty line. Among single-father households, those with no children have the highest poverty rate, with 66 households (35.5%) experiencing poverty. Likewise, among single-mother households, those with 5 or more children have the highest poverty rate, with 23 households (100.0%) falling below the poverty line.
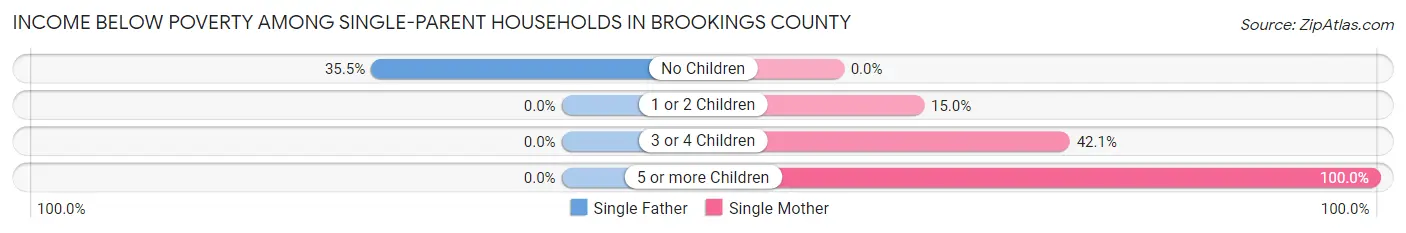
| Children | Single Father | Single Mother |
| No Children | 66 (35.5%) | 0 (0.0%) |
| 1 or 2 Children | 0 (0.0%) | 44 (15.0%) |
| 3 or 4 Children | 0 (0.0%) | 8 (42.1%) |
| 5 or more Children | 0 (0.0%) | 23 (100.0%) |
| Total | 66 (12.8%) | 75 (14.6%) |
Income Below Poverty Among Married-Couple vs Single-Parent Households in Brookings County
The poverty data for Brookings County shows that 184 of the married-couple family households (3.1%) and 141 of the single-parent households (13.7%) are living below the poverty level. Within the married-couple family households, those with 1 or 2 children have the highest poverty rate, with 81 households (4.2%) falling below the poverty line. Among the single-parent households, those with 5 or more children have the highest poverty rate, with 23 household (100.0%) living below poverty.
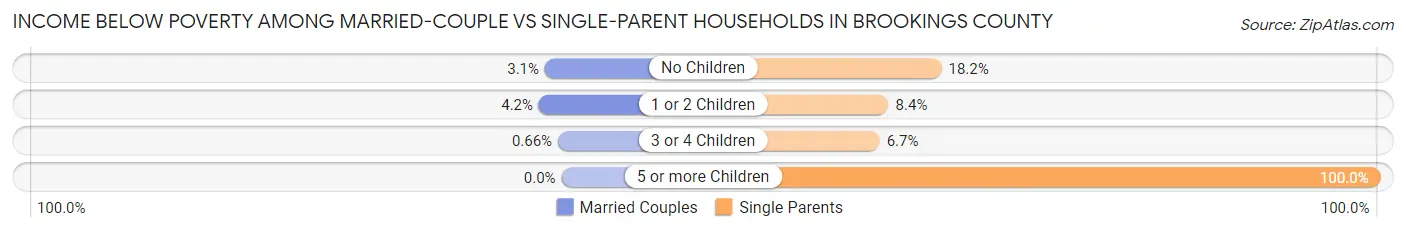
| Children | Married-Couple Families | Single-Parent Households |
| No Children | 98 (3.1%) | 66 (18.2%) |
| 1 or 2 Children | 81 (4.2%) | 44 (8.4%) |
| 3 or 4 Children | 5 (0.7%) | 8 (6.7%) |
| 5 or more Children | 0 (0.0%) | 23 (100.0%) |
| Total | 184 (3.1%) | 141 (13.7%) |
Employment Characteristics in Brookings County
Employment by Class of Employer in Brookings County
Among the 18,827 employed individuals in Brookings County, private company employees (11,995 | 63.7%), state government employees (2,676 | 14.2%), and local government employees (1,358 | 7.2%) make up the most common classes of employment.
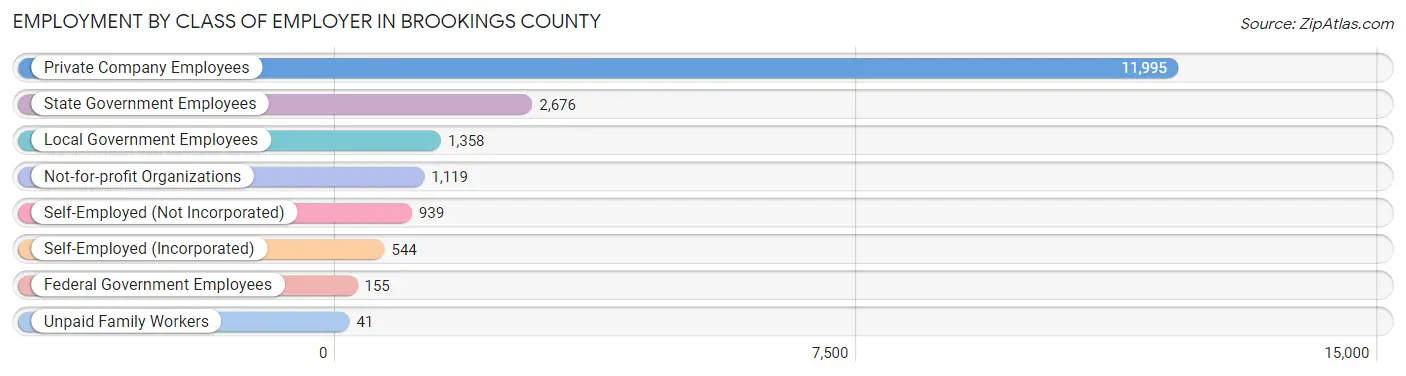
| Employer Class | # Employees | % Employees |
| Private Company Employees | 11,995 | 63.7% |
| Self-Employed (Incorporated) | 544 | 2.9% |
| Self-Employed (Not Incorporated) | 939 | 5.0% |
| Not-for-profit Organizations | 1,119 | 5.9% |
| Local Government Employees | 1,358 | 7.2% |
| State Government Employees | 2,676 | 14.2% |
| Federal Government Employees | 155 | 0.8% |
| Unpaid Family Workers | 41 | 0.2% |
| Total | 18,827 | 100.0% |
Employment Status by Age in Brookings County
According to the labor force statistics for Brookings County, out of the total population over 16 years of age (28,437), 70.4% or 20,020 individuals are in the labor force, with 3.9% or 781 of them unemployed. The age group with the highest labor force participation rate is 35 to 44 years, with 91.5% or 3,493 individuals in the labor force. Within the labor force, the 16 to 19 years age range has the highest percentage of unemployed individuals, with 16.9% or 320 of them being unemployed.
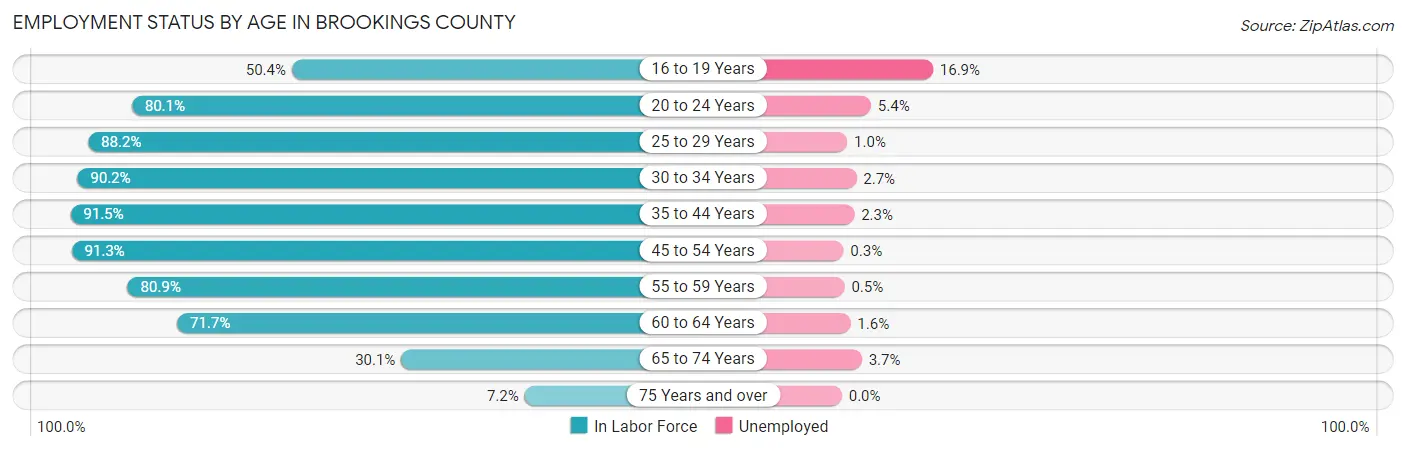
| Age Bracket | In Labor Force | Unemployed |
| 16 to 19 Years | 1,896 (50.4%) | 320 (16.9%) |
| 20 to 24 Years | 4,774 (80.1%) | 258 (5.4%) |
| 25 to 29 Years | 2,212 (88.2%) | 22 (1.0%) |
| 30 to 34 Years | 1,710 (90.2%) | 46 (2.7%) |
| 35 to 44 Years | 3,493 (91.5%) | 80 (2.3%) |
| 45 to 54 Years | 2,572 (91.3%) | 8 (0.3%) |
| 55 to 59 Years | 1,349 (80.9%) | 7 (0.5%) |
| 60 to 64 Years | 1,097 (71.7%) | 18 (1.6%) |
| 65 to 74 Years | 792 (30.1%) | 29 (3.7%) |
| 75 Years and over | 133 (7.2%) | 0 (0.0%) |
| Total | 20,020 (70.4%) | 781 (3.9%) |
Employment Status by Educational Attainment in Brookings County
According to labor force statistics for Brookings County, 87.3% of individuals (12,428) out of the total population between 25 and 64 years of age (14,236) are in the labor force, with 1.5% or 186 of them being unemployed. The group with the highest labor force participation rate are those with the educational attainment of bachelor's degree or higher, with 91.1% or 5,747 individuals in the labor force. Within the labor force, individuals with high school diploma education have the highest percentage of unemployment, with 2.0% or 48 of them being unemployed.
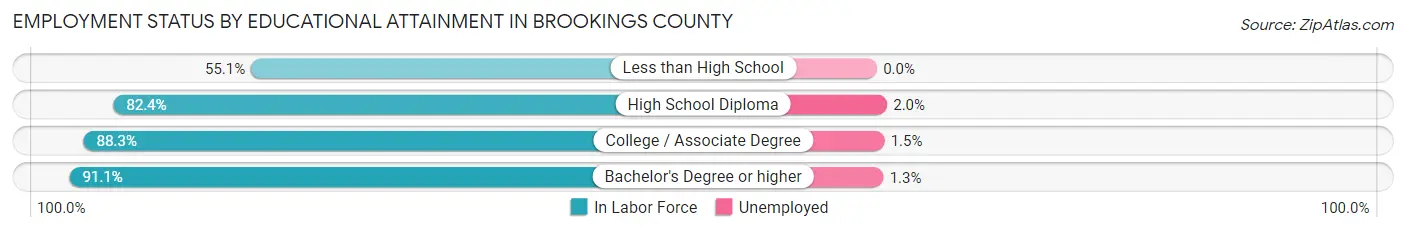
| Educational Attainment | In Labor Force | Unemployed |
| Less than High School | 236 (55.1%) | 0 (0.0%) |
| High School Diploma | 2,418 (82.4%) | 59 (2.0%) |
| College / Associate Degree | 4,031 (88.3%) | 68 (1.5%) |
| Bachelor's Degree or higher | 5,747 (91.1%) | 82 (1.3%) |
| Total | 12,428 (87.3%) | 214 (1.5%) |
Employment Occupations by Sex in Brookings County
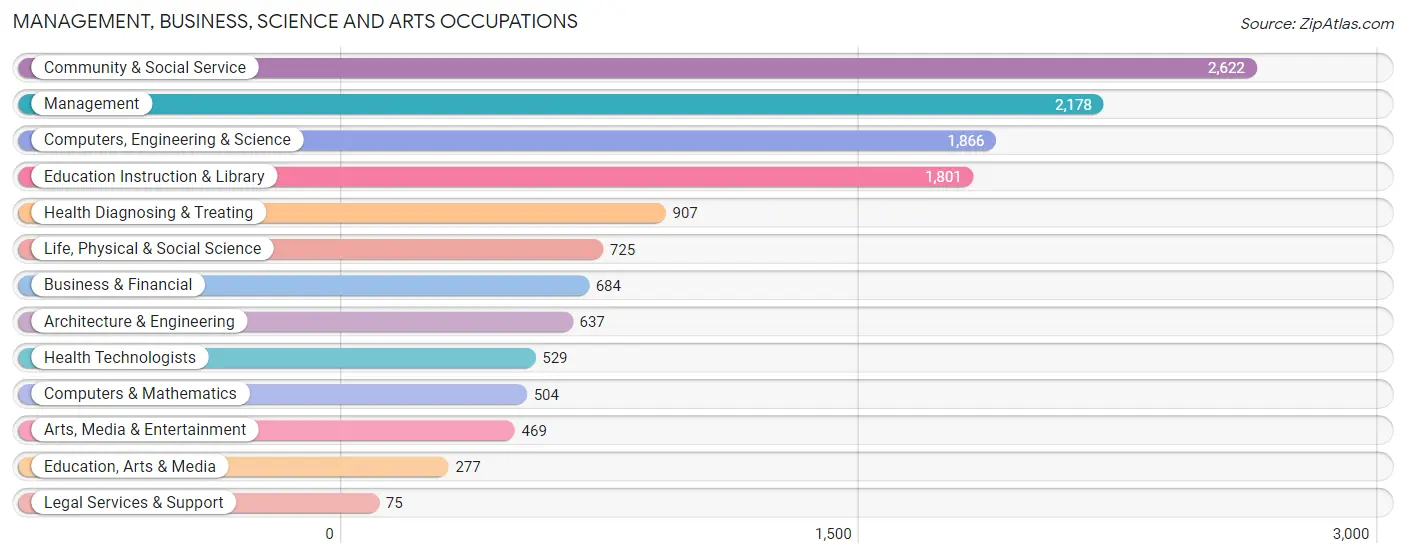
Management, Business, Science and Arts Occupations
The most common Management, Business, Science and Arts occupations in Brookings County are Community & Social Service (2,622 | 13.7%), Management (2,178 | 11.4%), Computers, Engineering & Science (1,866 | 9.7%), Education Instruction & Library (1,801 | 9.4%), and Health Diagnosing & Treating (907 | 4.7%).
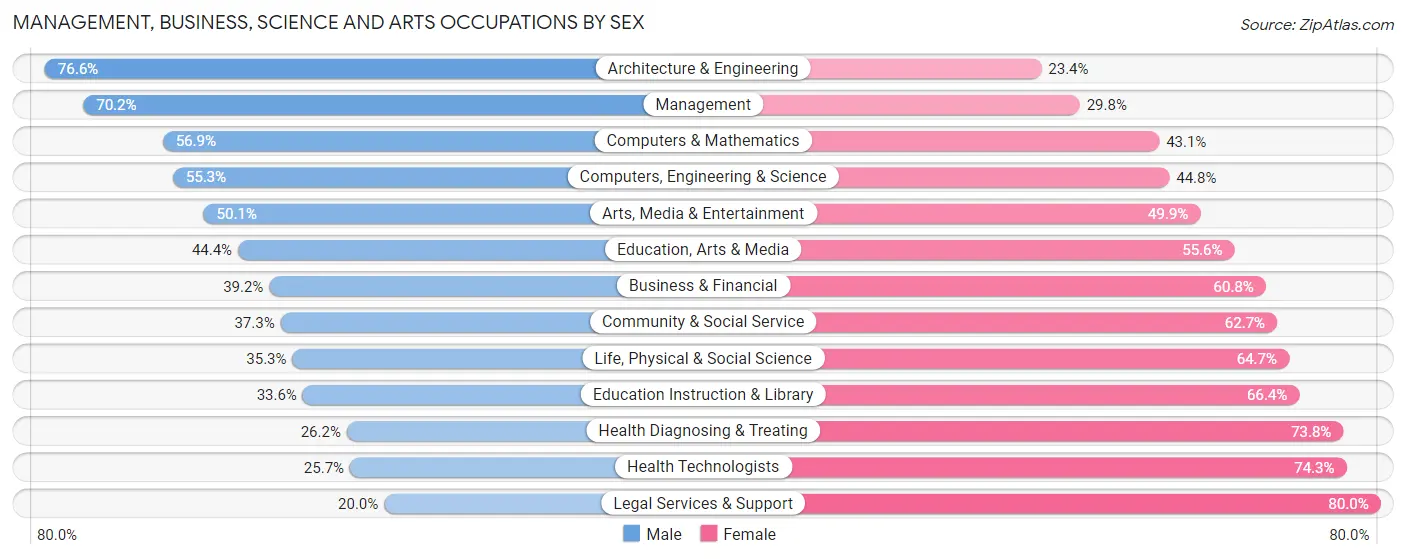
Management, Business, Science and Arts Occupations by Sex
Within the Management, Business, Science and Arts occupations in Brookings County, the most male-oriented occupations are Architecture & Engineering (76.6%), Management (70.2%), and Computers & Mathematics (56.9%), while the most female-oriented occupations are Legal Services & Support (80.0%), Health Technologists (74.3%), and Health Diagnosing & Treating (73.8%).
| Occupation | Male | Female |
| Management | 1,529 (70.2%) | 649 (29.8%) |
| Business & Financial | 268 (39.2%) | 416 (60.8%) |
| Computers, Engineering & Science | 1,031 (55.2%) | 835 (44.8%) |
| Computers & Mathematics | 287 (56.9%) | 217 (43.1%) |
| Architecture & Engineering | 488 (76.6%) | 149 (23.4%) |
| Life, Physical & Social Science | 256 (35.3%) | 469 (64.7%) |
| Community & Social Service | 978 (37.3%) | 1,644 (62.7%) |
| Education, Arts & Media | 123 (44.4%) | 154 (55.6%) |
| Legal Services & Support | 15 (20.0%) | 60 (80.0%) |
| Education Instruction & Library | 605 (33.6%) | 1,196 (66.4%) |
| Arts, Media & Entertainment | 235 (50.1%) | 234 (49.9%) |
| Health Diagnosing & Treating | 238 (26.2%) | 669 (73.8%) |
| Health Technologists | 136 (25.7%) | 393 (74.3%) |
| Total (Category) | 4,044 (49.0%) | 4,213 (51.0%) |
| Total (Overall) | 10,262 (53.5%) | 8,906 (46.5%) |
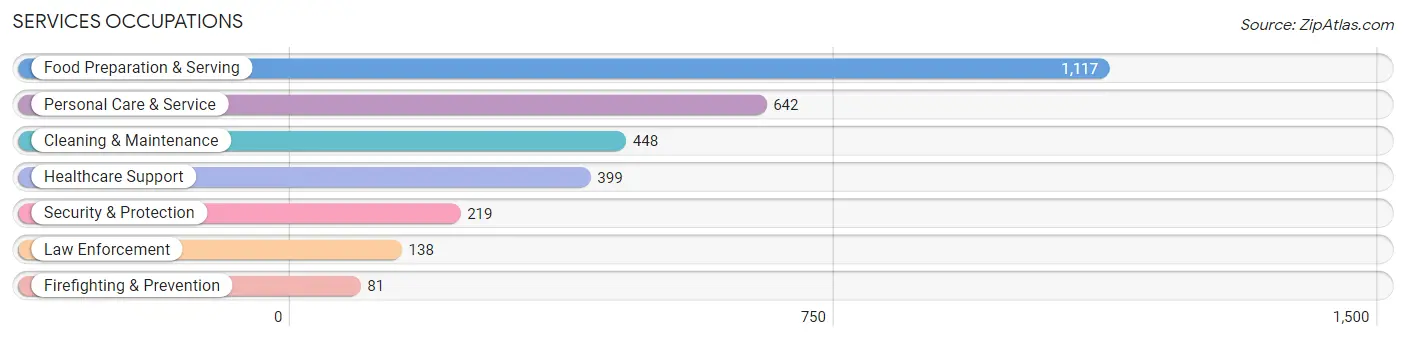
Services Occupations
The most common Services occupations in Brookings County are Food Preparation & Serving (1,117 | 5.8%), Personal Care & Service (642 | 3.4%), Cleaning & Maintenance (448 | 2.3%), Healthcare Support (399 | 2.1%), and Security & Protection (219 | 1.1%).
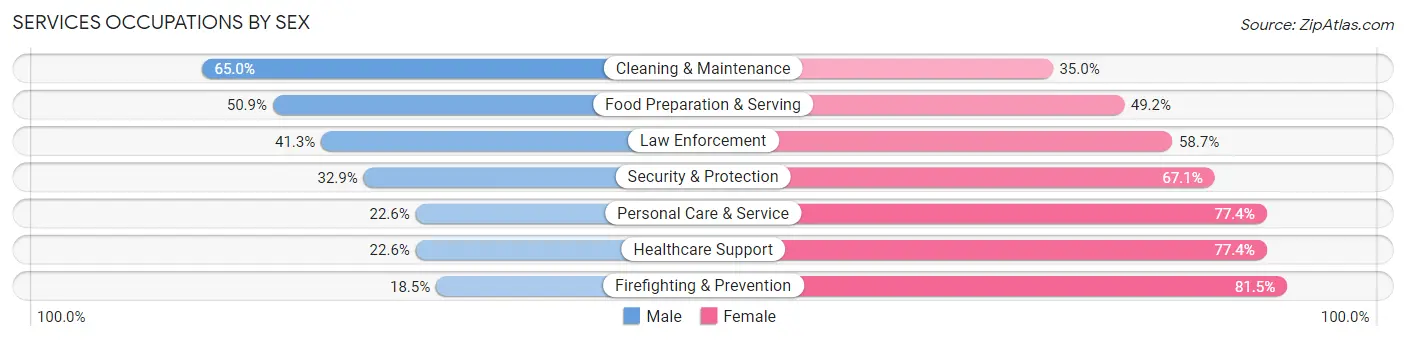
Services Occupations by Sex
Within the Services occupations in Brookings County, the most male-oriented occupations are Cleaning & Maintenance (65.0%), Food Preparation & Serving (50.8%), and Law Enforcement (41.3%), while the most female-oriented occupations are Firefighting & Prevention (81.5%), Healthcare Support (77.4%), and Personal Care & Service (77.4%).
| Occupation | Male | Female |
| Healthcare Support | 90 (22.6%) | 309 (77.4%) |
| Security & Protection | 72 (32.9%) | 147 (67.1%) |
| Firefighting & Prevention | 15 (18.5%) | 66 (81.5%) |
| Law Enforcement | 57 (41.3%) | 81 (58.7%) |
| Food Preparation & Serving | 568 (50.8%) | 549 (49.1%) |
| Cleaning & Maintenance | 291 (65.0%) | 157 (35.0%) |
| Personal Care & Service | 145 (22.6%) | 497 (77.4%) |
| Total (Category) | 1,166 (41.3%) | 1,659 (58.7%) |
| Total (Overall) | 10,262 (53.5%) | 8,906 (46.5%) |
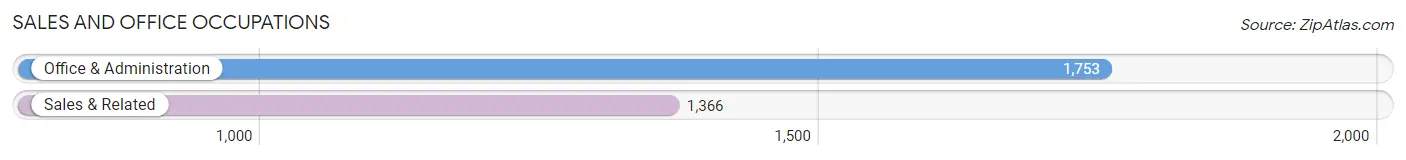
Sales and Office Occupations
The most common Sales and Office occupations in Brookings County are Office & Administration (1,753 | 9.1%), and Sales & Related (1,366 | 7.1%).
Sales and Office Occupations by Sex
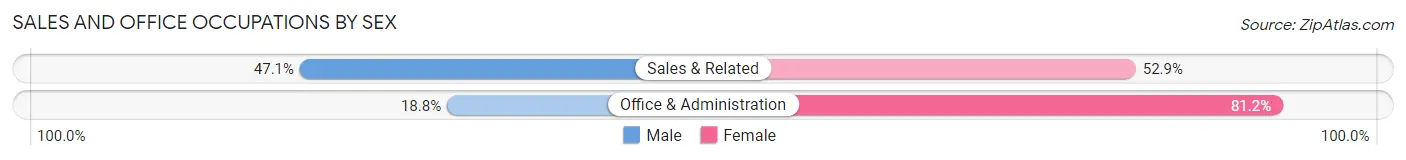
| Occupation | Male | Female |
| Sales & Related | 643 (47.1%) | 723 (52.9%) |
| Office & Administration | 329 (18.8%) | 1,424 (81.2%) |
| Total (Category) | 972 (31.2%) | 2,147 (68.8%) |
| Total (Overall) | 10,262 (53.5%) | 8,906 (46.5%) |
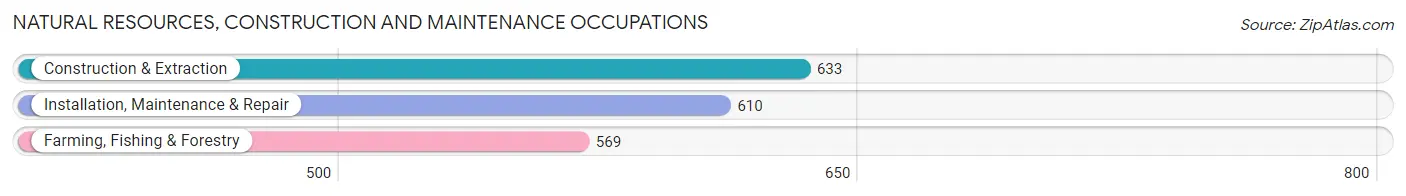
Natural Resources, Construction and Maintenance Occupations
The most common Natural Resources, Construction and Maintenance occupations in Brookings County are Construction & Extraction (633 | 3.3%), Installation, Maintenance & Repair (610 | 3.2%), and Farming, Fishing & Forestry (569 | 3.0%).
Natural Resources, Construction and Maintenance Occupations by Sex
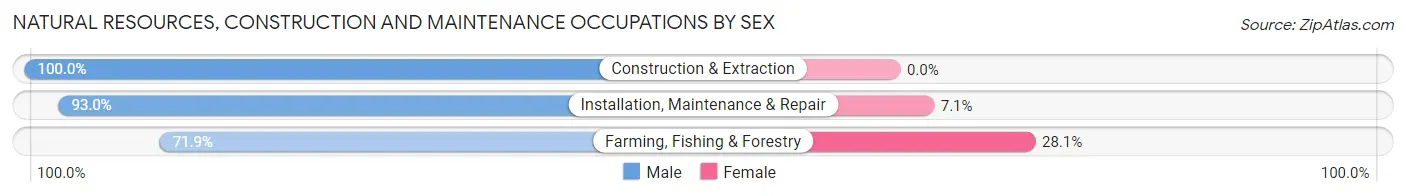
| Occupation | Male | Female |
| Farming, Fishing & Forestry | 409 (71.9%) | 160 (28.1%) |
| Construction & Extraction | 633 (100.0%) | 0 (0.0%) |
| Installation, Maintenance & Repair | 567 (92.9%) | 43 (7.0%) |
| Total (Category) | 1,609 (88.8%) | 203 (11.2%) |
| Total (Overall) | 10,262 (53.5%) | 8,906 (46.5%) |
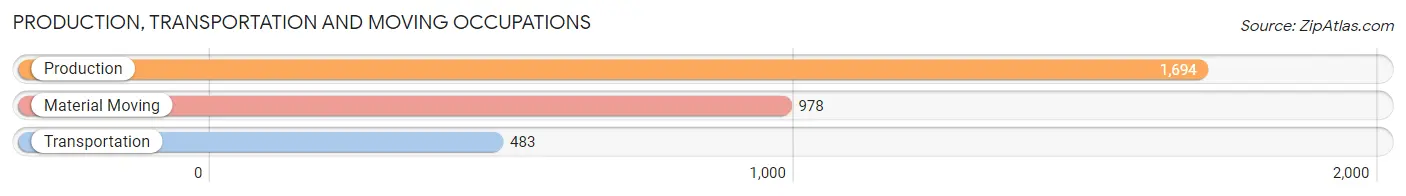
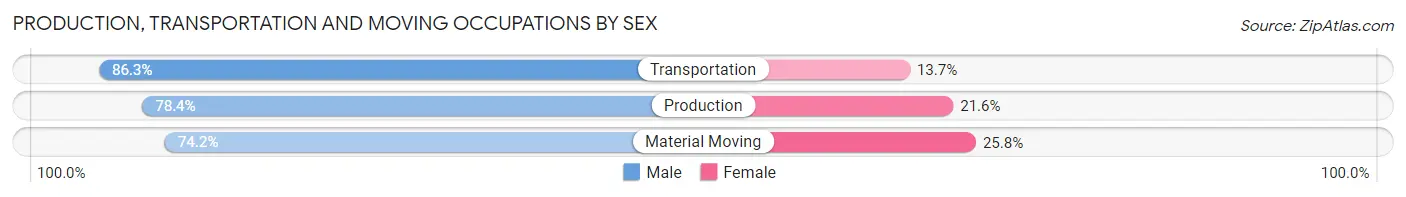
Production, Transportation and Moving Occupations
The most common Production, Transportation and Moving occupations in Brookings County are Production (1,694 | 8.8%), Material Moving (978 | 5.1%), and Transportation (483 | 2.5%).
Production, Transportation and Moving Occupations by Sex
| Occupation | Male | Female |
| Production | 1,328 (78.4%) | 366 (21.6%) |
| Transportation | 417 (86.3%) | 66 (13.7%) |
| Material Moving | 726 (74.2%) | 252 (25.8%) |
| Total (Category) | 2,471 (78.3%) | 684 (21.7%) |
| Total (Overall) | 10,262 (53.5%) | 8,906 (46.5%) |
Employment Industries by Sex in Brookings County
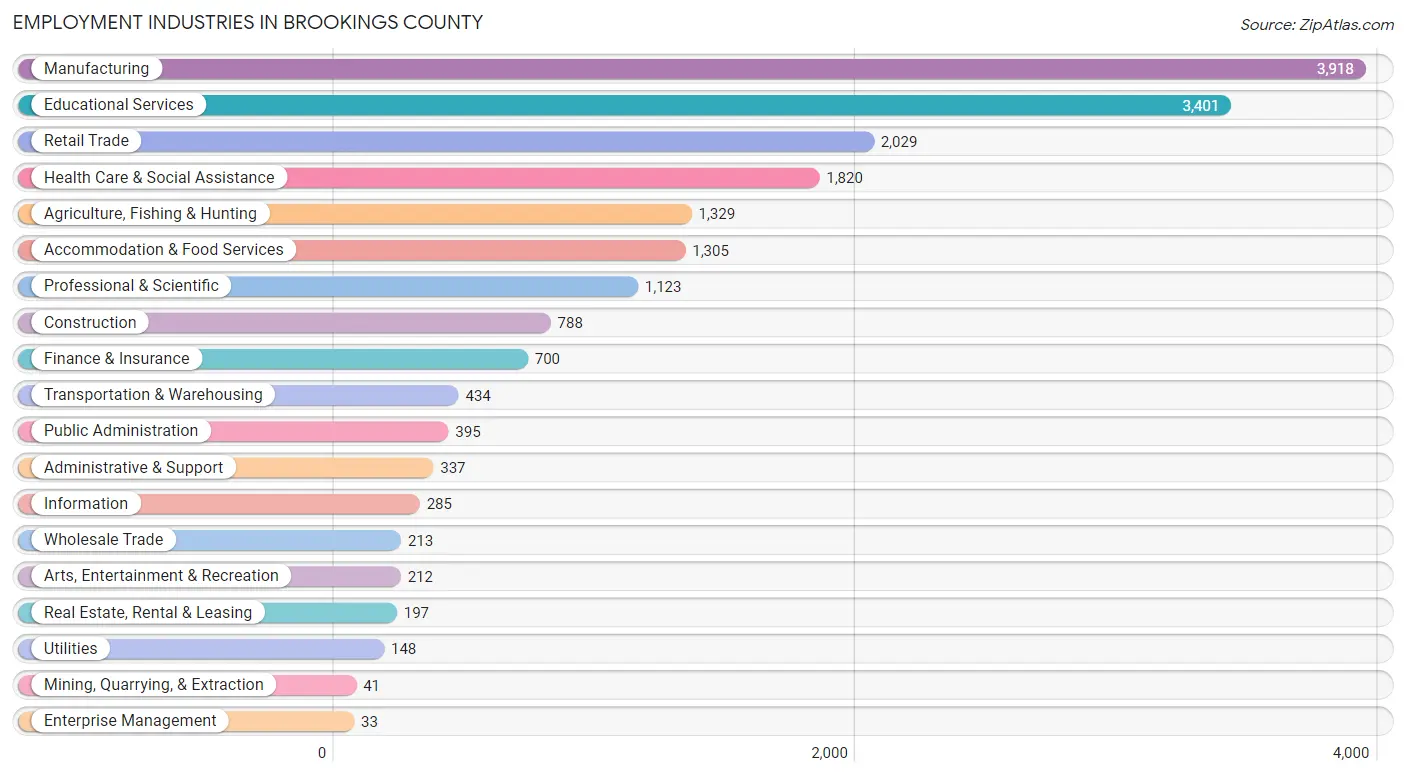
Employment Industries in Brookings County
The major employment industries in Brookings County include Manufacturing (3,918 | 20.4%), Educational Services (3,401 | 17.7%), Retail Trade (2,029 | 10.6%), Health Care & Social Assistance (1,820 | 9.5%), and Agriculture, Fishing & Hunting (1,329 | 6.9%).
Employment Industries by Sex in Brookings County
The Brookings County industries that see more men than women are Mining, Quarrying, & Extraction (100.0%), Construction (90.1%), and Agriculture, Fishing & Hunting (83.0%), whereas the industries that tend to have a higher number of women are Enterprise Management (100.0%), Health Care & Social Assistance (82.6%), and Finance & Insurance (76.0%).
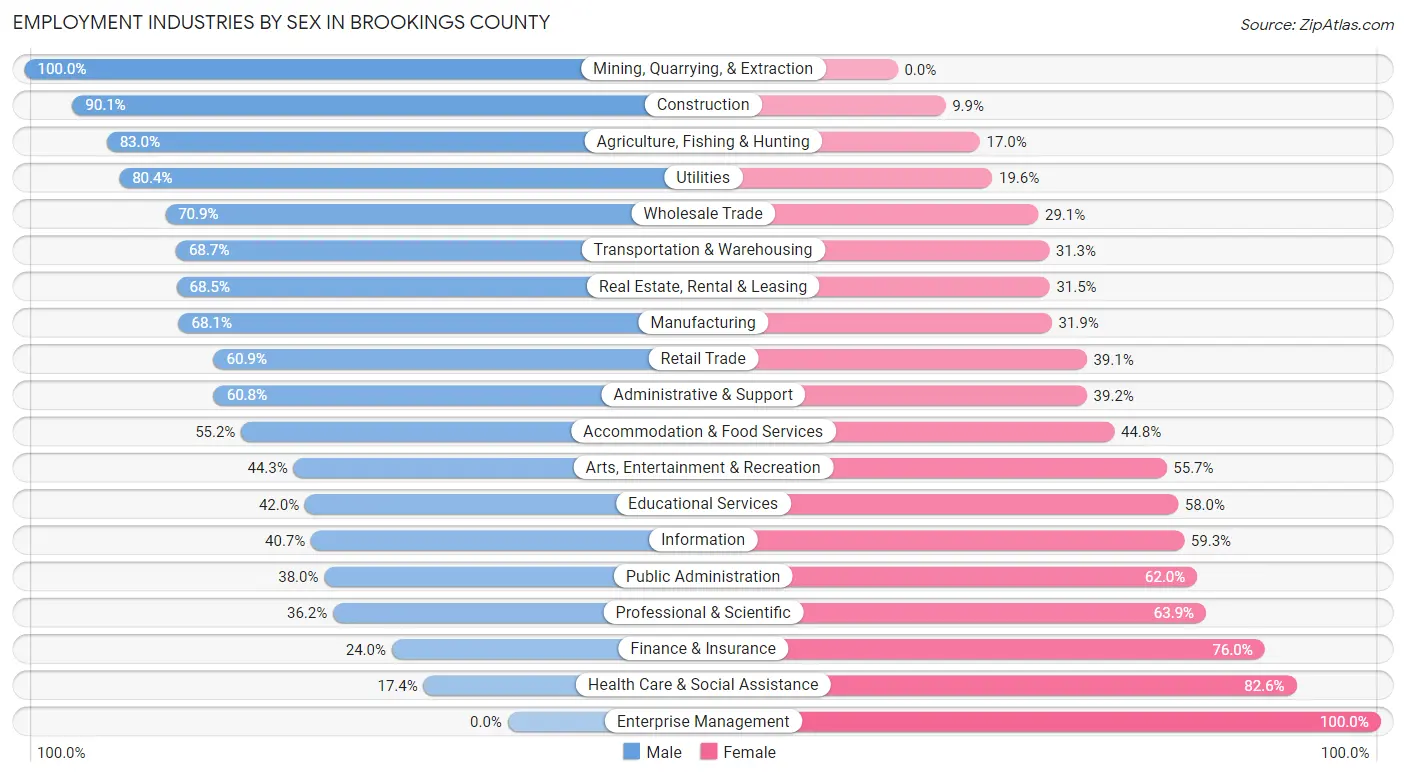
| Industry | Male | Female |
| Agriculture, Fishing & Hunting | 1,103 (83.0%) | 226 (17.0%) |
| Mining, Quarrying, & Extraction | 41 (100.0%) | 0 (0.0%) |
| Construction | 710 (90.1%) | 78 (9.9%) |
| Manufacturing | 2,668 (68.1%) | 1,250 (31.9%) |
| Wholesale Trade | 151 (70.9%) | 62 (29.1%) |
| Retail Trade | 1,235 (60.9%) | 794 (39.1%) |
| Transportation & Warehousing | 298 (68.7%) | 136 (31.3%) |
| Utilities | 119 (80.4%) | 29 (19.6%) |
| Information | 116 (40.7%) | 169 (59.3%) |
| Finance & Insurance | 168 (24.0%) | 532 (76.0%) |
| Real Estate, Rental & Leasing | 135 (68.5%) | 62 (31.5%) |
| Professional & Scientific | 406 (36.1%) | 717 (63.8%) |
| Enterprise Management | 0 (0.0%) | 33 (100.0%) |
| Administrative & Support | 205 (60.8%) | 132 (39.2%) |
| Educational Services | 1,427 (42.0%) | 1,974 (58.0%) |
| Health Care & Social Assistance | 317 (17.4%) | 1,503 (82.6%) |
| Arts, Entertainment & Recreation | 94 (44.3%) | 118 (55.7%) |
| Accommodation & Food Services | 720 (55.2%) | 585 (44.8%) |
| Public Administration | 150 (38.0%) | 245 (62.0%) |
| Total | 10,262 (53.5%) | 8,906 (46.5%) |
Education in Brookings County
School Enrollment in Brookings County
The most common levels of schooling among the 12,840 students in Brookings County are college / undergraduate (6,758 | 52.6%), elementary school (1,656 | 12.9%), and high school (1,309 | 10.2%).
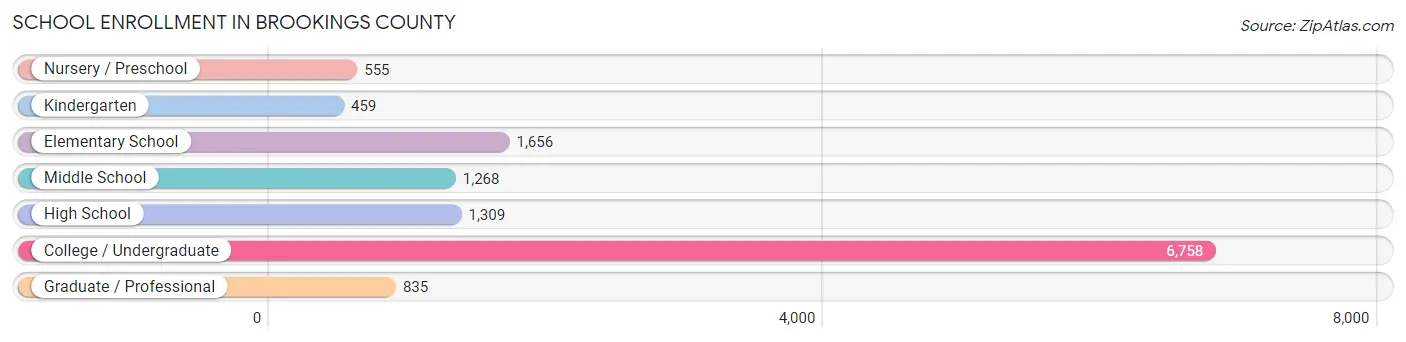
| School Level | # Students | % Students |
| Nursery / Preschool | 555 | 4.3% |
| Kindergarten | 459 | 3.6% |
| Elementary School | 1,656 | 12.9% |
| Middle School | 1,268 | 9.9% |
| High School | 1,309 | 10.2% |
| College / Undergraduate | 6,758 | 52.6% |
| Graduate / Professional | 835 | 6.5% |
| Total | 12,840 | 100.0% |
School Enrollment by Age by Funding Source in Brookings County
Out of a total of 12,840 students who are enrolled in schools in Brookings County, 847 (6.6%) attend a private institution, while the remaining 11,993 (93.4%) are enrolled in public schools. The age group of 3 to 4 year olds has the highest likelihood of being enrolled in private schools, with 101 (40.2% in the age bracket) enrolled. Conversely, the age group of 18 to 19 year olds has the lowest likelihood of being enrolled in a private school, with 2,599 (99.9% in the age bracket) attending a public institution.
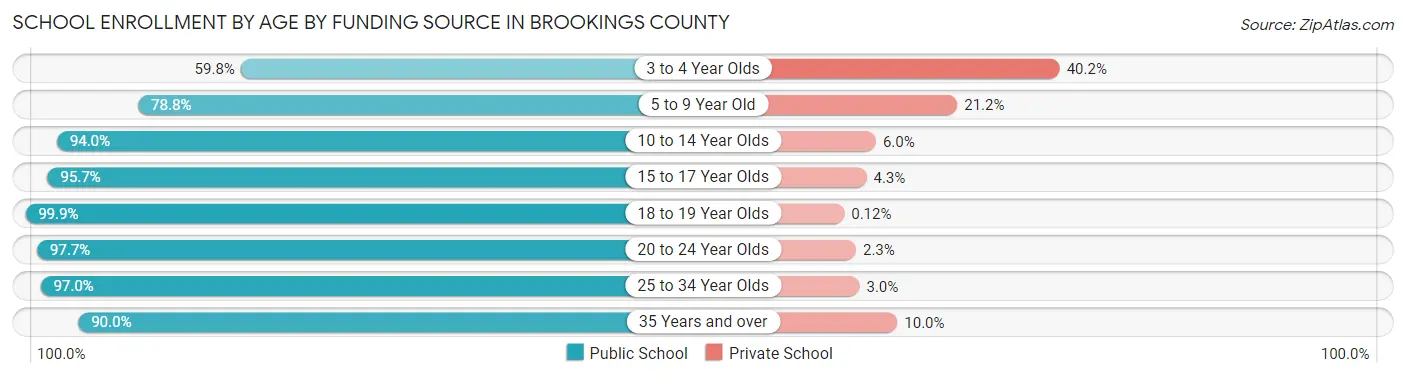
| Age Bracket | Public School | Private School |
| 3 to 4 Year Olds | 150 (59.8%) | 101 (40.2%) |
| 5 to 9 Year Old | 1,665 (78.8%) | 447 (21.2%) |
| 10 to 14 Year Olds | 1,529 (94.0%) | 98 (6.0%) |
| 15 to 17 Year Olds | 1,100 (95.7%) | 49 (4.3%) |
| 18 to 19 Year Olds | 2,599 (99.9%) | 3 (0.1%) |
| 20 to 24 Year Olds | 3,909 (97.7%) | 92 (2.3%) |
| 25 to 34 Year Olds | 755 (97.0%) | 23 (3.0%) |
| 35 Years and over | 288 (90.0%) | 32 (10.0%) |
| Total | 11,993 (93.4%) | 847 (6.6%) |
Educational Attainment by Field of Study in Brookings County
Education (1,474 | 17.2%), business (1,142 | 13.3%), bio, nature & agricultural (1,072 | 12.5%), science & technology (884 | 10.3%), and engineering (828 | 9.7%) are the most common fields of study among 8,559 individuals in Brookings County who have obtained a bachelor's degree or higher.
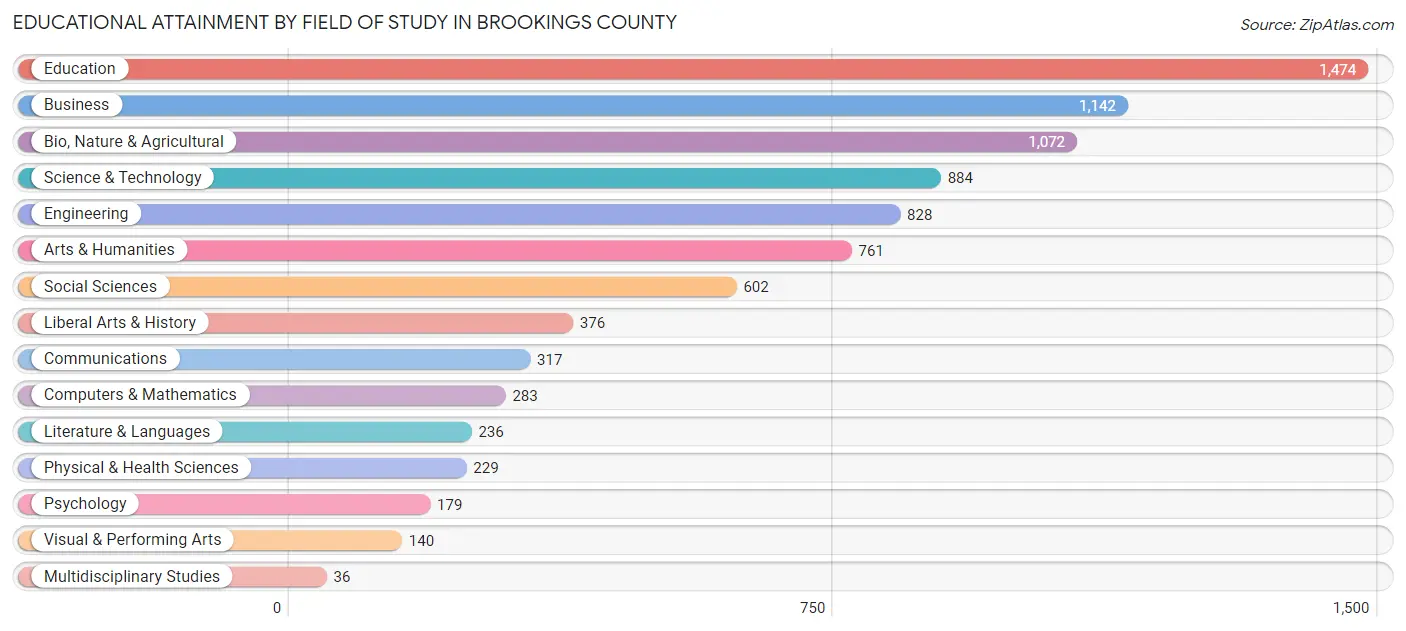
| Field of Study | # Graduates | % Graduates |
| Computers & Mathematics | 283 | 3.3% |
| Bio, Nature & Agricultural | 1,072 | 12.5% |
| Physical & Health Sciences | 229 | 2.7% |
| Psychology | 179 | 2.1% |
| Social Sciences | 602 | 7.0% |
| Engineering | 828 | 9.7% |
| Multidisciplinary Studies | 36 | 0.4% |
| Science & Technology | 884 | 10.3% |
| Business | 1,142 | 13.3% |
| Education | 1,474 | 17.2% |
| Literature & Languages | 236 | 2.8% |
| Liberal Arts & History | 376 | 4.4% |
| Visual & Performing Arts | 140 | 1.6% |
| Communications | 317 | 3.7% |
| Arts & Humanities | 761 | 8.9% |
| Total | 8,559 | 100.0% |
Transportation & Commute in Brookings County
Vehicle Availability by Sex in Brookings County
The most prevalent vehicle ownership categories in Brookings County are males with 2 vehicles (3,422, accounting for 35.5%) and females with 2 vehicles (2,787, making up 43.1%).
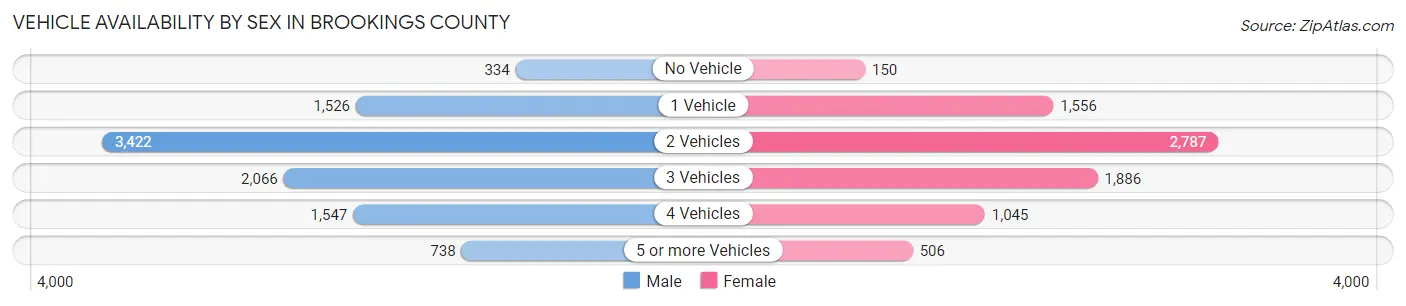
| Vehicles Available | Male | Female |
| No Vehicle | 334 (3.5%) | 150 (1.9%) |
| 1 Vehicle | 1,526 (15.8%) | 1,556 (19.6%) |
| 2 Vehicles | 3,422 (35.5%) | 2,787 (35.1%) |
| 3 Vehicles | 2,066 (21.4%) | 1,886 (23.8%) |
| 4 Vehicles | 1,547 (16.1%) | 1,045 (13.2%) |
| 5 or more Vehicles | 738 (7.7%) | 506 (6.4%) |
| Total | 9,633 (100.0%) | 7,930 (100.0%) |
Commute Time in Brookings County
The most frequently occuring commute durations in Brookings County are 10 to 14 minutes (4,748 commuters, 28.0%), 5 to 9 minutes (4,731 commuters, 27.9%), and 15 to 19 minutes (2,426 commuters, 14.3%).
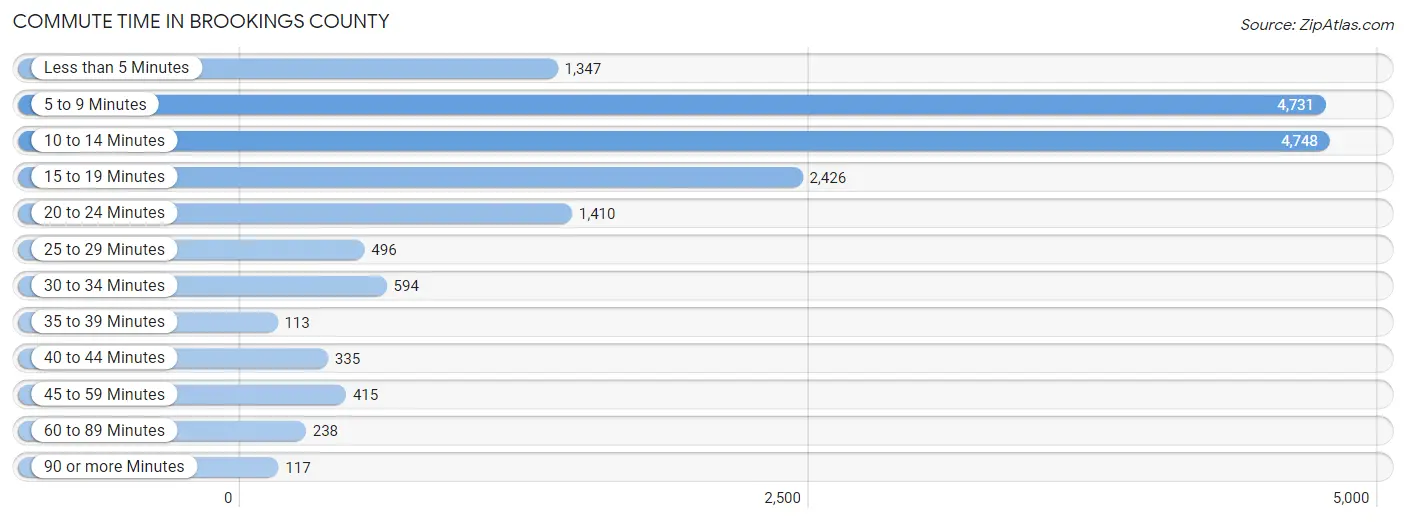
| Commute Time | # Commuters | % Commuters |
| Less than 5 Minutes | 1,347 | 7.9% |
| 5 to 9 Minutes | 4,731 | 27.9% |
| 10 to 14 Minutes | 4,748 | 28.0% |
| 15 to 19 Minutes | 2,426 | 14.3% |
| 20 to 24 Minutes | 1,410 | 8.3% |
| 25 to 29 Minutes | 496 | 2.9% |
| 30 to 34 Minutes | 594 | 3.5% |
| 35 to 39 Minutes | 113 | 0.7% |
| 40 to 44 Minutes | 335 | 2.0% |
| 45 to 59 Minutes | 415 | 2.5% |
| 60 to 89 Minutes | 238 | 1.4% |
| 90 or more Minutes | 117 | 0.7% |
Commute Time by Sex in Brookings County
The most common commute times in Brookings County are 10 to 14 minutes (2,563 commuters, 28.0%) for males and 5 to 9 minutes (2,448 commuters, 31.4%) for females.
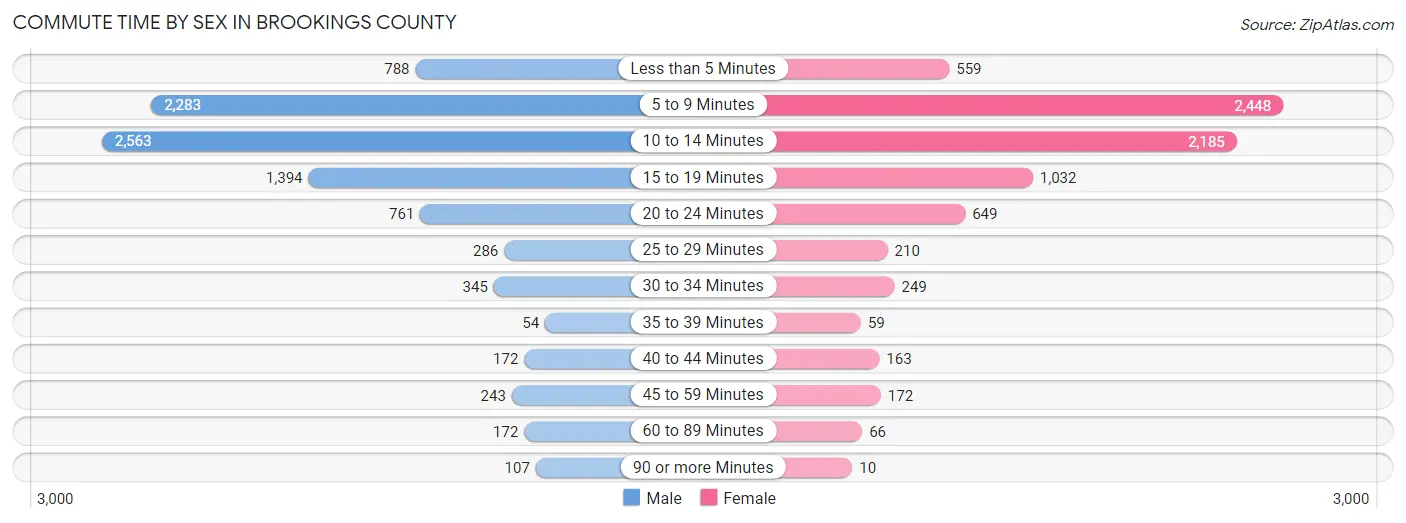
| Commute Time | Male | Female |
| Less than 5 Minutes | 788 (8.6%) | 559 (7.2%) |
| 5 to 9 Minutes | 2,283 (24.9%) | 2,448 (31.4%) |
| 10 to 14 Minutes | 2,563 (28.0%) | 2,185 (28.0%) |
| 15 to 19 Minutes | 1,394 (15.2%) | 1,032 (13.2%) |
| 20 to 24 Minutes | 761 (8.3%) | 649 (8.3%) |
| 25 to 29 Minutes | 286 (3.1%) | 210 (2.7%) |
| 30 to 34 Minutes | 345 (3.8%) | 249 (3.2%) |
| 35 to 39 Minutes | 54 (0.6%) | 59 (0.8%) |
| 40 to 44 Minutes | 172 (1.9%) | 163 (2.1%) |
| 45 to 59 Minutes | 243 (2.6%) | 172 (2.2%) |
| 60 to 89 Minutes | 172 (1.9%) | 66 (0.9%) |
| 90 or more Minutes | 107 (1.2%) | 10 (0.1%) |
Time of Departure to Work by Sex in Brookings County
The most frequent times of departure to work in Brookings County are 7:30 AM to 7:59 AM (1,727, 18.8%) for males and 7:30 AM to 7:59 AM (2,124, 27.2%) for females.
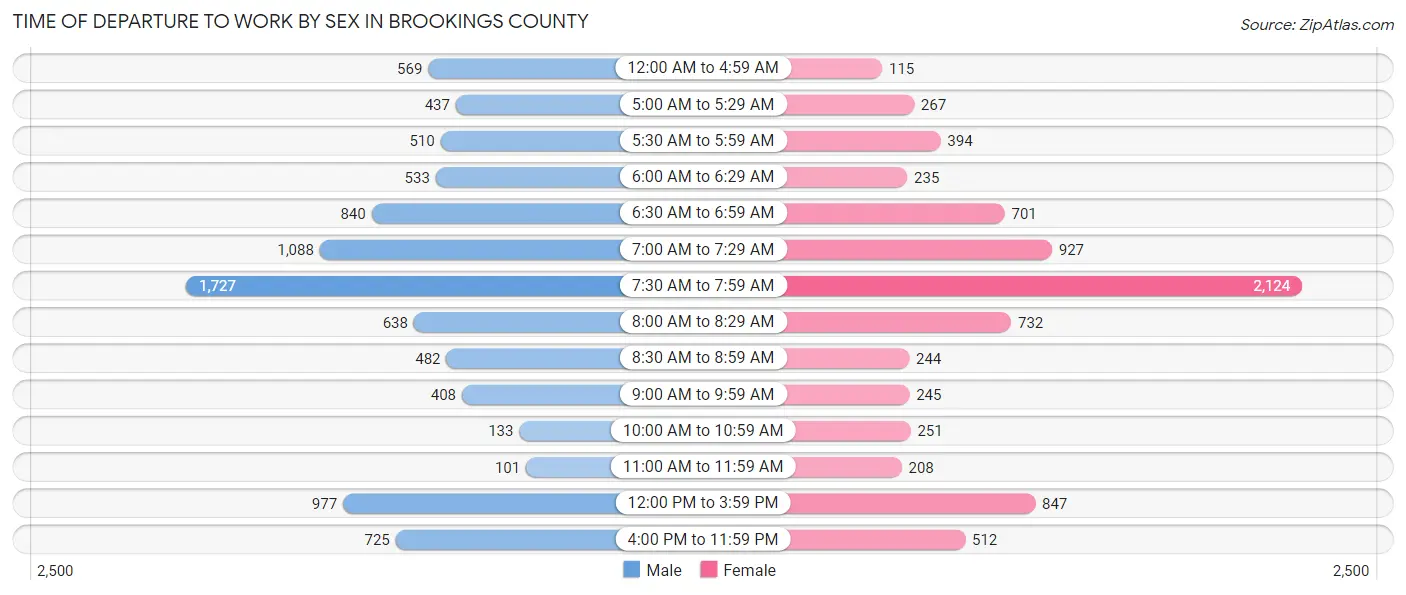
| Time of Departure | Male | Female |
| 12:00 AM to 4:59 AM | 569 (6.2%) | 115 (1.5%) |
| 5:00 AM to 5:29 AM | 437 (4.8%) | 267 (3.4%) |
| 5:30 AM to 5:59 AM | 510 (5.6%) | 394 (5.1%) |
| 6:00 AM to 6:29 AM | 533 (5.8%) | 235 (3.0%) |
| 6:30 AM to 6:59 AM | 840 (9.2%) | 701 (9.0%) |
| 7:00 AM to 7:29 AM | 1,088 (11.9%) | 927 (11.9%) |
| 7:30 AM to 7:59 AM | 1,727 (18.8%) | 2,124 (27.2%) |
| 8:00 AM to 8:29 AM | 638 (7.0%) | 732 (9.4%) |
| 8:30 AM to 8:59 AM | 482 (5.3%) | 244 (3.1%) |
| 9:00 AM to 9:59 AM | 408 (4.4%) | 245 (3.1%) |
| 10:00 AM to 10:59 AM | 133 (1.5%) | 251 (3.2%) |
| 11:00 AM to 11:59 AM | 101 (1.1%) | 208 (2.7%) |
| 12:00 PM to 3:59 PM | 977 (10.7%) | 847 (10.9%) |
| 4:00 PM to 11:59 PM | 725 (7.9%) | 512 (6.6%) |
| Total | 9,168 (100.0%) | 7,802 (100.0%) |
Housing Occupancy in Brookings County
Occupancy by Ownership in Brookings County
Of the total 13,366 dwellings in Brookings County, owner-occupied units account for 7,797 (58.3%), while renter-occupied units make up 5,569 (41.7%).
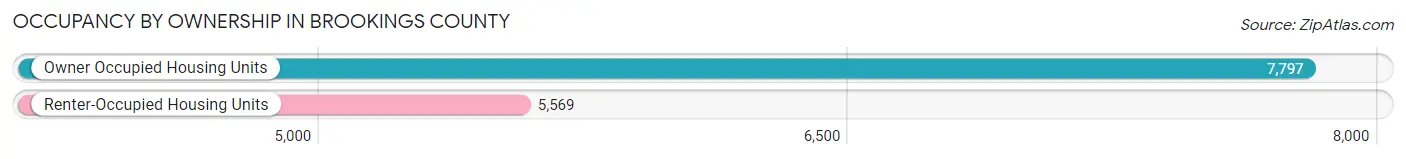
| Occupancy | # Housing Units | % Housing Units |
| Owner Occupied Housing Units | 7,797 | 58.3% |
| Renter-Occupied Housing Units | 5,569 | 41.7% |
| Total Occupied Housing Units | 13,366 | 100.0% |
Occupancy by Household Size in Brookings County
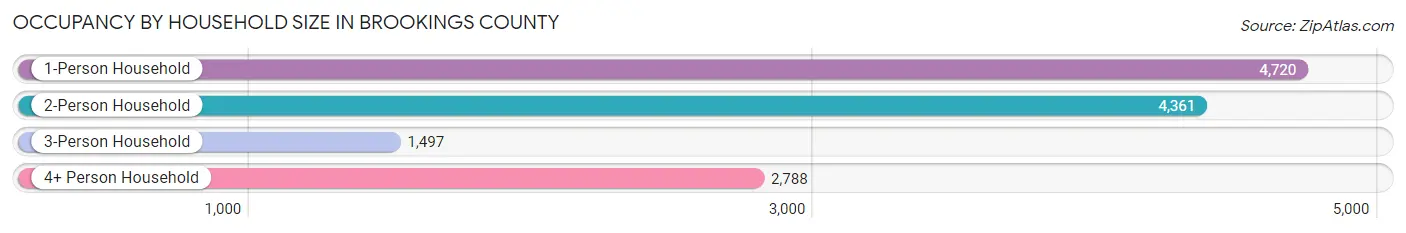
| Household Size | # Housing Units | % Housing Units |
| 1-Person Household | 4,720 | 35.3% |
| 2-Person Household | 4,361 | 32.6% |
| 3-Person Household | 1,497 | 11.2% |
| 4+ Person Household | 2,788 | 20.9% |
| Total Housing Units | 13,366 | 100.0% |
Occupancy by Ownership by Household Size in Brookings County
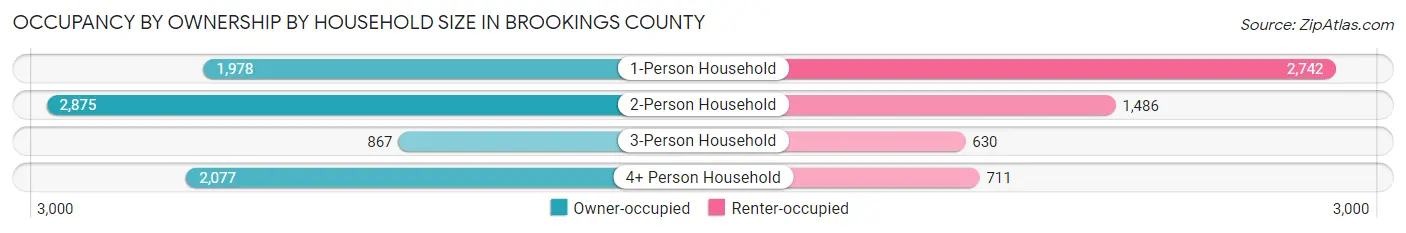
| Household Size | Owner-occupied | Renter-occupied |
| 1-Person Household | 1,978 (41.9%) | 2,742 (58.1%) |
| 2-Person Household | 2,875 (65.9%) | 1,486 (34.1%) |
| 3-Person Household | 867 (57.9%) | 630 (42.1%) |
| 4+ Person Household | 2,077 (74.5%) | 711 (25.5%) |
| Total Housing Units | 7,797 (58.3%) | 5,569 (41.7%) |
Occupancy by Educational Attainment in Brookings County
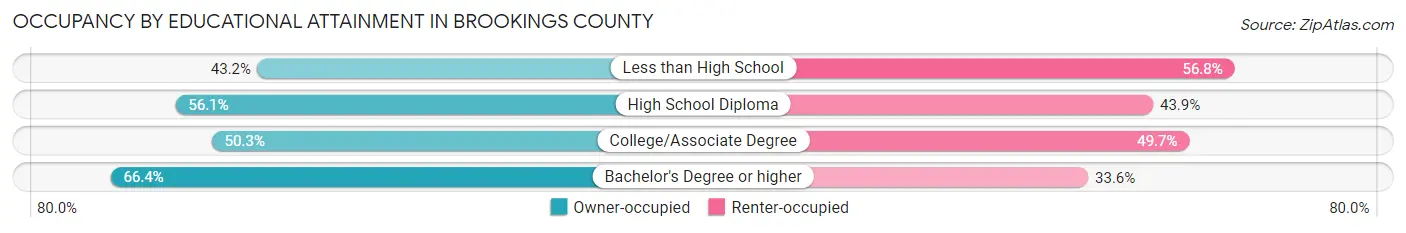
| Household Size | Owner-occupied | Renter-occupied |
| Less than High School | 186 (43.2%) | 245 (56.8%) |
| High School Diploma | 1,452 (56.1%) | 1,137 (43.9%) |
| College/Associate Degree | 2,224 (50.3%) | 2,194 (49.7%) |
| Bachelor's Degree or higher | 3,935 (66.4%) | 1,993 (33.6%) |
Occupancy by Age of Householder in Brookings County
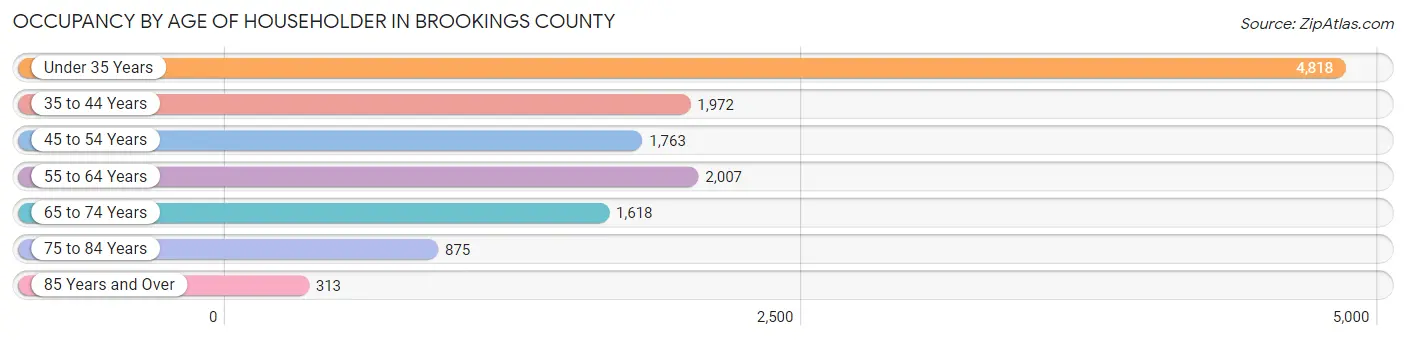
| Age Bracket | # Households | % Households |
| Under 35 Years | 4,818 | 36.0% |
| 35 to 44 Years | 1,972 | 14.7% |
| 45 to 54 Years | 1,763 | 13.2% |
| 55 to 64 Years | 2,007 | 15.0% |
| 65 to 74 Years | 1,618 | 12.1% |
| 75 to 84 Years | 875 | 6.6% |
| 85 Years and Over | 313 | 2.3% |
| Total | 13,366 | 100.0% |
Housing Finances in Brookings County
Median Income by Occupancy in Brookings County
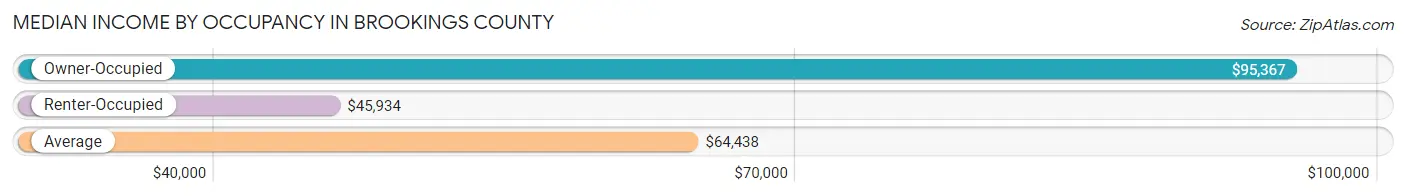
| Occupancy Type | # Households | Median Income |
| Owner-Occupied | 7,797 (58.3%) | $95,367 |
| Renter-Occupied | 5,569 (41.7%) | $45,934 |
| Average | 13,366 (100.0%) | $64,438 |
Occupancy by Householder Income Bracket in Brookings County
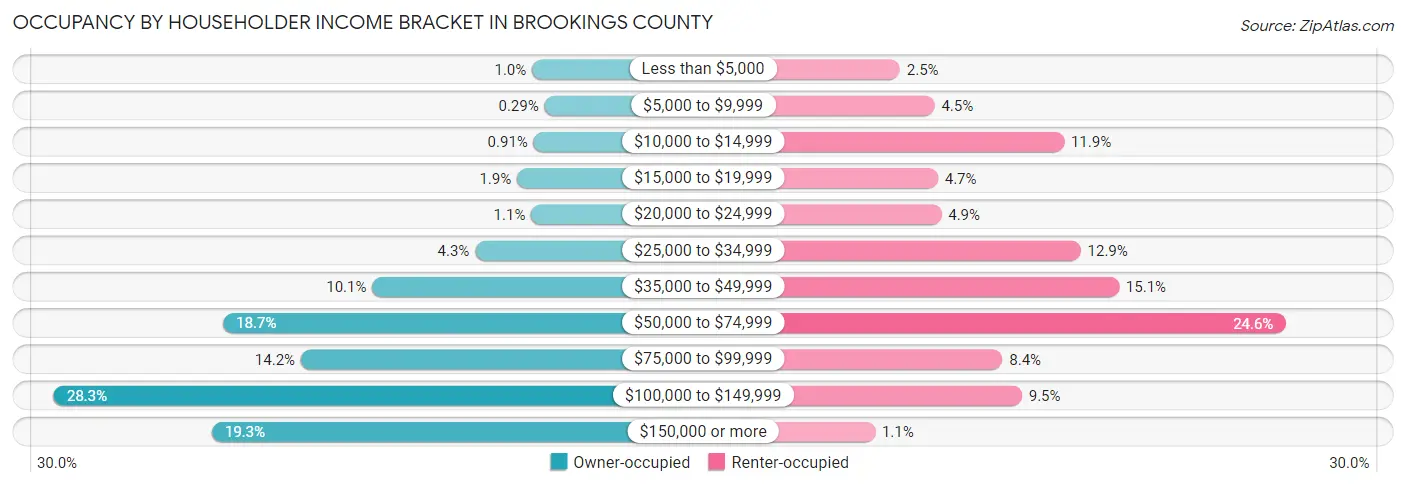
| Income Bracket | Owner-occupied | Renter-occupied |
| Less than $5,000 | 78 (1.0%) | 141 (2.5%) |
| $5,000 to $9,999 | 23 (0.3%) | 251 (4.5%) |
| $10,000 to $14,999 | 71 (0.9%) | 663 (11.9%) |
| $15,000 to $19,999 | 145 (1.9%) | 262 (4.7%) |
| $20,000 to $24,999 | 82 (1.1%) | 273 (4.9%) |
| $25,000 to $34,999 | 331 (4.3%) | 716 (12.9%) |
| $35,000 to $49,999 | 790 (10.1%) | 838 (15.0%) |
| $50,000 to $74,999 | 1,455 (18.7%) | 1,367 (24.5%) |
| $75,000 to $99,999 | 1,108 (14.2%) | 467 (8.4%) |
| $100,000 to $149,999 | 2,209 (28.3%) | 529 (9.5%) |
| $150,000 or more | 1,505 (19.3%) | 62 (1.1%) |
| Total | 7,797 (100.0%) | 5,569 (100.0%) |
Monthly Housing Cost Tiers in Brookings County
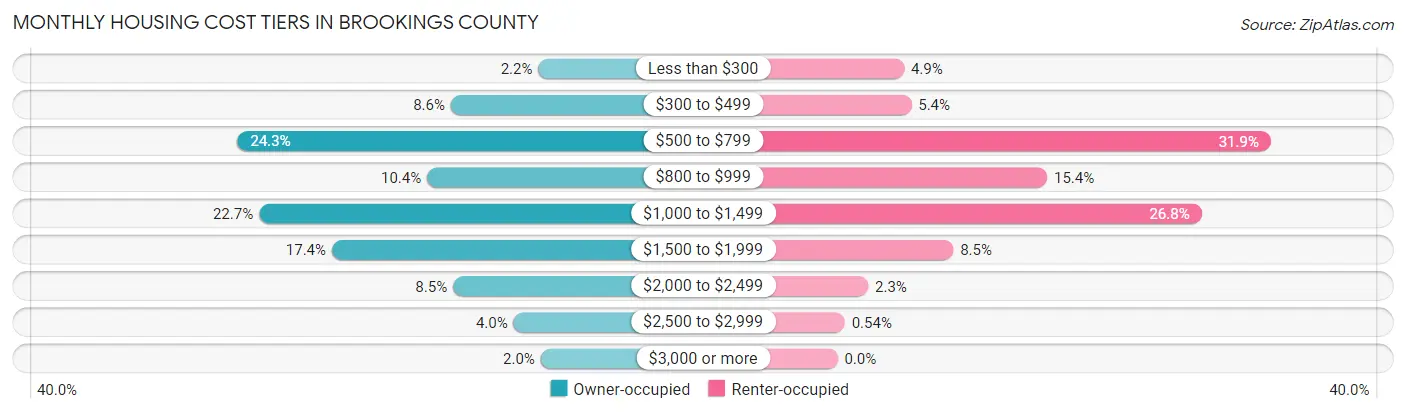
| Monthly Cost | Owner-occupied | Renter-occupied |
| Less than $300 | 169 (2.2%) | 273 (4.9%) |
| $300 to $499 | 671 (8.6%) | 303 (5.4%) |
| $500 to $799 | 1,897 (24.3%) | 1,777 (31.9%) |
| $800 to $999 | 808 (10.4%) | 860 (15.4%) |
| $1,000 to $1,499 | 1,773 (22.7%) | 1,493 (26.8%) |
| $1,500 to $1,999 | 1,354 (17.4%) | 475 (8.5%) |
| $2,000 to $2,499 | 659 (8.5%) | 126 (2.3%) |
| $2,500 to $2,999 | 311 (4.0%) | 30 (0.5%) |
| $3,000 or more | 155 (2.0%) | 0 (0.0%) |
| Total | 7,797 (100.0%) | 5,569 (100.0%) |
Physical Housing Characteristics in Brookings County
Housing Structures in Brookings County
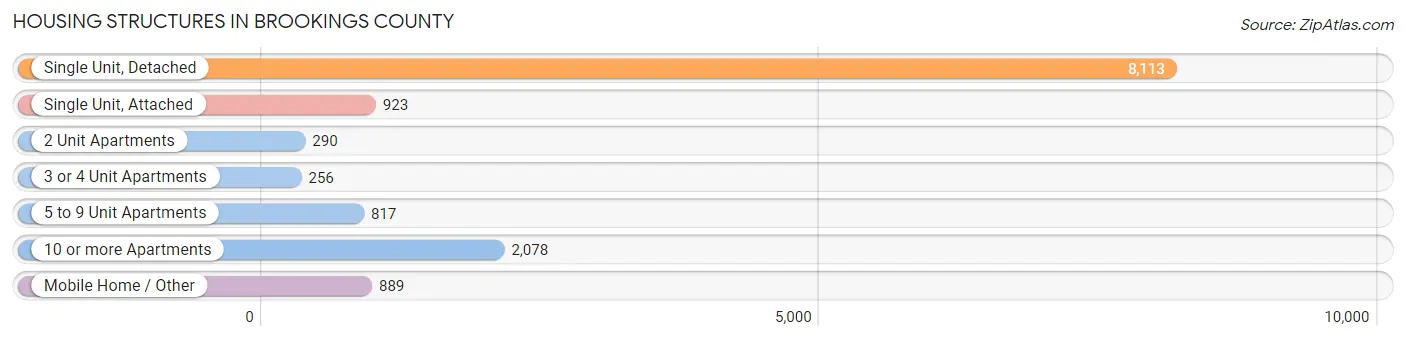
| Structure Type | # Housing Units | % Housing Units |
| Single Unit, Detached | 8,113 | 60.7% |
| Single Unit, Attached | 923 | 6.9% |
| 2 Unit Apartments | 290 | 2.2% |
| 3 or 4 Unit Apartments | 256 | 1.9% |
| 5 to 9 Unit Apartments | 817 | 6.1% |
| 10 or more Apartments | 2,078 | 15.5% |
| Mobile Home / Other | 889 | 6.7% |
| Total | 13,366 | 100.0% |
Housing Structures by Occupancy in Brookings County
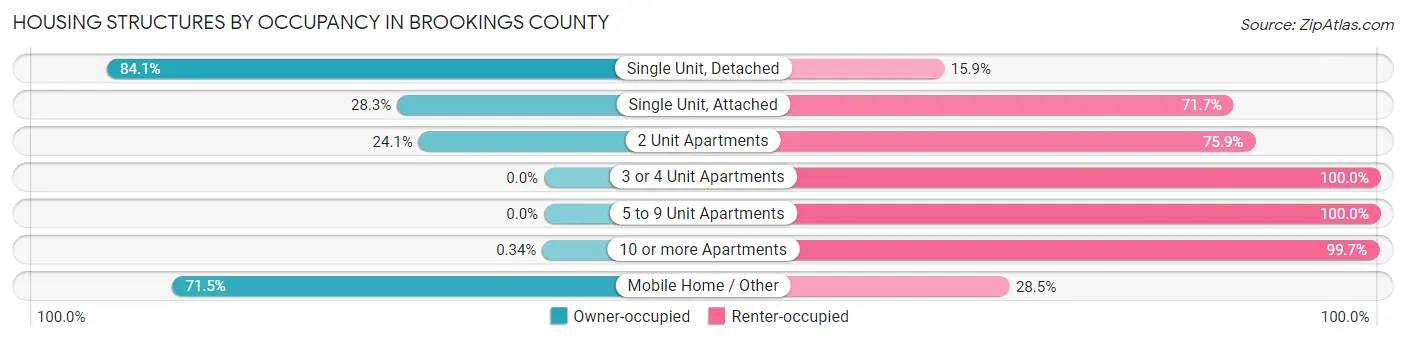
| Structure Type | Owner-occupied | Renter-occupied |
| Single Unit, Detached | 6,823 (84.1%) | 1,290 (15.9%) |
| Single Unit, Attached | 261 (28.3%) | 662 (71.7%) |
| 2 Unit Apartments | 70 (24.1%) | 220 (75.9%) |
| 3 or 4 Unit Apartments | 0 (0.0%) | 256 (100.0%) |
| 5 to 9 Unit Apartments | 0 (0.0%) | 817 (100.0%) |
| 10 or more Apartments | 7 (0.3%) | 2,071 (99.7%) |
| Mobile Home / Other | 636 (71.5%) | 253 (28.5%) |
| Total | 7,797 (58.3%) | 5,569 (41.7%) |
Housing Structures by Number of Rooms in Brookings County
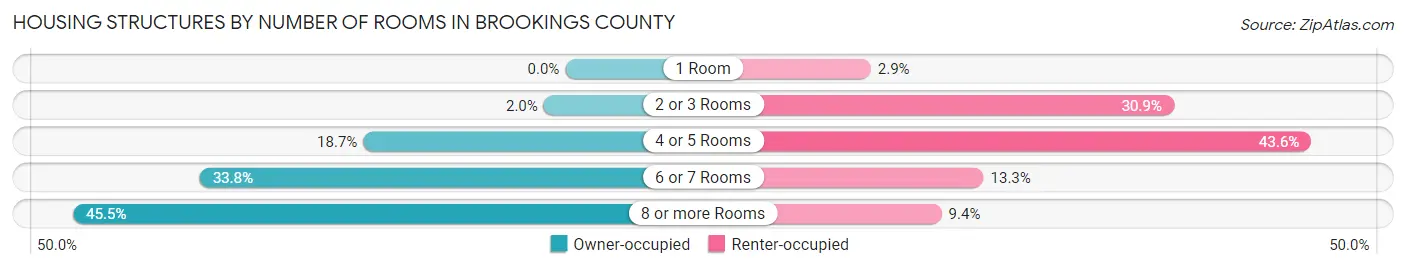
| Number of Rooms | Owner-occupied | Renter-occupied |
| 1 Room | 0 (0.0%) | 159 (2.9%) |
| 2 or 3 Rooms | 156 (2.0%) | 1,719 (30.9%) |
| 4 or 5 Rooms | 1,457 (18.7%) | 2,427 (43.6%) |
| 6 or 7 Rooms | 2,635 (33.8%) | 740 (13.3%) |
| 8 or more Rooms | 3,549 (45.5%) | 524 (9.4%) |
| Total | 7,797 (100.0%) | 5,569 (100.0%) |
Housing Structure by Heating Type in Brookings County
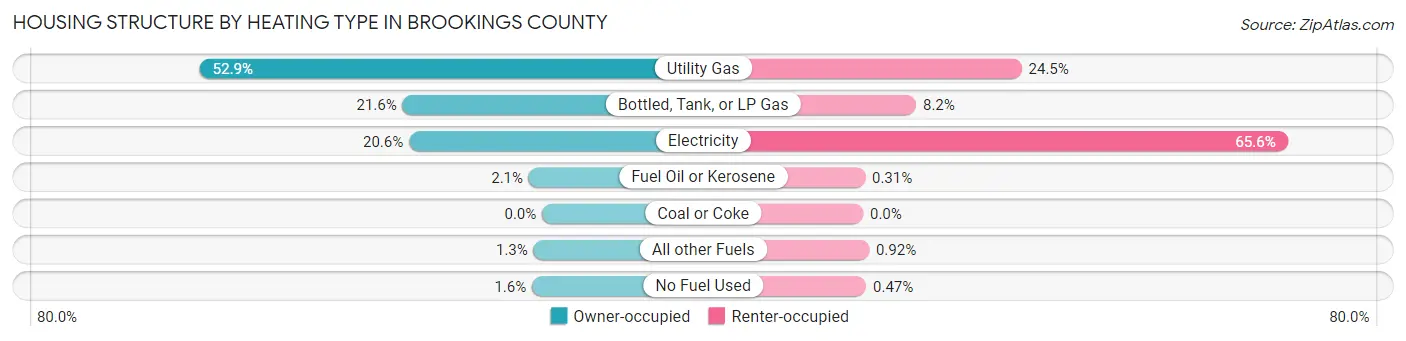
| Heating Type | Owner-occupied | Renter-occupied |
| Utility Gas | 4,127 (52.9%) | 1,365 (24.5%) |
| Bottled, Tank, or LP Gas | 1,682 (21.6%) | 456 (8.2%) |
| Electricity | 1,604 (20.6%) | 3,654 (65.6%) |
| Fuel Oil or Kerosene | 160 (2.1%) | 17 (0.3%) |
| Coal or Coke | 0 (0.0%) | 0 (0.0%) |
| All other Fuels | 102 (1.3%) | 51 (0.9%) |
| No Fuel Used | 122 (1.6%) | 26 (0.5%) |
| Total | 7,797 (100.0%) | 5,569 (100.0%) |
Household Vehicle Usage in Brookings County
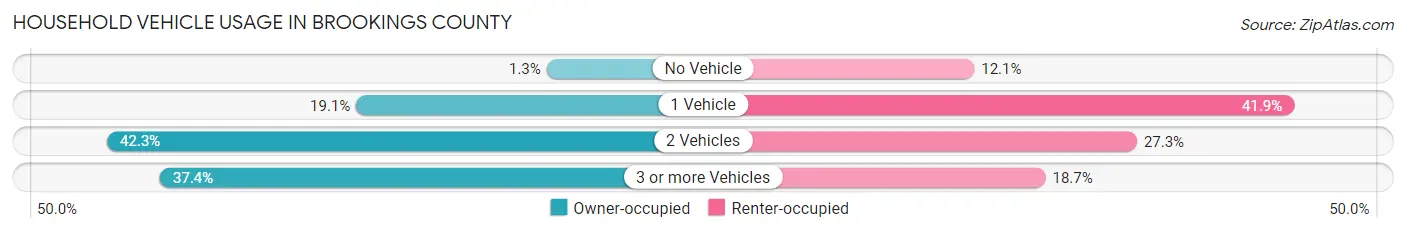
| Vehicles per Household | Owner-occupied | Renter-occupied |
| No Vehicle | 99 (1.3%) | 673 (12.1%) |
| 1 Vehicle | 1,485 (19.1%) | 2,335 (41.9%) |
| 2 Vehicles | 3,299 (42.3%) | 1,518 (27.3%) |
| 3 or more Vehicles | 2,914 (37.4%) | 1,043 (18.7%) |
| Total | 7,797 (100.0%) | 5,569 (100.0%) |
Real Estate & Mortgages in Brookings County
Real Estate and Mortgage Overview in Brookings County
| Characteristic | Without Mortgage | With Mortgage |
| Housing Units | 3,289 | 4,508 |
| Median Property Value | $220,900 | $232,500 |
| Median Household Income | $80,071 | $864 |
| Monthly Housing Costs | $641 | $155 |
| Real Estate Taxes | $2,599 | $79 |
Property Value by Mortgage Status in Brookings County
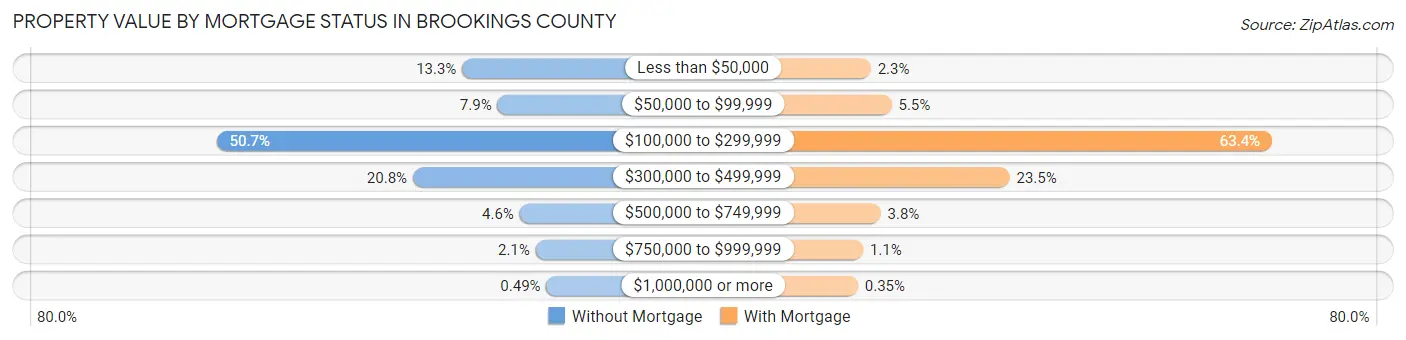
| Property Value | Without Mortgage | With Mortgage |
| Less than $50,000 | 438 (13.3%) | 104 (2.3%) |
| $50,000 to $99,999 | 261 (7.9%) | 247 (5.5%) |
| $100,000 to $299,999 | 1,669 (50.7%) | 2,860 (63.4%) |
| $300,000 to $499,999 | 685 (20.8%) | 1,058 (23.5%) |
| $500,000 to $749,999 | 150 (4.6%) | 172 (3.8%) |
| $750,000 to $999,999 | 70 (2.1%) | 51 (1.1%) |
| $1,000,000 or more | 16 (0.5%) | 16 (0.4%) |
| Total | 3,289 (100.0%) | 4,508 (100.0%) |
Household Income by Mortgage Status in Brookings County
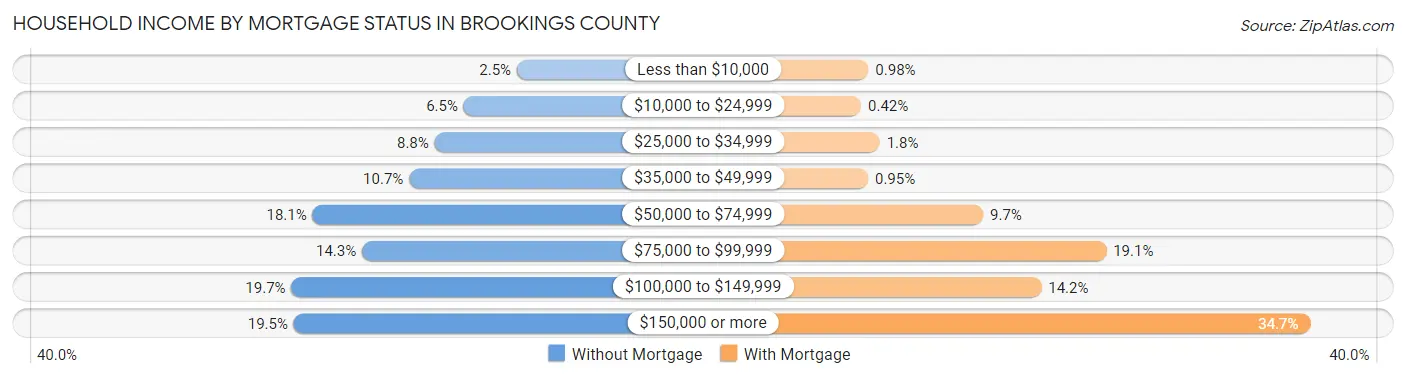
| Household Income | Without Mortgage | With Mortgage |
| Less than $10,000 | 82 (2.5%) | 44 (1.0%) |
| $10,000 to $24,999 | 215 (6.5%) | 19 (0.4%) |
| $25,000 to $34,999 | 288 (8.8%) | 83 (1.8%) |
| $35,000 to $49,999 | 352 (10.7%) | 43 (0.9%) |
| $50,000 to $74,999 | 594 (18.1%) | 438 (9.7%) |
| $75,000 to $99,999 | 470 (14.3%) | 861 (19.1%) |
| $100,000 to $149,999 | 647 (19.7%) | 638 (14.1%) |
| $150,000 or more | 641 (19.5%) | 1,562 (34.6%) |
| Total | 3,289 (100.0%) | 4,508 (100.0%) |
Property Value to Household Income Ratio in Brookings County
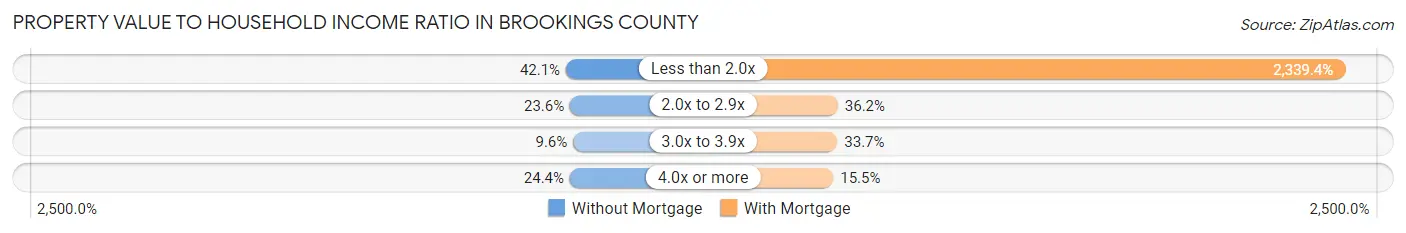
| Value-to-Income Ratio | Without Mortgage | With Mortgage |
| Less than 2.0x | 1,386 (42.1%) | 105,458 (2,339.3%) |
| 2.0x to 2.9x | 777 (23.6%) | 1,630 (36.2%) |
| 3.0x to 3.9x | 316 (9.6%) | 1,519 (33.7%) |
| 4.0x or more | 801 (24.3%) | 697 (15.5%) |
| Total | 3,289 (100.0%) | 4,508 (100.0%) |
Real Estate Taxes by Mortgage Status in Brookings County
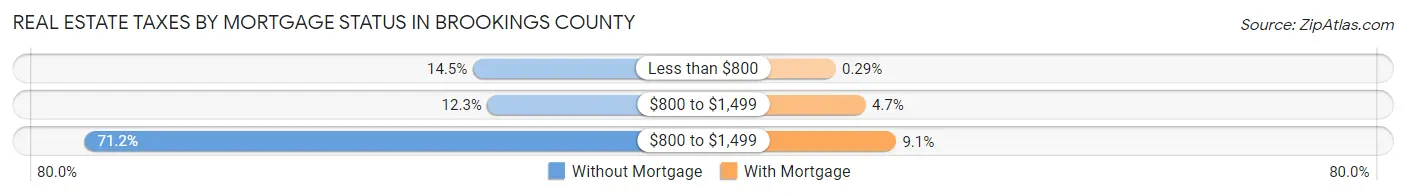
| Property Taxes | Without Mortgage | With Mortgage |
| Less than $800 | 476 (14.5%) | 13 (0.3%) |
| $800 to $1,499 | 406 (12.3%) | 210 (4.7%) |
| $800 to $1,499 | 2,343 (71.2%) | 411 (9.1%) |
| Total | 3,289 (100.0%) | 4,508 (100.0%) |
Health & Disability in Brookings County
Health Insurance Coverage by Age in Brookings County
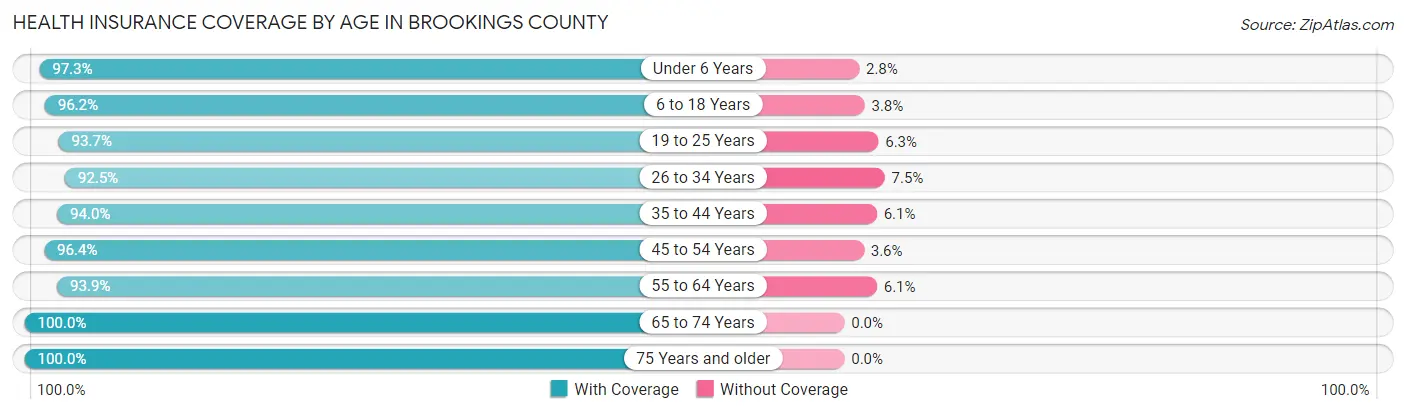
| Age Bracket | With Coverage | Without Coverage |
| Under 6 Years | 2,373 (97.3%) | 67 (2.8%) |
| 6 to 18 Years | 5,698 (96.2%) | 223 (3.8%) |
| 19 to 25 Years | 7,653 (93.7%) | 518 (6.3%) |
| 26 to 34 Years | 3,455 (92.5%) | 281 (7.5%) |
| 35 to 44 Years | 3,539 (94.0%) | 228 (6.0%) |
| 45 to 54 Years | 2,706 (96.4%) | 102 (3.6%) |
| 55 to 64 Years | 2,990 (93.9%) | 193 (6.1%) |
| 65 to 74 Years | 2,622 (100.0%) | 0 (0.0%) |
| 75 Years and older | 1,762 (100.0%) | 0 (0.0%) |
| Total | 32,798 (95.3%) | 1,612 (4.7%) |
Health Insurance Coverage by Citizenship Status in Brookings County
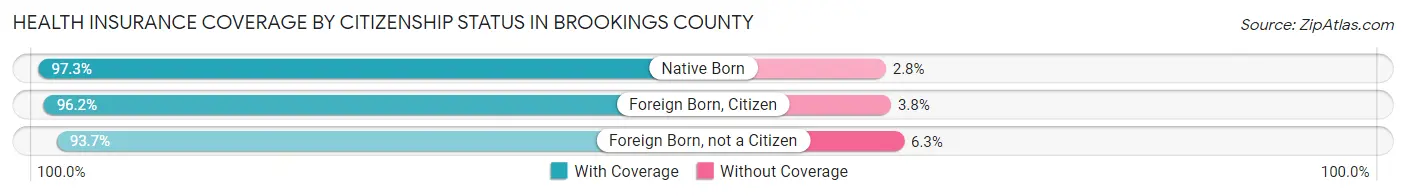
| Citizenship Status | With Coverage | Without Coverage |
| Native Born | 2,373 (97.3%) | 67 (2.8%) |
| Foreign Born, Citizen | 5,698 (96.2%) | 223 (3.8%) |
| Foreign Born, not a Citizen | 7,653 (93.7%) | 518 (6.3%) |
Health Insurance Coverage by Household Income in Brookings County
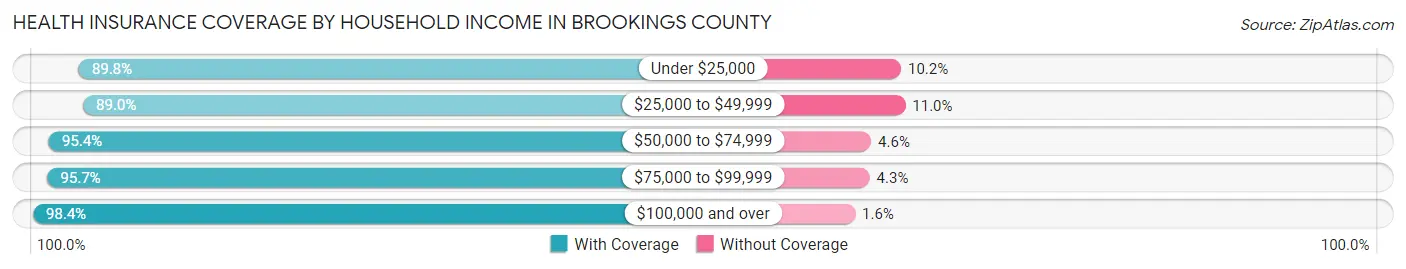
| Household Income | With Coverage | Without Coverage |
| Under $25,000 | 2,598 (89.8%) | 294 (10.2%) |
| $25,000 to $49,999 | 4,473 (89.0%) | 551 (11.0%) |
| $50,000 to $74,999 | 5,545 (95.4%) | 265 (4.6%) |
| $75,000 to $99,999 | 4,298 (95.7%) | 192 (4.3%) |
| $100,000 and over | 12,835 (98.4%) | 203 (1.6%) |
Public vs Private Health Insurance Coverage by Age in Brookings County
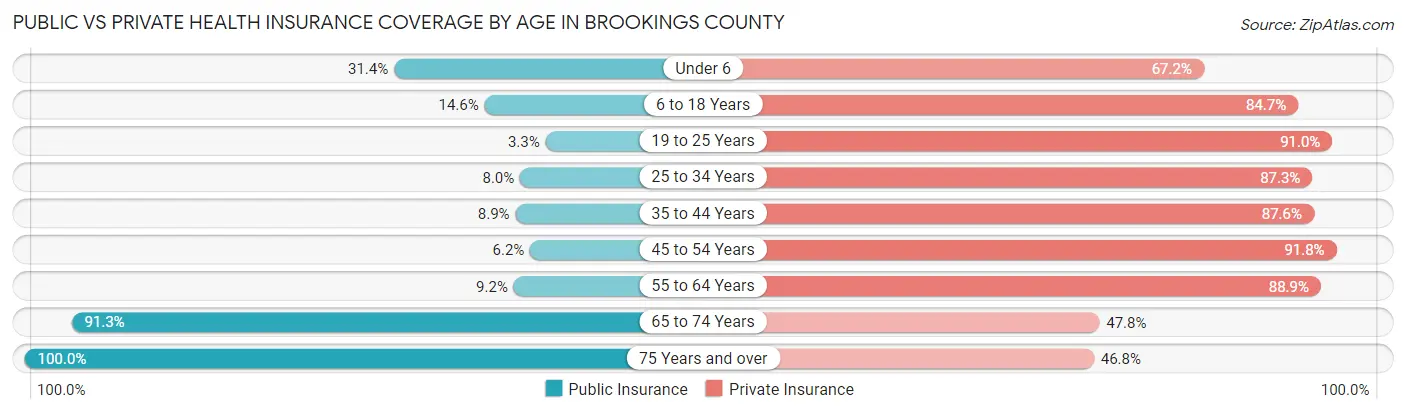
| Age Bracket | Public Insurance | Private Insurance |
| Under 6 | 767 (31.4%) | 1,639 (67.2%) |
| 6 to 18 Years | 866 (14.6%) | 5,014 (84.7%) |
| 19 to 25 Years | 270 (3.3%) | 7,437 (91.0%) |
| 25 to 34 Years | 300 (8.0%) | 3,262 (87.3%) |
| 35 to 44 Years | 335 (8.9%) | 3,300 (87.6%) |
| 45 to 54 Years | 173 (6.2%) | 2,578 (91.8%) |
| 55 to 64 Years | 293 (9.2%) | 2,830 (88.9%) |
| 65 to 74 Years | 2,394 (91.3%) | 1,253 (47.8%) |
| 75 Years and over | 1,762 (100.0%) | 824 (46.8%) |
| Total | 7,160 (20.8%) | 28,137 (81.8%) |
Disability Status by Sex by Age in Brookings County
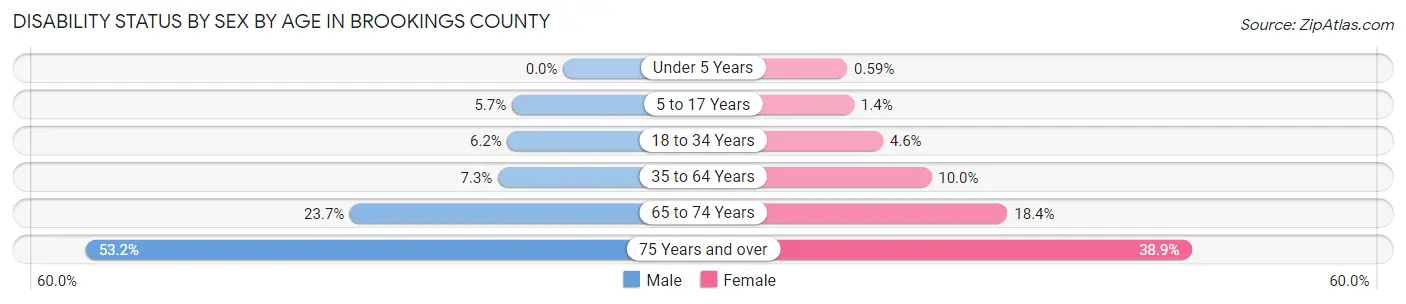
| Age Bracket | Male | Female |
| Under 5 Years | 0 (0.0%) | 6 (0.6%) |
| 5 to 17 Years | 145 (5.7%) | 35 (1.3%) |
| 18 to 34 Years | 436 (6.2%) | 280 (4.6%) |
| 35 to 64 Years | 361 (7.3%) | 477 (10.0%) |
| 65 to 74 Years | 316 (23.7%) | 238 (18.4%) |
| 75 Years and over | 400 (53.2%) | 393 (38.9%) |
Disability Class by Sex by Age in Brookings County
Disability Class: Hearing Difficulty
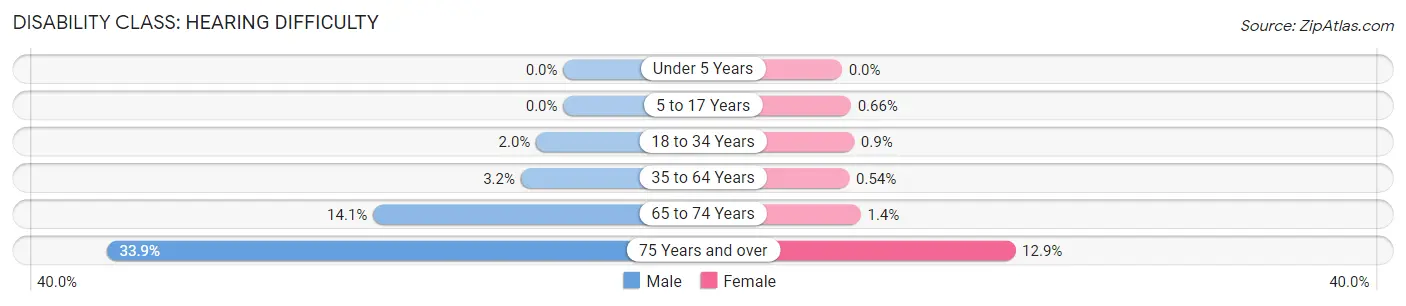
| Age Bracket | Male | Female |
| Under 5 Years | 0 (0.0%) | 0 (0.0%) |
| 5 to 17 Years | 0 (0.0%) | 17 (0.7%) |
| 18 to 34 Years | 142 (2.0%) | 55 (0.9%) |
| 35 to 64 Years | 157 (3.2%) | 26 (0.5%) |
| 65 to 74 Years | 188 (14.1%) | 18 (1.4%) |
| 75 Years and over | 255 (33.9%) | 130 (12.9%) |
Disability Class: Vision Difficulty
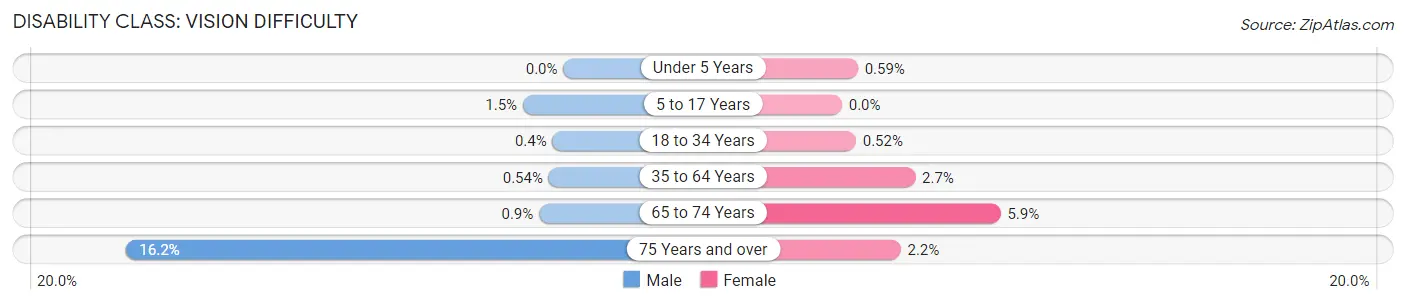
| Age Bracket | Male | Female |
| Under 5 Years | 0 (0.0%) | 6 (0.6%) |
| 5 to 17 Years | 38 (1.5%) | 0 (0.0%) |
| 18 to 34 Years | 28 (0.4%) | 32 (0.5%) |
| 35 to 64 Years | 27 (0.5%) | 130 (2.7%) |
| 65 to 74 Years | 12 (0.9%) | 76 (5.9%) |
| 75 Years and over | 122 (16.2%) | 22 (2.2%) |
Disability Class: Cognitive Difficulty
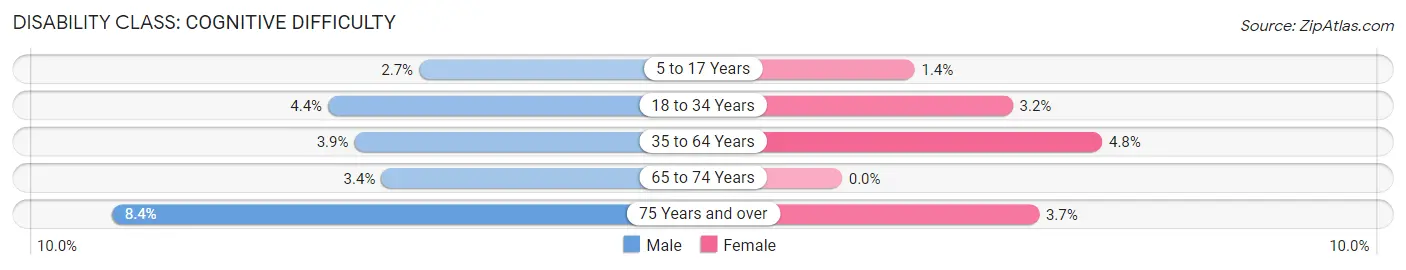
| Age Bracket | Male | Female |
| 5 to 17 Years | 68 (2.7%) | 35 (1.3%) |
| 18 to 34 Years | 307 (4.4%) | 194 (3.2%) |
| 35 to 64 Years | 193 (3.9%) | 231 (4.8%) |
| 65 to 74 Years | 45 (3.4%) | 0 (0.0%) |
| 75 Years and over | 63 (8.4%) | 37 (3.7%) |
Disability Class: Ambulatory Difficulty
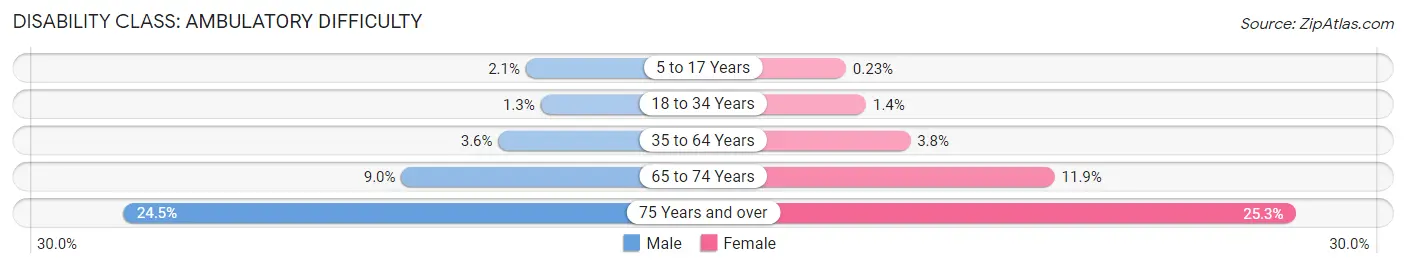
| Age Bracket | Male | Female |
| 5 to 17 Years | 53 (2.1%) | 6 (0.2%) |
| 18 to 34 Years | 89 (1.3%) | 83 (1.3%) |
| 35 to 64 Years | 180 (3.6%) | 182 (3.8%) |
| 65 to 74 Years | 120 (9.0%) | 153 (11.8%) |
| 75 Years and over | 184 (24.5%) | 255 (25.3%) |
Disability Class: Self-Care Difficulty
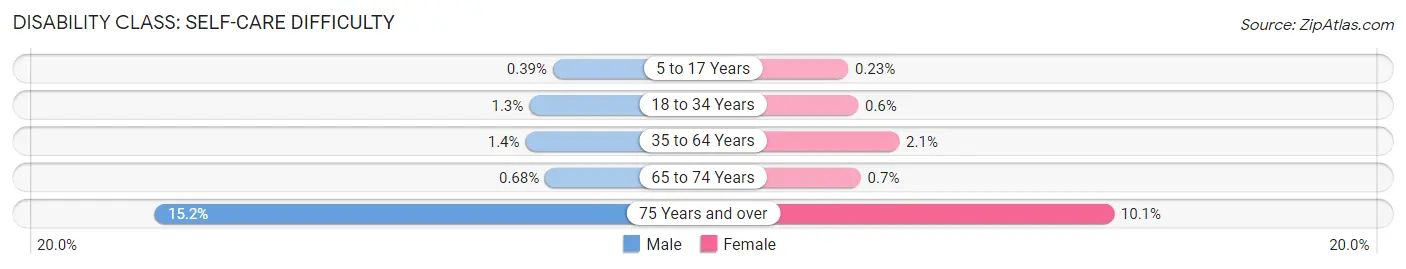
| Age Bracket | Male | Female |
| 5 to 17 Years | 10 (0.4%) | 6 (0.2%) |
| 18 to 34 Years | 89 (1.3%) | 37 (0.6%) |
| 35 to 64 Years | 70 (1.4%) | 102 (2.1%) |
| 65 to 74 Years | 9 (0.7%) | 9 (0.7%) |
| 75 Years and over | 114 (15.2%) | 102 (10.1%) |
Technology Access in Brookings County
Computing Device Access in Brookings County
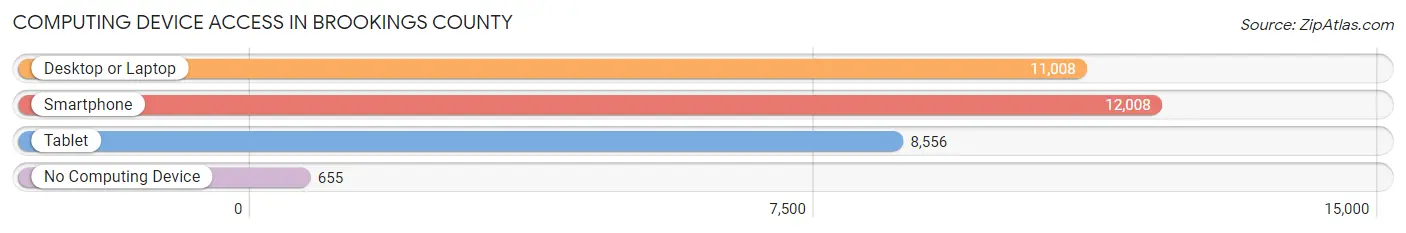
| Device Type | # Households | % Households |
| Desktop or Laptop | 11,008 | 82.4% |
| Smartphone | 12,008 | 89.8% |
| Tablet | 8,556 | 64.0% |
| No Computing Device | 655 | 4.9% |
| Total | 13,366 | 100.0% |
Internet Access in Brookings County
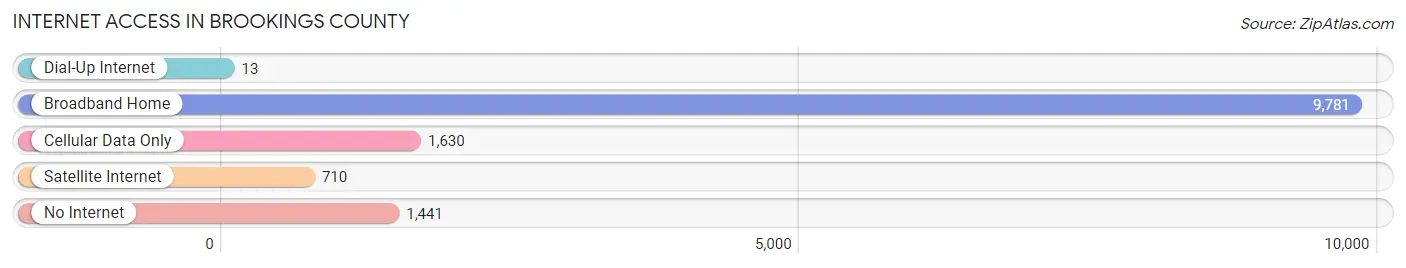
| Internet Type | # Households | % Households |
| Dial-Up Internet | 13 | 0.1% |
| Broadband Home | 9,781 | 73.2% |
| Cellular Data Only | 1,630 | 12.2% |
| Satellite Internet | 710 | 5.3% |
| No Internet | 1,441 | 10.8% |
| Total | 13,366 | 100.0% |
Brookings County Summary
Brookings County is located in the eastern part of South Dakota, and is part of the Sioux Falls Metropolitan Statistical Area. It is bordered by Moody County to the north, Deuel County to the east, Kingsbury County to the south, and Minnehaha County to the west. The county seat is Brookings, and the largest city is Volga.
History
The area that is now Brookings County was first inhabited by the Dakota Sioux. The first white settlers arrived in the area in the late 1860s, and the county was officially organized in 1871. The county was named after Wilmot Brookings, a prominent early settler.
In the late 19th century, the county was largely agricultural, with wheat, corn, and oats being the main crops. The county also had a thriving dairy industry. In the early 20th century, the county began to diversify its economy, with the establishment of several manufacturing plants.
Geography
Brookings County covers an area of 845 square miles, and is located in the eastern part of South Dakota. The county is mostly flat, with rolling hills in the western part. The county is drained by the Big Sioux River, which flows through the county from north to south.
The county is home to several lakes, including Lake Poinsett, Lake Hendricks, and Lake Thompson. The county also contains several state parks, including Big Sioux Recreation Area, Lake Thompson State Park, and Lake Poinsett State Park.
Economy
The economy of Brookings County is largely based on agriculture and manufacturing. The county is home to several large agricultural operations, including dairy farms, grain farms, and livestock farms. The county is also home to several manufacturing plants, including a John Deere plant, a 3M plant, and a Tyson Foods plant.
The county also has a thriving tourism industry, with several state parks and recreational areas. The county is also home to several golf courses, and is a popular destination for hunting and fishing.
Demographics
As of the 2010 census, the population of Brookings County was 32,845. The population is largely white (94.3%), with small percentages of African American (2.2%), Native American (1.2%), Asian (0.7%), and Hispanic (1.6%) residents.
The median household income in the county is $51,945, and the median home value is $153,400. The unemployment rate is 3.2%, and the poverty rate is 11.2%.
Conclusion
Brookings County is a rural county located in the eastern part of South Dakota. The county is largely agricultural, with a thriving dairy industry and several large grain farms. The county also has a thriving manufacturing sector, with several large plants. The county is also home to several state parks and recreational areas, and is a popular destination for hunting and fishing. The population of the county is largely white, with small percentages of African American, Native American, Asian, and Hispanic residents. The median household income in the county is $51,945, and the median home value is $153,400.
Common Questions
What is the Total Population of Brookings County?
Total Population of Brookings County is 34,631.
What is the Total Male Population of Brookings County?
Total Male Population of Brookings County is 17,743.
What is the Total Female Population of Brookings County?
Total Female Population of Brookings County is 16,888.
What is the Ratio of Males per 100 Females in Brookings County?
There are 105.06 Males per 100 Females in Brookings County.
What is the Ratio of Females per 100 Males in Brookings County?
There are 95.18 Females per 100 Males in Brookings County.
What is the Median Population Age in Brookings County?
Median Population Age in Brookings County is 27.7 Years.
What is the Average Family Size in Brookings County
Average Family Size in Brookings County is 3.1 People.
What is the Average Household Size in Brookings County
Average Household Size in Brookings County is 2.3 People.
What is Per Capita Income in Brookings County?
Per Capita income in Brookings County is $32,778.
What is the Median Family Income in Brookings County?
Median Family Income in Brookings County is $100,278.
What is the Median Household income in Brookings County?
Median Household Income in Brookings County is $64,438.
What is Income or Wage Gap in Brookings County?
Income or Wage Gap in Brookings County is 24.5%.
Women in Brookings County earn 75.5 cents for every dollar earned by a man.
What is Family Income Deficit in Brookings County?
Family Income Deficit in Brookings County is $11,811.
Families that are below poverty line in Brookings County earn $11,811 less on average than the poverty threshold level.
What is Inequality or Gini Index in Brookings County?
Inequality or Gini Index in Brookings County is 0.41.
How Large is the Labor Force in Brookings County?
There are 20,020 People in the Labor Forcein in Brookings County.
What is the Percentage of People in the Labor Force in Brookings County?
70.4% of People are in the Labor Force in Brookings County.
What is the Unemployment Rate in Brookings County?
Unemployment Rate in Brookings County is 3.9%.