Bon Homme County, SD
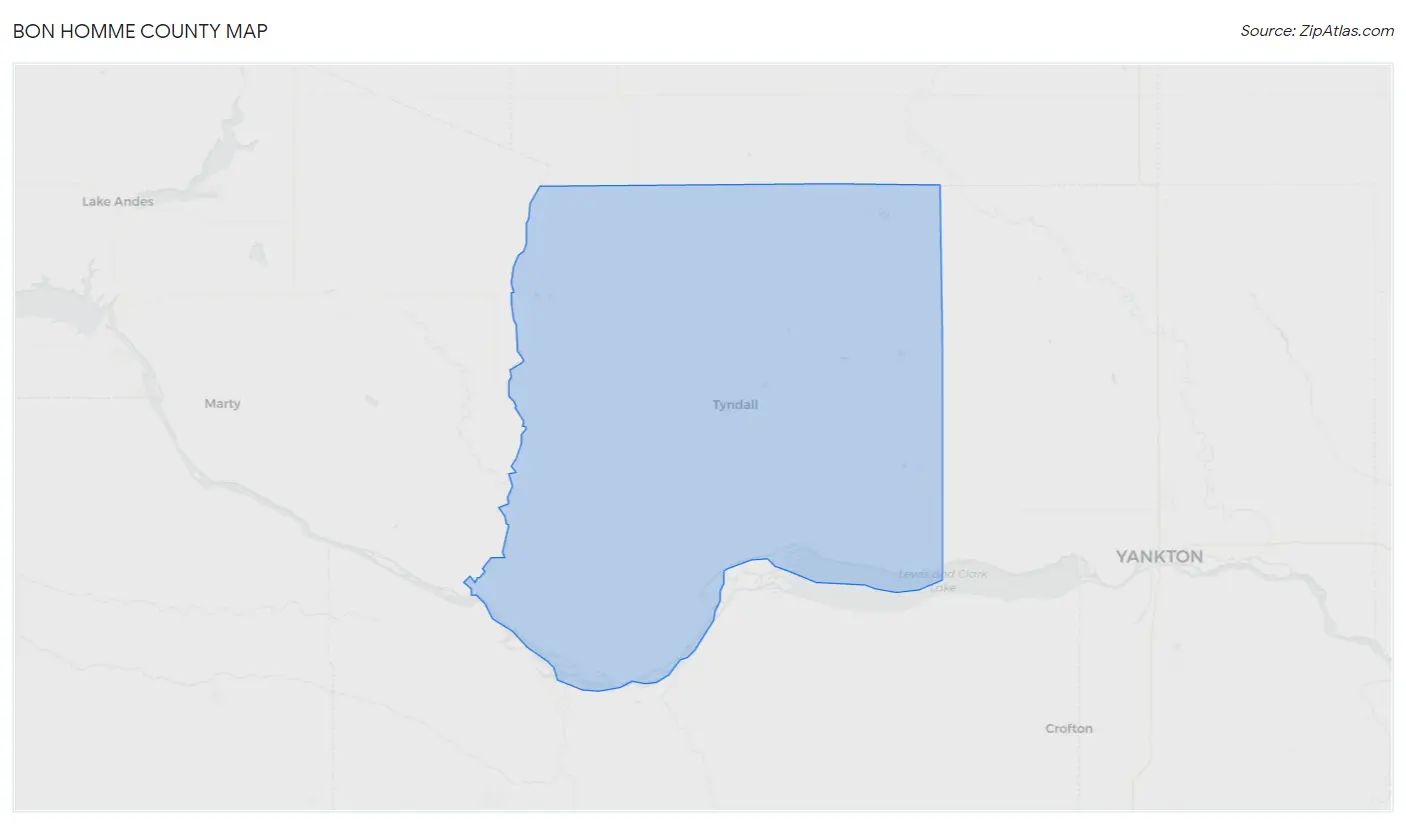
Bon Homme County Map
Bon Homme County Overview
7,018
TOTAL POPULATION
4,227
MALE POPULATION
2,791
FEMALE POPULATION
151.45
MALES / 100 FEMALES
66.03
FEMALES / 100 MALES
42.1
MEDIAN AGE
2.8
AVG FAMILY SIZE
2.2
AVG HOUSEHOLD SIZE
$26,450
PER CAPITA INCOME
$77,452
AVG FAMILY INCOME
$57,554
AVG HOUSEHOLD INCOME
13.5%
WAGE / INCOME GAP [ % ]
86.5¢/ $1
WAGE / INCOME GAP [ $ ]
$7,957
FAMILY INCOME DEFICIT
0.44
INEQUALITY / GINI INDEX
2,721
LABOR FORCE [ PEOPLE ]
46.2%
PERCENT IN LABOR FORCE
2.2%
UNEMPLOYMENT RATE
Bon Homme County Area Codes
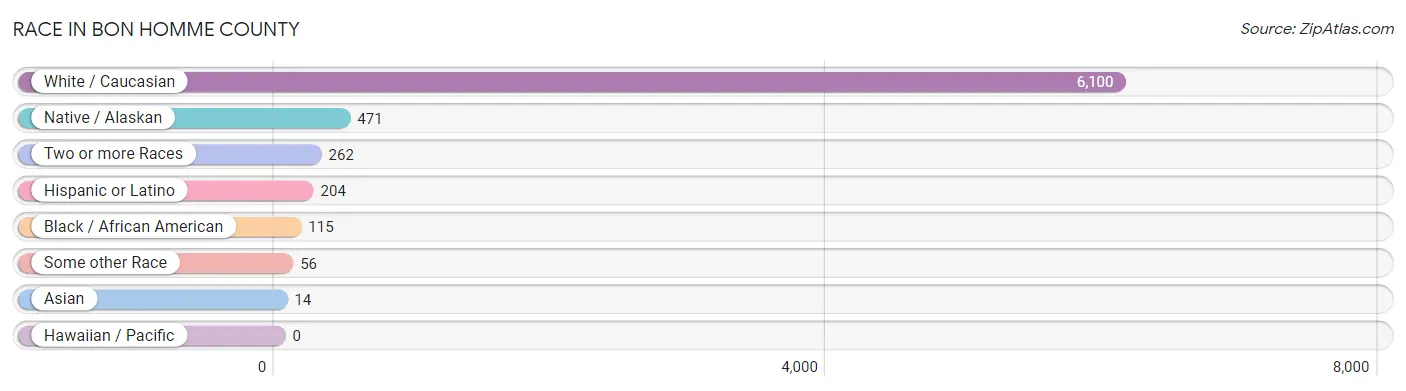
Race in Bon Homme County
The most populous races in Bon Homme County are White / Caucasian (6,100 | 86.9%), Native / Alaskan (471 | 6.7%), and Two or more Races (262 | 3.7%).
| Race | # Population | % Population |
| Asian | 14 | 0.2% |
| Black / African American | 115 | 1.6% |
| Hawaiian / Pacific | 0 | 0.0% |
| Hispanic or Latino | 204 | 2.9% |
| Native / Alaskan | 471 | 6.7% |
| White / Caucasian | 6,100 | 86.9% |
| Two or more Races | 262 | 3.7% |
| Some other Race | 56 | 0.8% |
| Total | 7,018 | 100.0% |
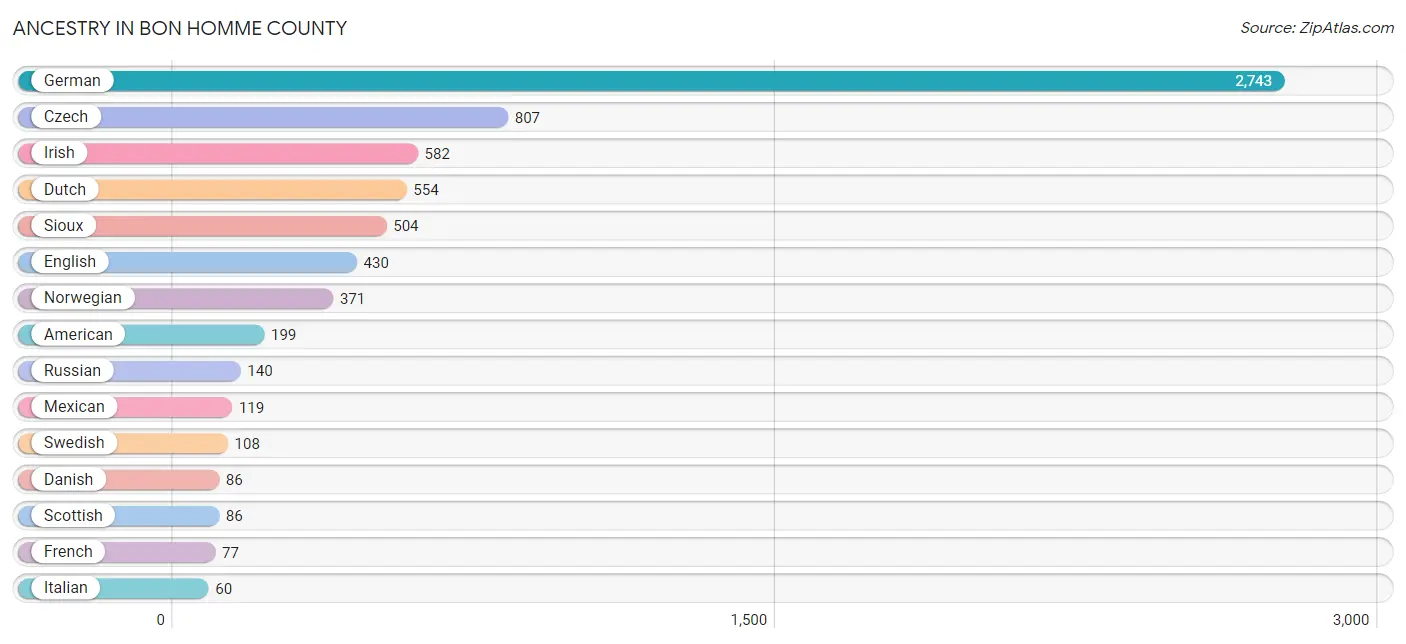
Ancestry in Bon Homme County
The most populous ancestries reported in Bon Homme County are German (2,743 | 39.1%), Czech (807 | 11.5%), Irish (582 | 8.3%), Dutch (554 | 7.9%), and Sioux (504 | 7.2%), together accounting for 73.9% of all Bon Homme County residents.
| Ancestry | # Population | % Population |
| African | 6 | 0.1% |
| American | 199 | 2.8% |
| Apache | 5 | 0.1% |
| Arab | 5 | 0.1% |
| Arapaho | 12 | 0.2% |
| Australian | 6 | 0.1% |
| Austrian | 15 | 0.2% |
| Belgian | 25 | 0.4% |
| Bhutanese | 4 | 0.1% |
| Blackfeet | 3 | 0.0% |
| British | 5 | 0.1% |
| Canadian | 23 | 0.3% |
| Central American | 21 | 0.3% |
| Cherokee | 19 | 0.3% |
| Cheyenne | 6 | 0.1% |
| Chippewa | 20 | 0.3% |
| Cuban | 3 | 0.0% |
| Czech | 807 | 11.5% |
| Czechoslovakian | 58 | 0.8% |
| Danish | 86 | 1.2% |
| Dutch | 554 | 7.9% |
| Eastern European | 23 | 0.3% |
| English | 430 | 6.1% |
| Ethiopian | 5 | 0.1% |
| European | 29 | 0.4% |
| Finnish | 13 | 0.2% |
| French | 77 | 1.1% |
| French American Indian | 1 | 0.0% |
| French Canadian | 19 | 0.3% |
| German | 2,743 | 39.1% |
| Guatemalan | 8 | 0.1% |
| Hungarian | 2 | 0.0% |
| Indonesian | 11 | 0.2% |
| Irish | 582 | 8.3% |
| Italian | 60 | 0.9% |
| Korean | 3 | 0.0% |
| Mexican | 119 | 1.7% |
| Native Hawaiian | 5 | 0.1% |
| Navajo | 1 | 0.0% |
| Norwegian | 371 | 5.3% |
| Polish | 13 | 0.2% |
| Portuguese | 8 | 0.1% |
| Pueblo | 5 | 0.1% |
| Puerto Rican | 33 | 0.5% |
| Romanian | 6 | 0.1% |
| Russian | 140 | 2.0% |
| Salvadoran | 13 | 0.2% |
| Samoan | 6 | 0.1% |
| Scandinavian | 33 | 0.5% |
| Scotch-Irish | 33 | 0.5% |
| Scottish | 86 | 1.2% |
| Sioux | 504 | 7.2% |
| South American | 13 | 0.2% |
| Spaniard | 10 | 0.1% |
| Spanish | 5 | 0.1% |
| Subsaharan African | 11 | 0.2% |
| Swedish | 108 | 1.5% |
| Ukrainian | 6 | 0.1% |
| Venezuelan | 13 | 0.2% |
| Welsh | 35 | 0.5% |
| Yaqui | 12 | 0.2% | View All 61 Rows |
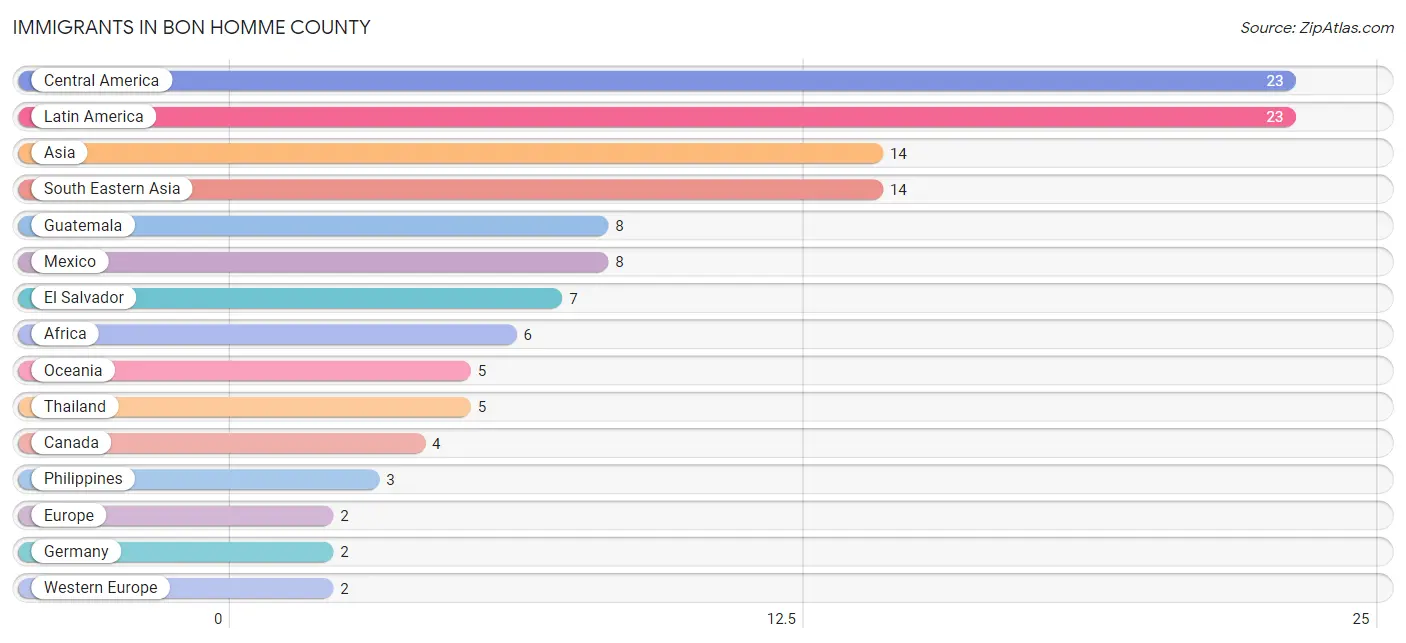
Immigrants in Bon Homme County
The most numerous immigrant groups reported in Bon Homme County came from Central America (23 | 0.3%), Latin America (23 | 0.3%), Asia (14 | 0.2%), South Eastern Asia (14 | 0.2%), and Guatemala (8 | 0.1%), together accounting for 1.2% of all Bon Homme County residents.
| Immigration Origin | # Population | % Population |
| Africa | 6 | 0.1% |
| Asia | 14 | 0.2% |
| Canada | 4 | 0.1% |
| Central America | 23 | 0.3% |
| El Salvador | 7 | 0.1% |
| Europe | 2 | 0.0% |
| Germany | 2 | 0.0% |
| Guatemala | 8 | 0.1% |
| Latin America | 23 | 0.3% |
| Mexico | 8 | 0.1% |
| Oceania | 5 | 0.1% |
| Philippines | 3 | 0.0% |
| South Eastern Asia | 14 | 0.2% |
| Thailand | 5 | 0.1% |
| Western Europe | 2 | 0.0% | View All 15 Rows |
Sex and Age in Bon Homme County
Sex and Age in Bon Homme County
The most populous age groups in Bon Homme County are 30 to 34 Years (388 | 9.2%) for men and 60 to 64 Years (212 | 7.6%) for women.
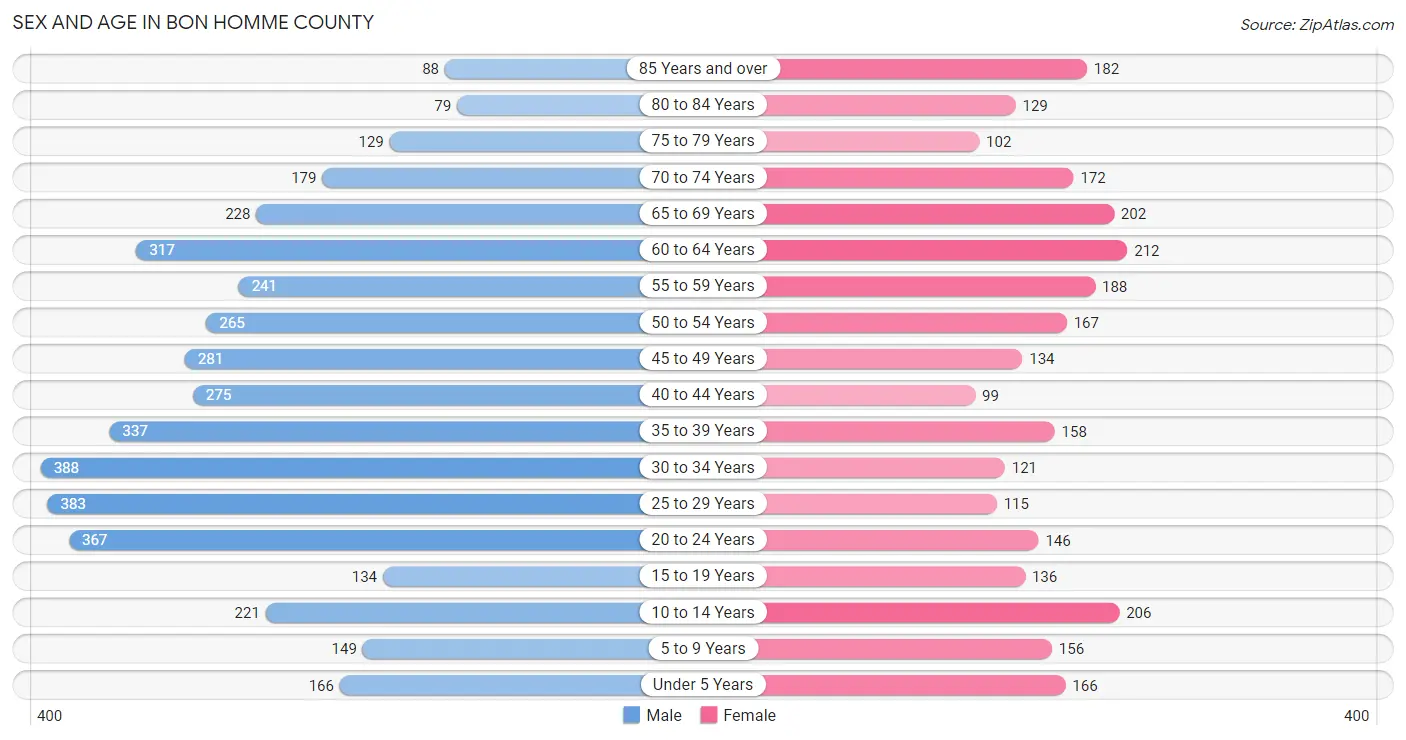
| Age Bracket | Male | Female |
| Under 5 Years | 166 (3.9%) | 166 (5.9%) |
| 5 to 9 Years | 149 (3.5%) | 156 (5.6%) |
| 10 to 14 Years | 221 (5.2%) | 206 (7.4%) |
| 15 to 19 Years | 134 (3.2%) | 136 (4.9%) |
| 20 to 24 Years | 367 (8.7%) | 146 (5.2%) |
| 25 to 29 Years | 383 (9.1%) | 115 (4.1%) |
| 30 to 34 Years | 388 (9.2%) | 121 (4.3%) |
| 35 to 39 Years | 337 (8.0%) | 158 (5.7%) |
| 40 to 44 Years | 275 (6.5%) | 99 (3.5%) |
| 45 to 49 Years | 281 (6.7%) | 134 (4.8%) |
| 50 to 54 Years | 265 (6.3%) | 167 (6.0%) |
| 55 to 59 Years | 241 (5.7%) | 188 (6.7%) |
| 60 to 64 Years | 317 (7.5%) | 212 (7.6%) |
| 65 to 69 Years | 228 (5.4%) | 202 (7.2%) |
| 70 to 74 Years | 179 (4.2%) | 172 (6.2%) |
| 75 to 79 Years | 129 (3.0%) | 102 (3.6%) |
| 80 to 84 Years | 79 (1.9%) | 129 (4.6%) |
| 85 Years and over | 88 (2.1%) | 182 (6.5%) |
| Total | 4,227 (100.0%) | 2,791 (100.0%) |
Families and Households in Bon Homme County
Median Family Size in Bon Homme County
The median family size in Bon Homme County is 2.78 persons per family, with married-couple families (1,296 | 82.5%) accounting for the largest median family size of 2.82 persons per family. On the other hand, single male/father families (147 | 9.4%) represent the smallest median family size with 2.56 persons per family.
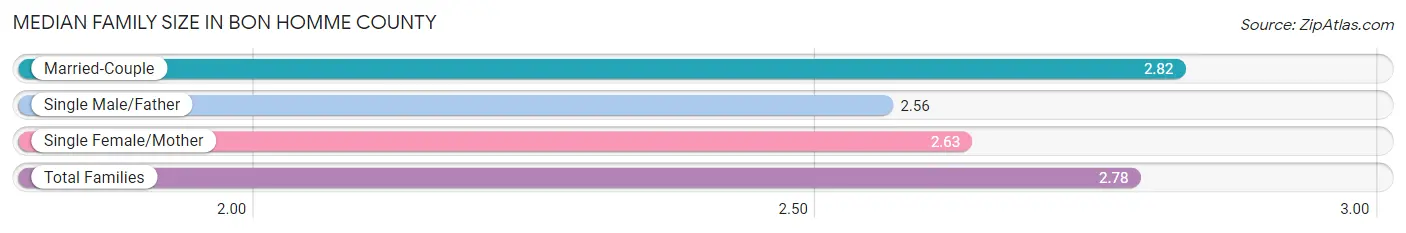
| Family Type | # Families | Family Size |
| Married-Couple | 1,296 (82.5%) | 2.82 |
| Single Male/Father | 147 (9.4%) | 2.56 |
| Single Female/Mother | 128 (8.2%) | 2.63 |
| Total Families | 1,571 (100.0%) | 2.78 |
Median Household Size in Bon Homme County
The median household size in Bon Homme County is 2.23 persons per household, with single female/mother households (128 | 5.3%) accounting for the largest median household size of 2.99 persons per household. non-family households (843 | 34.9%) represent the smallest median household size with 1.10 persons per household.
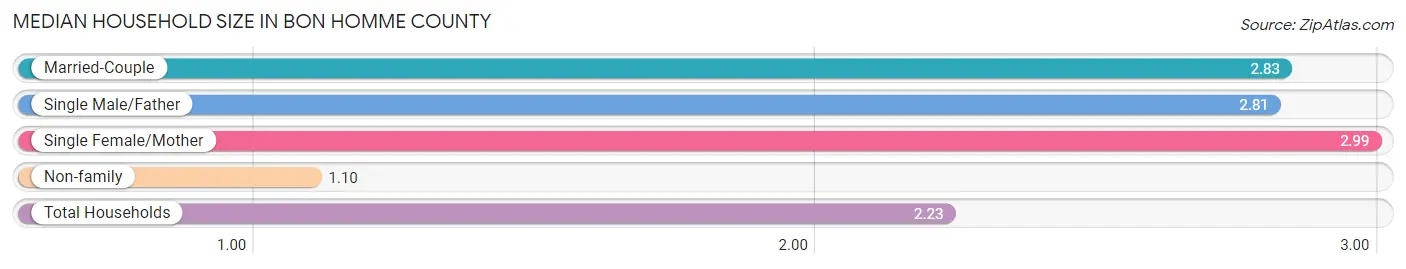
| Household Type | # Households | Household Size |
| Married-Couple | 1,296 (53.7%) | 2.83 |
| Single Male/Father | 147 (6.1%) | 2.81 |
| Single Female/Mother | 128 (5.3%) | 2.99 |
| Non-family | 843 (34.9%) | 1.10 |
| Total Households | 2,414 (100.0%) | 2.23 |
Household Size by Marriage Status in Bon Homme County
Out of a total of 2,414 households in Bon Homme County, 1,571 (65.1%) are family households, while 843 (34.9%) are nonfamily households. The most numerous type of family households are 2-person households, comprising 940, and the most common type of nonfamily households are 1-person households, comprising 744.
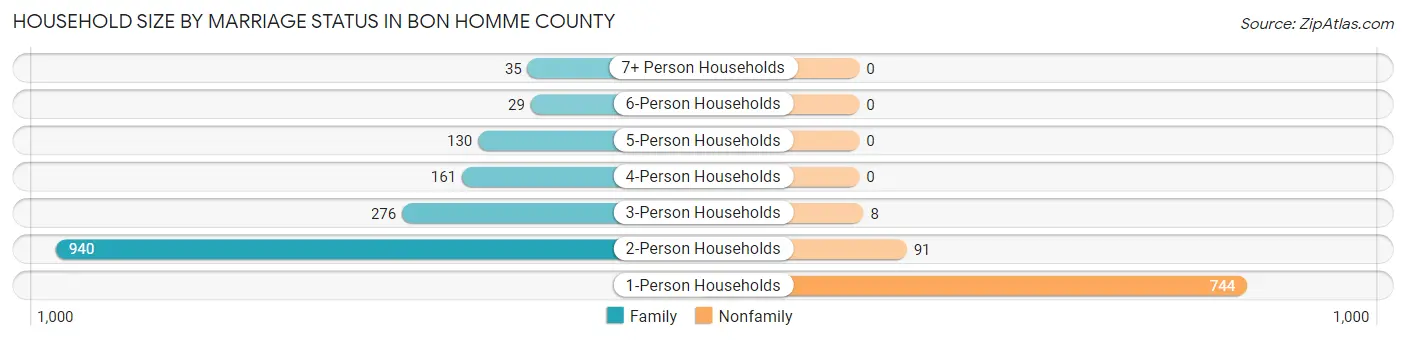
| Household Size | Family Households | Nonfamily Households |
| 1-Person Households | - | 744 (30.8%) |
| 2-Person Households | 940 (38.9%) | 91 (3.8%) |
| 3-Person Households | 276 (11.4%) | 8 (0.3%) |
| 4-Person Households | 161 (6.7%) | 0 (0.0%) |
| 5-Person Households | 130 (5.4%) | 0 (0.0%) |
| 6-Person Households | 29 (1.2%) | 0 (0.0%) |
| 7+ Person Households | 35 (1.5%) | 0 (0.0%) |
| Total | 1,571 (65.1%) | 843 (34.9%) |
Female Fertility in Bon Homme County
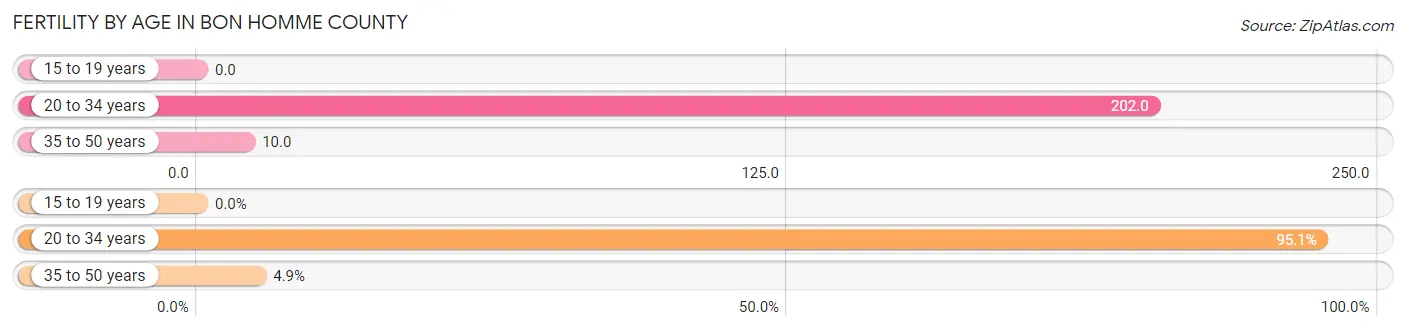
Fertility by Age in Bon Homme County
Average fertility rate in Bon Homme County is 87.0 births per 1,000 women. Women in the age bracket of 20 to 34 years have the highest fertility rate with 202.0 births per 1,000 women. Women in the age bracket of 20 to 34 years acount for 95.1% of all women with births.
| Age Bracket | Women with Births | Births / 1,000 Women |
| 15 to 19 years | 0 (0.0%) | 0.0 |
| 20 to 34 years | 77 (95.1%) | 202.0 |
| 35 to 50 years | 4 (4.9%) | 10.0 |
| Total | 81 (100.0%) | 87.0 |
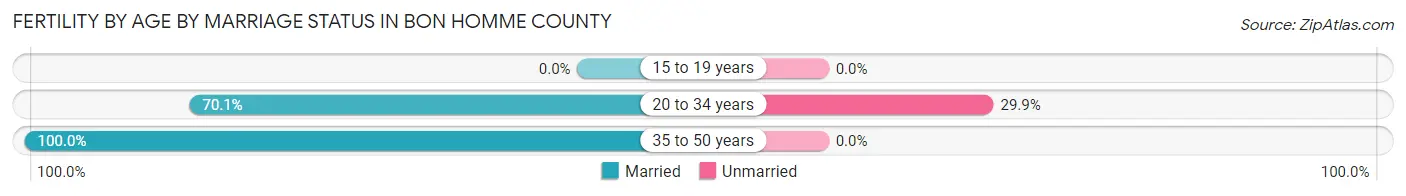
Fertility by Age by Marriage Status in Bon Homme County
71.6% of women with births (81) in Bon Homme County are married. The highest percentage of unmarried women with births falls into 20 to 34 years age bracket with 29.9% of them unmarried at the time of birth, while the lowest percentage of unmarried women with births belong to 35 to 50 years age bracket with 0.0% of them unmarried.
| Age Bracket | Married | Unmarried |
| 15 to 19 years | 0 (0.0%) | 0 (0.0%) |
| 20 to 34 years | 54 (70.1%) | 23 (29.9%) |
| 35 to 50 years | 4 (100.0%) | 0 (0.0%) |
| Total | 58 (71.6%) | 23 (28.4%) |
Fertility by Education in Bon Homme County
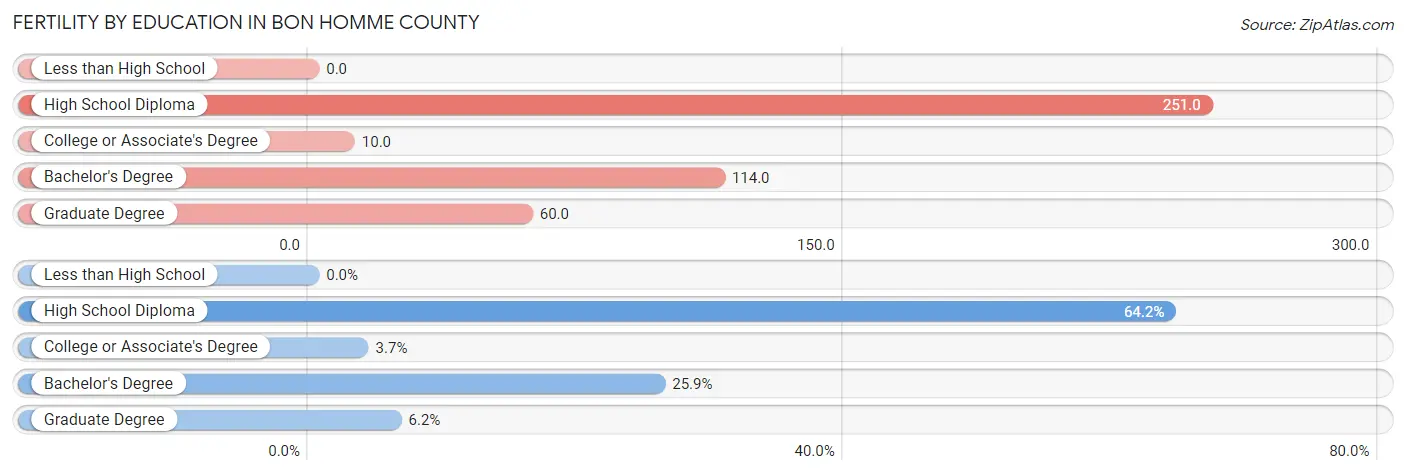
| Educational Attainment | Women with Births | Births / 1,000 Women |
| Less than High School | 0 (0.0%) | 0.0 |
| High School Diploma | 52 (64.2%) | 251.0 |
| College or Associate's Degree | 3 (3.7%) | 10.0 |
| Bachelor's Degree | 21 (25.9%) | 114.0 |
| Graduate Degree | 5 (6.2%) | 60.0 |
| Total | 81 (100.0%) | 87.0 |
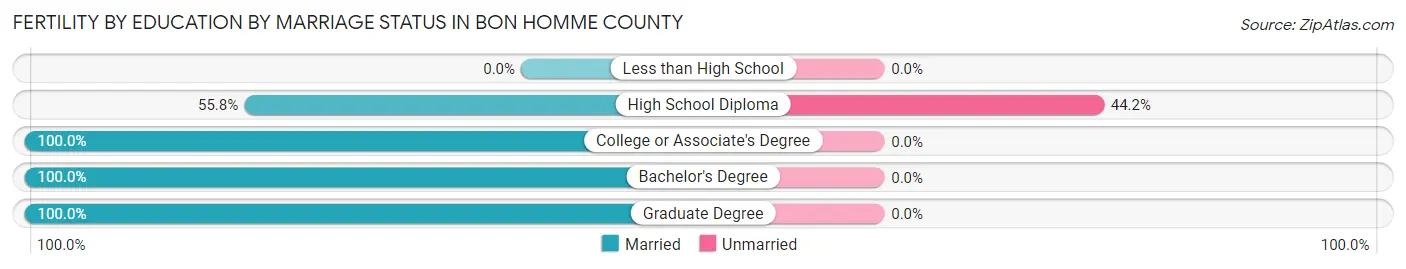
Fertility by Education by Marriage Status in Bon Homme County
28.4% of women with births in Bon Homme County are unmarried. Women with the educational attainment of college or associate's degree are most likely to be married with 100.0% of them married at childbirth, while women with the educational attainment of high school diploma are least likely to be married with 44.2% of them unmarried at childbirth.
| Educational Attainment | Married | Unmarried |
| Less than High School | 0 (0.0%) | 0 (0.0%) |
| High School Diploma | 29 (55.8%) | 23 (44.2%) |
| College or Associate's Degree | 3 (100.0%) | 0 (0.0%) |
| Bachelor's Degree | 21 (100.0%) | 0 (0.0%) |
| Graduate Degree | 5 (100.0%) | 0 (0.0%) |
| Total | 58 (71.6%) | 23 (28.4%) |
Income in Bon Homme County
Income Overview in Bon Homme County
Per Capita Income in Bon Homme County is $26,450, while median incomes of families and households are $77,452 and $57,554 respectively.
| Characteristic | Number | Measure |
| Per Capita Income | 7,018 | $26,450 |
| Median Family Income | 1,571 | $77,452 |
| Mean Family Income | 1,571 | $95,428 |
| Median Household Income | 2,414 | $57,554 |
| Mean Household Income | 2,414 | $76,866 |
| Income Deficit | 1,571 | $7,957 |
| Wage / Income Gap (%) | 7,018 | 13.49% |
| Wage / Income Gap ($) | 7,018 | 86.51¢ per $1 |
| Gini / Inequality Index | 7,018 | 0.44 |
Earnings by Sex in Bon Homme County
Average Earnings in Bon Homme County are $30,830, $28,829 for men and $33,325 for women, a difference of 13.5%.
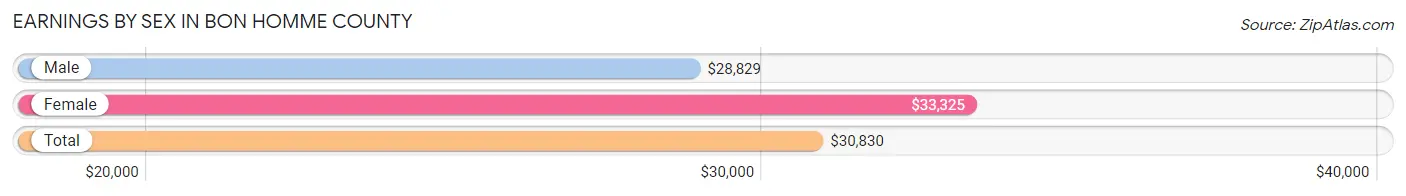
| Sex | Number | Average Earnings |
| Male | 2,327 (65.0%) | $28,829 |
| Female | 1,254 (35.0%) | $33,325 |
| Total | 3,581 (100.0%) | $30,830 |
Earnings by Sex by Income Bracket in Bon Homme County
The most common earnings brackets in Bon Homme County are $2,499 or less for men (377 | 16.2%) and $30,000 to $34,999 for women (140 | 11.2%).
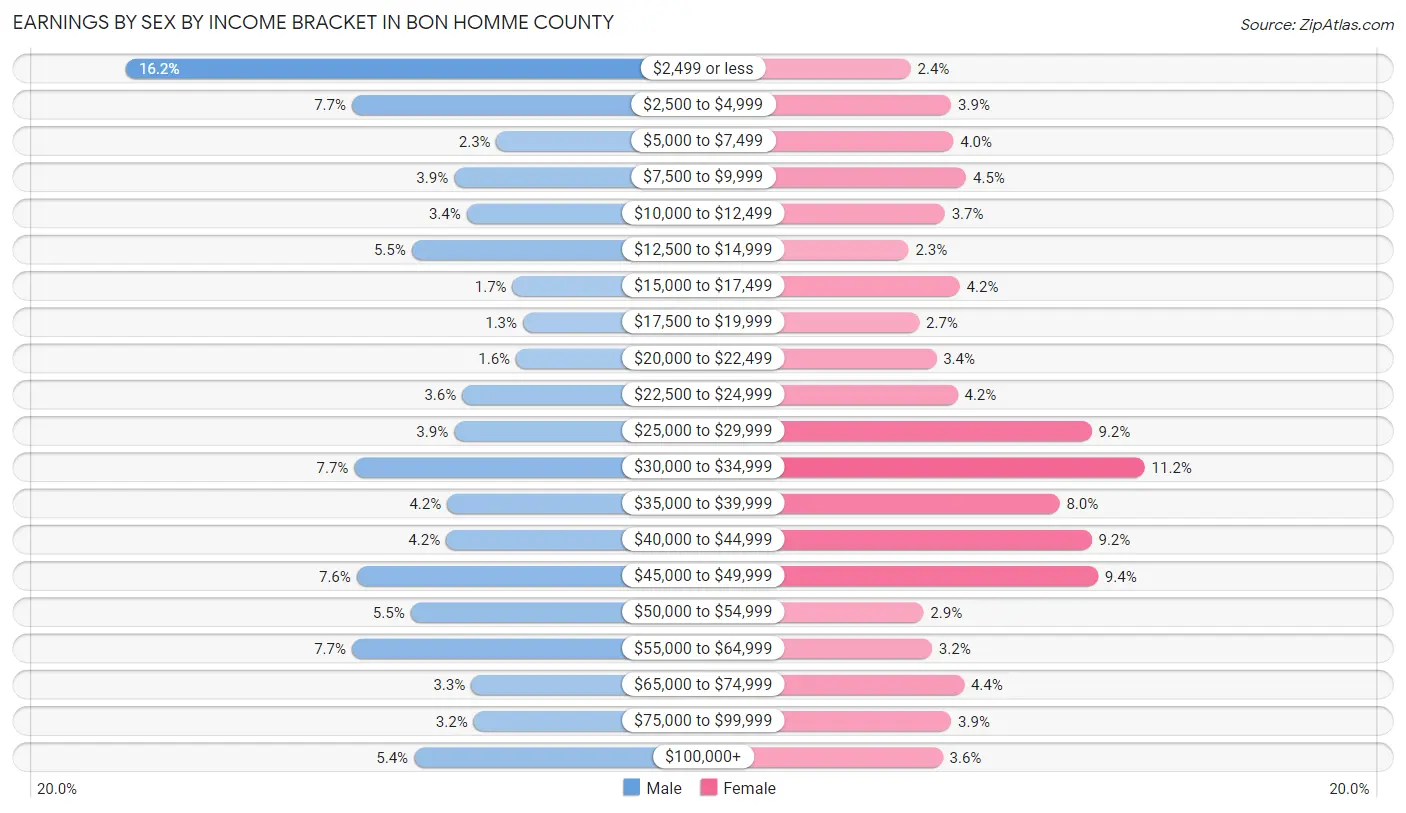
| Income | Male | Female |
| $2,499 or less | 377 (16.2%) | 30 (2.4%) |
| $2,500 to $4,999 | 180 (7.7%) | 49 (3.9%) |
| $5,000 to $7,499 | 54 (2.3%) | 50 (4.0%) |
| $7,500 to $9,999 | 91 (3.9%) | 56 (4.5%) |
| $10,000 to $12,499 | 80 (3.4%) | 46 (3.7%) |
| $12,500 to $14,999 | 128 (5.5%) | 29 (2.3%) |
| $15,000 to $17,499 | 40 (1.7%) | 53 (4.2%) |
| $17,500 to $19,999 | 31 (1.3%) | 34 (2.7%) |
| $20,000 to $22,499 | 37 (1.6%) | 42 (3.4%) |
| $22,500 to $24,999 | 84 (3.6%) | 52 (4.2%) |
| $25,000 to $29,999 | 91 (3.9%) | 115 (9.2%) |
| $30,000 to $34,999 | 178 (7.6%) | 140 (11.2%) |
| $35,000 to $39,999 | 97 (4.2%) | 100 (8.0%) |
| $40,000 to $44,999 | 98 (4.2%) | 115 (9.2%) |
| $45,000 to $49,999 | 176 (7.6%) | 118 (9.4%) |
| $50,000 to $54,999 | 129 (5.5%) | 36 (2.9%) |
| $55,000 to $64,999 | 180 (7.7%) | 40 (3.2%) |
| $65,000 to $74,999 | 76 (3.3%) | 55 (4.4%) |
| $75,000 to $99,999 | 74 (3.2%) | 49 (3.9%) |
| $100,000+ | 126 (5.4%) | 45 (3.6%) |
| Total | 2,327 (100.0%) | 1,254 (100.0%) |
Earnings by Sex by Educational Attainment in Bon Homme County
Average earnings in Bon Homme County are $31,037 for men and $35,042 for women, a difference of 11.4%. Men with an educational attainment of graduate degree enjoy the highest average annual earnings of $54,306, while those with less than high school education earn the least with $16,607. Women with an educational attainment of graduate degree earn the most with the average annual earnings of $55,625, while those with high school diploma education have the smallest earnings of $22,885.
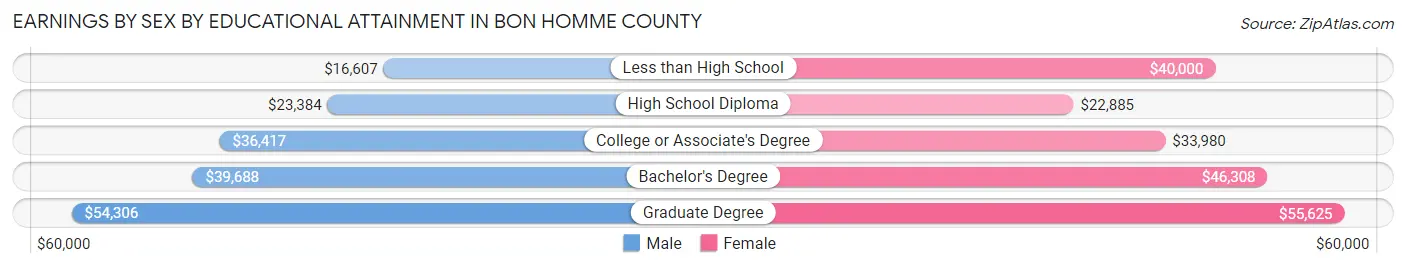
| Educational Attainment | Male Income | Female Income |
| Less than High School | $16,607 | $40,000 |
| High School Diploma | $23,384 | $22,885 |
| College or Associate's Degree | $36,417 | $33,980 |
| Bachelor's Degree | $39,688 | $46,308 |
| Graduate Degree | $54,306 | $55,625 |
| Total | $31,037 | $35,042 |
Family Income in Bon Homme County
Family Income Brackets in Bon Homme County
According to the Bon Homme County family income data, there are 320 families falling into the $75,000 to $99,999 income range, which is the most common income bracket and makes up 20.4% of all families. Conversely, the $10,000 to $14,999 income bracket is the least frequent group with only 9 families (0.6%) belonging to this category.
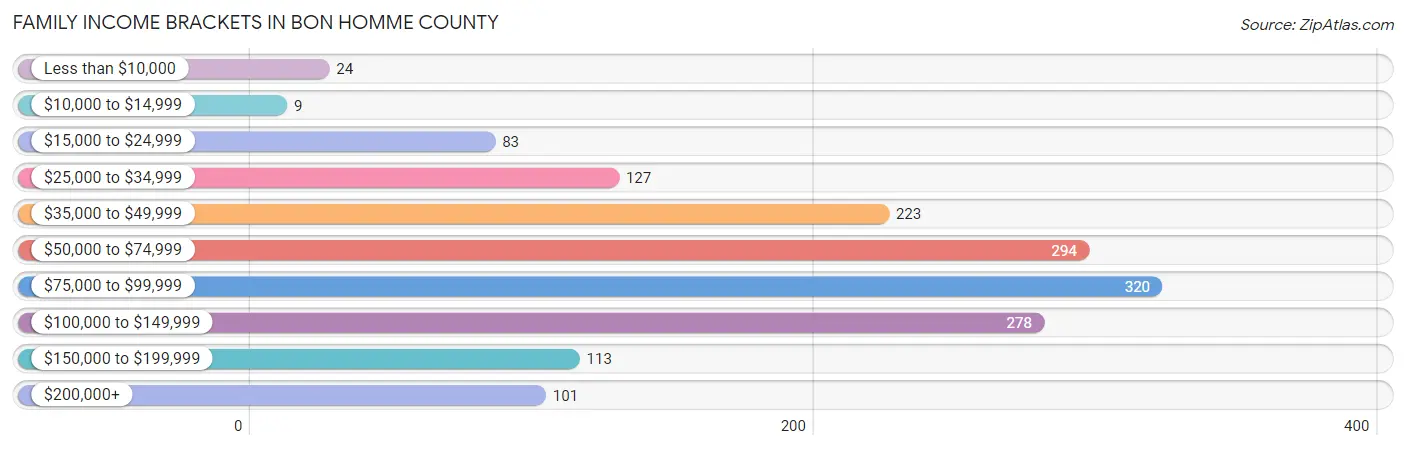
| Income Bracket | # Families | % Families |
| Less than $10,000 | 24 | 1.5% |
| $10,000 to $14,999 | 9 | 0.6% |
| $15,000 to $24,999 | 83 | 5.3% |
| $25,000 to $34,999 | 127 | 8.1% |
| $35,000 to $49,999 | 223 | 14.2% |
| $50,000 to $74,999 | 294 | 18.7% |
| $75,000 to $99,999 | 320 | 20.4% |
| $100,000 to $149,999 | 278 | 17.7% |
| $150,000 to $199,999 | 113 | 7.2% |
| $200,000+ | 101 | 6.4% |
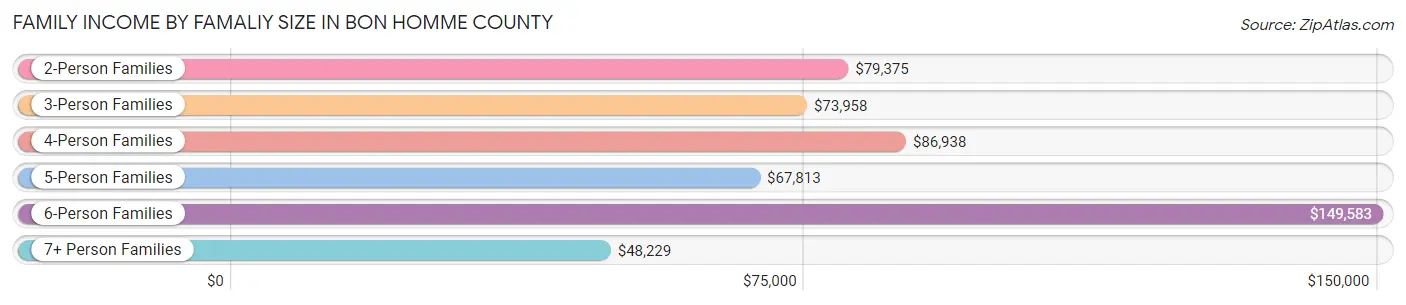
Family Income by Famaliy Size in Bon Homme County
6-person families (29 | 1.8%) account for the highest median family income in Bon Homme County with $149,583 per family, while 2-person families (999 | 63.6%) have the highest median income of $39,688 per family member.
| Income Bracket | # Families | Median Income |
| 2-Person Families | 999 (63.6%) | $79,375 |
| 3-Person Families | 233 (14.8%) | $73,958 |
| 4-Person Families | 167 (10.6%) | $86,938 |
| 5-Person Families | 108 (6.9%) | $67,813 |
| 6-Person Families | 29 (1.8%) | $149,583 |
| 7+ Person Families | 35 (2.2%) | $48,229 |
| Total | 1,571 (100.0%) | $77,452 |
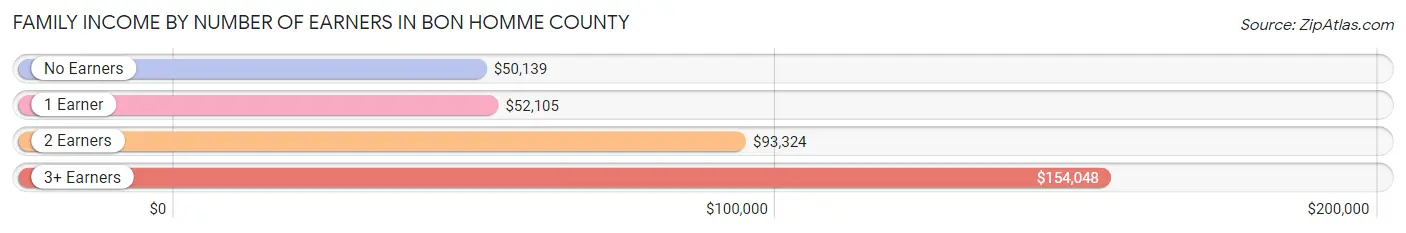
Family Income by Number of Earners in Bon Homme County
The median family income in Bon Homme County is $77,452, with families comprising 3+ earners (158) having the highest median family income of $154,048, while families with no earners (216) have the lowest median family income of $50,139, accounting for 10.1% and 13.8% of families, respectively.
| Number of Earners | # Families | Median Income |
| No Earners | 216 (13.8%) | $50,139 |
| 1 Earner | 492 (31.3%) | $52,105 |
| 2 Earners | 705 (44.9%) | $93,324 |
| 3+ Earners | 158 (10.1%) | $154,048 |
| Total | 1,571 (100.0%) | $77,452 |
Household Income in Bon Homme County
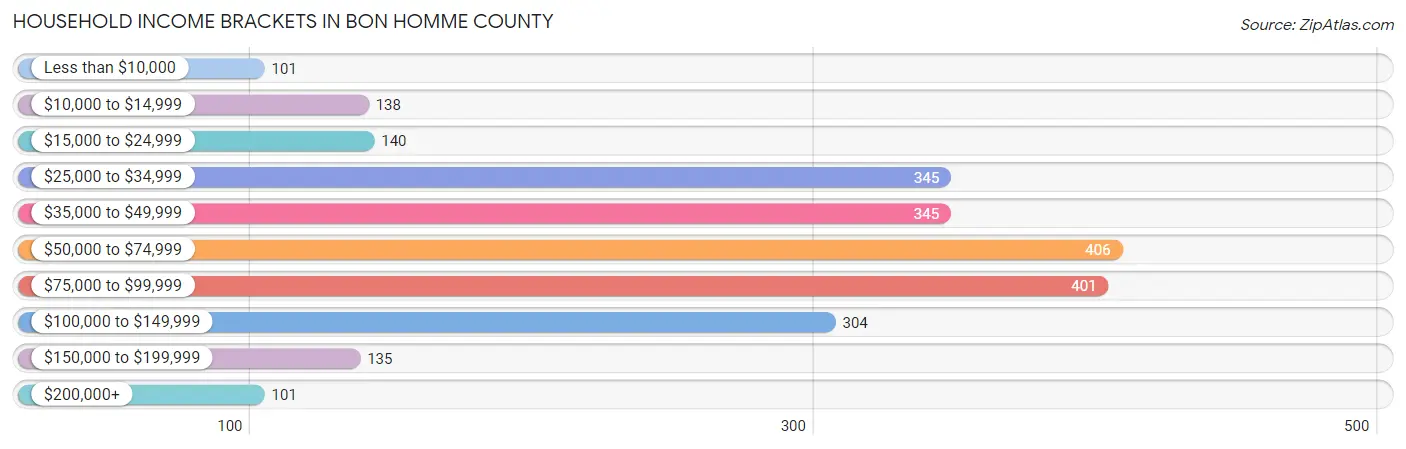
Household Income Brackets in Bon Homme County
With 406 households falling in the category, the $50,000 to $74,999 income range is the most frequent in Bon Homme County, accounting for 16.8% of all households. In contrast, only 101 households (4.2%) fall into the less than $10,000 income bracket, making it the least populous group.
| Income Bracket | # Households | % Households |
| Less than $10,000 | 101 | 4.2% |
| $10,000 to $14,999 | 138 | 5.7% |
| $15,000 to $24,999 | 140 | 5.8% |
| $25,000 to $34,999 | 345 | 14.3% |
| $35,000 to $49,999 | 345 | 14.3% |
| $50,000 to $74,999 | 406 | 16.8% |
| $75,000 to $99,999 | 401 | 16.6% |
| $100,000 to $149,999 | 304 | 12.6% |
| $150,000 to $199,999 | 135 | 5.6% |
| $200,000+ | 101 | 4.2% |
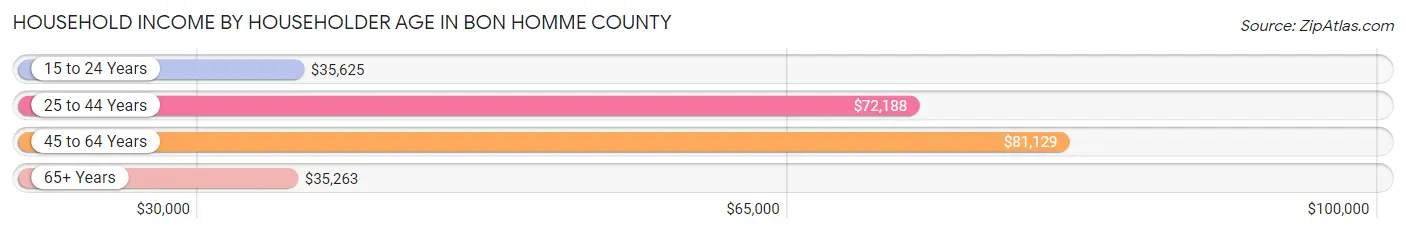
Household Income by Householder Age in Bon Homme County
The median household income in Bon Homme County is $57,554, with the highest median household income of $81,129 found in the 45 to 64 years age bracket for the primary householder. A total of 766 households (31.7%) fall into this category. Meanwhile, the 65+ years age bracket for the primary householder has the lowest median household income of $35,263, with 908 households (37.6%) in this group.
| Income Bracket | # Households | Median Income |
| 15 to 24 Years | 160 (6.6%) | $35,625 |
| 25 to 44 Years | 580 (24.0%) | $72,188 |
| 45 to 64 Years | 766 (31.7%) | $81,129 |
| 65+ Years | 908 (37.6%) | $35,263 |
| Total | 2,414 (100.0%) | $57,554 |
Poverty in Bon Homme County
Income Below Poverty by Sex and Age in Bon Homme County
With 12.4% poverty level for males and 11.0% for females among the residents of Bon Homme County, 6 to 11 year old males and 15 year old females are the most vulnerable to poverty, with 88 males (41.5%) and 28 females (60.9%) in their respective age groups living below the poverty level.
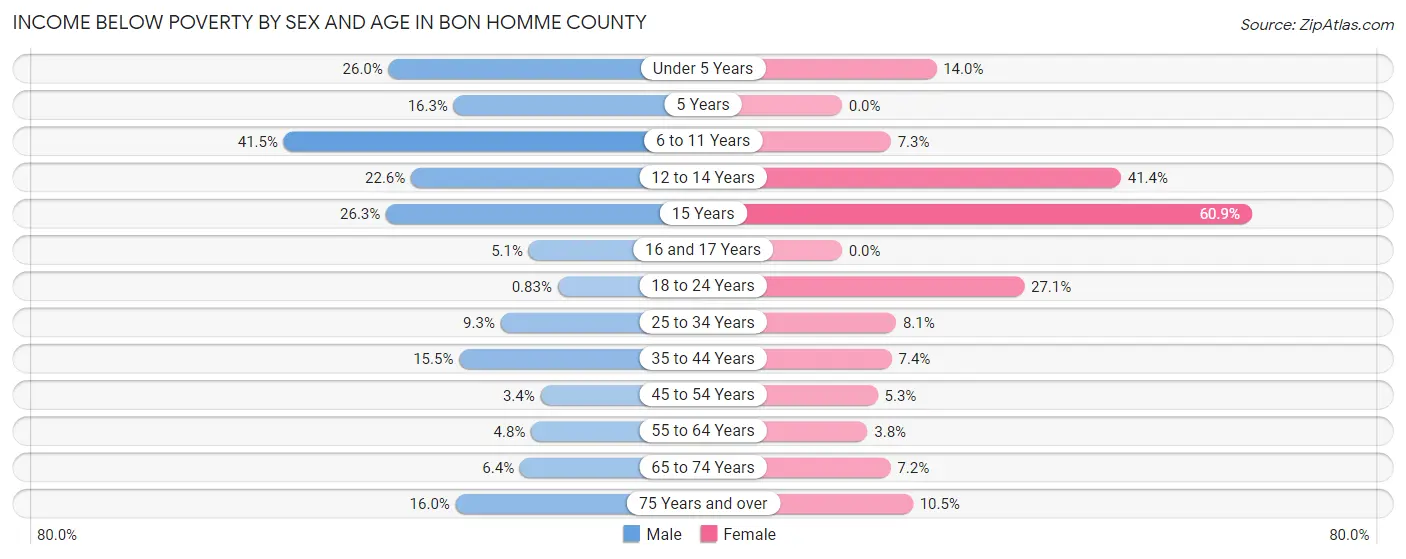
| Age Bracket | Male | Female |
| Under 5 Years | 41 (26.0%) | 23 (14.0%) |
| 5 Years | 7 (16.3%) | 0 (0.0%) |
| 6 to 11 Years | 88 (41.5%) | 12 (7.3%) |
| 12 to 14 Years | 26 (22.6%) | 58 (41.4%) |
| 15 Years | 5 (26.3%) | 28 (60.9%) |
| 16 and 17 Years | 4 (5.1%) | 0 (0.0%) |
| 18 to 24 Years | 2 (0.8%) | 46 (27.1%) |
| 25 to 34 Years | 20 (9.3%) | 19 (8.1%) |
| 35 to 44 Years | 47 (15.5%) | 19 (7.4%) |
| 45 to 54 Years | 10 (3.4%) | 16 (5.3%) |
| 55 to 64 Years | 19 (4.8%) | 15 (3.8%) |
| 65 to 74 Years | 23 (6.4%) | 27 (7.2%) |
| 75 Years and over | 43 (16.0%) | 32 (10.5%) |
| Total | 335 (12.4%) | 295 (11.0%) |
Income Above Poverty by Sex and Age in Bon Homme County
According to the poverty statistics in Bon Homme County, males aged 18 to 24 years and females aged 5 years are the age groups that are most secure financially, with 99.2% of males and 100.0% of females in these age groups living above the poverty line.
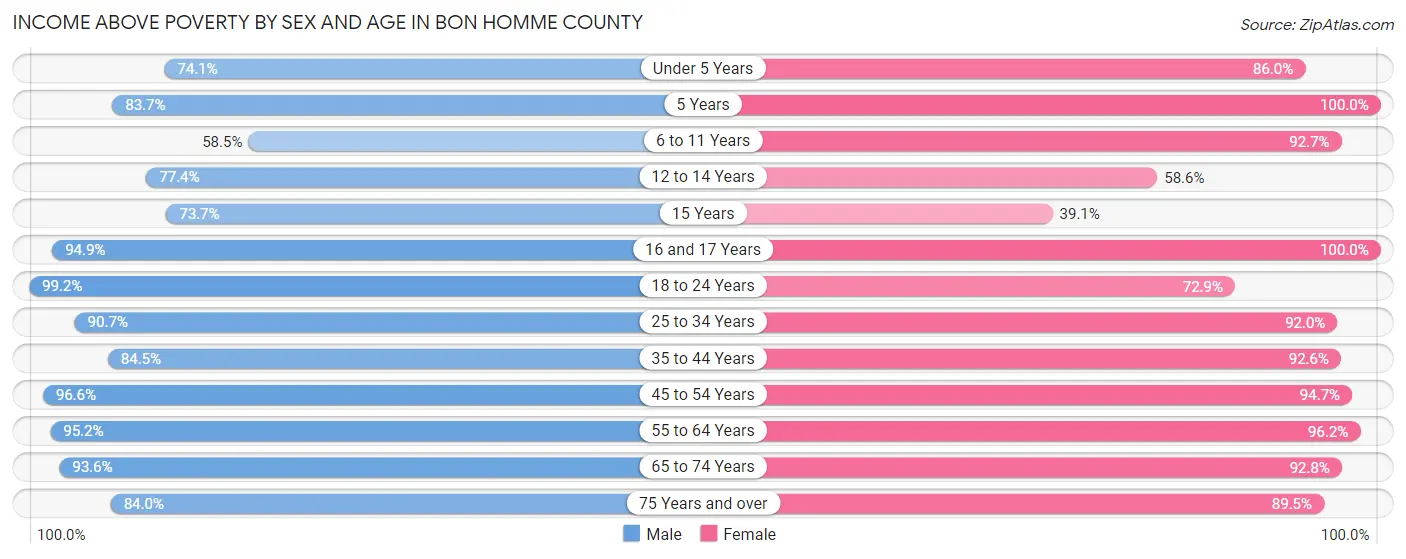
| Age Bracket | Male | Female |
| Under 5 Years | 117 (74.1%) | 141 (86.0%) |
| 5 Years | 36 (83.7%) | 57 (100.0%) |
| 6 to 11 Years | 124 (58.5%) | 153 (92.7%) |
| 12 to 14 Years | 89 (77.4%) | 82 (58.6%) |
| 15 Years | 14 (73.7%) | 18 (39.1%) |
| 16 and 17 Years | 74 (94.9%) | 66 (100.0%) |
| 18 to 24 Years | 238 (99.2%) | 124 (72.9%) |
| 25 to 34 Years | 195 (90.7%) | 217 (91.9%) |
| 35 to 44 Years | 257 (84.5%) | 238 (92.6%) |
| 45 to 54 Years | 286 (96.6%) | 285 (94.7%) |
| 55 to 64 Years | 379 (95.2%) | 381 (96.2%) |
| 65 to 74 Years | 334 (93.6%) | 347 (92.8%) |
| 75 Years and over | 226 (84.0%) | 272 (89.5%) |
| Total | 2,369 (87.6%) | 2,381 (89.0%) |
Income Below Poverty Among Married-Couple Families in Bon Homme County
The poverty statistics for married-couple families in Bon Homme County show that 4.4% or 57 of the total 1,296 families live below the poverty line. Families with 5 or more children have the highest poverty rate of 59.4%, comprising of 19 families. On the other hand, families with 3 or 4 children have the lowest poverty rate of 0.0%, which includes 0 families.
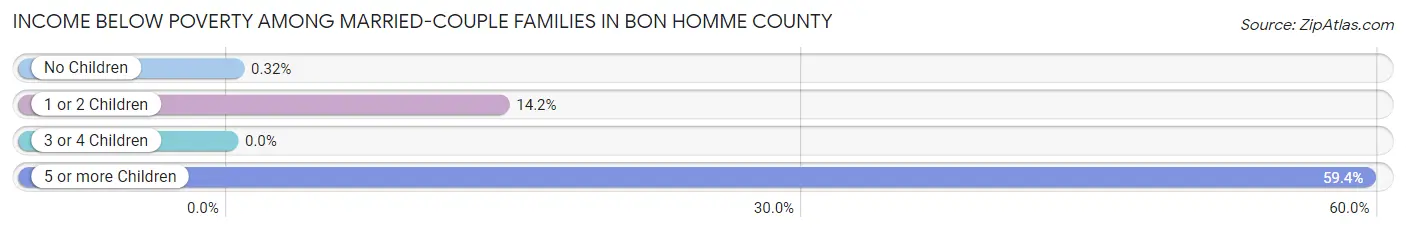
| Children | Above Poverty | Below Poverty |
| No Children | 939 (99.7%) | 3 (0.3%) |
| 1 or 2 Children | 212 (85.8%) | 35 (14.2%) |
| 3 or 4 Children | 75 (100.0%) | 0 (0.0%) |
| 5 or more Children | 13 (40.6%) | 19 (59.4%) |
| Total | 1,239 (95.6%) | 57 (4.4%) |
Income Below Poverty Among Single-Parent Households in Bon Homme County
According to the poverty data in Bon Homme County, 8.8% or 13 single-father households and 12.5% or 16 single-mother households are living below the poverty line. Among single-father households, those with 5 or more children have the highest poverty rate, with 3 households (100.0%) experiencing poverty. Likewise, among single-mother households, those with 3 or 4 children have the highest poverty rate, with 11 households (45.8%) falling below the poverty line.
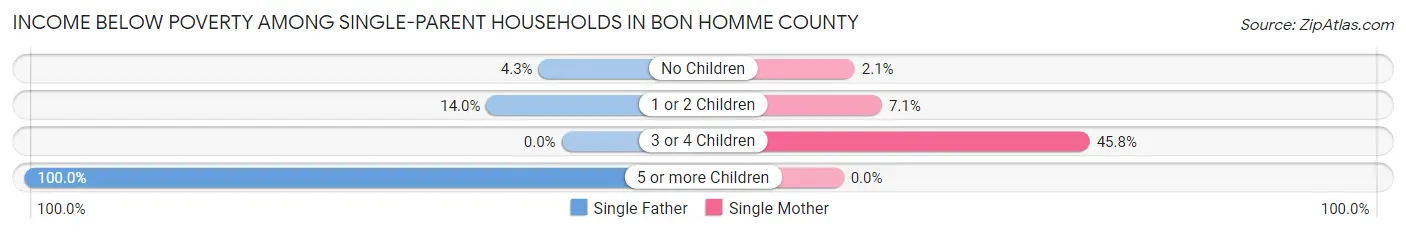
| Children | Single Father | Single Mother |
| No Children | 3 (4.3%) | 1 (2.1%) |
| 1 or 2 Children | 7 (14.0%) | 4 (7.1%) |
| 3 or 4 Children | 0 (0.0%) | 11 (45.8%) |
| 5 or more Children | 3 (100.0%) | 0 (0.0%) |
| Total | 13 (8.8%) | 16 (12.5%) |
Income Below Poverty Among Married-Couple vs Single-Parent Households in Bon Homme County
The poverty data for Bon Homme County shows that 57 of the married-couple family households (4.4%) and 29 of the single-parent households (10.5%) are living below the poverty level. Within the married-couple family households, those with 5 or more children have the highest poverty rate, with 19 households (59.4%) falling below the poverty line. Among the single-parent households, those with 5 or more children have the highest poverty rate, with 3 household (100.0%) living below poverty.
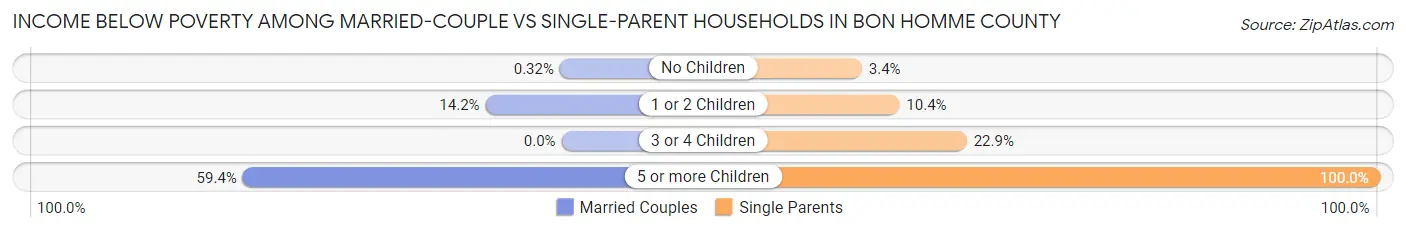
| Children | Married-Couple Families | Single-Parent Households |
| No Children | 3 (0.3%) | 4 (3.4%) |
| 1 or 2 Children | 35 (14.2%) | 11 (10.4%) |
| 3 or 4 Children | 0 (0.0%) | 11 (22.9%) |
| 5 or more Children | 19 (59.4%) | 3 (100.0%) |
| Total | 57 (4.4%) | 29 (10.5%) |
Employment Characteristics in Bon Homme County
Employment by Class of Employer in Bon Homme County
Among the 2,611 employed individuals in Bon Homme County, private company employees (1,388 | 53.2%), self-employed (not incorporated) (306 | 11.7%), and not-for-profit organizations (281 | 10.8%) make up the most common classes of employment.
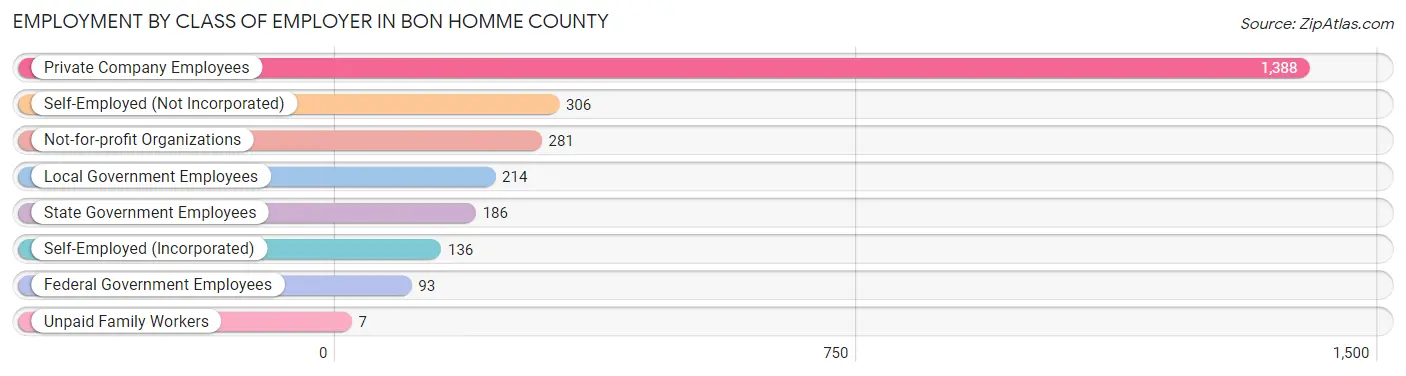
| Employer Class | # Employees | % Employees |
| Private Company Employees | 1,388 | 53.2% |
| Self-Employed (Incorporated) | 136 | 5.2% |
| Self-Employed (Not Incorporated) | 306 | 11.7% |
| Not-for-profit Organizations | 281 | 10.8% |
| Local Government Employees | 214 | 8.2% |
| State Government Employees | 186 | 7.1% |
| Federal Government Employees | 93 | 3.6% |
| Unpaid Family Workers | 7 | 0.3% |
| Total | 2,611 | 100.0% |
Employment Status by Age in Bon Homme County
According to the labor force statistics for Bon Homme County, out of the total population over 16 years of age (5,889), 46.2% or 2,721 individuals are in the labor force, with 2.2% or 60 of them unemployed. The age group with the highest labor force participation rate is 55 to 59 years, with 65.3% or 280 individuals in the labor force. Within the labor force, the 20 to 24 years age range has the highest percentage of unemployed individuals, with 7.4% or 23 of them being unemployed.
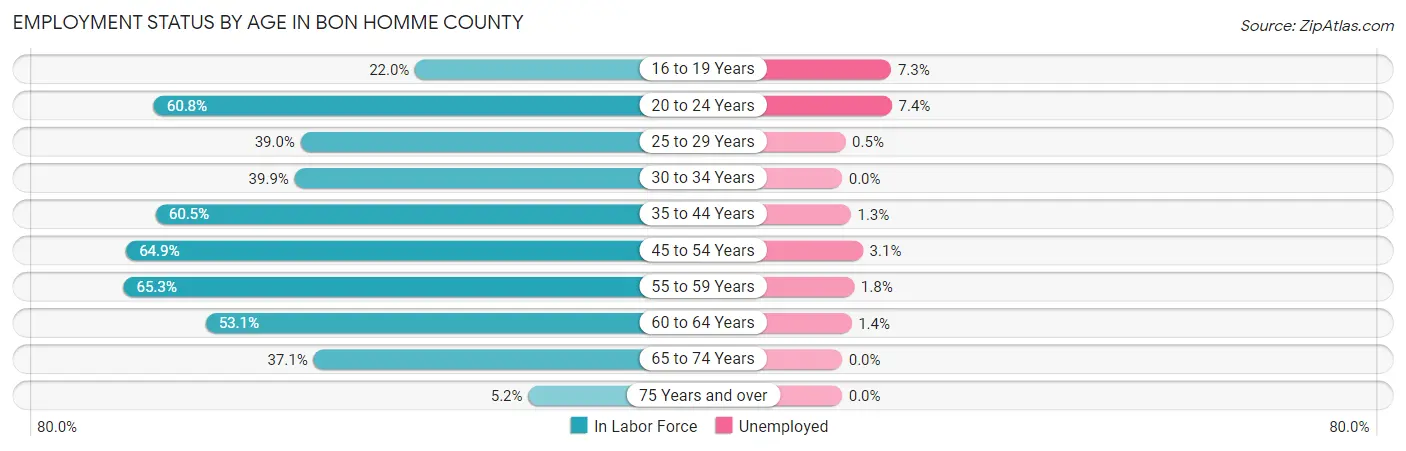
| Age Bracket | In Labor Force | Unemployed |
| 16 to 19 Years | 45 (22.0%) | 3 (7.3%) |
| 20 to 24 Years | 312 (60.8%) | 23 (7.4%) |
| 25 to 29 Years | 194 (39.0%) | 1 (0.5%) |
| 30 to 34 Years | 203 (39.9%) | 0 (0.0%) |
| 35 to 44 Years | 526 (60.5%) | 7 (1.3%) |
| 45 to 54 Years | 550 (64.9%) | 17 (3.1%) |
| 55 to 59 Years | 280 (65.3%) | 5 (1.8%) |
| 60 to 64 Years | 281 (53.1%) | 4 (1.4%) |
| 65 to 74 Years | 290 (37.1%) | 0 (0.0%) |
| 75 Years and over | 37 (5.2%) | 0 (0.0%) |
| Total | 2,721 (46.2%) | 60 (2.2%) |
Employment Status by Educational Attainment in Bon Homme County
According to labor force statistics for Bon Homme County, 55.3% of individuals (2,036) out of the total population between 25 and 64 years of age (3,681) are in the labor force, with 1.7% or 35 of them being unemployed. The group with the highest labor force participation rate are those with the educational attainment of bachelor's degree or higher, with 88.3% or 604 individuals in the labor force. Within the labor force, individuals with less than high school education have the highest percentage of unemployment, with 6.5% or 7 of them being unemployed.
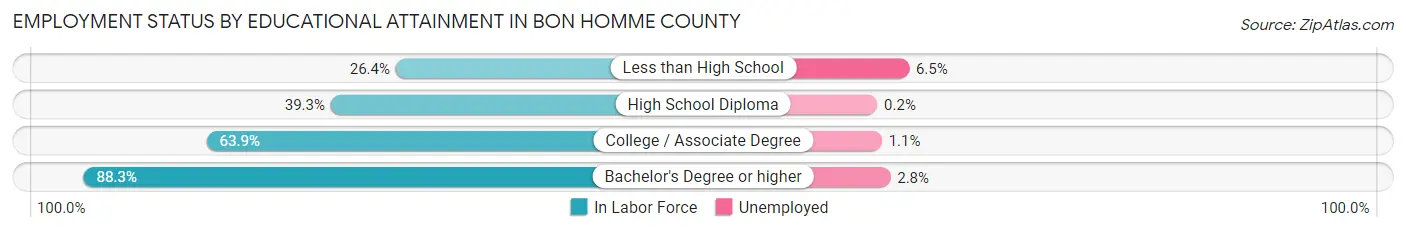
| Educational Attainment | In Labor Force | Unemployed |
| Less than High School | 107 (26.4%) | 26 (6.5%) |
| High School Diploma | 531 (39.3%) | 3 (0.2%) |
| College / Associate Degree | 792 (63.9%) | 14 (1.1%) |
| Bachelor's Degree or higher | 604 (88.3%) | 19 (2.8%) |
| Total | 2,036 (55.3%) | 63 (1.7%) |
Employment Occupations by Sex in Bon Homme County
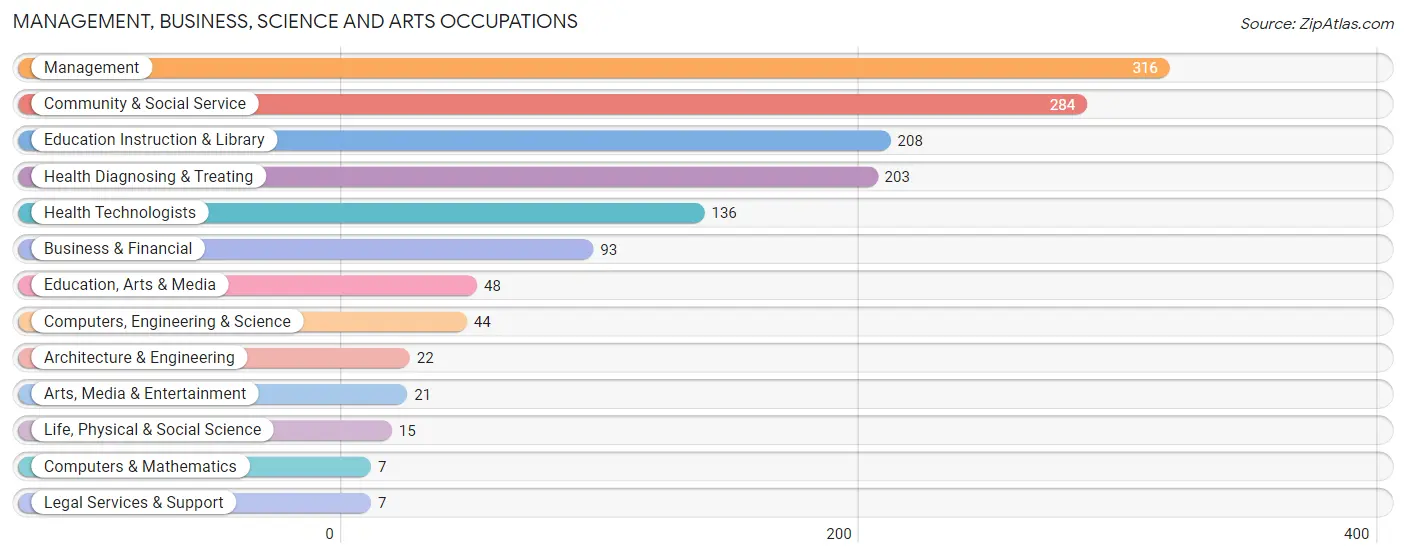
Management, Business, Science and Arts Occupations
The most common Management, Business, Science and Arts occupations in Bon Homme County are Management (316 | 12.0%), Community & Social Service (284 | 10.7%), Education Instruction & Library (208 | 7.9%), Health Diagnosing & Treating (203 | 7.7%), and Health Technologists (136 | 5.1%).
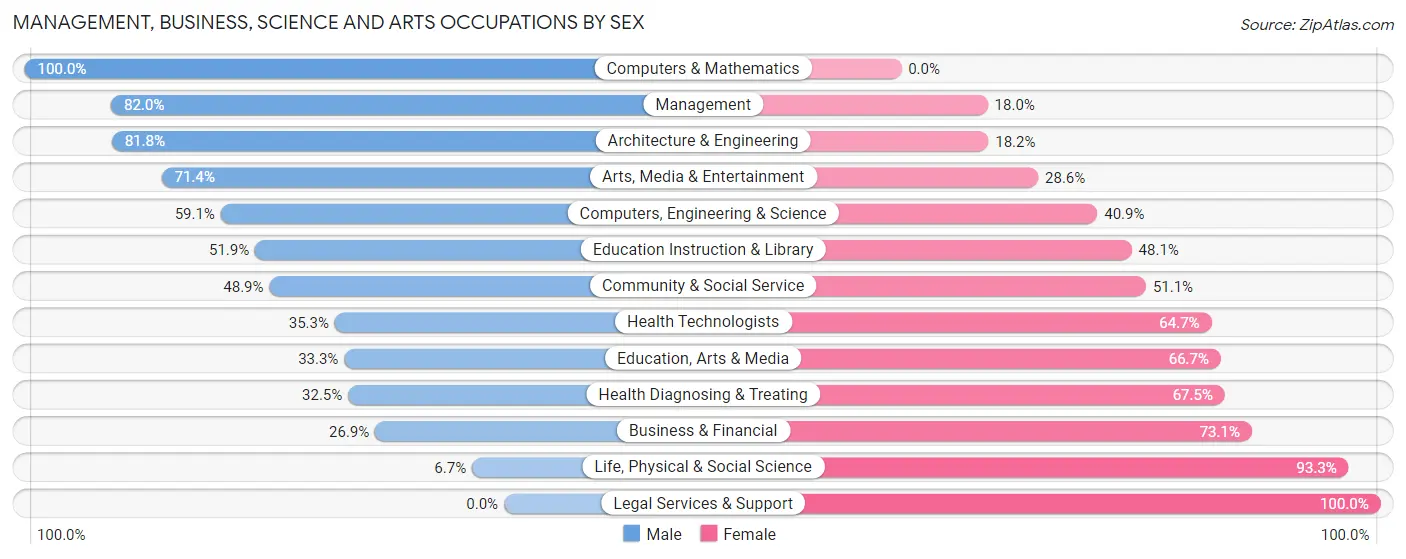
Management, Business, Science and Arts Occupations by Sex
Within the Management, Business, Science and Arts occupations in Bon Homme County, the most male-oriented occupations are Computers & Mathematics (100.0%), Management (82.0%), and Architecture & Engineering (81.8%), while the most female-oriented occupations are Legal Services & Support (100.0%), Life, Physical & Social Science (93.3%), and Business & Financial (73.1%).
| Occupation | Male | Female |
| Management | 259 (82.0%) | 57 (18.0%) |
| Business & Financial | 25 (26.9%) | 68 (73.1%) |
| Computers, Engineering & Science | 26 (59.1%) | 18 (40.9%) |
| Computers & Mathematics | 7 (100.0%) | 0 (0.0%) |
| Architecture & Engineering | 18 (81.8%) | 4 (18.2%) |
| Life, Physical & Social Science | 1 (6.7%) | 14 (93.3%) |
| Community & Social Service | 139 (48.9%) | 145 (51.1%) |
| Education, Arts & Media | 16 (33.3%) | 32 (66.7%) |
| Legal Services & Support | 0 (0.0%) | 7 (100.0%) |
| Education Instruction & Library | 108 (51.9%) | 100 (48.1%) |
| Arts, Media & Entertainment | 15 (71.4%) | 6 (28.6%) |
| Health Diagnosing & Treating | 66 (32.5%) | 137 (67.5%) |
| Health Technologists | 48 (35.3%) | 88 (64.7%) |
| Total (Category) | 515 (54.8%) | 425 (45.2%) |
| Total (Overall) | 1,473 (55.7%) | 1,169 (44.3%) |
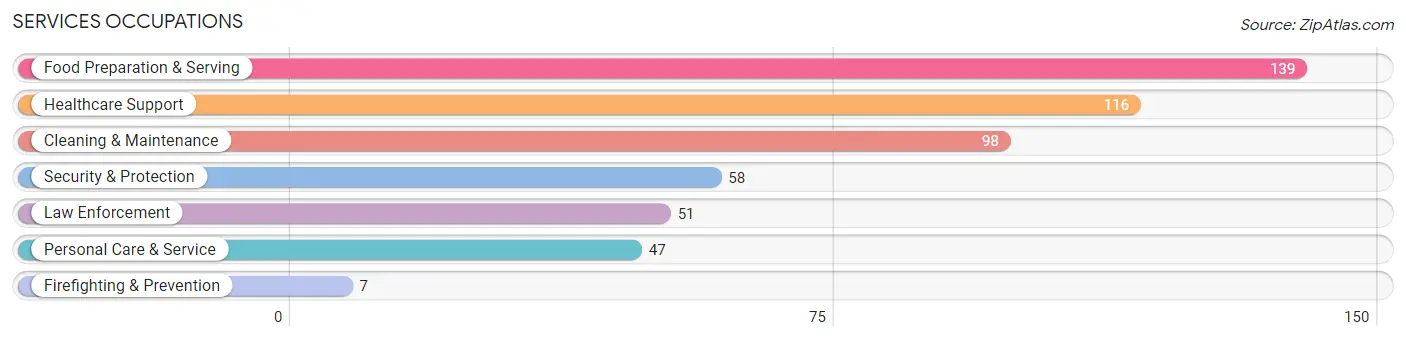
Services Occupations
The most common Services occupations in Bon Homme County are Food Preparation & Serving (139 | 5.3%), Healthcare Support (116 | 4.4%), Cleaning & Maintenance (98 | 3.7%), Security & Protection (58 | 2.2%), and Law Enforcement (51 | 1.9%).
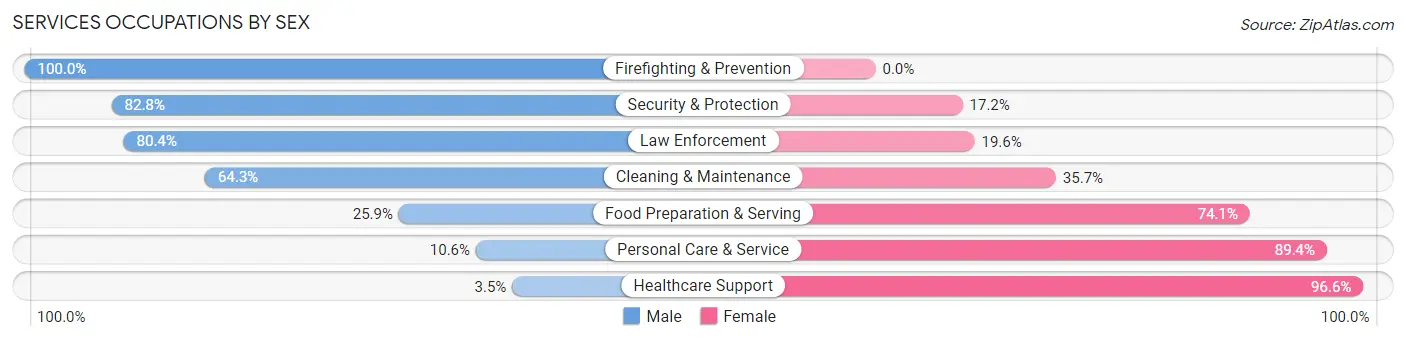
Services Occupations by Sex
Within the Services occupations in Bon Homme County, the most male-oriented occupations are Firefighting & Prevention (100.0%), Security & Protection (82.8%), and Law Enforcement (80.4%), while the most female-oriented occupations are Healthcare Support (96.6%), Personal Care & Service (89.4%), and Food Preparation & Serving (74.1%).
| Occupation | Male | Female |
| Healthcare Support | 4 (3.5%) | 112 (96.6%) |
| Security & Protection | 48 (82.8%) | 10 (17.2%) |
| Firefighting & Prevention | 7 (100.0%) | 0 (0.0%) |
| Law Enforcement | 41 (80.4%) | 10 (19.6%) |
| Food Preparation & Serving | 36 (25.9%) | 103 (74.1%) |
| Cleaning & Maintenance | 63 (64.3%) | 35 (35.7%) |
| Personal Care & Service | 5 (10.6%) | 42 (89.4%) |
| Total (Category) | 156 (34.1%) | 302 (65.9%) |
| Total (Overall) | 1,473 (55.7%) | 1,169 (44.3%) |
Sales and Office Occupations
The most common Sales and Office occupations in Bon Homme County are Office & Administration (276 | 10.4%), and Sales & Related (148 | 5.6%).
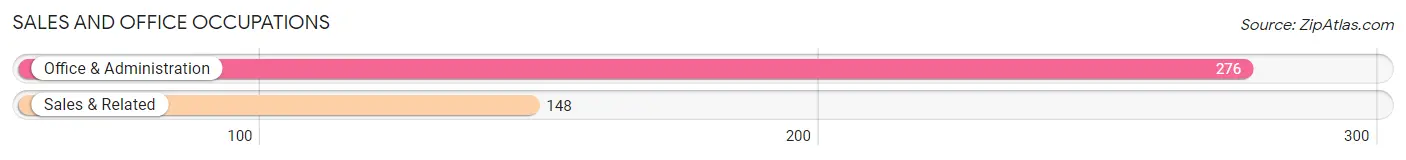
Sales and Office Occupations by Sex
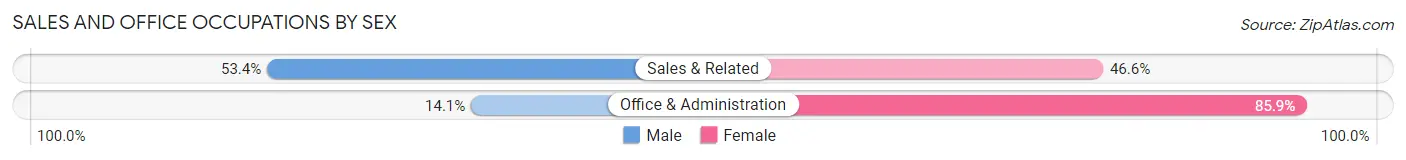
| Occupation | Male | Female |
| Sales & Related | 79 (53.4%) | 69 (46.6%) |
| Office & Administration | 39 (14.1%) | 237 (85.9%) |
| Total (Category) | 118 (27.8%) | 306 (72.2%) |
| Total (Overall) | 1,473 (55.7%) | 1,169 (44.3%) |
Natural Resources, Construction and Maintenance Occupations
The most common Natural Resources, Construction and Maintenance occupations in Bon Homme County are Installation, Maintenance & Repair (170 | 6.4%), Construction & Extraction (123 | 4.7%), and Farming, Fishing & Forestry (35 | 1.3%).
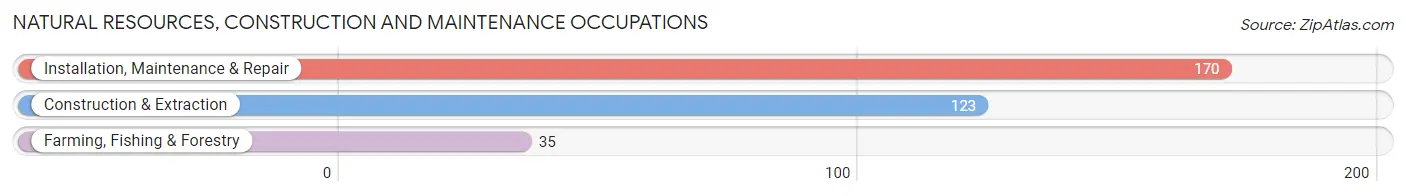
Natural Resources, Construction and Maintenance Occupations by Sex
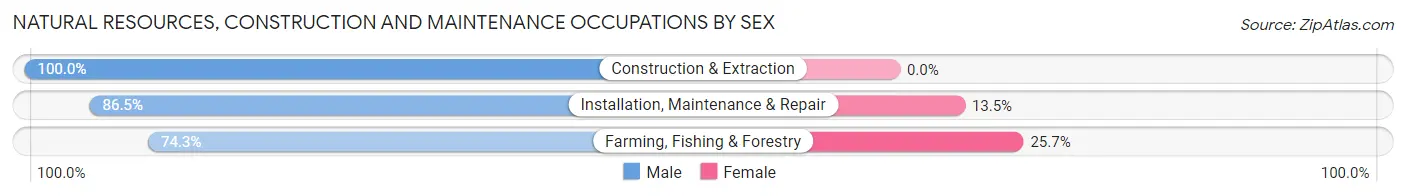
| Occupation | Male | Female |
| Farming, Fishing & Forestry | 26 (74.3%) | 9 (25.7%) |
| Construction & Extraction | 123 (100.0%) | 0 (0.0%) |
| Installation, Maintenance & Repair | 147 (86.5%) | 23 (13.5%) |
| Total (Category) | 296 (90.2%) | 32 (9.8%) |
| Total (Overall) | 1,473 (55.7%) | 1,169 (44.3%) |
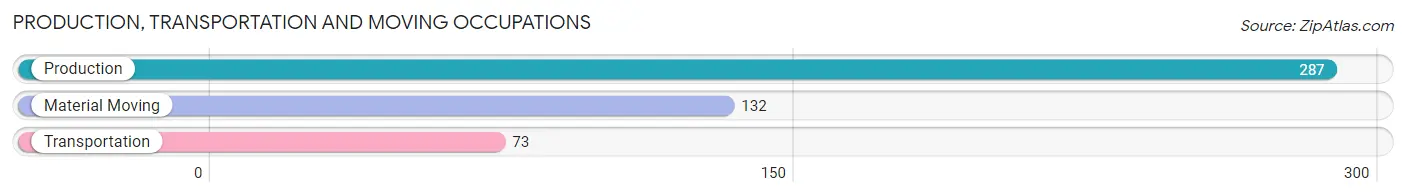
Production, Transportation and Moving Occupations
The most common Production, Transportation and Moving occupations in Bon Homme County are Production (287 | 10.9%), Material Moving (132 | 5.0%), and Transportation (73 | 2.8%).
Production, Transportation and Moving Occupations by Sex
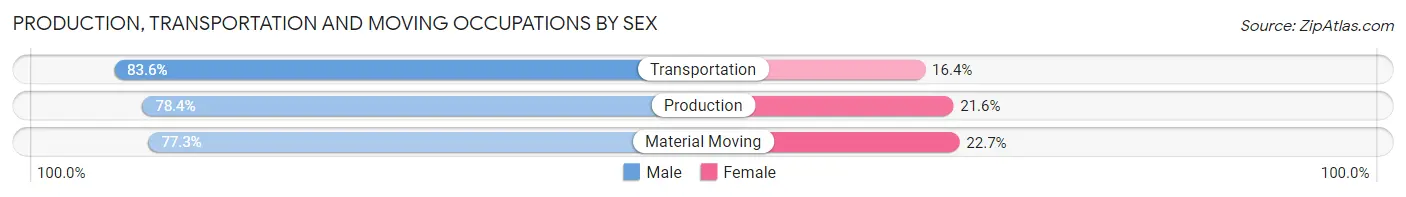
| Occupation | Male | Female |
| Production | 225 (78.4%) | 62 (21.6%) |
| Transportation | 61 (83.6%) | 12 (16.4%) |
| Material Moving | 102 (77.3%) | 30 (22.7%) |
| Total (Category) | 388 (78.9%) | 104 (21.1%) |
| Total (Overall) | 1,473 (55.7%) | 1,169 (44.3%) |
Employment Industries by Sex in Bon Homme County
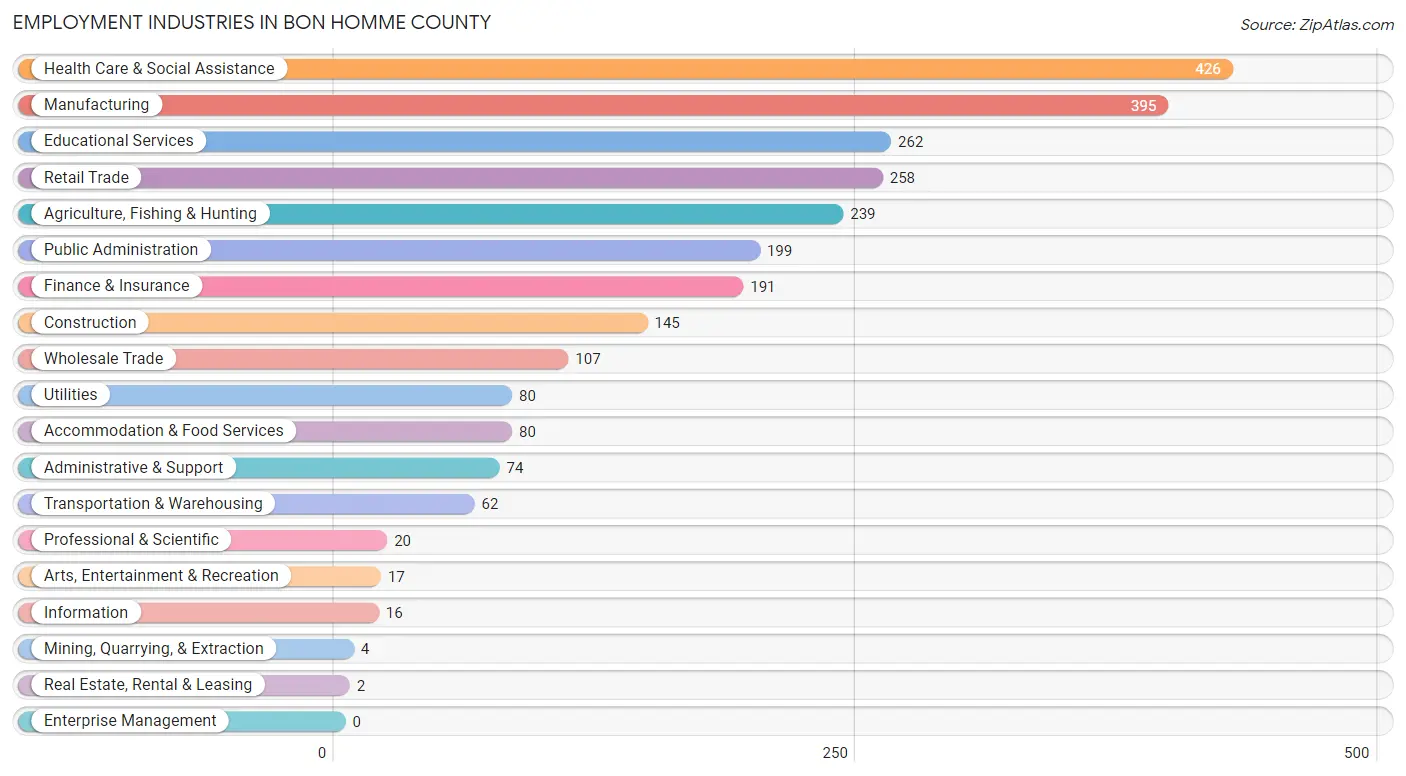
Employment Industries in Bon Homme County
The major employment industries in Bon Homme County include Health Care & Social Assistance (426 | 16.1%), Manufacturing (395 | 14.9%), Educational Services (262 | 9.9%), Retail Trade (258 | 9.8%), and Agriculture, Fishing & Hunting (239 | 9.0%).
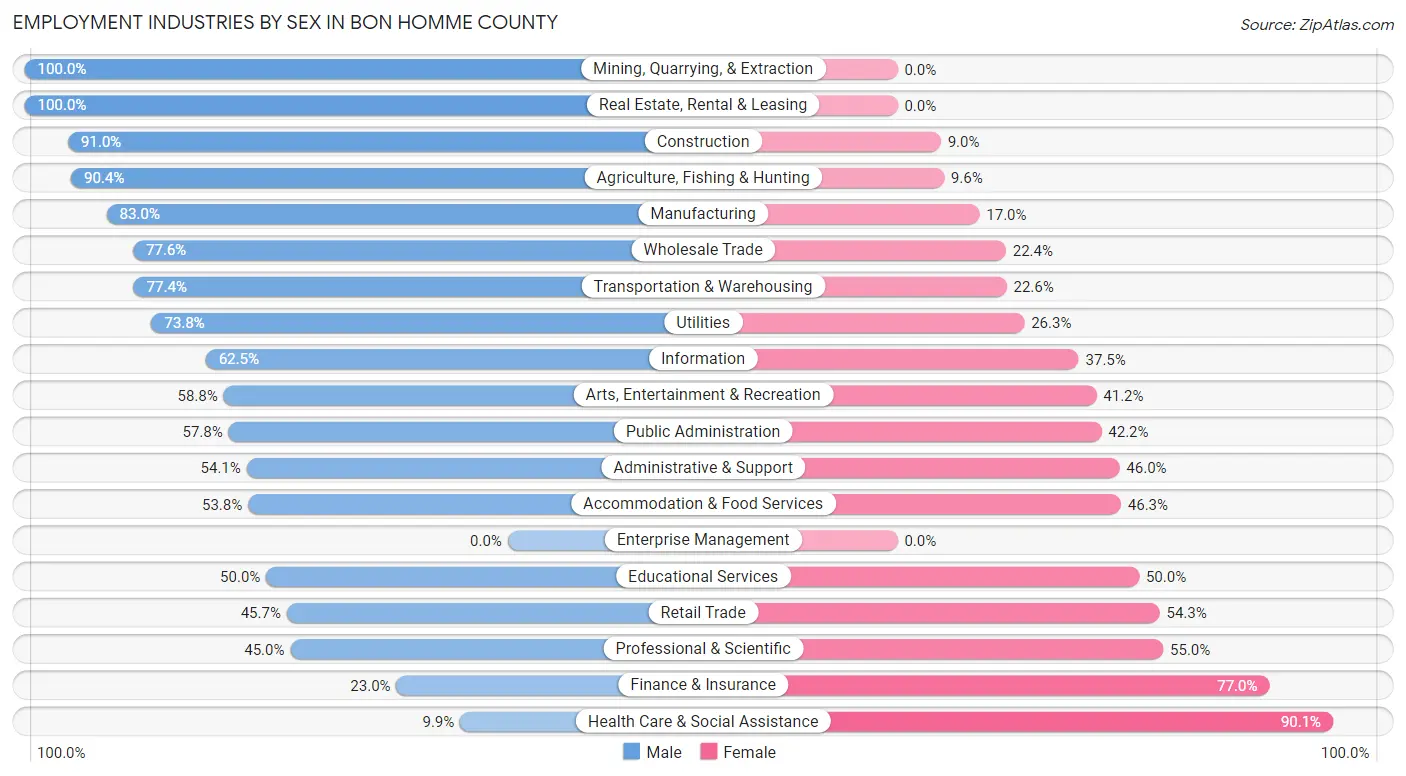
Employment Industries by Sex in Bon Homme County
The Bon Homme County industries that see more men than women are Mining, Quarrying, & Extraction (100.0%), Real Estate, Rental & Leasing (100.0%), and Construction (91.0%), whereas the industries that tend to have a higher number of women are Health Care & Social Assistance (90.1%), Finance & Insurance (77.0%), and Professional & Scientific (55.0%).
| Industry | Male | Female |
| Agriculture, Fishing & Hunting | 216 (90.4%) | 23 (9.6%) |
| Mining, Quarrying, & Extraction | 4 (100.0%) | 0 (0.0%) |
| Construction | 132 (91.0%) | 13 (9.0%) |
| Manufacturing | 328 (83.0%) | 67 (17.0%) |
| Wholesale Trade | 83 (77.6%) | 24 (22.4%) |
| Retail Trade | 118 (45.7%) | 140 (54.3%) |
| Transportation & Warehousing | 48 (77.4%) | 14 (22.6%) |
| Utilities | 59 (73.8%) | 21 (26.3%) |
| Information | 10 (62.5%) | 6 (37.5%) |
| Finance & Insurance | 44 (23.0%) | 147 (77.0%) |
| Real Estate, Rental & Leasing | 2 (100.0%) | 0 (0.0%) |
| Professional & Scientific | 9 (45.0%) | 11 (55.0%) |
| Enterprise Management | 0 (0.0%) | 0 (0.0%) |
| Administrative & Support | 40 (54.0%) | 34 (46.0%) |
| Educational Services | 131 (50.0%) | 131 (50.0%) |
| Health Care & Social Assistance | 42 (9.9%) | 384 (90.1%) |
| Arts, Entertainment & Recreation | 10 (58.8%) | 7 (41.2%) |
| Accommodation & Food Services | 43 (53.7%) | 37 (46.3%) |
| Public Administration | 115 (57.8%) | 84 (42.2%) |
| Total | 1,473 (55.7%) | 1,169 (44.3%) |
Education in Bon Homme County
School Enrollment in Bon Homme County
The most common levels of schooling among the 1,249 students in Bon Homme County are high school (353 | 28.3%), middle school (310 | 24.8%), and elementary school (250 | 20.0%).
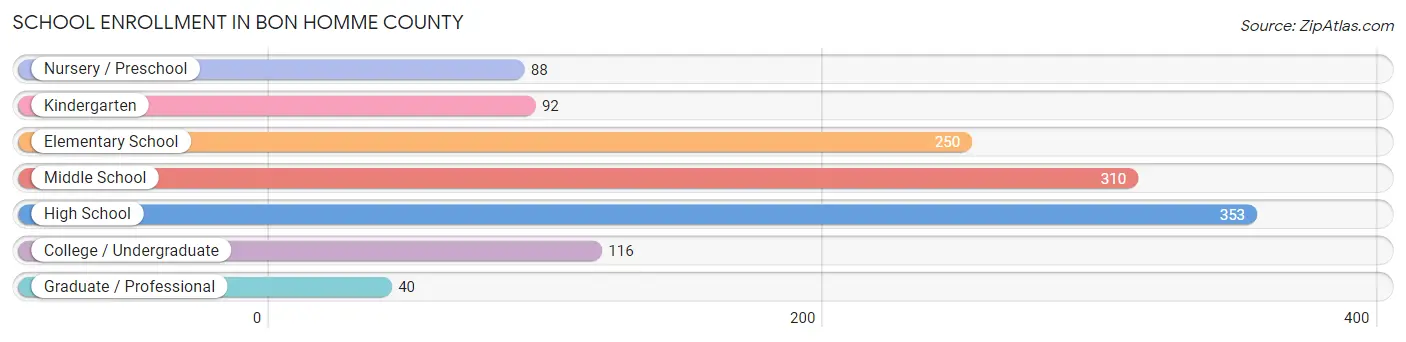
| School Level | # Students | % Students |
| Nursery / Preschool | 88 | 7.0% |
| Kindergarten | 92 | 7.4% |
| Elementary School | 250 | 20.0% |
| Middle School | 310 | 24.8% |
| High School | 353 | 28.3% |
| College / Undergraduate | 116 | 9.3% |
| Graduate / Professional | 40 | 3.2% |
| Total | 1,249 | 100.0% |
School Enrollment by Age by Funding Source in Bon Homme County
Out of a total of 1,249 students who are enrolled in schools in Bon Homme County, 207 (16.6%) attend a private institution, while the remaining 1,042 (83.4%) are enrolled in public schools. The age group of 10 to 14 year olds has the highest likelihood of being enrolled in private schools, with 90 (22.1% in the age bracket) enrolled. Conversely, the age group of 20 to 24 year olds has the lowest likelihood of being enrolled in a private school, with 59 (93.6% in the age bracket) attending a public institution.
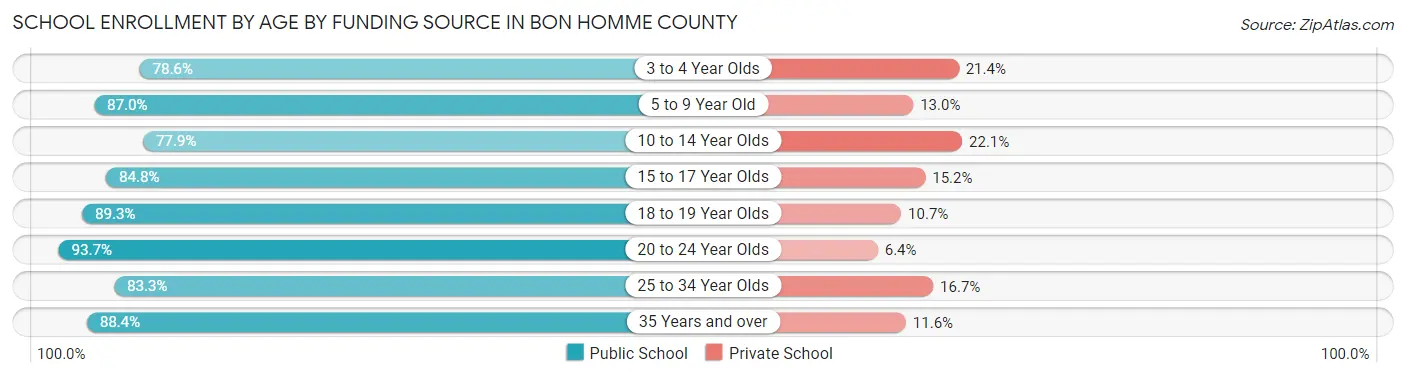
| Age Bracket | Public School | Private School |
| 3 to 4 Year Olds | 44 (78.6%) | 12 (21.4%) |
| 5 to 9 Year Old | 262 (87.0%) | 39 (13.0%) |
| 10 to 14 Year Olds | 318 (77.9%) | 90 (22.1%) |
| 15 to 17 Year Olds | 173 (84.8%) | 31 (15.2%) |
| 18 to 19 Year Olds | 25 (89.3%) | 3 (10.7%) |
| 20 to 24 Year Olds | 59 (93.6%) | 4 (6.4%) |
| 25 to 34 Year Olds | 100 (83.3%) | 20 (16.7%) |
| 35 Years and over | 61 (88.4%) | 8 (11.6%) |
| Total | 1,042 (83.4%) | 207 (16.6%) |
Educational Attainment by Field of Study in Bon Homme County
Education (283 | 25.3%), science & technology (126 | 11.3%), business (125 | 11.2%), bio, nature & agricultural (89 | 8.0%), and arts & humanities (89 | 8.0%) are the most common fields of study among 1,119 individuals in Bon Homme County who have obtained a bachelor's degree or higher.
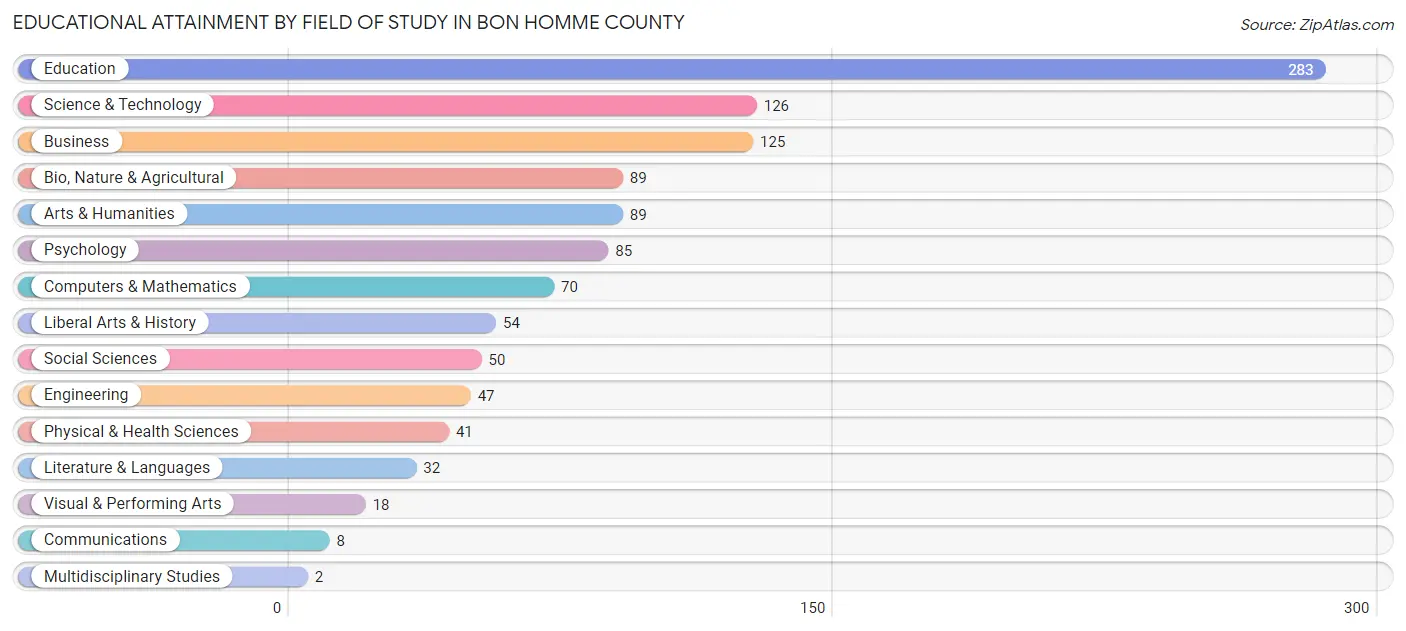
| Field of Study | # Graduates | % Graduates |
| Computers & Mathematics | 70 | 6.3% |
| Bio, Nature & Agricultural | 89 | 8.0% |
| Physical & Health Sciences | 41 | 3.7% |
| Psychology | 85 | 7.6% |
| Social Sciences | 50 | 4.5% |
| Engineering | 47 | 4.2% |
| Multidisciplinary Studies | 2 | 0.2% |
| Science & Technology | 126 | 11.3% |
| Business | 125 | 11.2% |
| Education | 283 | 25.3% |
| Literature & Languages | 32 | 2.9% |
| Liberal Arts & History | 54 | 4.8% |
| Visual & Performing Arts | 18 | 1.6% |
| Communications | 8 | 0.7% |
| Arts & Humanities | 89 | 8.0% |
| Total | 1,119 | 100.0% |
Transportation & Commute in Bon Homme County
Vehicle Availability by Sex in Bon Homme County
The most prevalent vehicle ownership categories in Bon Homme County are males with 2 vehicles (429, accounting for 29.0%) and females with 2 vehicles (341, making up 38.0%).
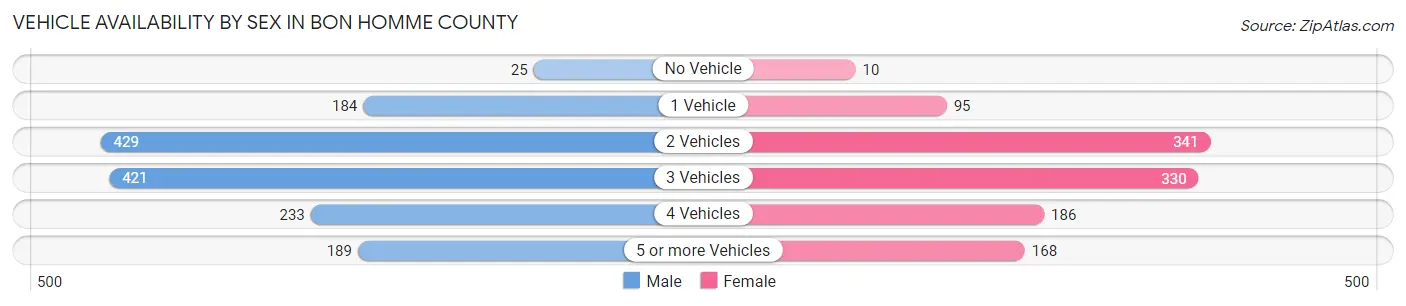
| Vehicles Available | Male | Female |
| No Vehicle | 25 (1.7%) | 10 (0.9%) |
| 1 Vehicle | 184 (12.4%) | 95 (8.4%) |
| 2 Vehicles | 429 (29.0%) | 341 (30.2%) |
| 3 Vehicles | 421 (28.4%) | 330 (29.2%) |
| 4 Vehicles | 233 (15.7%) | 186 (16.5%) |
| 5 or more Vehicles | 189 (12.8%) | 168 (14.9%) |
| Total | 1,481 (100.0%) | 1,130 (100.0%) |
Commute Time in Bon Homme County
The most frequently occuring commute durations in Bon Homme County are less than 5 minutes (411 commuters, 17.0%), 5 to 9 minutes (406 commuters, 16.8%), and 30 to 34 minutes (362 commuters, 15.0%).
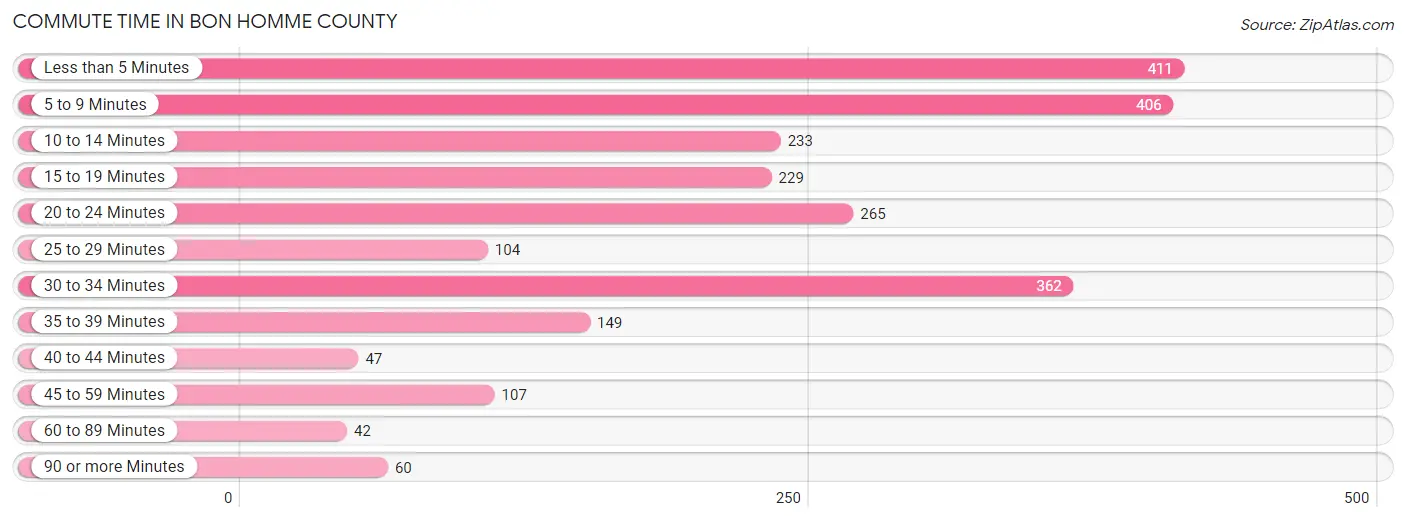
| Commute Time | # Commuters | % Commuters |
| Less than 5 Minutes | 411 | 17.0% |
| 5 to 9 Minutes | 406 | 16.8% |
| 10 to 14 Minutes | 233 | 9.7% |
| 15 to 19 Minutes | 229 | 9.5% |
| 20 to 24 Minutes | 265 | 11.0% |
| 25 to 29 Minutes | 104 | 4.3% |
| 30 to 34 Minutes | 362 | 15.0% |
| 35 to 39 Minutes | 149 | 6.2% |
| 40 to 44 Minutes | 47 | 1.9% |
| 45 to 59 Minutes | 107 | 4.4% |
| 60 to 89 Minutes | 42 | 1.7% |
| 90 or more Minutes | 60 | 2.5% |
Commute Time by Sex in Bon Homme County
The most common commute times in Bon Homme County are less than 5 minutes (266 commuters, 19.7%) for males and 5 to 9 minutes (196 commuters, 18.4%) for females.
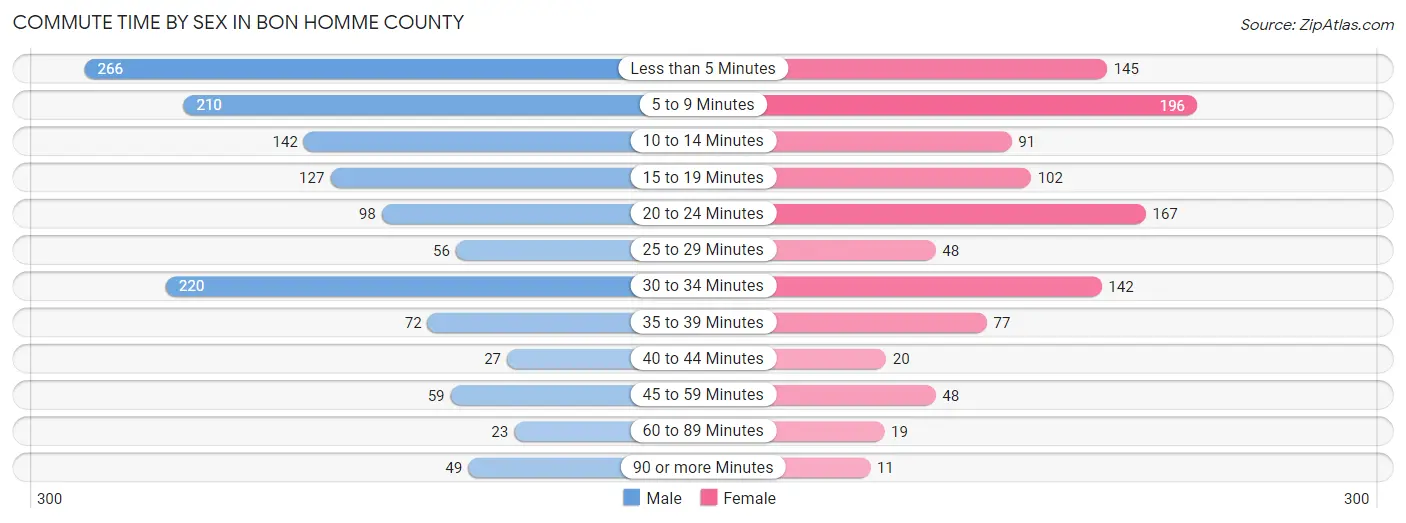
| Commute Time | Male | Female |
| Less than 5 Minutes | 266 (19.7%) | 145 (13.6%) |
| 5 to 9 Minutes | 210 (15.6%) | 196 (18.4%) |
| 10 to 14 Minutes | 142 (10.5%) | 91 (8.5%) |
| 15 to 19 Minutes | 127 (9.4%) | 102 (9.6%) |
| 20 to 24 Minutes | 98 (7.3%) | 167 (15.7%) |
| 25 to 29 Minutes | 56 (4.2%) | 48 (4.5%) |
| 30 to 34 Minutes | 220 (16.3%) | 142 (13.3%) |
| 35 to 39 Minutes | 72 (5.3%) | 77 (7.2%) |
| 40 to 44 Minutes | 27 (2.0%) | 20 (1.9%) |
| 45 to 59 Minutes | 59 (4.4%) | 48 (4.5%) |
| 60 to 89 Minutes | 23 (1.7%) | 19 (1.8%) |
| 90 or more Minutes | 49 (3.6%) | 11 (1.0%) |
Time of Departure to Work by Sex in Bon Homme County
The most frequent times of departure to work in Bon Homme County are 7:00 AM to 7:29 AM (276, 20.5%) for males and 7:30 AM to 7:59 AM (277, 26.0%) for females.
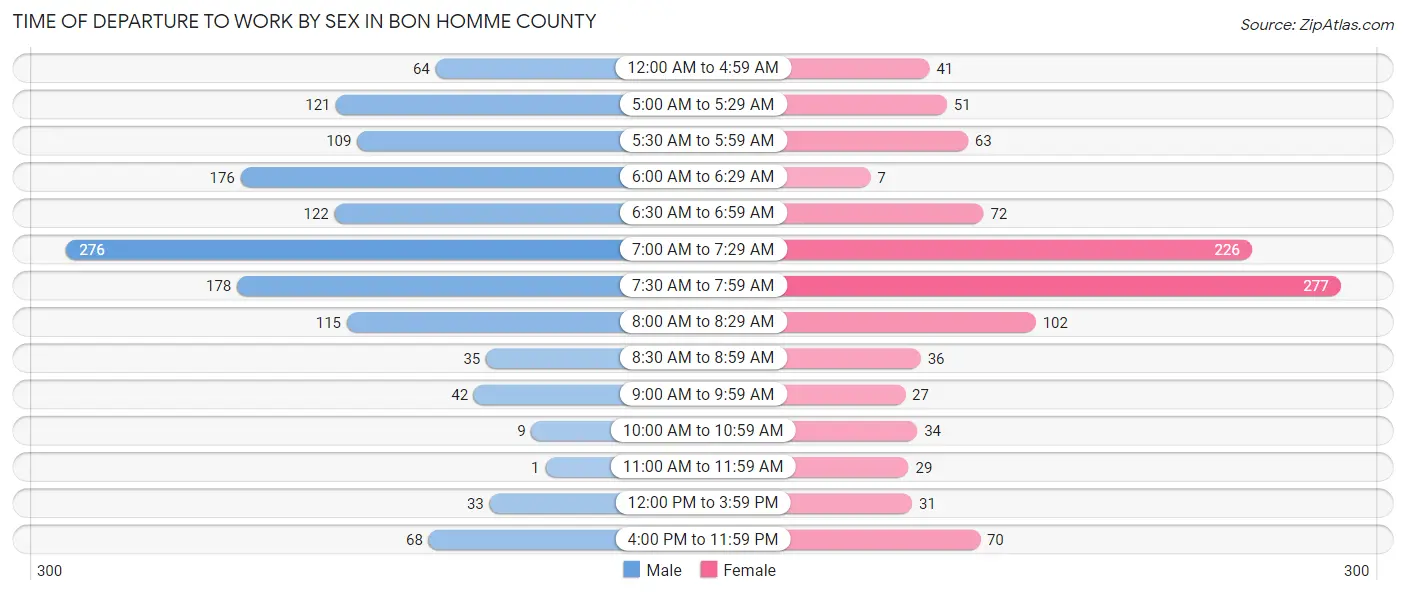
| Time of Departure | Male | Female |
| 12:00 AM to 4:59 AM | 64 (4.7%) | 41 (3.8%) |
| 5:00 AM to 5:29 AM | 121 (9.0%) | 51 (4.8%) |
| 5:30 AM to 5:59 AM | 109 (8.1%) | 63 (5.9%) |
| 6:00 AM to 6:29 AM | 176 (13.1%) | 7 (0.7%) |
| 6:30 AM to 6:59 AM | 122 (9.0%) | 72 (6.8%) |
| 7:00 AM to 7:29 AM | 276 (20.5%) | 226 (21.2%) |
| 7:30 AM to 7:59 AM | 178 (13.2%) | 277 (26.0%) |
| 8:00 AM to 8:29 AM | 115 (8.5%) | 102 (9.6%) |
| 8:30 AM to 8:59 AM | 35 (2.6%) | 36 (3.4%) |
| 9:00 AM to 9:59 AM | 42 (3.1%) | 27 (2.5%) |
| 10:00 AM to 10:59 AM | 9 (0.7%) | 34 (3.2%) |
| 11:00 AM to 11:59 AM | 1 (0.1%) | 29 (2.7%) |
| 12:00 PM to 3:59 PM | 33 (2.5%) | 31 (2.9%) |
| 4:00 PM to 11:59 PM | 68 (5.0%) | 70 (6.6%) |
| Total | 1,349 (100.0%) | 1,066 (100.0%) |
Housing Occupancy in Bon Homme County
Occupancy by Ownership in Bon Homme County
Of the total 2,414 dwellings in Bon Homme County, owner-occupied units account for 1,844 (76.4%), while renter-occupied units make up 570 (23.6%).
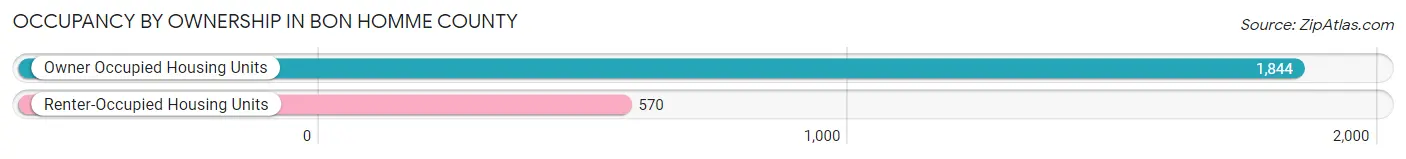
| Occupancy | # Housing Units | % Housing Units |
| Owner Occupied Housing Units | 1,844 | 76.4% |
| Renter-Occupied Housing Units | 570 | 23.6% |
| Total Occupied Housing Units | 2,414 | 100.0% |
Occupancy by Household Size in Bon Homme County
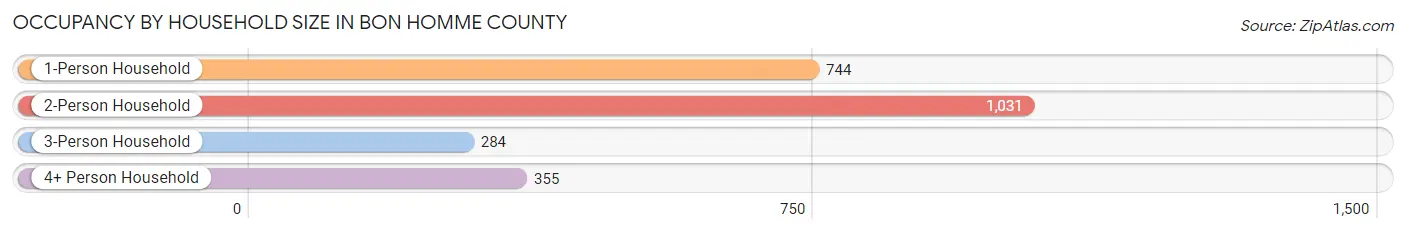
| Household Size | # Housing Units | % Housing Units |
| 1-Person Household | 744 | 30.8% |
| 2-Person Household | 1,031 | 42.7% |
| 3-Person Household | 284 | 11.8% |
| 4+ Person Household | 355 | 14.7% |
| Total Housing Units | 2,414 | 100.0% |
Occupancy by Ownership by Household Size in Bon Homme County
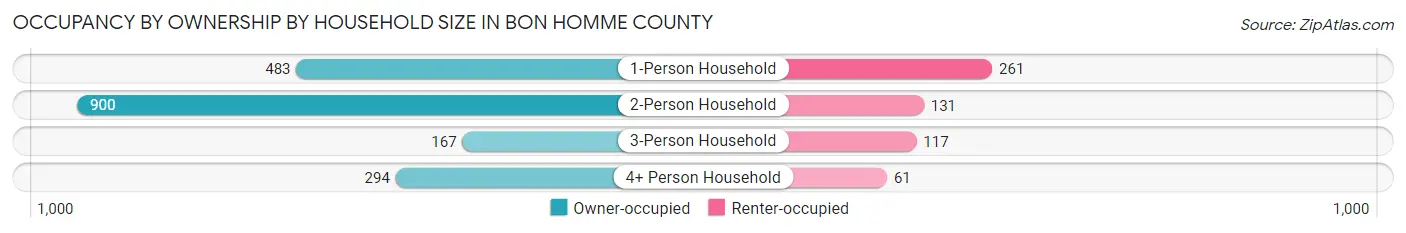
| Household Size | Owner-occupied | Renter-occupied |
| 1-Person Household | 483 (64.9%) | 261 (35.1%) |
| 2-Person Household | 900 (87.3%) | 131 (12.7%) |
| 3-Person Household | 167 (58.8%) | 117 (41.2%) |
| 4+ Person Household | 294 (82.8%) | 61 (17.2%) |
| Total Housing Units | 1,844 (76.4%) | 570 (23.6%) |
Occupancy by Educational Attainment in Bon Homme County
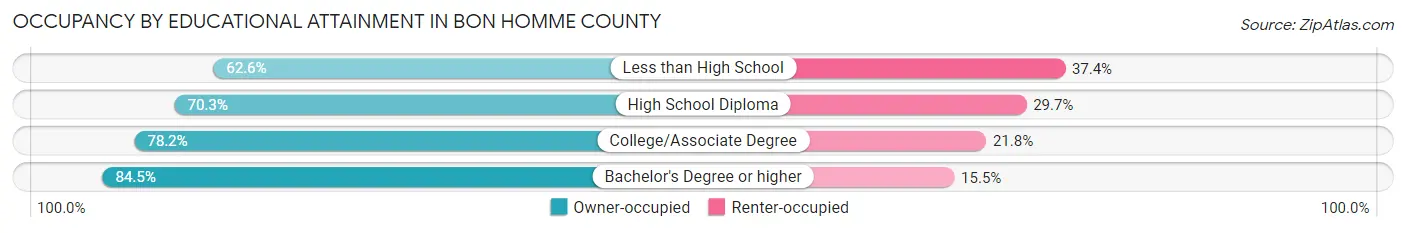
| Household Size | Owner-occupied | Renter-occupied |
| Less than High School | 107 (62.6%) | 64 (37.4%) |
| High School Diploma | 534 (70.3%) | 226 (29.7%) |
| College/Associate Degree | 629 (78.2%) | 175 (21.8%) |
| Bachelor's Degree or higher | 574 (84.5%) | 105 (15.5%) |
Occupancy by Age of Householder in Bon Homme County
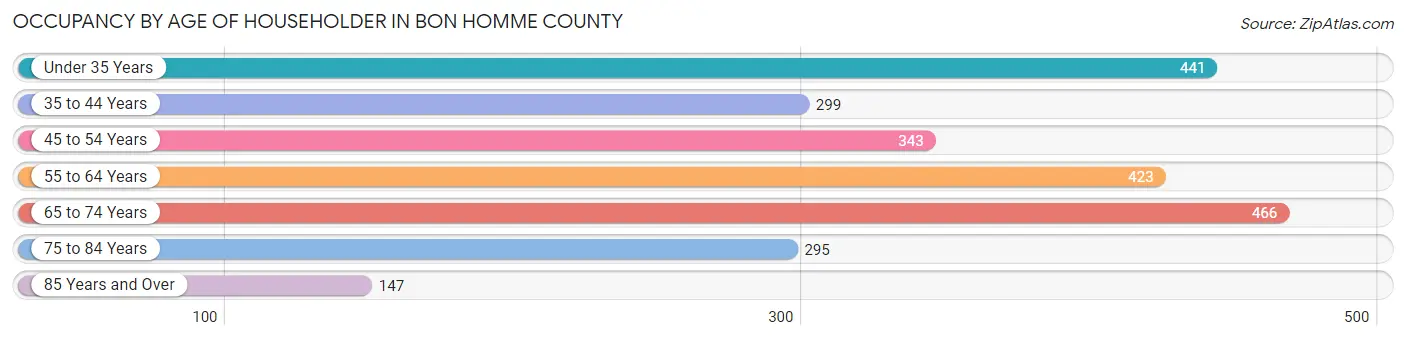
| Age Bracket | # Households | % Households |
| Under 35 Years | 441 | 18.3% |
| 35 to 44 Years | 299 | 12.4% |
| 45 to 54 Years | 343 | 14.2% |
| 55 to 64 Years | 423 | 17.5% |
| 65 to 74 Years | 466 | 19.3% |
| 75 to 84 Years | 295 | 12.2% |
| 85 Years and Over | 147 | 6.1% |
| Total | 2,414 | 100.0% |
Housing Finances in Bon Homme County
Median Income by Occupancy in Bon Homme County
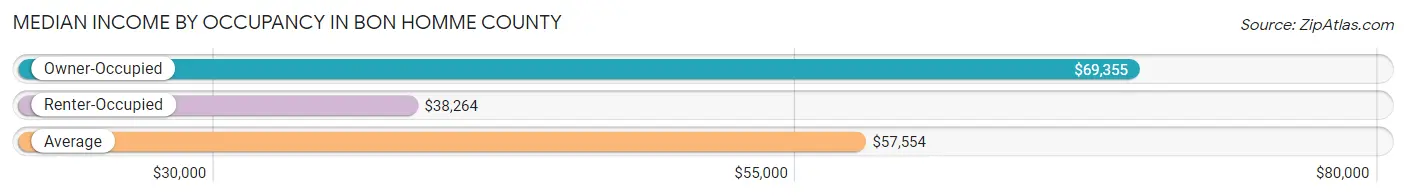
| Occupancy Type | # Households | Median Income |
| Owner-Occupied | 1,844 (76.4%) | $69,355 |
| Renter-Occupied | 570 (23.6%) | $38,264 |
| Average | 2,414 (100.0%) | $57,554 |
Occupancy by Householder Income Bracket in Bon Homme County
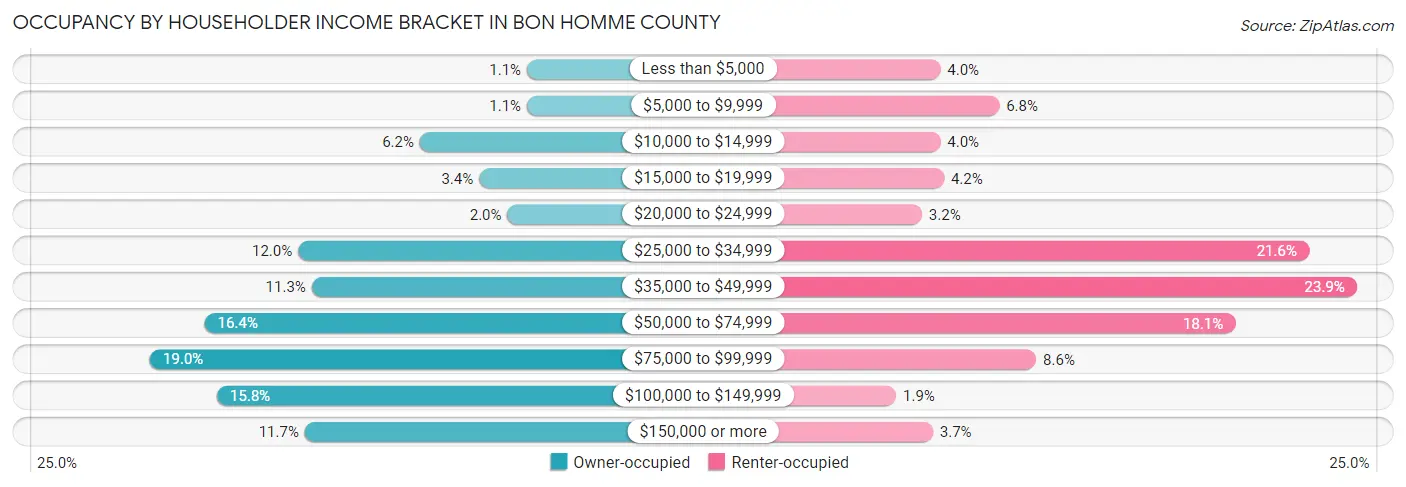
| Income Bracket | Owner-occupied | Renter-occupied |
| Less than $5,000 | 20 (1.1%) | 23 (4.0%) |
| $5,000 to $9,999 | 20 (1.1%) | 39 (6.8%) |
| $10,000 to $14,999 | 114 (6.2%) | 23 (4.0%) |
| $15,000 to $19,999 | 62 (3.4%) | 24 (4.2%) |
| $20,000 to $24,999 | 37 (2.0%) | 18 (3.2%) |
| $25,000 to $34,999 | 221 (12.0%) | 123 (21.6%) |
| $35,000 to $49,999 | 209 (11.3%) | 136 (23.9%) |
| $50,000 to $74,999 | 303 (16.4%) | 103 (18.1%) |
| $75,000 to $99,999 | 351 (19.0%) | 49 (8.6%) |
| $100,000 to $149,999 | 292 (15.8%) | 11 (1.9%) |
| $150,000 or more | 215 (11.7%) | 21 (3.7%) |
| Total | 1,844 (100.0%) | 570 (100.0%) |
Monthly Housing Cost Tiers in Bon Homme County
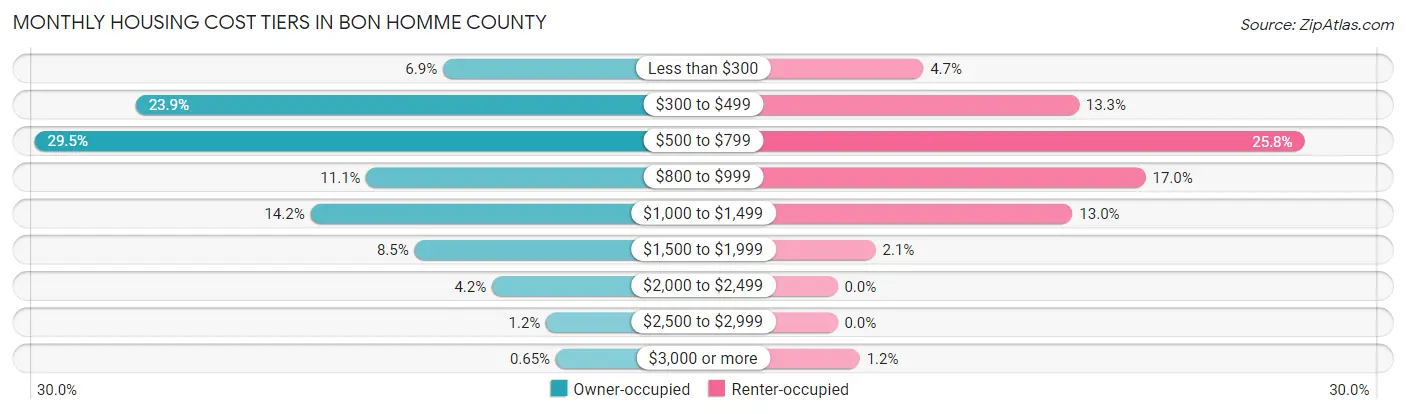
| Monthly Cost | Owner-occupied | Renter-occupied |
| Less than $300 | 127 (6.9%) | 27 (4.7%) |
| $300 to $499 | 440 (23.9%) | 76 (13.3%) |
| $500 to $799 | 543 (29.4%) | 147 (25.8%) |
| $800 to $999 | 205 (11.1%) | 97 (17.0%) |
| $1,000 to $1,499 | 262 (14.2%) | 74 (13.0%) |
| $1,500 to $1,999 | 156 (8.5%) | 12 (2.1%) |
| $2,000 to $2,499 | 77 (4.2%) | 0 (0.0%) |
| $2,500 to $2,999 | 22 (1.2%) | 0 (0.0%) |
| $3,000 or more | 12 (0.6%) | 7 (1.2%) |
| Total | 1,844 (100.0%) | 570 (100.0%) |
Physical Housing Characteristics in Bon Homme County
Housing Structures in Bon Homme County
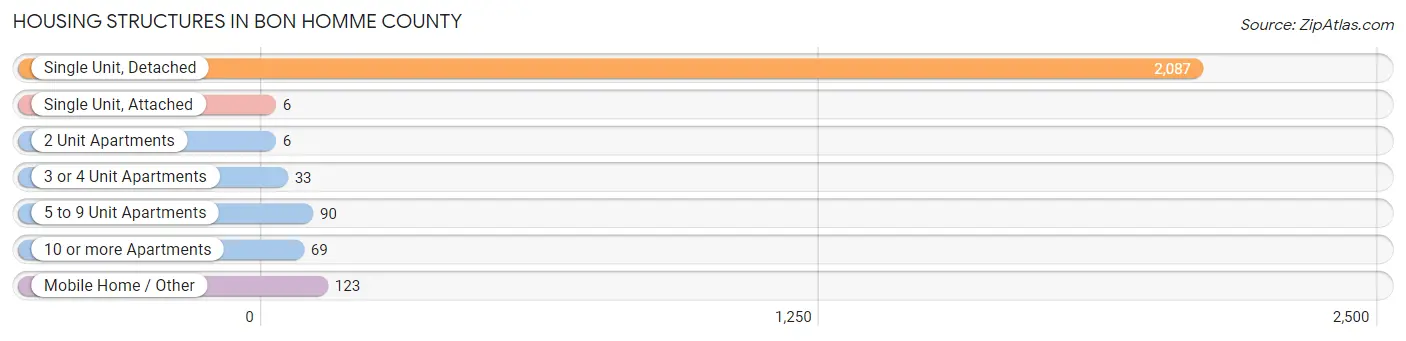
| Structure Type | # Housing Units | % Housing Units |
| Single Unit, Detached | 2,087 | 86.5% |
| Single Unit, Attached | 6 | 0.3% |
| 2 Unit Apartments | 6 | 0.3% |
| 3 or 4 Unit Apartments | 33 | 1.4% |
| 5 to 9 Unit Apartments | 90 | 3.7% |
| 10 or more Apartments | 69 | 2.9% |
| Mobile Home / Other | 123 | 5.1% |
| Total | 2,414 | 100.0% |
Housing Structures by Occupancy in Bon Homme County
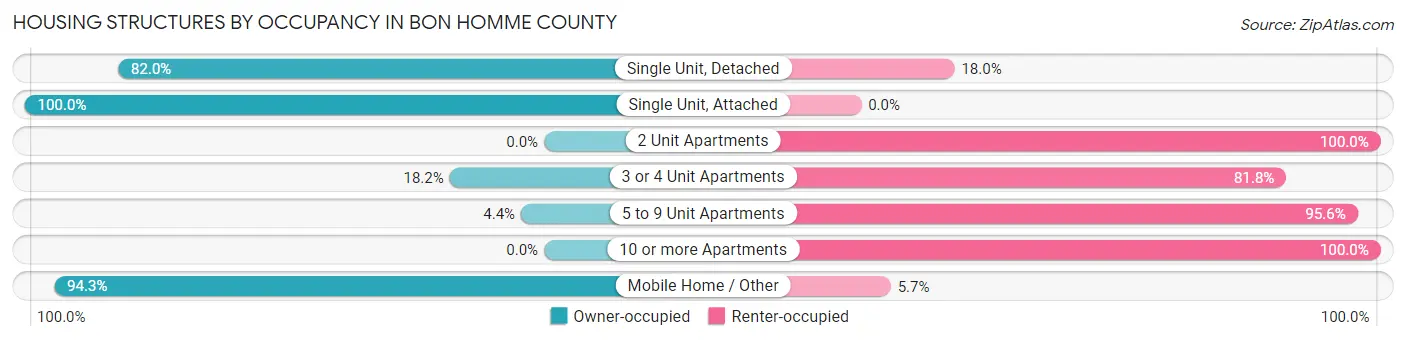
| Structure Type | Owner-occupied | Renter-occupied |
| Single Unit, Detached | 1,712 (82.0%) | 375 (18.0%) |
| Single Unit, Attached | 6 (100.0%) | 0 (0.0%) |
| 2 Unit Apartments | 0 (0.0%) | 6 (100.0%) |
| 3 or 4 Unit Apartments | 6 (18.2%) | 27 (81.8%) |
| 5 to 9 Unit Apartments | 4 (4.4%) | 86 (95.6%) |
| 10 or more Apartments | 0 (0.0%) | 69 (100.0%) |
| Mobile Home / Other | 116 (94.3%) | 7 (5.7%) |
| Total | 1,844 (76.4%) | 570 (23.6%) |
Housing Structures by Number of Rooms in Bon Homme County
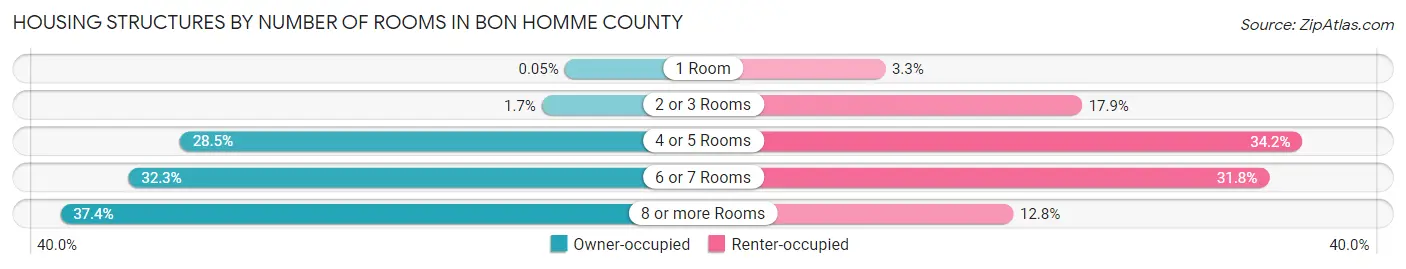
| Number of Rooms | Owner-occupied | Renter-occupied |
| 1 Room | 1 (0.1%) | 19 (3.3%) |
| 2 or 3 Rooms | 32 (1.7%) | 102 (17.9%) |
| 4 or 5 Rooms | 526 (28.5%) | 195 (34.2%) |
| 6 or 7 Rooms | 596 (32.3%) | 181 (31.8%) |
| 8 or more Rooms | 689 (37.4%) | 73 (12.8%) |
| Total | 1,844 (100.0%) | 570 (100.0%) |
Housing Structure by Heating Type in Bon Homme County
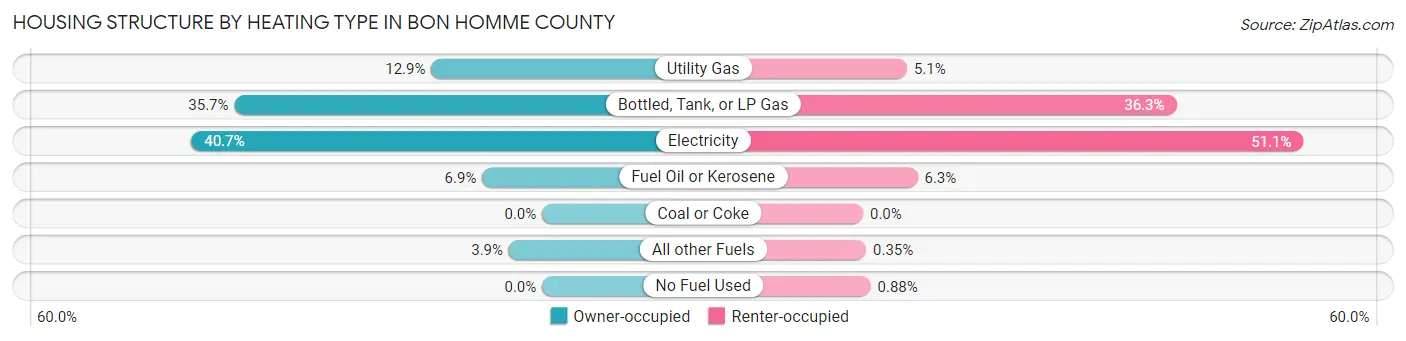
| Heating Type | Owner-occupied | Renter-occupied |
| Utility Gas | 237 (12.9%) | 29 (5.1%) |
| Bottled, Tank, or LP Gas | 658 (35.7%) | 207 (36.3%) |
| Electricity | 750 (40.7%) | 291 (51.0%) |
| Fuel Oil or Kerosene | 128 (6.9%) | 36 (6.3%) |
| Coal or Coke | 0 (0.0%) | 0 (0.0%) |
| All other Fuels | 71 (3.8%) | 2 (0.4%) |
| No Fuel Used | 0 (0.0%) | 5 (0.9%) |
| Total | 1,844 (100.0%) | 570 (100.0%) |
Household Vehicle Usage in Bon Homme County
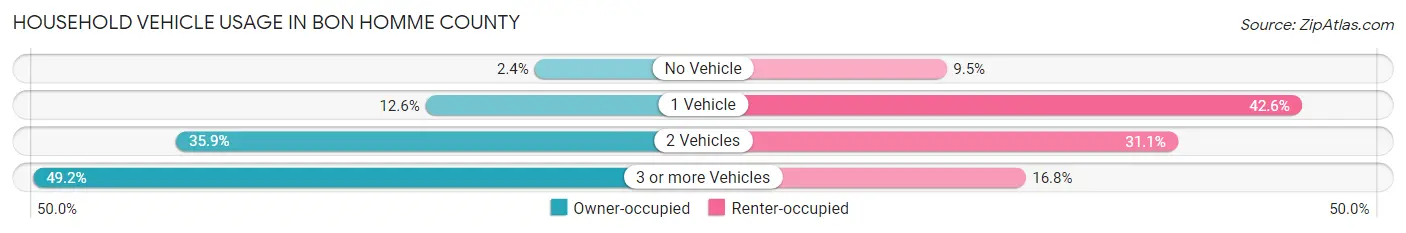
| Vehicles per Household | Owner-occupied | Renter-occupied |
| No Vehicle | 44 (2.4%) | 54 (9.5%) |
| 1 Vehicle | 232 (12.6%) | 243 (42.6%) |
| 2 Vehicles | 661 (35.8%) | 177 (31.0%) |
| 3 or more Vehicles | 907 (49.2%) | 96 (16.8%) |
| Total | 1,844 (100.0%) | 570 (100.0%) |
Real Estate & Mortgages in Bon Homme County
Real Estate and Mortgage Overview in Bon Homme County
| Characteristic | Without Mortgage | With Mortgage |
| Housing Units | 1,189 | 655 |
| Median Property Value | $101,200 | $146,300 |
| Median Household Income | $56,036 | $93 |
| Monthly Housing Costs | $523 | $12 |
| Real Estate Taxes | $1,420 | $8 |
Property Value by Mortgage Status in Bon Homme County
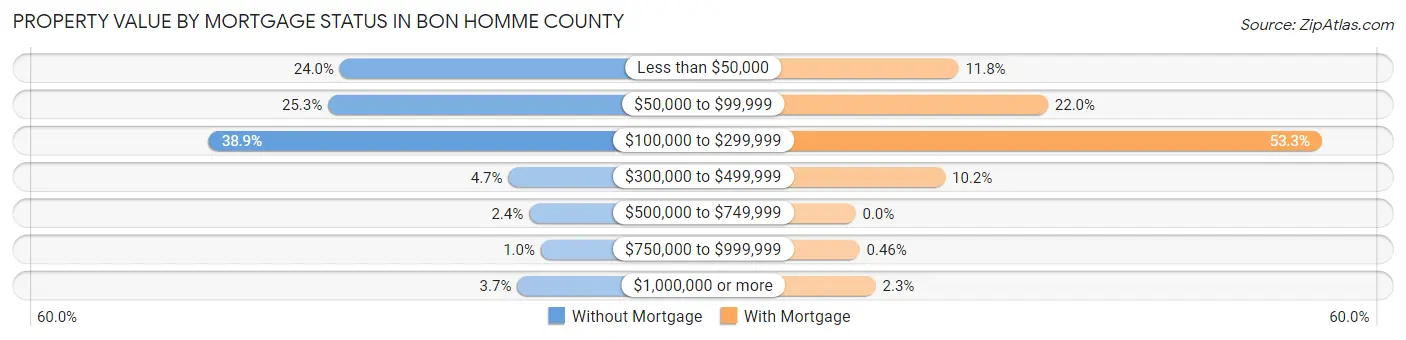
| Property Value | Without Mortgage | With Mortgage |
| Less than $50,000 | 285 (24.0%) | 77 (11.8%) |
| $50,000 to $99,999 | 301 (25.3%) | 144 (22.0%) |
| $100,000 to $299,999 | 463 (38.9%) | 349 (53.3%) |
| $300,000 to $499,999 | 56 (4.7%) | 67 (10.2%) |
| $500,000 to $749,999 | 28 (2.4%) | 0 (0.0%) |
| $750,000 to $999,999 | 12 (1.0%) | 3 (0.5%) |
| $1,000,000 or more | 44 (3.7%) | 15 (2.3%) |
| Total | 1,189 (100.0%) | 655 (100.0%) |
Household Income by Mortgage Status in Bon Homme County
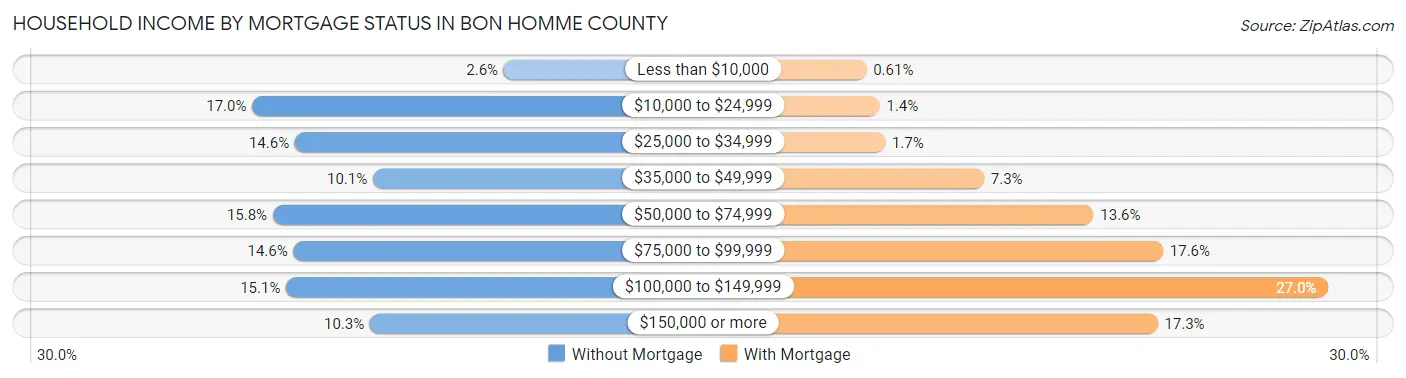
| Household Income | Without Mortgage | With Mortgage |
| Less than $10,000 | 31 (2.6%) | 4 (0.6%) |
| $10,000 to $24,999 | 202 (17.0%) | 9 (1.4%) |
| $25,000 to $34,999 | 173 (14.5%) | 11 (1.7%) |
| $35,000 to $49,999 | 120 (10.1%) | 48 (7.3%) |
| $50,000 to $74,999 | 188 (15.8%) | 89 (13.6%) |
| $75,000 to $99,999 | 174 (14.6%) | 115 (17.6%) |
| $100,000 to $149,999 | 179 (15.0%) | 177 (27.0%) |
| $150,000 or more | 122 (10.3%) | 113 (17.2%) |
| Total | 1,189 (100.0%) | 655 (100.0%) |
Property Value to Household Income Ratio in Bon Homme County
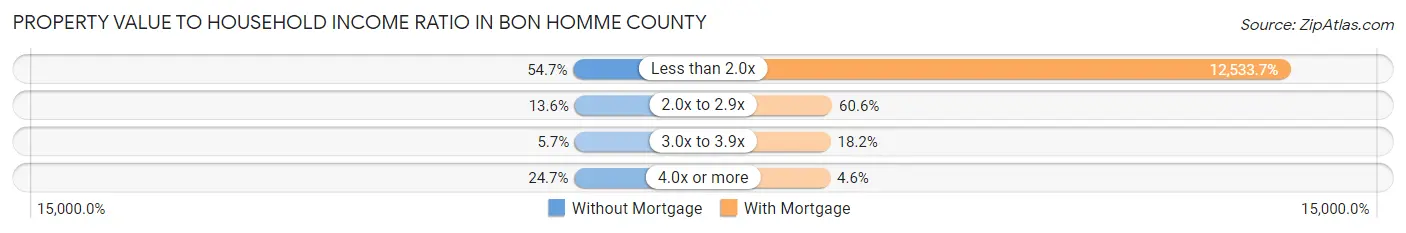
| Value-to-Income Ratio | Without Mortgage | With Mortgage |
| Less than 2.0x | 650 (54.7%) | 82,096 (12,533.7%) |
| 2.0x to 2.9x | 162 (13.6%) | 397 (60.6%) |
| 3.0x to 3.9x | 68 (5.7%) | 119 (18.2%) |
| 4.0x or more | 294 (24.7%) | 30 (4.6%) |
| Total | 1,189 (100.0%) | 655 (100.0%) |
Real Estate Taxes by Mortgage Status in Bon Homme County
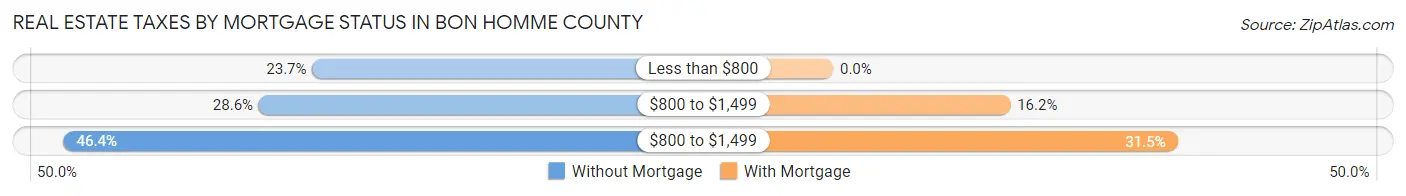
| Property Taxes | Without Mortgage | With Mortgage |
| Less than $800 | 282 (23.7%) | 0 (0.0%) |
| $800 to $1,499 | 340 (28.6%) | 106 (16.2%) |
| $800 to $1,499 | 552 (46.4%) | 206 (31.5%) |
| Total | 1,189 (100.0%) | 655 (100.0%) |
Health & Disability in Bon Homme County
Health Insurance Coverage by Age in Bon Homme County
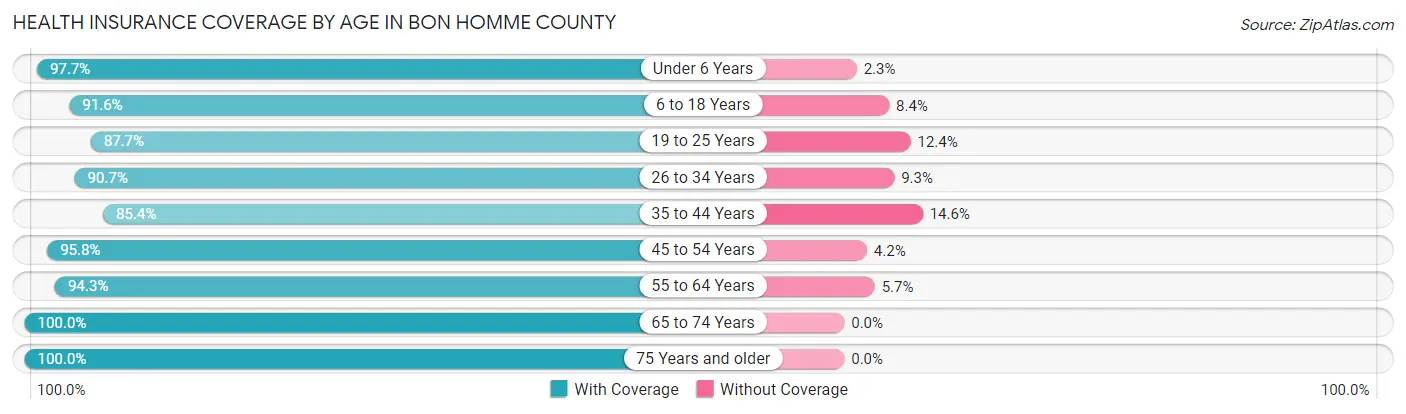
| Age Bracket | With Coverage | Without Coverage |
| Under 6 Years | 422 (97.7%) | 10 (2.3%) |
| 6 to 18 Years | 789 (91.6%) | 72 (8.4%) |
| 19 to 25 Years | 369 (87.6%) | 52 (12.3%) |
| 26 to 34 Years | 370 (90.7%) | 38 (9.3%) |
| 35 to 44 Years | 479 (85.4%) | 82 (14.6%) |
| 45 to 54 Years | 568 (95.8%) | 25 (4.2%) |
| 55 to 64 Years | 749 (94.3%) | 45 (5.7%) |
| 65 to 74 Years | 731 (100.0%) | 0 (0.0%) |
| 75 Years and older | 573 (100.0%) | 0 (0.0%) |
| Total | 5,050 (94.0%) | 324 (6.0%) |
Health Insurance Coverage by Citizenship Status in Bon Homme County
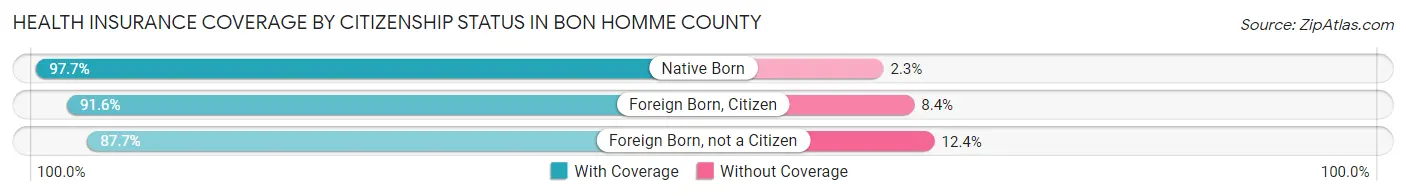
| Citizenship Status | With Coverage | Without Coverage |
| Native Born | 422 (97.7%) | 10 (2.3%) |
| Foreign Born, Citizen | 789 (91.6%) | 72 (8.4%) |
| Foreign Born, not a Citizen | 369 (87.6%) | 52 (12.3%) |
Health Insurance Coverage by Household Income in Bon Homme County
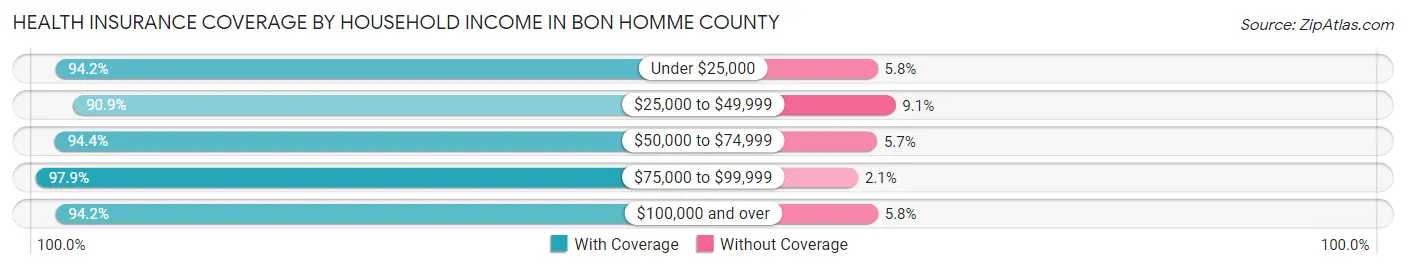
| Household Income | With Coverage | Without Coverage |
| Under $25,000 | 474 (94.2%) | 29 (5.8%) |
| $25,000 to $49,999 | 1,357 (90.9%) | 136 (9.1%) |
| $50,000 to $74,999 | 818 (94.4%) | 49 (5.7%) |
| $75,000 to $99,999 | 938 (97.9%) | 20 (2.1%) |
| $100,000 and over | 1,463 (94.2%) | 90 (5.8%) |
Public vs Private Health Insurance Coverage by Age in Bon Homme County
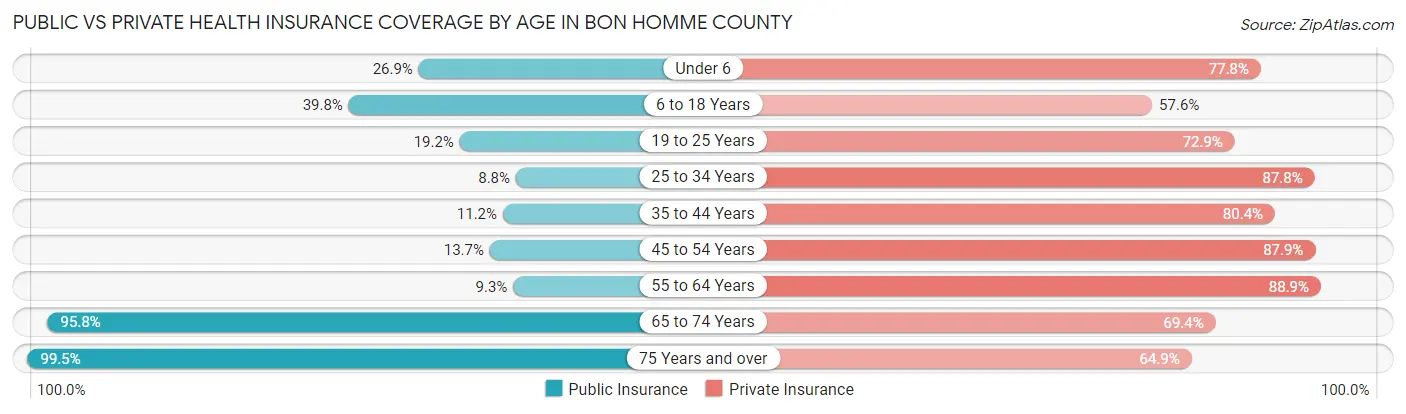
| Age Bracket | Public Insurance | Private Insurance |
| Under 6 | 116 (26.9%) | 336 (77.8%) |
| 6 to 18 Years | 343 (39.8%) | 496 (57.6%) |
| 19 to 25 Years | 81 (19.2%) | 307 (72.9%) |
| 25 to 34 Years | 36 (8.8%) | 358 (87.7%) |
| 35 to 44 Years | 63 (11.2%) | 451 (80.4%) |
| 45 to 54 Years | 81 (13.7%) | 521 (87.9%) |
| 55 to 64 Years | 74 (9.3%) | 706 (88.9%) |
| 65 to 74 Years | 700 (95.8%) | 507 (69.4%) |
| 75 Years and over | 570 (99.5%) | 372 (64.9%) |
| Total | 2,064 (38.4%) | 4,054 (75.4%) |
Disability Status by Sex by Age in Bon Homme County
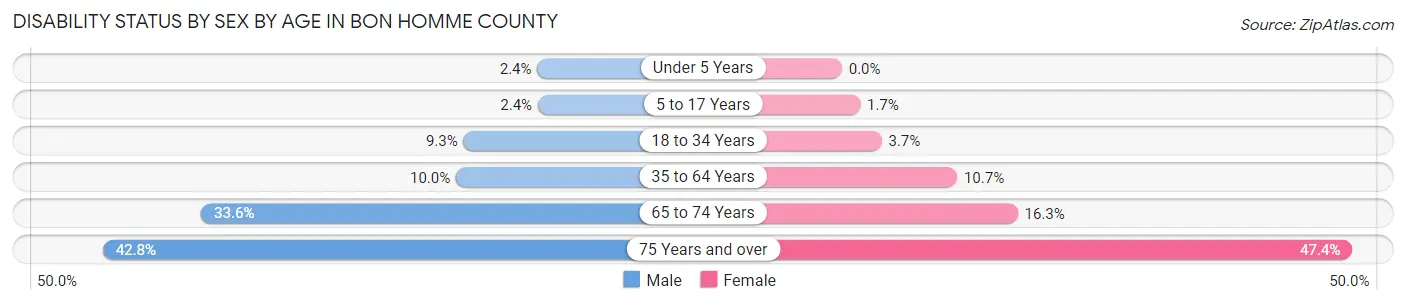
| Age Bracket | Male | Female |
| Under 5 Years | 4 (2.4%) | 0 (0.0%) |
| 5 to 17 Years | 11 (2.4%) | 8 (1.7%) |
| 18 to 34 Years | 41 (9.3%) | 15 (3.7%) |
| 35 to 64 Years | 99 (10.0%) | 102 (10.7%) |
| 65 to 74 Years | 120 (33.6%) | 61 (16.3%) |
| 75 Years and over | 115 (42.7%) | 144 (47.4%) |
Disability Class by Sex by Age in Bon Homme County
Disability Class: Hearing Difficulty
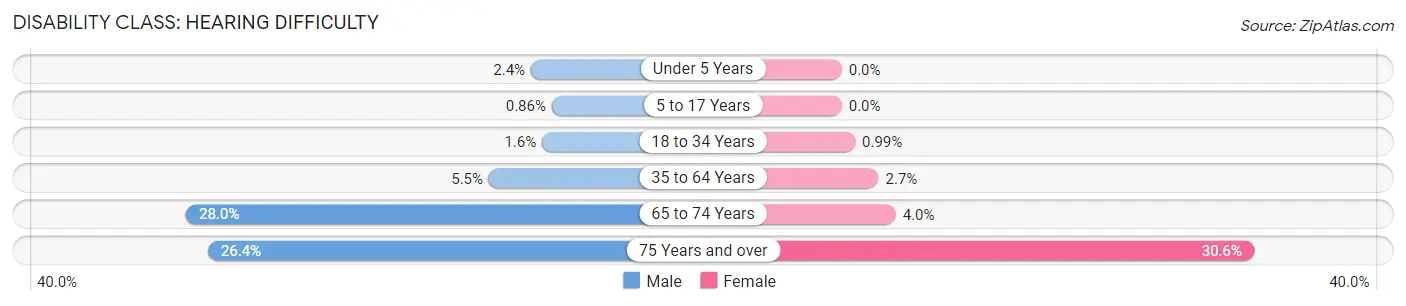
| Age Bracket | Male | Female |
| Under 5 Years | 4 (2.4%) | 0 (0.0%) |
| 5 to 17 Years | 4 (0.9%) | 0 (0.0%) |
| 18 to 34 Years | 7 (1.6%) | 4 (1.0%) |
| 35 to 64 Years | 55 (5.5%) | 26 (2.7%) |
| 65 to 74 Years | 100 (28.0%) | 15 (4.0%) |
| 75 Years and over | 71 (26.4%) | 93 (30.6%) |
Disability Class: Vision Difficulty
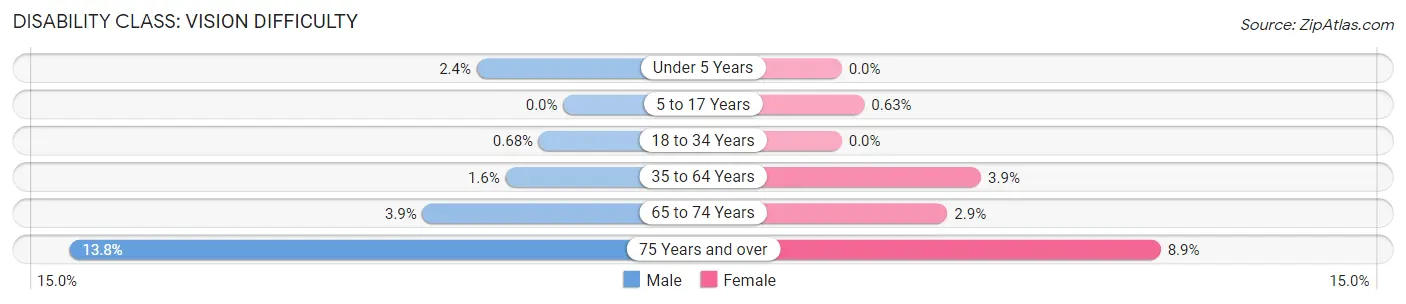
| Age Bracket | Male | Female |
| Under 5 Years | 4 (2.4%) | 0 (0.0%) |
| 5 to 17 Years | 0 (0.0%) | 3 (0.6%) |
| 18 to 34 Years | 3 (0.7%) | 0 (0.0%) |
| 35 to 64 Years | 16 (1.6%) | 37 (3.9%) |
| 65 to 74 Years | 14 (3.9%) | 11 (2.9%) |
| 75 Years and over | 37 (13.8%) | 27 (8.9%) |
Disability Class: Cognitive Difficulty
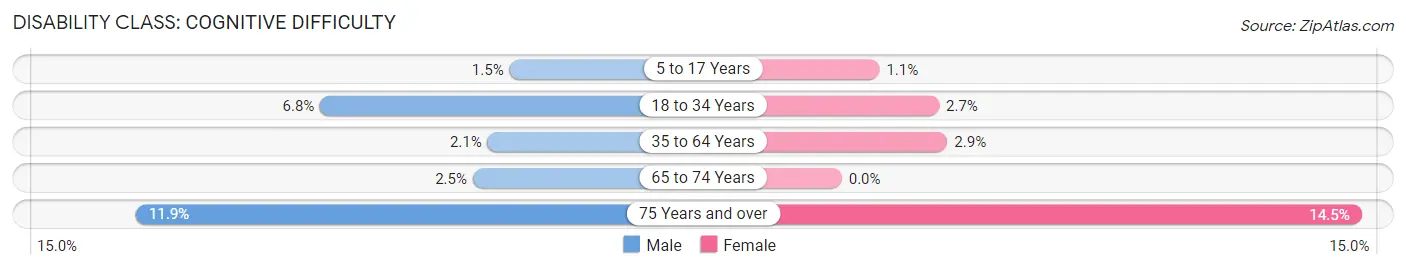
| Age Bracket | Male | Female |
| 5 to 17 Years | 7 (1.5%) | 5 (1.1%) |
| 18 to 34 Years | 30 (6.8%) | 11 (2.7%) |
| 35 to 64 Years | 21 (2.1%) | 28 (2.9%) |
| 65 to 74 Years | 9 (2.5%) | 0 (0.0%) |
| 75 Years and over | 32 (11.9%) | 44 (14.5%) |
Disability Class: Ambulatory Difficulty
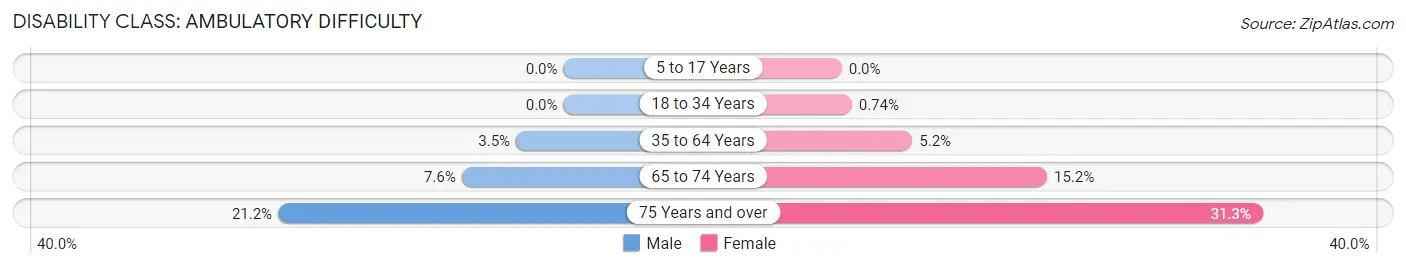
| Age Bracket | Male | Female |
| 5 to 17 Years | 0 (0.0%) | 0 (0.0%) |
| 18 to 34 Years | 0 (0.0%) | 3 (0.7%) |
| 35 to 64 Years | 35 (3.5%) | 50 (5.2%) |
| 65 to 74 Years | 27 (7.6%) | 57 (15.2%) |
| 75 Years and over | 57 (21.2%) | 95 (31.2%) |
Disability Class: Self-Care Difficulty
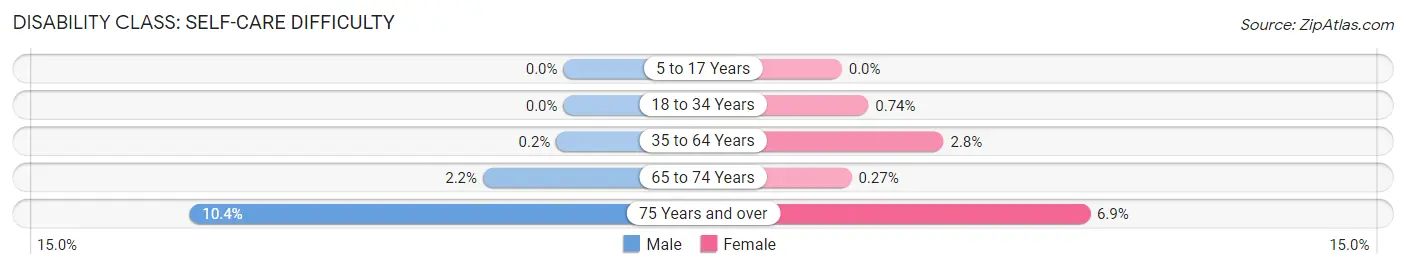
| Age Bracket | Male | Female |
| 5 to 17 Years | 0 (0.0%) | 0 (0.0%) |
| 18 to 34 Years | 0 (0.0%) | 3 (0.7%) |
| 35 to 64 Years | 2 (0.2%) | 27 (2.8%) |
| 65 to 74 Years | 8 (2.2%) | 1 (0.3%) |
| 75 Years and over | 28 (10.4%) | 21 (6.9%) |
Technology Access in Bon Homme County
Computing Device Access in Bon Homme County
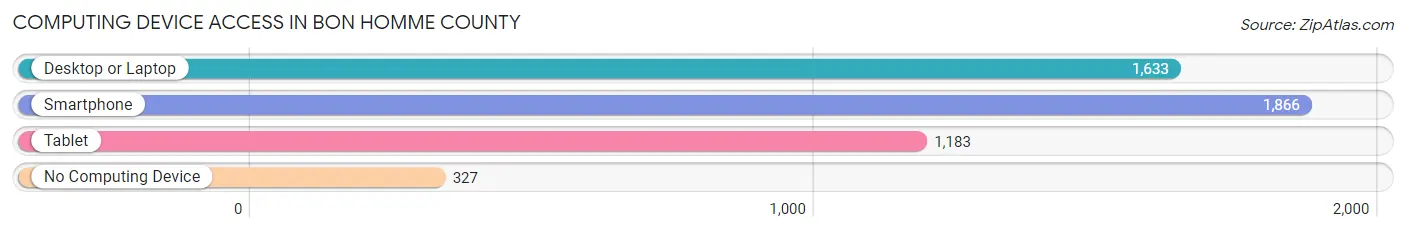
| Device Type | # Households | % Households |
| Desktop or Laptop | 1,633 | 67.6% |
| Smartphone | 1,866 | 77.3% |
| Tablet | 1,183 | 49.0% |
| No Computing Device | 327 | 13.6% |
| Total | 2,414 | 100.0% |
Internet Access in Bon Homme County
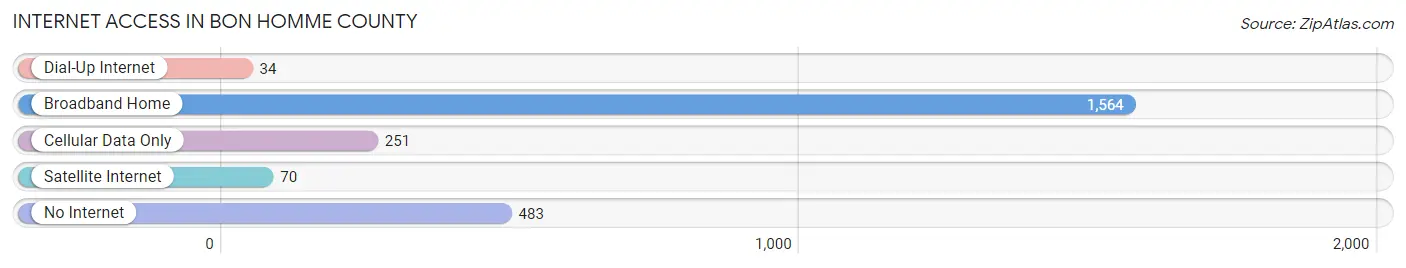
| Internet Type | # Households | % Households |
| Dial-Up Internet | 34 | 1.4% |
| Broadband Home | 1,564 | 64.8% |
| Cellular Data Only | 251 | 10.4% |
| Satellite Internet | 70 | 2.9% |
| No Internet | 483 | 20.0% |
| Total | 2,414 | 100.0% |
Bon Homme County Summary
Homme County is located in the southeastern corner of South Dakota, and is bordered by Charles Mix County to the north, Hutchinson County to the east, Yankton County to the south, and Hutchinson and Douglas Counties to the west. The county seat is Tyndall, and the county is named after the French phrase for “good man”. The county has a total area of 576 square miles, and a population of 7,093 as of the 2010 census.
Geography
Homme County is located in the southeastern corner of South Dakota, and is bordered by Charles Mix County to the north, Hutchinson County to the east, Yankton County to the south, and Hutchinson and Douglas Counties to the west. The county is located in the Missouri River Valley, and is characterized by rolling hills and prairies. The county is home to several small lakes, including Lake Andes, Lake Poinsett, and Lake Vermillion. The county is also home to several rivers, including the Big Sioux River, the James River, and the Vermillion River.
History
Homme County was established in 1873, and was named after the French phrase for “good man”. The county was originally inhabited by the Sioux and Yankton Sioux tribes, and was part of the Great Sioux Reservation until 1889. The county was opened to settlement in 1889, and the first settlers arrived in the area in 1890. The county seat was established in Tyndall in 1891, and the county was officially organized in 1892.
Economy
Homme County’s economy is largely based on agriculture, with corn, soybeans, and wheat being the primary crops. The county is also home to several livestock operations, including cattle, hogs, and sheep. The county is also home to several manufacturing operations, including a concrete plant, a feed mill, and a grain elevator. The county is also home to several small businesses, including restaurants, retail stores, and service providers.
Demographics
As of the 2010 census, there were 7,093 people, 2,717 households, and 1,845 families residing in the county. The population density was 12.3 people per square mile. The racial makeup of the county was 97.3% White, 0.3% African American, 0.5% Native American, 0.2% Asian, 0.1% Pacific Islander, 0.7% from other races, and 0.9% from two or more races. Hispanic or Latino of any race were 1.7% of the population.
The median income for a household in the county was $41,945, and the median income for a family was $50,945. The per capita income for the county was $20,845. About 8.2% of families and 11.2% of the population were below the poverty line, including 14.2% of those under age 18 and 8.2% of those age 65 or over.
Common Questions
What is the Total Population of Bon Homme County?
Total Population of Bon Homme County is 7,018.
What is the Total Male Population of Bon Homme County?
Total Male Population of Bon Homme County is 4,227.
What is the Total Female Population of Bon Homme County?
Total Female Population of Bon Homme County is 2,791.
What is the Ratio of Males per 100 Females in Bon Homme County?
There are 151.45 Males per 100 Females in Bon Homme County.
What is the Ratio of Females per 100 Males in Bon Homme County?
There are 66.03 Females per 100 Males in Bon Homme County.
What is the Median Population Age in Bon Homme County?
Median Population Age in Bon Homme County is 42.1 Years.
What is the Average Family Size in Bon Homme County
Average Family Size in Bon Homme County is 2.8 People.
What is the Average Household Size in Bon Homme County
Average Household Size in Bon Homme County is 2.2 People.
What is Per Capita Income in Bon Homme County?
Per Capita income in Bon Homme County is $26,450.
What is the Median Family Income in Bon Homme County?
Median Family Income in Bon Homme County is $77,452.
What is the Median Household income in Bon Homme County?
Median Household Income in Bon Homme County is $57,554.
What is Income or Wage Gap in Bon Homme County?
Income or Wage Gap in Bon Homme County is 13.5%.
Women in Bon Homme County earn 86.5 cents for every dollar earned by a man.
What is Family Income Deficit in Bon Homme County?
Family Income Deficit in Bon Homme County is $7,957.
Families that are below poverty line in Bon Homme County earn $7,957 less on average than the poverty threshold level.
What is Inequality or Gini Index in Bon Homme County?
Inequality or Gini Index in Bon Homme County is 0.44.
How Large is the Labor Force in Bon Homme County?
There are 2,721 People in the Labor Forcein in Bon Homme County.
What is the Percentage of People in the Labor Force in Bon Homme County?
46.2% of People are in the Labor Force in Bon Homme County.
What is the Unemployment Rate in Bon Homme County?
Unemployment Rate in Bon Homme County is 2.2%.