Zip Codes with the Highest Percentage of Population Employed in Security & Protection in Simpsonville, SC
RELATED REPORTS & OPTIONS
Security & Protection
Simpsonville
Compare Zip Codes
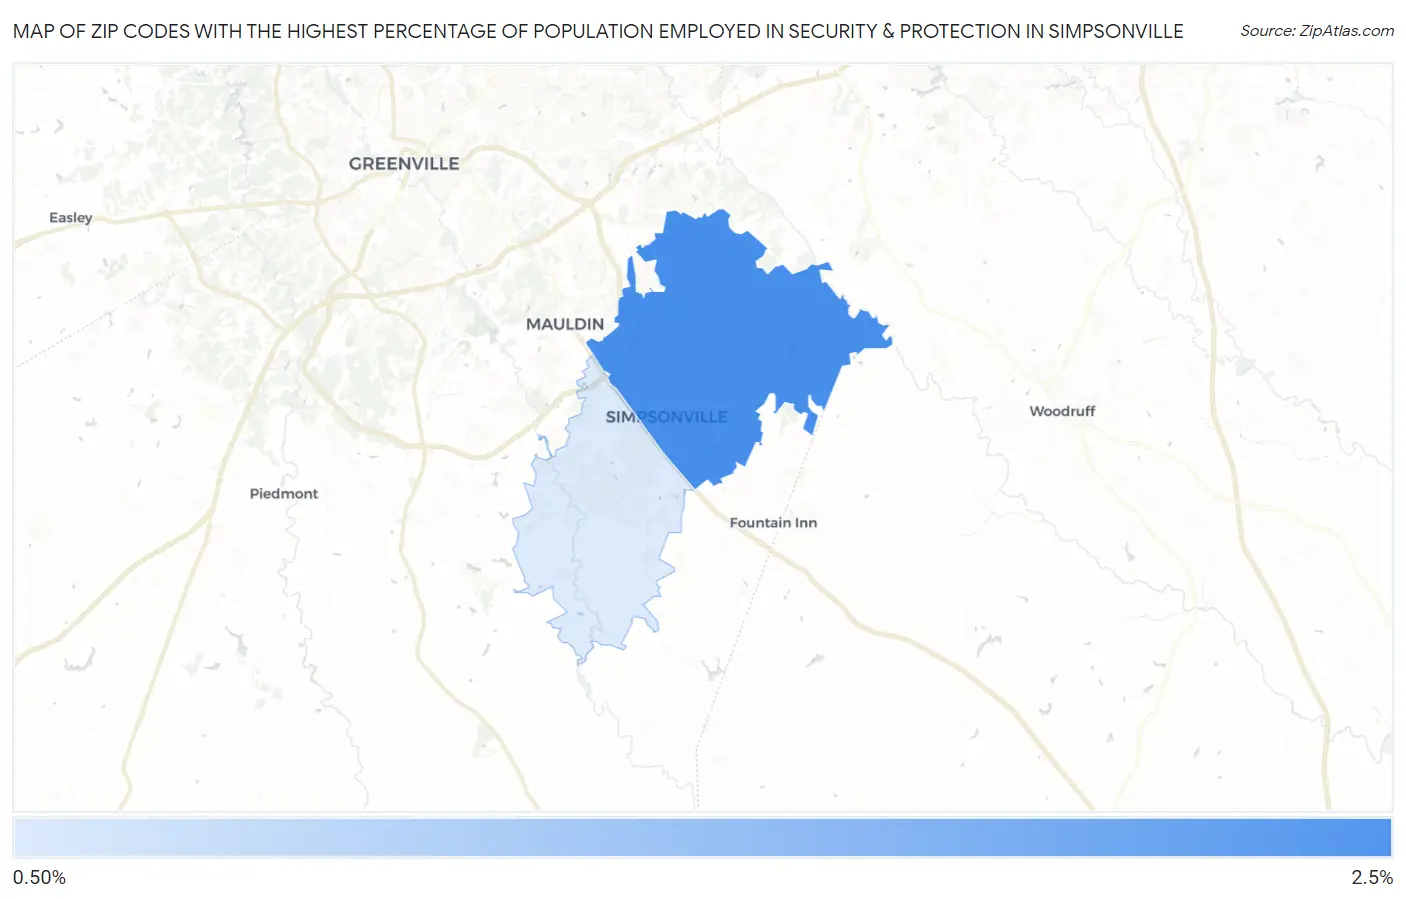
Map of Zip Codes with the Highest Percentage of Population Employed in Security & Protection in Simpsonville
0.0%
2.5%
Zip Codes with the Highest Percentage of Population Employed in Security & Protection in Simpsonville, SC
| Zip Code | % Employed | vs State | vs National | |
| 1. | 29681 | 2.4% | 2.1%(+0.256)#149 | 2.1%(+0.208)#10,297 |
| 2. | 29680 | 1.4% | 2.1%(-0.692)#240 | 2.1%(-0.741)#16,893 |
1
Common Questions
What are the Top Zip Codes with the Highest Percentage of Population Employed in Security & Protection in Simpsonville, SC?
Top Zip Codes with the Highest Percentage of Population Employed in Security & Protection in Simpsonville, SC are:
What zip code has the Highest Percentage of Population Employed in Security & Protection in Simpsonville, SC?
29681 has the Highest Percentage of Population Employed in Security & Protection in Simpsonville, SC with 2.4%.
What is the Percentage of Population Employed in Security & Protection in Simpsonville, SC?
Percentage of Population Employed in Security & Protection in Simpsonville is 1.6%.
What is the Percentage of Population Employed in Security & Protection in South Carolina?
Percentage of Population Employed in Security & Protection in South Carolina is 2.1%.
What is the Percentage of Population Employed in Security & Protection in the United States?
Percentage of Population Employed in Security & Protection in the United States is 2.1%.