Sioux vs English Married-Couple Family Poverty

COMPARE

Sioux
Race
Ancestry
AfghanAfricanAlaska NativeAlaskan AthabascanAlbanianAleutAlsatianAmericanApacheArabArapahoArgentineanArmenianAssyrian/Chaldean/SyriacAustralianAustrianBahamianBangladeshiBarbadianBasqueBelgianBelizeanBermudanBhutaneseBlackfeetBolivianBrazilianBritishBritish West IndianBulgarianBurmeseCajunCambodianCanadianCape VerdeanCarpatho RusynCelticCentral AmericanCentral American IndianCherokeeCheyenneChickasawChileanChineseChippewaChoctawColombianColvilleComancheCosta RicanCreeCreekCroatianCrowCubanCypriotCzechCzechoslovakianDanishDelawareDominicanDutchDutch West IndianEastern EuropeanEcuadorianEgyptianEstonianEthiopianEuropeanFijianFilipinoFinnishFrenchFrench American IndianFrench CanadianGermanGerman RussianGhanaianGreekGuamanian/ChamorroGuatemalanGuyaneseHaitianHmongHonduranHopiHoumaHungarianIcelanderIndian (Asian)IndonesianInupiatIranianIraqiIrishIroquoisIsraeliItalianJamaicanJapaneseJordanianKenyanKiowaKoreanLaotianLatvianLebaneseLiberianLithuanianLumbeeLuxembourgerMacedonianMalaysianMalteseMarshalleseMenomineeMexicanMexican American IndianMongolianMoroccanNative HawaiianNavajoNepaleseNew ZealanderNicaraguanNigerianNorthern EuropeanNorwegianOkinawanOsageOttawaPaiutePakistaniPalestinianPanamanianParaguayanPennsylvania GermanPeruvianPimaPolishPortuguesePotawatomiPuebloPuerto RicanPuget Sound SalishRomanianRussianSalvadoranSamoanScandinavianScotch-IrishScottishSeminoleSenegaleseSerbianShoshoneSierra LeoneanSiouxSlavicSlovakSloveneSomaliSouth AfricanSouth AmericanSouth American IndianSoviet UnionSpaniardSpanishSpanish AmericanSpanish American IndianSri LankanSubsaharan AfricanSudaneseSwedishSwissSyrianTaiwaneseThaiTlingit-HaidaTohono O'OdhamTonganTrinidadian and TobagonianTsimshianTurkishU.S. Virgin IslanderUgandanUkrainianUruguayanUteVenezuelanVietnameseWelshWest IndianYakamaYaquiYugoslavianYumanYup'ikZimbabwean
Immigration
NonimmigrantsImmigrantsAfghanistanAfricaAlbaniaArgentinaArmeniaAsiaAustraliaAustriaBahamasBangladeshBarbadosBelarusBelgiumBelizeBoliviaBosnia and HerzegovinaBrazilBulgariaBurma/MyanmarCabo VerdeCambodiaCameroonCanadaCaribbeanCentral AmericaChileChinaColombiaCongoCosta RicaCroatiaCubaCzechoslovakiaDenmarkDominicaDominican RepublicEastern AfricaEastern AsiaEastern EuropeEcuadorEgyptEl SalvadorEnglandEritreaEthiopiaEuropeFijiFranceGermanyGhanaGreeceGrenadaGuatemalaGuyanaHaitiHondurasHong KongHungaryIndiaIndonesiaIranIraqIrelandIsraelItalyJamaicaJapanJordanKazakhstanKenyaKoreaKuwaitLaosLatin AmericaLatviaLebanonLiberiaLithuaniaMalaysiaMexicoMicronesiaMiddle AfricaMoldovaMoroccoNepalNetherlandsNicaraguaNigeriaNorth AmericaNorth MacedoniaNorthern AfricaNorthern EuropeNorwayOceaniaPakistanPanamaPeruPhilippinesPolandPortugalRomaniaRussiaSaudi ArabiaScotlandSenegalSerbiaSierra LeoneSingaporeSomaliaSouth AfricaSouth AmericaSouth Central AsiaSouth Eastern AsiaSouthern EuropeSpainSri LankaSt. Vincent and the GrenadinesSudanSwedenSwitzerlandSyriaTaiwanThailandTrinidad and TobagoTurkeyUgandaUkraineUruguayUzbekistanVenezuelaVietnamWest IndiesWestern AfricaWestern AsiaWestern EuropeYemenZaireZimbabweAzores
English
Race
Ancestry
AfghanAfricanAlaska NativeAlaskan AthabascanAlbanianAleutAlsatianAmericanApacheArabArapahoArgentineanArmenianAssyrian/Chaldean/SyriacAustralianAustrianBahamianBangladeshiBarbadianBasqueBelgianBelizeanBermudanBhutaneseBlackfeetBolivianBrazilianBritishBritish West IndianBulgarianBurmeseCajunCambodianCanadianCape VerdeanCarpatho RusynCelticCentral AmericanCentral American IndianCherokeeCheyenneChickasawChileanChineseChippewaChoctawColombianColvilleComancheCosta RicanCreeCreekCroatianCrowCubanCypriotCzechCzechoslovakianDanishDelawareDominicanDutchDutch West IndianEastern EuropeanEcuadorianEgyptianEnglishEstonianEthiopianEuropeanFijianFilipinoFinnishFrenchFrench American IndianFrench CanadianGermanGerman RussianGhanaianGreekGuamanian/ChamorroGuatemalanGuyaneseHaitianHmongHonduranHopiHoumaHungarianIcelanderIndian (Asian)IndonesianInupiatIranianIraqiIrishIroquoisIsraeliItalianJamaicanJapaneseJordanianKenyanKiowaKoreanLaotianLatvianLebaneseLiberianLithuanianLumbeeLuxembourgerMacedonianMalaysianMalteseMarshalleseMenomineeMexicanMexican American IndianMongolianMoroccanNative HawaiianNavajoNepaleseNew ZealanderNicaraguanNigerianNorthern EuropeanNorwegianOkinawanOsageOttawaPaiutePakistaniPalestinianPanamanianParaguayanPennsylvania GermanPeruvianPimaPolishPortuguesePotawatomiPuebloPuerto RicanPuget Sound SalishRomanianRussianSalvadoranSamoanScandinavianScotch-IrishScottishSeminoleSenegaleseSerbianShoshoneSierra LeoneanSlavicSlovakSloveneSomaliSouth AfricanSouth AmericanSouth American IndianSoviet UnionSpaniardSpanishSpanish AmericanSpanish American IndianSri LankanSubsaharan AfricanSudaneseSwedishSwissSyrianTaiwaneseThaiTlingit-HaidaTohono O'OdhamTonganTrinidadian and TobagonianTsimshianTurkishU.S. Virgin IslanderUgandanUkrainianUruguayanUteVenezuelanVietnameseWelshWest IndianYakamaYaquiYugoslavianYumanYup'ikZimbabwean
Immigration
NonimmigrantsImmigrantsAfghanistanAfricaAlbaniaArgentinaArmeniaAsiaAustraliaAustriaBahamasBangladeshBarbadosBelarusBelgiumBelizeBoliviaBosnia and HerzegovinaBrazilBulgariaBurma/MyanmarCabo VerdeCambodiaCameroonCanadaCaribbeanCentral AmericaChileChinaColombiaCongoCosta RicaCroatiaCubaCzechoslovakiaDenmarkDominicaDominican RepublicEastern AfricaEastern AsiaEastern EuropeEcuadorEgyptEl SalvadorEnglandEritreaEthiopiaEuropeFijiFranceGermanyGhanaGreeceGrenadaGuatemalaGuyanaHaitiHondurasHong KongHungaryIndiaIndonesiaIranIraqIrelandIsraelItalyJamaicaJapanJordanKazakhstanKenyaKoreaKuwaitLaosLatin AmericaLatviaLebanonLiberiaLithuaniaMalaysiaMexicoMicronesiaMiddle AfricaMoldovaMoroccoNepalNetherlandsNicaraguaNigeriaNorth AmericaNorth MacedoniaNorthern AfricaNorthern EuropeNorwayOceaniaPakistanPanamaPeruPhilippinesPolandPortugalRomaniaRussiaSaudi ArabiaScotlandSenegalSerbiaSierra LeoneSingaporeSomaliaSouth AfricaSouth AmericaSouth Central AsiaSouth Eastern AsiaSouthern EuropeSpainSri LankaSt. Vincent and the GrenadinesSudanSwedenSwitzerlandSyriaTaiwanThailandTrinidad and TobagoTurkeyUgandaUkraineUruguayUzbekistanVenezuelaVietnamWest IndiesWestern AfricaWestern AsiaWestern EuropeYemenZaireZimbabweAzores
Married-Couple Family Poverty
Income
Poverty
Unemployment
Labor Participation
Family Structure
Vehicle Availability
Education Level
Disability

Married-Couple Family Poverty Comparison

Sioux

English

Tragic
Exceptional
8.7%
MARRIED-COUPLE FAMILY POVERTY
0.0/ 100
METRIC RATING
335th/ 347
METRIC RANK
4.2%
MARRIED-COUPLE FAMILY POVERTY
99.9/ 100
METRIC RATING
36th/ 347
METRIC RANK

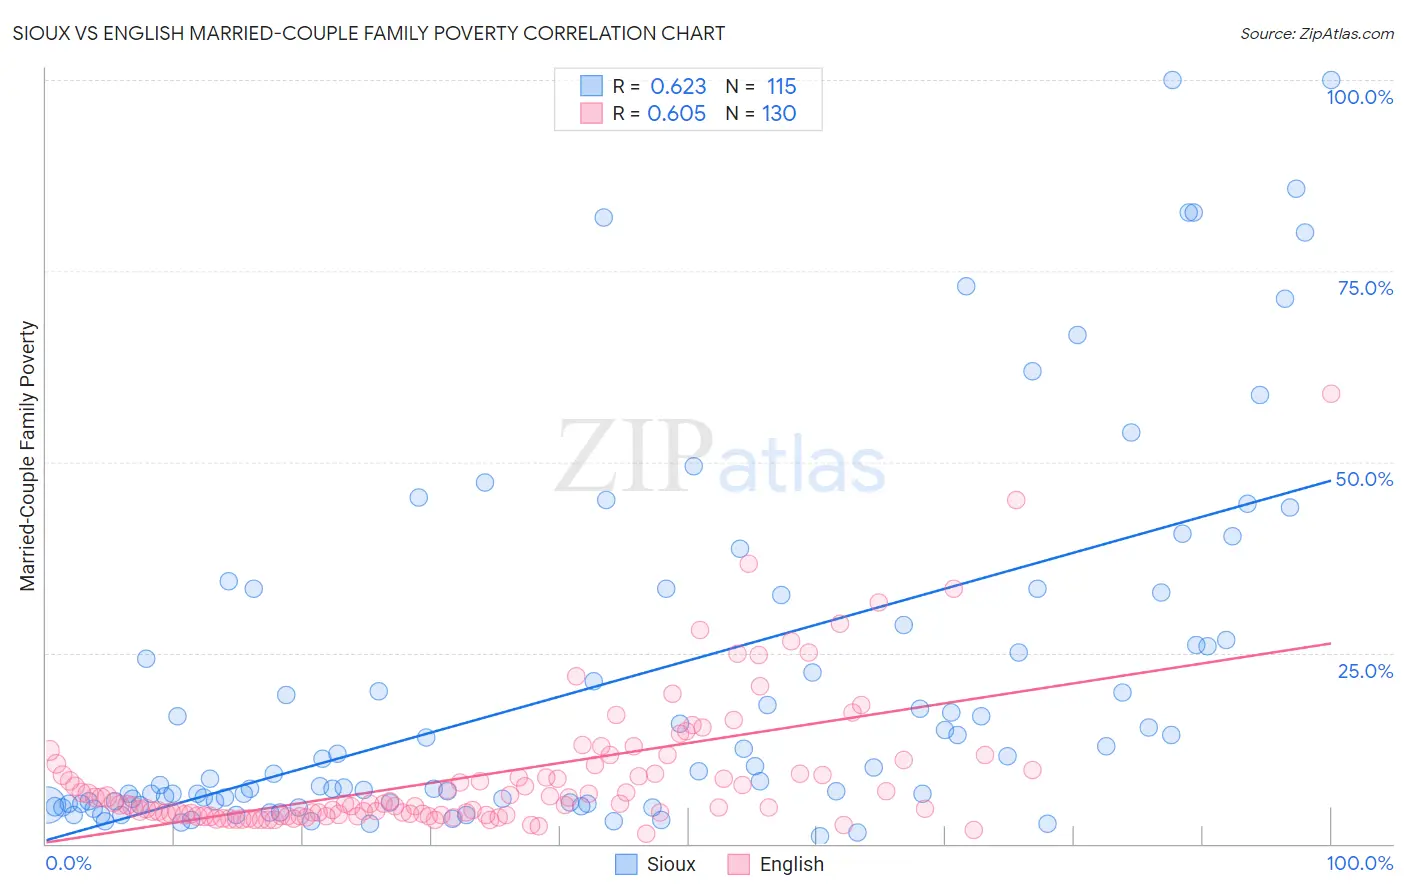
Sioux vs English Married-Couple Family Poverty Correlation Chart

The statistical analysis conducted on geographies consisting of 232,751,965 people shows a significant positive correlation between the proportion of Sioux and poverty level among married-couple families in the United States with a correlation coefficient (R) of 0.623 and weighted average of 8.7%. Similarly, the statistical analysis conducted on geographies consisting of 562,851,245 people shows a significant positive correlation between the proportion of English and poverty level among married-couple families in the United States with a correlation coefficient (R) of 0.605 and weighted average of 4.2%, a difference of 106.0%.
Sioux vs English Married-Couple Family Poverty

Married-Couple Family Poverty Correlation Summary

MeasurementSiouxEnglish
Minimum0.94%1.4%
Maximum100.0%58.9%
Range99.1%57.6%
Mean21.0%8.9%
Median9.4%5.2%
Interquartile 25% (IQ1)5.3%3.7%
Interquartile 75% (IQ3)28.6%9.6%
Interquartile Range (IQR)23.3%5.9%
Standard Deviation (Sample)23.8%9.0%
Standard Deviation (Population)23.7%8.9%

Similar Demographics by Married-Couple Family Poverty

Demographics Similar to Sioux by Married-Couple Family Poverty

In terms of married-couple family poverty, the demographic groups most similar to Sioux are Apache (9.0%, a difference of 2.9%), Yakama (9.0%, a difference of 3.0%), Immigrants from Dominican Republic (8.4%, a difference of 3.6%), Lumbee (8.3%, a difference of 4.3%), and Dominican (8.3%, a difference of 4.8%).
DemographicsRating | RankMarried-Couple Family Poverty
Immigrants | Mexico
0.0
/100
|
#328
Tragic
7.6%
Natives/Alaskans
0.0
/100
|
#329
Tragic
8.2%
Paiute
0.0
/100
|
#330
Tragic
8.3%
Central American Indians
0.0
/100
|
#331
Tragic
8.3%
Dominicans
0.0
/100
|
#332
Tragic
8.3%
Lumbee
0.0
/100
|
#333
Tragic
8.3%
Immigrants | Dominican Republic
0.0
/100
|
#334
Tragic
8.4%
Sioux
0.0
/100
|
#335
Tragic
8.7%
Apache
0.0
/100
|
#336
Tragic
9.0%
Yakama
0.0
/100
|
#337
Tragic
9.0%
Cheyenne
0.0
/100
|
#338
Tragic
9.4%
Crow
0.0
/100
|
#339
Tragic
9.6%
Yuman
0.0
/100
|
#340
Tragic
9.7%
Pueblo
0.0
/100
|
#341
Tragic
11.1%
Tohono O'odham
0.0
/100
|
#342
Tragic
11.2%

Demographics Similar to English by Married-Couple Family Poverty

In terms of married-couple family poverty, the demographic groups most similar to English are European (4.2%, a difference of 0.030%), Iranian (4.2%, a difference of 0.070%), Belgian (4.2%, a difference of 0.19%), Immigrants from Northern Europe (4.2%, a difference of 0.32%), and Dutch (4.2%, a difference of 0.60%).
DemographicsRating | RankMarried-Couple Family Poverty
Immigrants | Scotland
99.9
/100
|
#29
Exceptional
4.2%
Finns
99.9
/100
|
#30
Exceptional
4.2%
Estonians
99.9
/100
|
#31
Exceptional
4.2%
Greeks
99.9
/100
|
#32
Exceptional
4.2%
Irish
99.9
/100
|
#33
Exceptional
4.2%
Dutch
99.9
/100
|
#34
Exceptional
4.2%
Europeans
99.9
/100
|
#35
Exceptional
4.2%
English
99.9
/100
|
#36
Exceptional
4.2%
Iranians
99.9
/100
|
#37
Exceptional
4.2%
Belgians
99.9
/100
|
#38
Exceptional
4.2%
Immigrants | Northern Europe
99.8
/100
|
#39
Exceptional
4.2%
French Canadians
99.8
/100
|
#40
Exceptional
4.2%
Northern Europeans
99.8
/100
|
#41
Exceptional
4.3%
Scottish
99.8
/100
|
#42
Exceptional
4.3%
Swiss
99.8
/100
|
#43
Exceptional
4.3%