Seminole vs Korean Receiving Food Stamps
COMPARE
Seminole
Korean
Receiving Food Stamps
Receiving Food Stamps Comparison
Seminole
Koreans
14.8%
RECEIVING FOOD STAMPS
0.1/ 100
METRIC RATING
277th/ 347
METRIC RANK
10.4%
RECEIVING FOOD STAMPS
96.3/ 100
METRIC RATING
107th/ 347
METRIC RANK
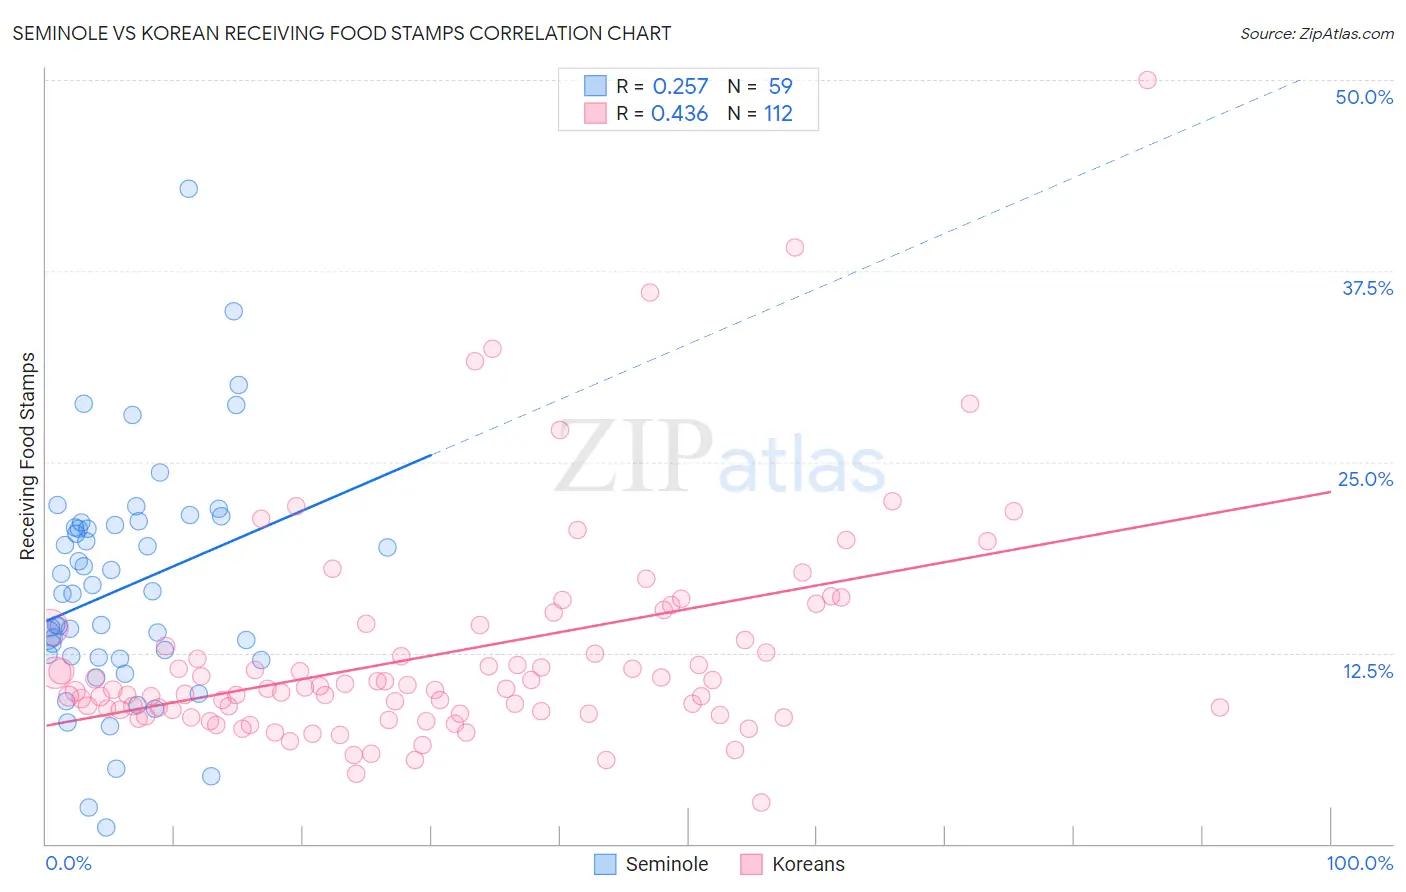
Seminole vs Korean Receiving Food Stamps Correlation Chart
The statistical analysis conducted on geographies consisting of 118,279,359 people shows a weak positive correlation between the proportion of Seminole and percentage of population receiving government assistance and/or food stamps in the United States with a correlation coefficient (R) of 0.257 and weighted average of 14.8%. Similarly, the statistical analysis conducted on geographies consisting of 508,812,505 people shows a moderate positive correlation between the proportion of Koreans and percentage of population receiving government assistance and/or food stamps in the United States with a correlation coefficient (R) of 0.436 and weighted average of 10.4%, a difference of 42.4%.
Receiving Food Stamps Correlation Summary
| Measurement | Seminole | Korean |
| Minimum | 1.1% | 2.7% |
| Maximum | 42.9% | 50.0% |
| Range | 41.8% | 47.3% |
| Mean | 16.8% | 12.5% |
| Median | 16.4% | 10.1% |
| Interquartile 25% (IQ1) | 12.2% | 8.6% |
| Interquartile 75% (IQ3) | 20.9% | 13.7% |
| Interquartile Range (IQR) | 8.7% | 5.1% |
| Standard Deviation (Sample) | 7.6% | 7.2% |
| Standard Deviation (Population) | 7.5% | 7.2% |
Similar Demographics by Receiving Food Stamps
Demographics Similar to Seminole by Receiving Food Stamps
In terms of receiving food stamps, the demographic groups most similar to Seminole are Liberian (14.8%, a difference of 0.050%), Belizean (14.8%, a difference of 0.13%), Kiowa (14.9%, a difference of 0.40%), Ecuadorian (14.9%, a difference of 0.45%), and Ute (14.7%, a difference of 0.76%).
| Demographics | Rating | Rank | Receiving Food Stamps |
| Mexicans | 0.1 /100 | #270 | Tragic 14.6% |
| Immigrants | Guatemala | 0.1 /100 | #271 | Tragic 14.6% |
| Chippewa | 0.1 /100 | #272 | Tragic 14.7% |
| Alaskan Athabascans | 0.1 /100 | #273 | Tragic 14.7% |
| Immigrants | Western Africa | 0.1 /100 | #274 | Tragic 14.7% |
| Ute | 0.1 /100 | #275 | Tragic 14.7% |
| Liberians | 0.1 /100 | #276 | Tragic 14.8% |
| Seminole | 0.1 /100 | #277 | Tragic 14.8% |
| Belizeans | 0.1 /100 | #278 | Tragic 14.8% |
| Kiowa | 0.0 /100 | #279 | Tragic 14.9% |
| Ecuadorians | 0.0 /100 | #280 | Tragic 14.9% |
| Spanish American Indians | 0.0 /100 | #281 | Tragic 14.9% |
| Immigrants | Central America | 0.0 /100 | #282 | Tragic 15.0% |
| Bangladeshis | 0.0 /100 | #283 | Tragic 15.0% |
| Immigrants | Ecuador | 0.0 /100 | #284 | Tragic 15.0% |
Demographics Similar to Koreans by Receiving Food Stamps
In terms of receiving food stamps, the demographic groups most similar to Koreans are Carpatho Rusyn (10.4%, a difference of 0.030%), Immigrants from Pakistan (10.4%, a difference of 0.080%), Immigrants from Italy (10.4%, a difference of 0.15%), Immigrants from Malaysia (10.4%, a difference of 0.24%), and Pakistani (10.4%, a difference of 0.36%).
| Demographics | Rating | Rank | Receiving Food Stamps |
| Immigrants | Western Europe | 96.9 /100 | #100 | Exceptional 10.3% |
| Palestinians | 96.9 /100 | #101 | Exceptional 10.3% |
| Immigrants | Europe | 96.8 /100 | #102 | Exceptional 10.3% |
| Immigrants | Latvia | 96.8 /100 | #103 | Exceptional 10.3% |
| Immigrants | Hungary | 96.7 /100 | #104 | Exceptional 10.3% |
| Immigrants | Malaysia | 96.5 /100 | #105 | Exceptional 10.4% |
| Immigrants | Italy | 96.4 /100 | #106 | Exceptional 10.4% |
| Koreans | 96.3 /100 | #107 | Exceptional 10.4% |
| Carpatho Rusyns | 96.2 /100 | #108 | Exceptional 10.4% |
| Immigrants | Pakistan | 96.2 /100 | #109 | Exceptional 10.4% |
| Pakistanis | 95.9 /100 | #110 | Exceptional 10.4% |
| Romanians | 95.8 /100 | #111 | Exceptional 10.4% |
| Mongolians | 95.8 /100 | #112 | Exceptional 10.5% |
| Icelanders | 95.4 /100 | #113 | Exceptional 10.5% |
| Scotch-Irish | 95.1 /100 | #114 | Exceptional 10.5% |