Immigrants from Croatia vs Jordanian Married-Couple Family Poverty
COMPARE
Immigrants from Croatia
Jordanian
Married-Couple Family Poverty
Married-Couple Family Poverty Comparison
Immigrants from Croatia
Jordanians
4.6%
MARRIED-COUPLE FAMILY POVERTY
98.7/ 100
METRIC RATING
84th/ 347
METRIC RANK
4.8%
MARRIED-COUPLE FAMILY POVERTY
93.1/ 100
METRIC RATING
123rd/ 347
METRIC RANK
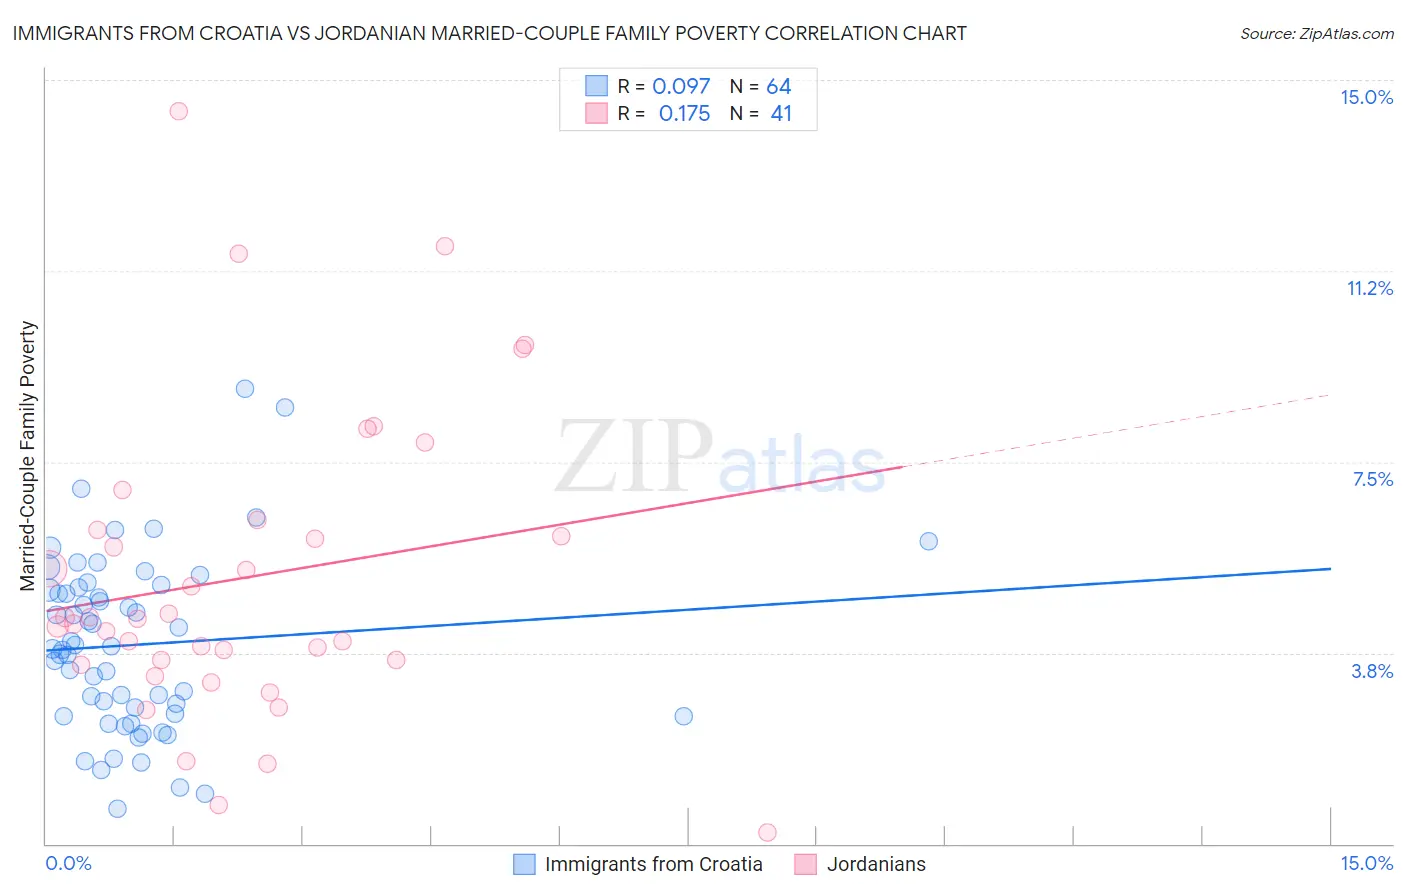
Immigrants from Croatia vs Jordanian Married-Couple Family Poverty Correlation Chart
The statistical analysis conducted on geographies consisting of 132,064,447 people shows a slight positive correlation between the proportion of Immigrants from Croatia and poverty level among married-couple families in the United States with a correlation coefficient (R) of 0.097 and weighted average of 4.6%. Similarly, the statistical analysis conducted on geographies consisting of 165,961,461 people shows a poor positive correlation between the proportion of Jordanians and poverty level among married-couple families in the United States with a correlation coefficient (R) of 0.175 and weighted average of 4.8%, a difference of 5.9%.
Married-Couple Family Poverty Correlation Summary
| Measurement | Immigrants from Croatia | Jordanian |
| Minimum | 0.70% | 0.23% |
| Maximum | 8.9% | 14.4% |
| Range | 8.2% | 14.1% |
| Mean | 3.9% | 5.2% |
| Median | 3.9% | 4.4% |
| Interquartile 25% (IQ1) | 2.5% | 3.6% |
| Interquartile 75% (IQ3) | 5.0% | 6.3% |
| Interquartile Range (IQR) | 2.5% | 2.7% |
| Standard Deviation (Sample) | 1.7% | 3.0% |
| Standard Deviation (Population) | 1.7% | 3.0% |
Similar Demographics by Married-Couple Family Poverty
Demographics Similar to Immigrants from Croatia by Married-Couple Family Poverty
In terms of married-couple family poverty, the demographic groups most similar to Immigrants from Croatia are Immigrants from Denmark (4.6%, a difference of 0.13%), South African (4.6%, a difference of 0.23%), Immigrants from Turkey (4.6%, a difference of 0.27%), Canadian (4.5%, a difference of 0.29%), and Immigrants from North Macedonia (4.6%, a difference of 0.35%).
| Demographics | Rating | Rank | Married-Couple Family Poverty |
| Immigrants | Latvia | 99.1 /100 | #77 | Exceptional 4.5% |
| Scotch-Irish | 99.1 /100 | #78 | Exceptional 4.5% |
| Immigrants | Iran | 99.0 /100 | #79 | Exceptional 4.5% |
| Icelanders | 99.0 /100 | #80 | Exceptional 4.5% |
| Immigrants | Greece | 98.9 /100 | #81 | Exceptional 4.5% |
| Canadians | 98.8 /100 | #82 | Exceptional 4.5% |
| Immigrants | Denmark | 98.8 /100 | #83 | Exceptional 4.6% |
| Immigrants | Croatia | 98.7 /100 | #84 | Exceptional 4.6% |
| South Africans | 98.7 /100 | #85 | Exceptional 4.6% |
| Immigrants | Turkey | 98.6 /100 | #86 | Exceptional 4.6% |
| Immigrants | North Macedonia | 98.6 /100 | #87 | Exceptional 4.6% |
| Bolivians | 98.6 /100 | #88 | Exceptional 4.6% |
| Immigrants | Czechoslovakia | 98.5 /100 | #89 | Exceptional 4.6% |
| Immigrants | Switzerland | 98.5 /100 | #90 | Exceptional 4.6% |
| Basques | 98.5 /100 | #91 | Exceptional 4.6% |
Demographics Similar to Jordanians by Married-Couple Family Poverty
In terms of married-couple family poverty, the demographic groups most similar to Jordanians are White/Caucasian (4.8%, a difference of 0.020%), Indian (Asian) (4.8%, a difference of 0.060%), Immigrants from Southern Europe (4.8%, a difference of 0.16%), Romanian (4.8%, a difference of 0.27%), and Immigrants from Bosnia and Herzegovina (4.8%, a difference of 0.29%).
| Demographics | Rating | Rank | Married-Couple Family Poverty |
| Celtics | 94.8 /100 | #116 | Exceptional 4.8% |
| Kenyans | 94.7 /100 | #117 | Exceptional 4.8% |
| Immigrants | Philippines | 94.6 /100 | #118 | Exceptional 4.8% |
| Immigrants | Eastern Asia | 94.0 /100 | #119 | Exceptional 4.8% |
| Immigrants | Southern Europe | 93.4 /100 | #120 | Exceptional 4.8% |
| Indians (Asian) | 93.2 /100 | #121 | Exceptional 4.8% |
| Whites/Caucasians | 93.1 /100 | #122 | Exceptional 4.8% |
| Jordanians | 93.1 /100 | #123 | Exceptional 4.8% |
| Romanians | 92.5 /100 | #124 | Exceptional 4.8% |
| Immigrants | Bosnia and Herzegovina | 92.5 /100 | #125 | Exceptional 4.8% |
| Immigrants | Asia | 92.3 /100 | #126 | Exceptional 4.8% |
| Egyptians | 92.0 /100 | #127 | Exceptional 4.8% |
| Palestinians | 91.2 /100 | #128 | Exceptional 4.9% |
| Immigrants | Pakistan | 90.7 /100 | #129 | Exceptional 4.9% |
| Soviet Union | 90.7 /100 | #130 | Exceptional 4.9% |