Dutch vs Immigrants from Guatemala Receiving Food Stamps

COMPARE

Dutch
Race
Ancestry
AfghanAfricanAlaska NativeAlaskan AthabascanAlbanianAleutAlsatianAmericanApacheArabArapahoArgentineanArmenianAssyrian/Chaldean/SyriacAustralianAustrianBahamianBangladeshiBarbadianBasqueBelgianBelizeanBermudanBhutaneseBlackfeetBolivianBrazilianBritishBritish West IndianBulgarianBurmeseCajunCambodianCanadianCape VerdeanCarpatho RusynCelticCentral AmericanCentral American IndianCherokeeCheyenneChickasawChileanChineseChippewaChoctawColombianColvilleComancheCosta RicanCreeCreekCroatianCrowCubanCypriotCzechCzechoslovakianDanishDelawareDominicanDutchDutch West IndianEastern EuropeanEcuadorianEgyptianEnglishEstonianEthiopianEuropeanFijianFilipinoFinnishFrenchFrench American IndianFrench CanadianGermanGerman RussianGhanaianGreekGuamanian/ChamorroGuatemalanGuyaneseHaitianHmongHonduranHopiHoumaHungarianIcelanderIndian (Asian)IndonesianInupiatIranianIraqiIrishIroquoisIsraeliItalianJamaicanJapaneseJordanianKenyanKiowaKoreanLaotianLatvianLebaneseLiberianLithuanianLumbeeLuxembourgerMacedonianMalaysianMalteseMarshalleseMenomineeMexicanMexican American IndianMongolianMoroccanNative HawaiianNavajoNepaleseNew ZealanderNicaraguanNigerianNorthern EuropeanNorwegianOkinawanOsageOttawaPaiutePakistaniPalestinianPanamanianParaguayanPennsylvania GermanPeruvianPimaPolishPortuguesePotawatomiPuebloPuerto RicanPuget Sound SalishRomanianRussianSalvadoranSamoanScandinavianScotch-IrishScottishSeminoleSenegaleseSerbianShoshoneSierra LeoneanSiouxSlavicSlovakSloveneSomaliSouth AfricanSouth AmericanSouth American IndianSoviet UnionSpaniardSpanishSpanish AmericanSpanish American IndianSri LankanSubsaharan AfricanSudaneseSwedishSwissSyrianTaiwaneseThaiTlingit-HaidaTohono O'OdhamTonganTrinidadian and TobagonianTsimshianTurkishU.S. Virgin IslanderUgandanUkrainianUruguayanUteVenezuelanVietnameseWelshWest IndianYakamaYaquiYugoslavianYumanYup'ikZimbabwean
Immigration
NonimmigrantsImmigrantsAfghanistanAfricaAlbaniaArgentinaArmeniaAsiaAustraliaAustriaBahamasBangladeshBarbadosBelarusBelgiumBelizeBoliviaBosnia and HerzegovinaBrazilBulgariaBurma/MyanmarCabo VerdeCambodiaCameroonCanadaCaribbeanCentral AmericaChileChinaColombiaCongoCosta RicaCroatiaCubaCzechoslovakiaDenmarkDominicaDominican RepublicEastern AfricaEastern AsiaEastern EuropeEcuadorEgyptEl SalvadorEnglandEritreaEthiopiaEuropeFijiFranceGermanyGhanaGreeceGrenadaGuyanaHaitiHondurasHong KongHungaryIndiaIndonesiaIranIraqIrelandIsraelItalyJamaicaJapanJordanKazakhstanKenyaKoreaKuwaitLaosLatin AmericaLatviaLebanonLiberiaLithuaniaMalaysiaMexicoMicronesiaMiddle AfricaMoldovaMoroccoNepalNetherlandsNicaraguaNigeriaNorth AmericaNorth MacedoniaNorthern AfricaNorthern EuropeNorwayOceaniaPakistanPanamaPeruPhilippinesPolandPortugalRomaniaRussiaSaudi ArabiaScotlandSenegalSerbiaSierra LeoneSingaporeSomaliaSouth AfricaSouth AmericaSouth Central AsiaSouth Eastern AsiaSouthern EuropeSpainSri LankaSt. Vincent and the GrenadinesSudanSwedenSwitzerlandSyriaTaiwanThailandTrinidad and TobagoTurkeyUgandaUkraineUruguayUzbekistanVenezuelaVietnamWest IndiesWestern AfricaWestern AsiaWestern EuropeYemenZaireZimbabweAzores
Immigrants from Guatemala
Race
Ancestry
AfghanAfricanAlaska NativeAlaskan AthabascanAlbanianAleutAlsatianAmericanApacheArabArapahoArgentineanArmenianAssyrian/Chaldean/SyriacAustralianAustrianBahamianBangladeshiBarbadianBasqueBelgianBelizeanBermudanBhutaneseBlackfeetBolivianBrazilianBritishBritish West IndianBulgarianBurmeseCajunCambodianCanadianCape VerdeanCarpatho RusynCelticCentral AmericanCentral American IndianCherokeeCheyenneChickasawChileanChineseChippewaChoctawColombianColvilleComancheCosta RicanCreeCreekCroatianCrowCubanCypriotCzechCzechoslovakianDanishDelawareDominicanDutch West IndianEastern EuropeanEcuadorianEgyptianEnglishEstonianEthiopianEuropeanFijianFilipinoFinnishFrenchFrench American IndianFrench CanadianGermanGerman RussianGhanaianGreekGuamanian/ChamorroGuatemalanGuyaneseHaitianHmongHonduranHopiHoumaHungarianIcelanderIndian (Asian)IndonesianInupiatIranianIraqiIrishIroquoisIsraeliItalianJamaicanJapaneseJordanianKenyanKiowaKoreanLaotianLatvianLebaneseLiberianLithuanianLumbeeLuxembourgerMacedonianMalaysianMalteseMarshalleseMenomineeMexicanMexican American IndianMongolianMoroccanNative HawaiianNavajoNepaleseNew ZealanderNicaraguanNigerianNorthern EuropeanNorwegianOkinawanOsageOttawaPaiutePakistaniPalestinianPanamanianParaguayanPennsylvania GermanPeruvianPimaPolishPortuguesePotawatomiPuebloPuerto RicanPuget Sound SalishRomanianRussianSalvadoranSamoanScandinavianScotch-IrishScottishSeminoleSenegaleseSerbianShoshoneSierra LeoneanSiouxSlavicSlovakSloveneSomaliSouth AfricanSouth AmericanSouth American IndianSoviet UnionSpaniardSpanishSpanish AmericanSpanish American IndianSri LankanSubsaharan AfricanSudaneseSwedishSwissSyrianTaiwaneseThaiTlingit-HaidaTohono O'OdhamTonganTrinidadian and TobagonianTsimshianTurkishU.S. Virgin IslanderUgandanUkrainianUruguayanUteVenezuelanVietnameseWelshWest IndianYakamaYaquiYugoslavianYumanYup'ikZimbabwean
Immigration
NonimmigrantsImmigrantsAfghanistanAfricaAlbaniaArgentinaArmeniaAsiaAustraliaAustriaBahamasBangladeshBarbadosBelarusBelgiumBelizeBoliviaBosnia and HerzegovinaBrazilBulgariaBurma/MyanmarCabo VerdeCambodiaCameroonCanadaCaribbeanCentral AmericaChileChinaColombiaCongoCosta RicaCroatiaCubaCzechoslovakiaDenmarkDominicaDominican RepublicEastern AfricaEastern AsiaEastern EuropeEcuadorEgyptEl SalvadorEnglandEritreaEthiopiaEuropeFijiFranceGermanyGhanaGreeceGrenadaGuatemalaGuyanaHaitiHondurasHong KongHungaryIndiaIndonesiaIranIraqIrelandIsraelItalyJamaicaJapanJordanKazakhstanKenyaKoreaKuwaitLaosLatin AmericaLatviaLebanonLiberiaLithuaniaMalaysiaMexicoMicronesiaMiddle AfricaMoldovaMoroccoNepalNetherlandsNicaraguaNigeriaNorth AmericaNorth MacedoniaNorthern AfricaNorthern EuropeNorwayOceaniaPakistanPanamaPeruPhilippinesPolandPortugalRomaniaRussiaSaudi ArabiaScotlandSenegalSerbiaSierra LeoneSingaporeSomaliaSouth AfricaSouth AmericaSouth Central AsiaSouth Eastern AsiaSouthern EuropeSpainSri LankaSt. Vincent and the GrenadinesSudanSwedenSwitzerlandSyriaTaiwanThailandTrinidad and TobagoTurkeyUgandaUkraineUruguayUzbekistanVenezuelaVietnamWest IndiesWestern AfricaWestern AsiaWestern EuropeYemenZaireZimbabweAzores
Receiving Food Stamps
Income
Poverty
Unemployment
Labor Participation
Family Structure
Vehicle Availability
Education Level
Disability

Receiving Food Stamps Comparison

Dutch

Immigrants from Guatemala

Exceptional
Tragic
10.0%
RECEIVING FOOD STAMPS
98.6/ 100
METRIC RATING
83rd/ 347
METRIC RANK
14.6%
RECEIVING FOOD STAMPS
0.1/ 100
METRIC RATING
271st/ 347
METRIC RANK

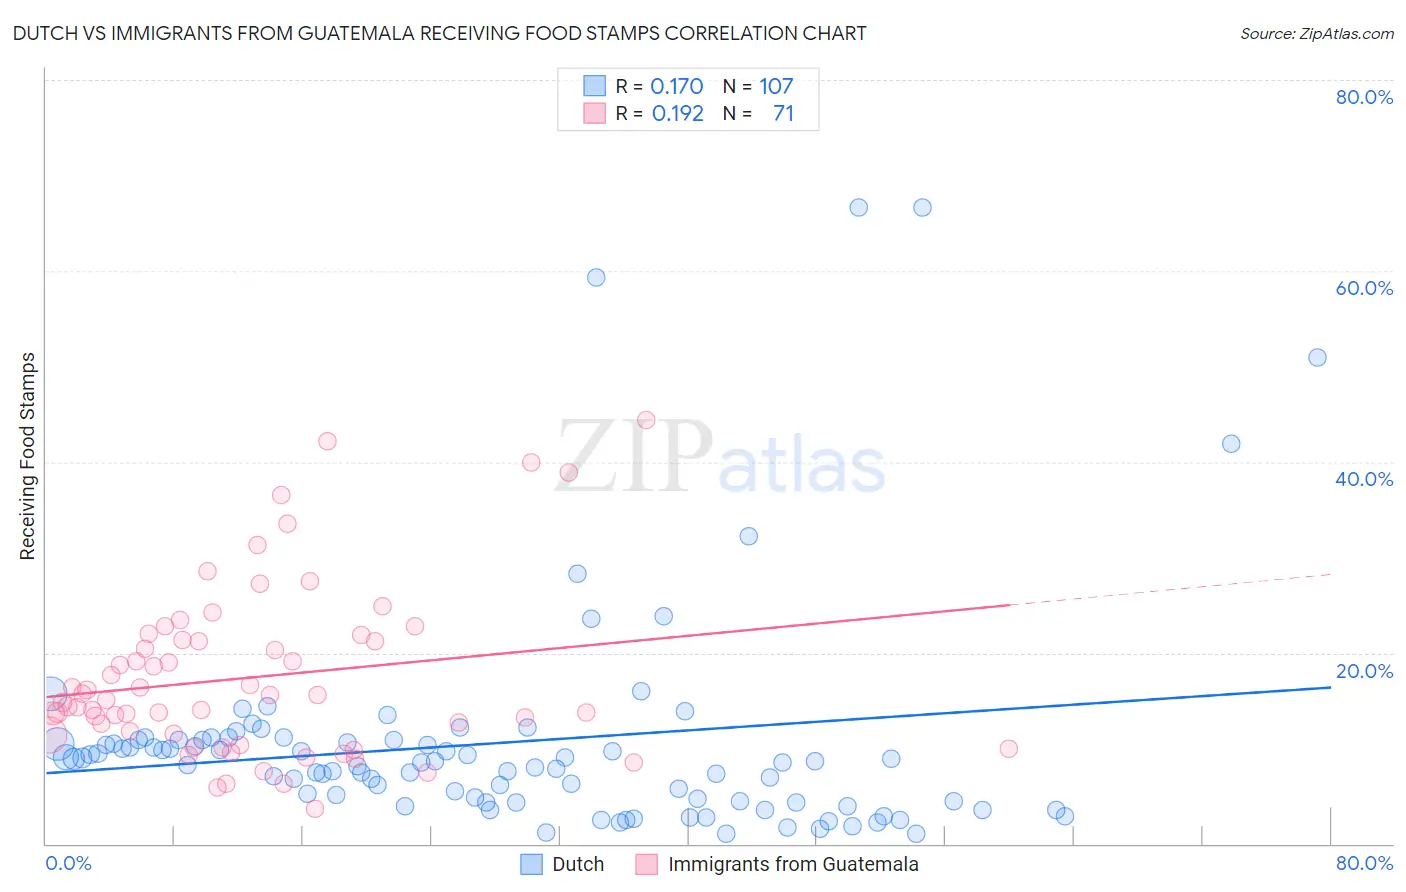
Dutch vs Immigrants from Guatemala Receiving Food Stamps Correlation Chart

The statistical analysis conducted on geographies consisting of 551,299,483 people shows a poor positive correlation between the proportion of Dutch and percentage of population receiving government assistance and/or food stamps in the United States with a correlation coefficient (R) of 0.170 and weighted average of 10.0%. Similarly, the statistical analysis conducted on geographies consisting of 376,736,274 people shows a poor positive correlation between the proportion of Immigrants from Guatemala and percentage of population receiving government assistance and/or food stamps in the United States with a correlation coefficient (R) of 0.192 and weighted average of 14.6%, a difference of 46.4%.
Dutch vs Immigrants from Guatemala Receiving Food Stamps

Receiving Food Stamps Correlation Summary

MeasurementDutchImmigrants from Guatemala
Minimum0.99%3.7%
Maximum66.7%44.4%
Range65.7%40.7%
Mean10.6%17.4%
Median8.5%15.1%
Interquartile 25% (IQ1)4.5%11.4%
Interquartile 75% (IQ3)10.8%21.3%
Interquartile Range (IQR)6.3%10.0%
Standard Deviation (Sample)11.8%8.9%
Standard Deviation (Population)11.7%8.8%

Similar Demographics by Receiving Food Stamps

Demographics Similar to Dutch by Receiving Food Stamps

In terms of receiving food stamps, the demographic groups most similar to Dutch are Austrian (10.0%, a difference of 0.0%), Immigrants from Israel (10.0%, a difference of 0.070%), Immigrants from England (10.0%, a difference of 0.13%), Immigrants from Romania (10.0%, a difference of 0.25%), and Polish (10.0%, a difference of 0.27%).
DemographicsRating | RankReceiving Food Stamps
Immigrants | Croatia
98.7
/100
|
#76
Exceptional
10.0%
Immigrants | North Macedonia
98.7
/100
|
#77
Exceptional
10.0%
South Africans
98.7
/100
|
#78
Exceptional
10.0%
Laotians
98.7
/100
|
#79
Exceptional
10.0%
Poles
98.6
/100
|
#80
Exceptional
10.0%
Immigrants | England
98.6
/100
|
#81
Exceptional
10.0%
Austrians
98.6
/100
|
#82
Exceptional
10.0%
Dutch
98.6
/100
|
#83
Exceptional
10.0%
Immigrants | Israel
98.5
/100
|
#84
Exceptional
10.0%
Immigrants | Romania
98.5
/100
|
#85
Exceptional
10.0%
Immigrants | Norway
98.4
/100
|
#86
Exceptional
10.0%
Egyptians
98.4
/100
|
#87
Exceptional
10.0%
Immigrants | Kuwait
98.4
/100
|
#88
Exceptional
10.0%
Immigrants | France
98.3
/100
|
#89
Exceptional
10.1%
Finns
97.9
/100
|
#90
Exceptional
10.2%

Demographics Similar to Immigrants from Guatemala by Receiving Food Stamps

In terms of receiving food stamps, the demographic groups most similar to Immigrants from Guatemala are Mexican (14.6%, a difference of 0.090%), Chippewa (14.7%, a difference of 0.22%), Alaskan Athabascan (14.7%, a difference of 0.25%), Immigrants from Western Africa (14.7%, a difference of 0.27%), and Nepalese (14.6%, a difference of 0.30%).
DemographicsRating | RankReceiving Food Stamps
Immigrants | Uzbekistan
0.2
/100
|
#264
Tragic
14.3%
Blackfeet
0.2
/100
|
#265
Tragic
14.3%
Cheyenne
0.2
/100
|
#266
Tragic
14.3%
Dutch West Indians
0.2
/100
|
#267
Tragic
14.3%
Guatemalans
0.1
/100
|
#268
Tragic
14.4%
Nepalese
0.1
/100
|
#269
Tragic
14.6%
Mexicans
0.1
/100
|
#270
Tragic
14.6%
Immigrants | Guatemala
0.1
/100
|
#271
Tragic
14.6%
Chippewa
0.1
/100
|
#272
Tragic
14.7%
Alaskan Athabascans
0.1
/100
|
#273
Tragic
14.7%
Immigrants | Western Africa
0.1
/100
|
#274
Tragic
14.7%
Ute
0.1
/100
|
#275
Tragic
14.7%
Liberians
0.1
/100
|
#276
Tragic
14.8%
Seminole
0.1
/100
|
#277
Tragic
14.8%
Belizeans
0.1
/100
|
#278
Tragic
14.8%