Zip Codes with the Highest Percentage of Population Employed in Food Preparation & Serving in Lancaster, PA
RELATED REPORTS & OPTIONS
Food Preparation & Serving
Lancaster
Compare Zip Codes
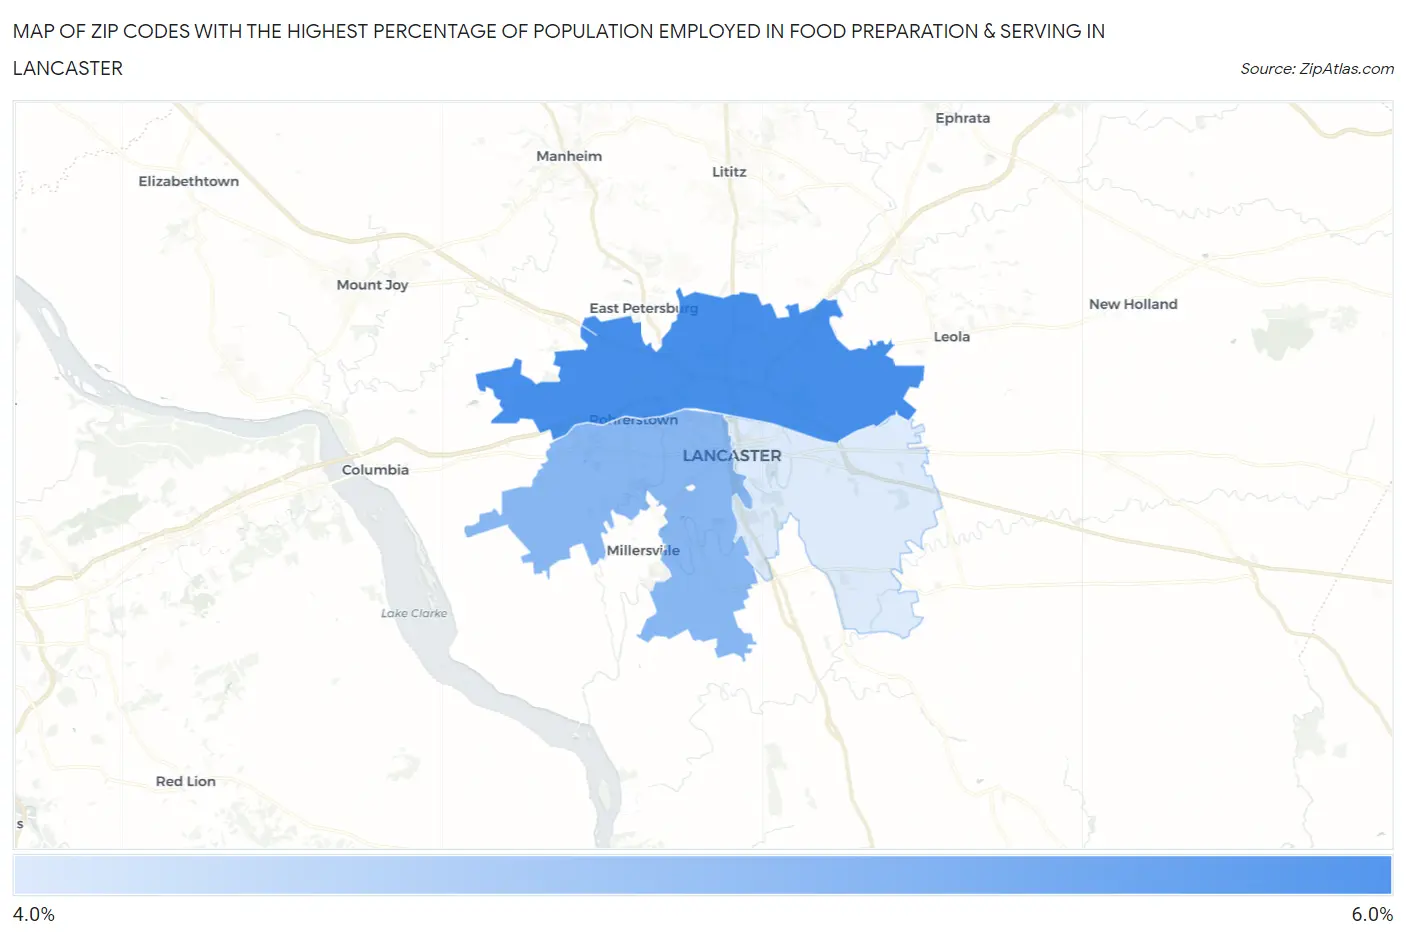
Map of Zip Codes with the Highest Percentage of Population Employed in Food Preparation & Serving in Lancaster
0.0%
6.0%
Zip Codes with the Highest Percentage of Population Employed in Food Preparation & Serving in Lancaster, PA
| Zip Code | % Employed | vs State | vs National | |
| 1. | 17601 | 5.6% | 5.0%(+0.529)#594 | 5.3%(+0.287)#10,795 |
| 2. | 17603 | 5.2% | 5.0%(+0.149)#686 | 5.3%(-0.094)#12,176 |
| 3. | 17602 | 4.7% | 5.0%(-0.366)#827 | 5.3%(-0.609)#14,255 |
1
Common Questions
What are the Top Zip Codes with the Highest Percentage of Population Employed in Food Preparation & Serving in Lancaster, PA?
Top Zip Codes with the Highest Percentage of Population Employed in Food Preparation & Serving in Lancaster, PA are:
What zip code has the Highest Percentage of Population Employed in Food Preparation & Serving in Lancaster, PA?
17601 has the Highest Percentage of Population Employed in Food Preparation & Serving in Lancaster, PA with 5.6%.
What is the Percentage of Population Employed in Food Preparation & Serving in Lancaster, PA?
Percentage of Population Employed in Food Preparation & Serving in Lancaster is 5.6%.
What is the Percentage of Population Employed in Food Preparation & Serving in Pennsylvania?
Percentage of Population Employed in Food Preparation & Serving in Pennsylvania is 5.0%.
What is the Percentage of Population Employed in Food Preparation & Serving in the United States?
Percentage of Population Employed in Food Preparation & Serving in the United States is 5.3%.