Zip Codes with the Highest Percentage of Population Employed in Food Preparation & Serving in Allentown, PA
RELATED REPORTS & OPTIONS
Food Preparation & Serving
Allentown
Compare Zip Codes
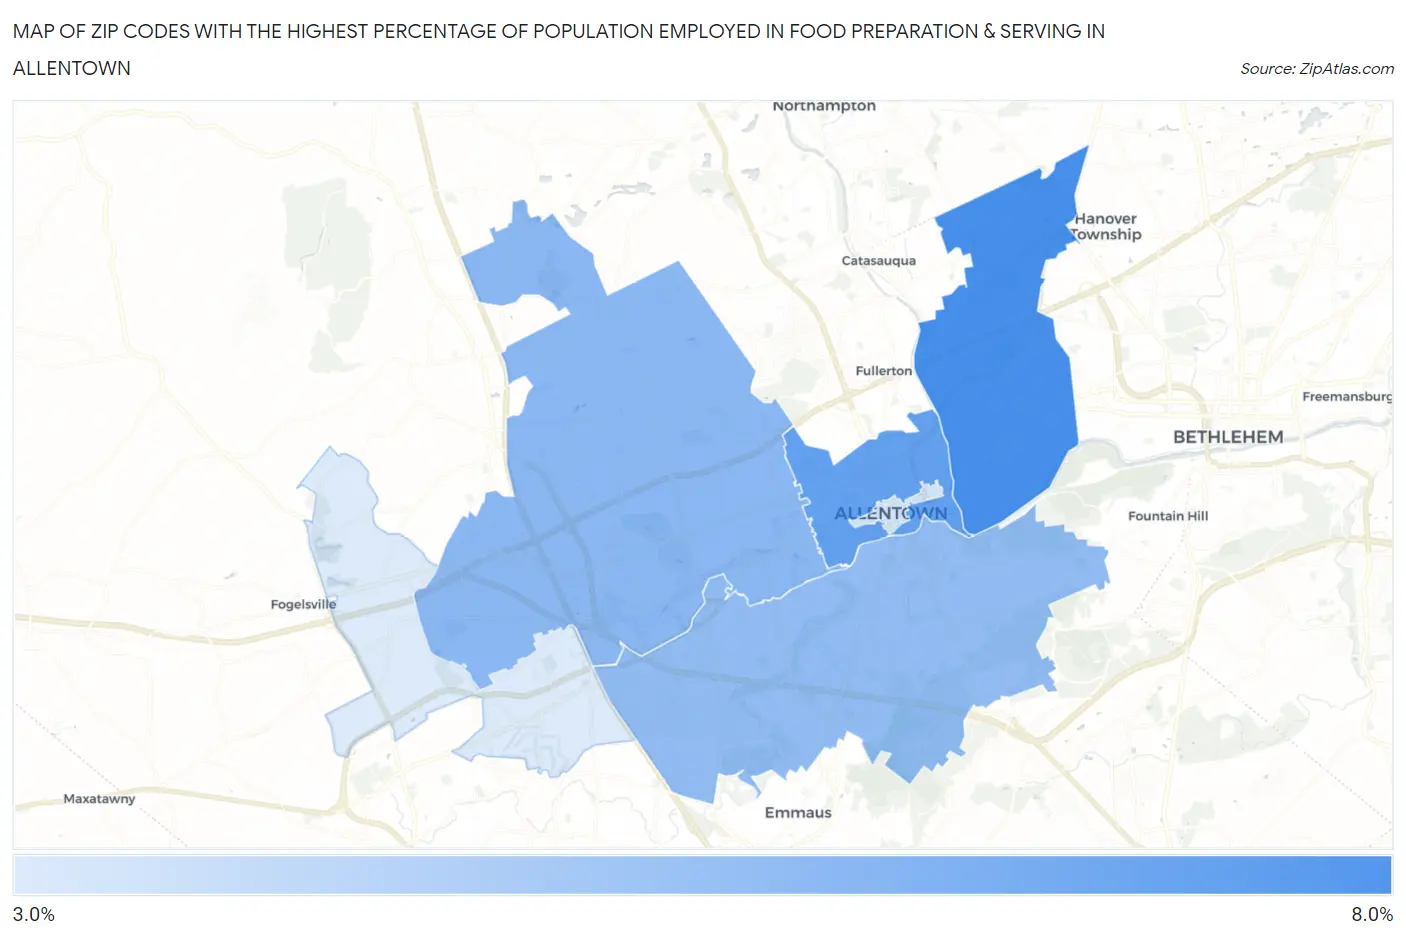
Map of Zip Codes with the Highest Percentage of Population Employed in Food Preparation & Serving in Allentown
0.0%
8.0%
Zip Codes with the Highest Percentage of Population Employed in Food Preparation & Serving in Allentown, PA
| Zip Code | % Employed | vs State | vs National | |
| 1. | 18109 | 7.0% | 5.0%(+1.92)#342 | 5.3%(+1.68)#6,650 |
| 2. | 18102 | 6.3% | 5.0%(+1.21)#453 | 5.3%(+0.971)#8,556 |
| 3. | 18104 | 5.2% | 5.0%(+0.181)#675 | 5.3%(-0.061)#12,046 |
| 4. | 18103 | 5.1% | 5.0%(+0.016)#712 | 5.3%(-0.226)#12,689 |
| 5. | 18101 | 3.3% | 5.0%(-1.71)#1,141 | 5.3%(-1.95)#19,900 |
| 6. | 18106 | 3.1% | 5.0%(-1.97)#1,200 | 5.3%(-2.21)#20,950 |
1
Common Questions
What are the Top 5 Zip Codes with the Highest Percentage of Population Employed in Food Preparation & Serving in Allentown, PA?
Top 5 Zip Codes with the Highest Percentage of Population Employed in Food Preparation & Serving in Allentown, PA are:
What zip code has the Highest Percentage of Population Employed in Food Preparation & Serving in Allentown, PA?
18109 has the Highest Percentage of Population Employed in Food Preparation & Serving in Allentown, PA with 7.0%.
What is the Percentage of Population Employed in Food Preparation & Serving in Allentown, PA?
Percentage of Population Employed in Food Preparation & Serving in Allentown is 6.1%.
What is the Percentage of Population Employed in Food Preparation & Serving in Pennsylvania?
Percentage of Population Employed in Food Preparation & Serving in Pennsylvania is 5.0%.
What is the Percentage of Population Employed in Food Preparation & Serving in the United States?
Percentage of Population Employed in Food Preparation & Serving in the United States is 5.3%.