Zip Codes with the Highest Percentage of Population Employed in Food Preparation & Serving in Lebanon, PA
RELATED REPORTS & OPTIONS
Food Preparation & Serving
Lebanon
Compare Zip Codes
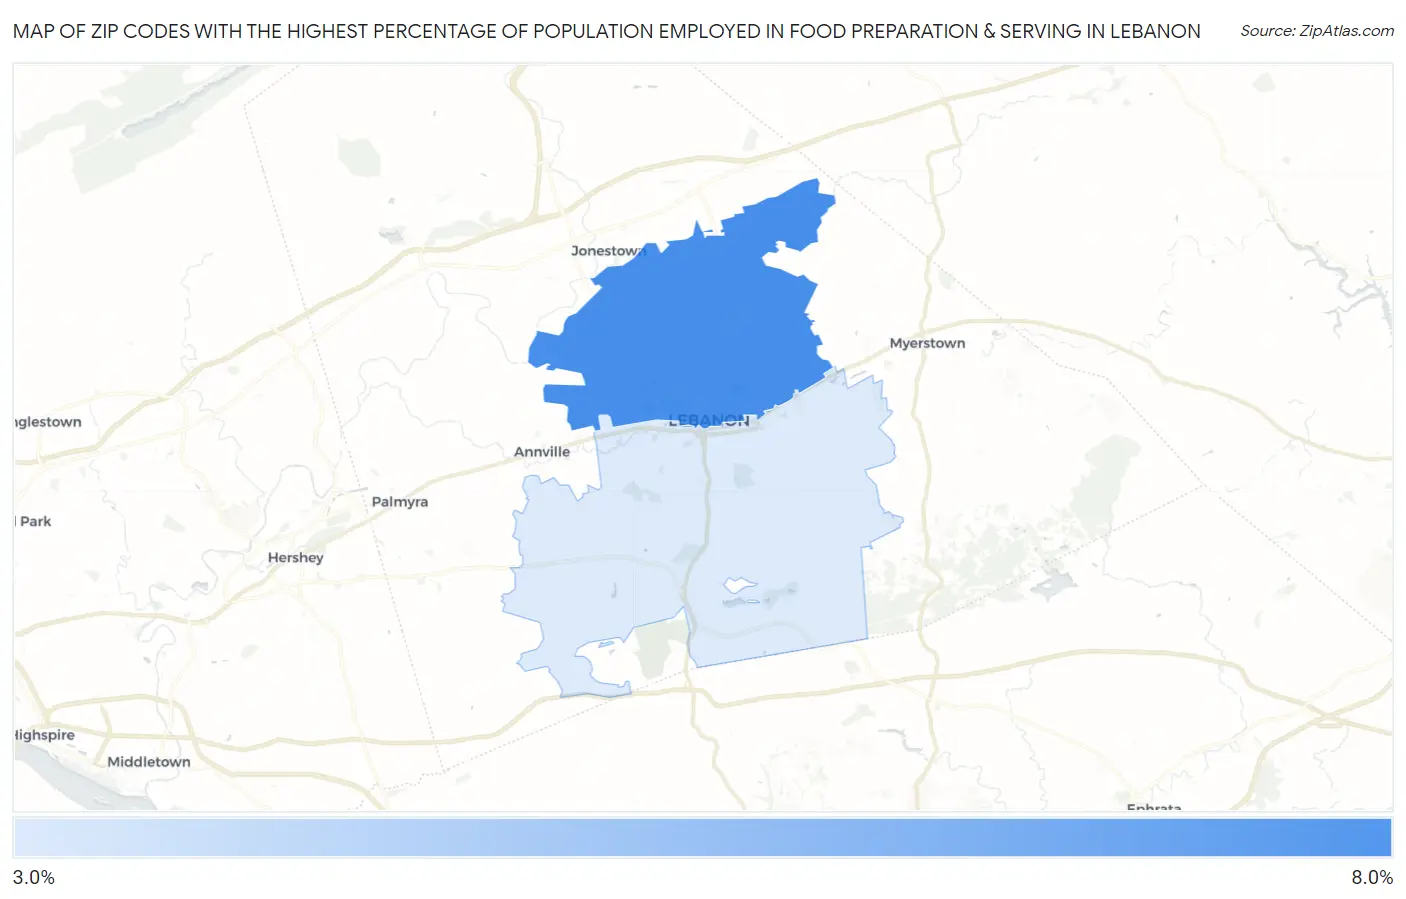
Map of Zip Codes with the Highest Percentage of Population Employed in Food Preparation & Serving in Lebanon
0.0%
8.0%
Zip Codes with the Highest Percentage of Population Employed in Food Preparation & Serving in Lebanon, PA
| Zip Code | % Employed | vs State | vs National | |
| 1. | 17046 | 7.1% | 5.0%(+2.09)#329 | 5.3%(+1.85)#6,276 |
| 2. | 17042 | 3.9% | 5.0%(-1.13)#1,014 | 5.3%(-1.38)#17,497 |
1
Common Questions
What are the Top Zip Codes with the Highest Percentage of Population Employed in Food Preparation & Serving in Lebanon, PA?
Top Zip Codes with the Highest Percentage of Population Employed in Food Preparation & Serving in Lebanon, PA are:
What zip code has the Highest Percentage of Population Employed in Food Preparation & Serving in Lebanon, PA?
17046 has the Highest Percentage of Population Employed in Food Preparation & Serving in Lebanon, PA with 7.1%.
What is the Percentage of Population Employed in Food Preparation & Serving in Lebanon, PA?
Percentage of Population Employed in Food Preparation & Serving in Lebanon is 6.4%.
What is the Percentage of Population Employed in Food Preparation & Serving in Pennsylvania?
Percentage of Population Employed in Food Preparation & Serving in Pennsylvania is 5.0%.
What is the Percentage of Population Employed in Food Preparation & Serving in the United States?
Percentage of Population Employed in Food Preparation & Serving in the United States is 5.3%.