Zip Codes with the Highest Percentage of Population with a Degree in Physical and Health Sciences in Lancaster, PA

RELATED REPORTS & OPTIONS

Physical and Health Sciences
Population
Families and Households
Female Fertility
Female Fertility (Unmarried)
Race (Community Size)
Race (Percentage)
Ancestry (Community Size)
AfricanAmericanApacheArabArmenianAustrianBarbadianBelgianBhutaneseBlackfeetBrazilianBritishBurmeseCanadianCentral AmericanCentral American IndianCherokeeChileanColombianCroatianCubanCzechCzechoslovakianDanishDominicanDutchDutch West IndianEastern EuropeanEcuadorianEnglishEthiopianEuropeanFinnishFrenchFrench CanadianGermanGreekGuatemalanHaitianHonduranHungarianIndian (Asian)IndonesianInupiatIranianIrishItalianJamaicanJapaneseKoreanLaotianLatvianLebaneseLithuanianMalaysianMexicanMexican American IndianNative HawaiianNigerianNorthern EuropeanNorwegianPakistaniPanamanianPennsylvania GermanPeruvianPolishPortuguesePuerto RicanRomanianRussianSalvadoranSamoanScandinavianScotch-IrishScottishSerbianSlavicSlovakSouth AmericanSouth American IndianSpaniardSpanishSri LankanSubsaharan AfricanSwedishSwissThaiTurkishUkrainianWelshWest IndianYugoslavian
Ancestry (Percentage)
AfricanAmericanApacheArabArmenianAustrianBarbadianBelgianBhutaneseBlackfeetBrazilianBritishBurmeseCanadianCentral AmericanCentral American IndianCherokeeChileanColombianCroatianCubanCzechCzechoslovakianDanishDominicanDutchDutch West IndianEastern EuropeanEcuadorianEnglishEthiopianEuropeanFinnishFrenchFrench CanadianGermanGreekGuatemalanHaitianHonduranHungarianIndian (Asian)IndonesianInupiatIranianIrishItalianJamaicanJapaneseKoreanLaotianLatvianLebaneseLithuanianMalaysianMexicanMexican American IndianNative HawaiianNigerianNorthern EuropeanNorwegianPakistaniPanamanianPennsylvania GermanPeruvianPolishPortuguesePuerto RicanRomanianRussianSalvadoranSamoanScandinavianScotch-IrishScottishSerbianSlavicSlovakSouth AmericanSouth American IndianSpaniardSpanishSri LankanSubsaharan AfricanSwedishSwissThaiTurkishUkrainianWelshWest IndianYugoslavian
Immigrant Origin (Total)
Immigrant Origin (Percentage)
Income
Income (Families)
Income (Households)
Poverty
Poverty (Families)
Unemployment
Employment Occupations
Employment Industries
Employer Class
Commute Time
Commute Means
School Enrollment
Education by Degree Field
Occupancy
Finances
Physical Characteristics
Lancaster
Compare Zip Codes
Comparison Subject

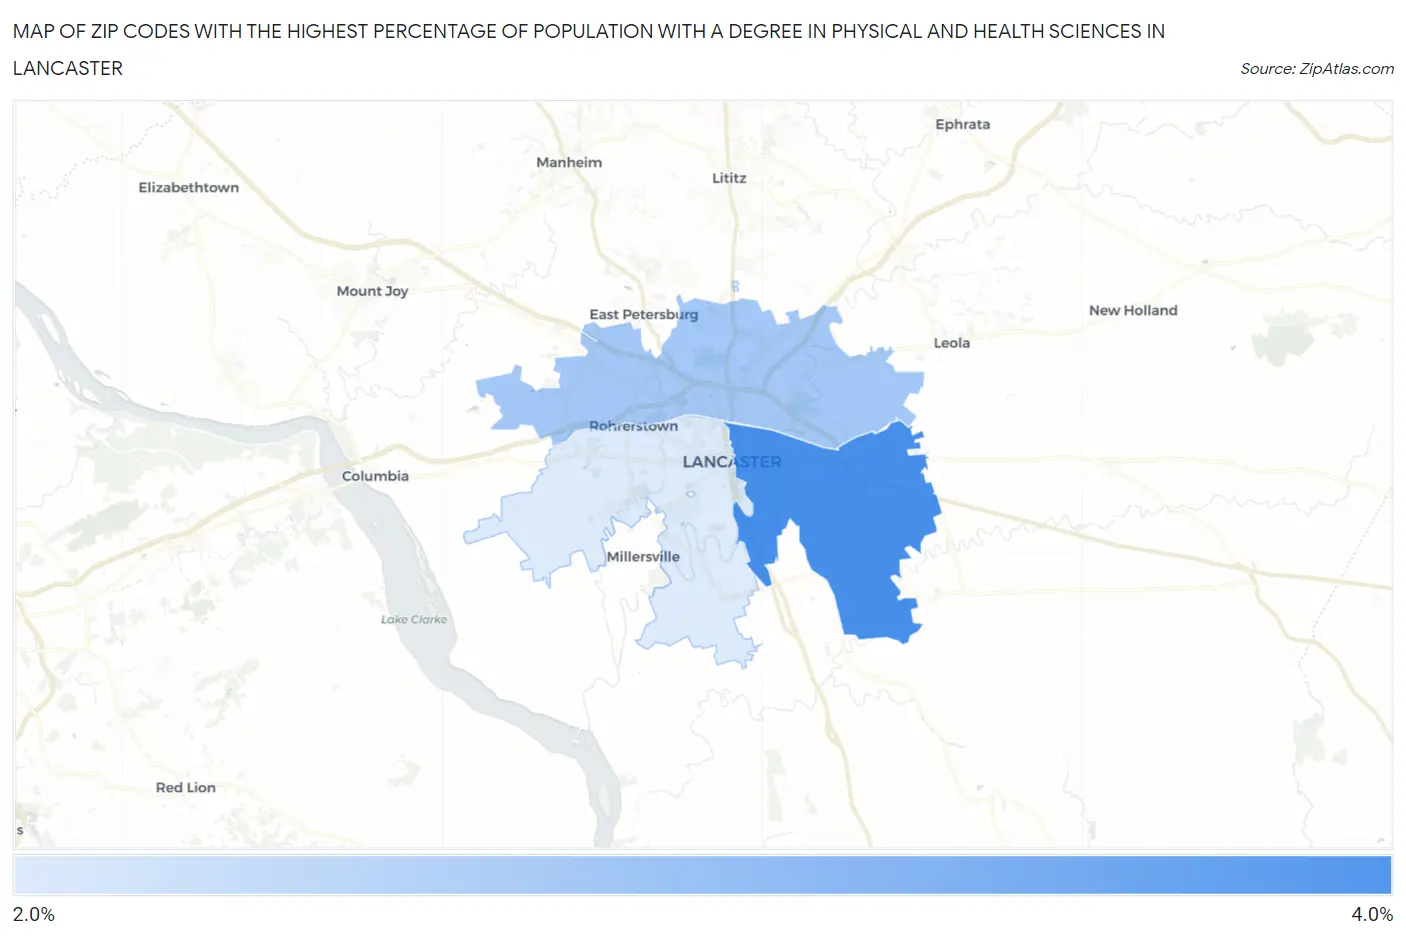
Map of Zip Codes with the Highest Percentage of Population with a Degree in Physical and Health Sciences in Lancaster

0.0%
4.0%
Zip Codes with the Highest Percentage of Population with a Degree in Physical and Health Sciences in Lancaster Map

Zip Codes with the Highest Percentage of Population with a Degree in Physical and Health Sciences in Lancaster, PA

Zip Code % Graduates vs State vs National
1.176024.0%3.3%(+0.715)#3923.1%(+0.893)#6,789
2.176013.0%3.3%(-0.284)#6063.1%(-0.107)#10,444
3.176032.4%3.3%(-0.901)#7483.1%(-0.723)#13,303

Common Questions

What are the Top 3 Zip Codes with the Highest Percentage of Population with a Degree in Physical and Health Sciences in Lancaster, PA?
Top 3 Zip Codes with the Highest Percentage of Population with a Degree in Physical and Health Sciences in Lancaster, PA are:
#1
4.0%
#2
3.0%
#3
2.4%
What zip code has the Highest Percentage of Population with a Degree in Physical and Health Sciences in Lancaster, PA?
17602 has the Highest Percentage of Population with a Degree in Physical and Health Sciences in Lancaster, PA with 4.0%.
What is the Percentage of Population with a Degree in Physical and Health Sciences in Lancaster, PA?
Percentage of Population with a Degree in Physical and Health Sciences in Lancaster is 1.7%.
What is the Percentage of Population with a Degree in Physical and Health Sciences in Pennsylvania?
Percentage of Population with a Degree in Physical and Health Sciences in Pennsylvania is 3.3%.
What is the Percentage of Population with a Degree in Physical and Health Sciences in the United States?
Percentage of Population with a Degree in Physical and Health Sciences in the United States is 3.1%.