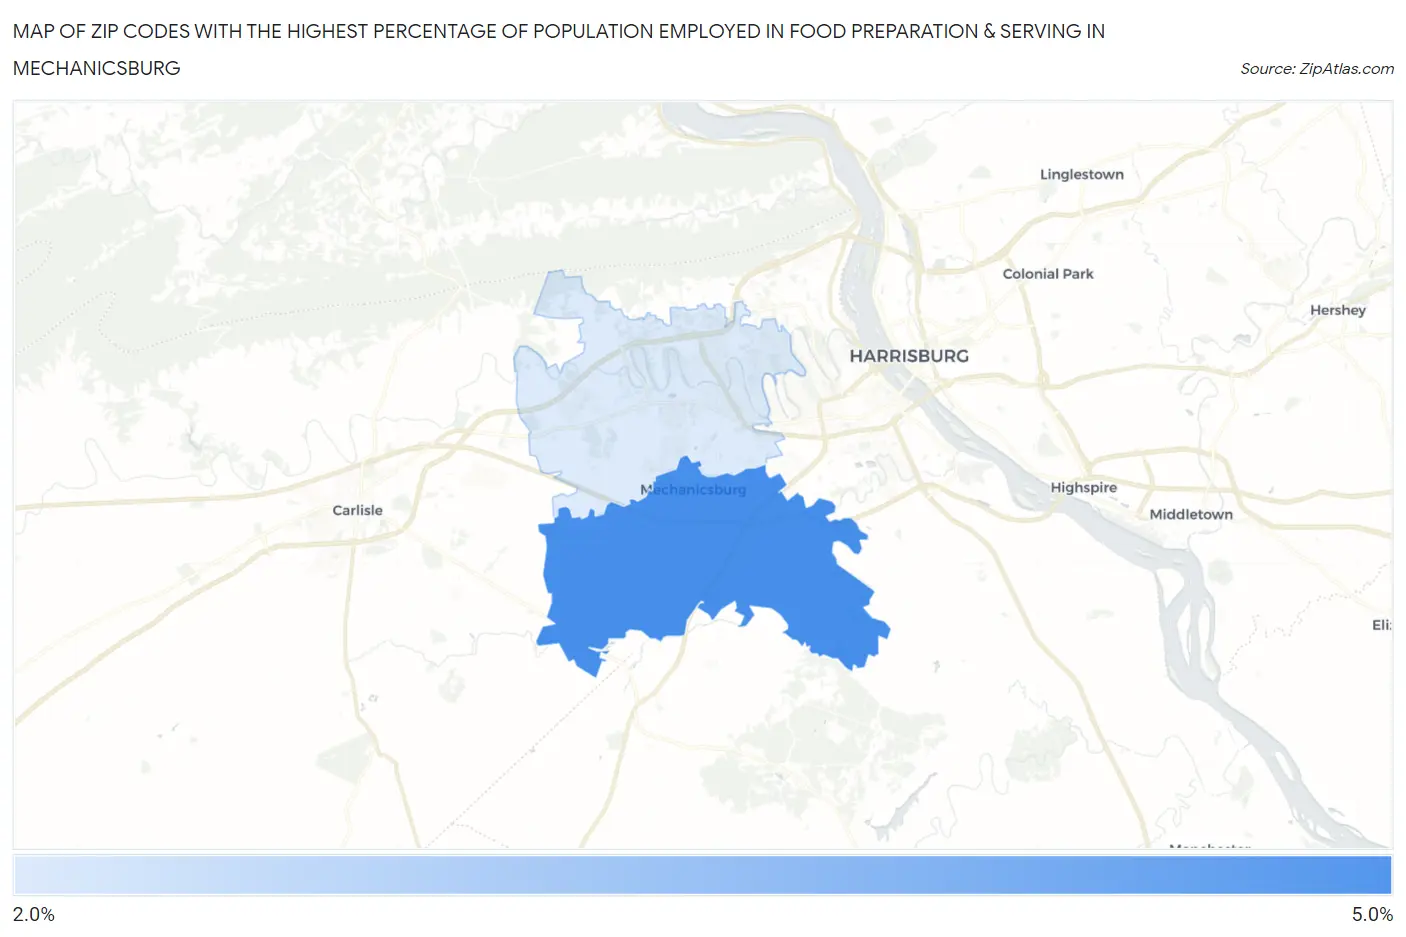
Zip Codes with the Highest Percentage of Population Employed in Food Preparation & Serving in Mechanicsburg, PA
RELATED REPORTS & OPTIONS
Food Preparation & Serving
Mechanicsburg
Compare Zip Codes
Map of Zip Codes with the Highest Percentage of Population Employed in Food Preparation & Serving in Mechanicsburg
0.0%
5.0%
Zip Codes with the Highest Percentage of Population Employed in Food Preparation & Serving in Mechanicsburg, PA
| Zip Code | % Employed | vs State | vs National | |
| 1. | 17055 | 4.4% | 5.0%(-0.647)#908 | 5.3%(-0.889)#15,434 |
| 2. | 17050 | 2.9% | 5.0%(-2.12)#1,231 | 5.3%(-2.36)#21,545 |
1
Common Questions
What are the Top Zip Codes with the Highest Percentage of Population Employed in Food Preparation & Serving in Mechanicsburg, PA?
Top Zip Codes with the Highest Percentage of Population Employed in Food Preparation & Serving in Mechanicsburg, PA are:
What zip code has the Highest Percentage of Population Employed in Food Preparation & Serving in Mechanicsburg, PA?
17055 has the Highest Percentage of Population Employed in Food Preparation & Serving in Mechanicsburg, PA with 4.4%.
What is the Percentage of Population Employed in Food Preparation & Serving in Pennsylvania?
Percentage of Population Employed in Food Preparation & Serving in Pennsylvania is 5.0%.
What is the Percentage of Population Employed in Food Preparation & Serving in the United States?
Percentage of Population Employed in Food Preparation & Serving in the United States is 5.3%.