Zip Codes with the Highest Percentage of Population Employed in Architecture & Engineering in Ponca City, OK
RELATED REPORTS & OPTIONS
Architecture & Engineering
Ponca City
Compare Zip Codes
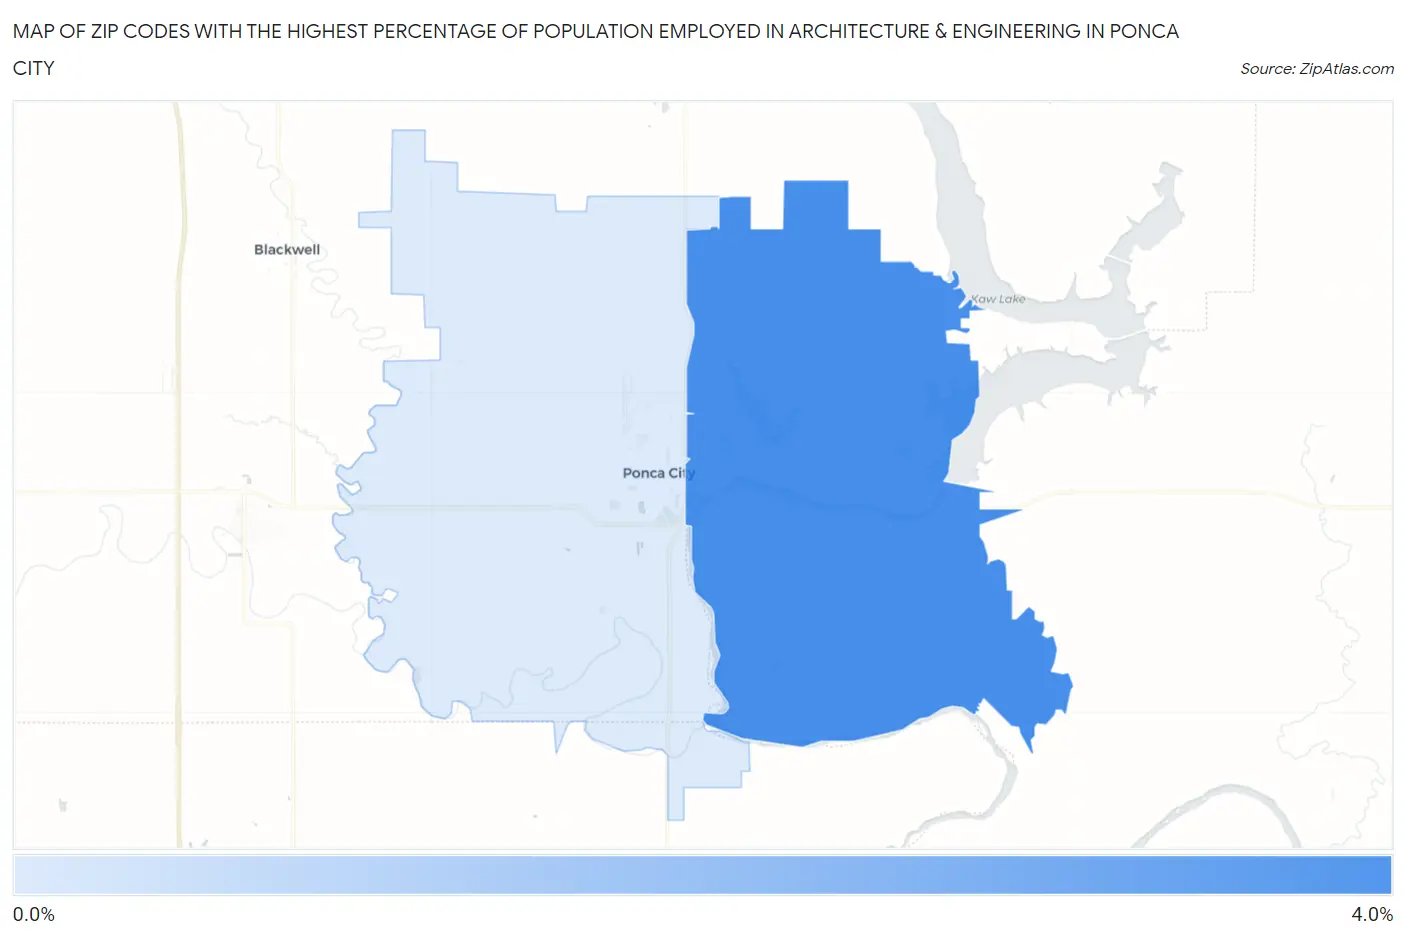
Map of Zip Codes with the Highest Percentage of Population Employed in Architecture & Engineering in Ponca City
0.0%
4.0%
Zip Codes with the Highest Percentage of Population Employed in Architecture & Engineering in Ponca City, OK
| Zip Code | % Employed | vs State | vs National | |
| 1. | 74604 | 3.0% | 1.8%(+1.19)#65 | 2.1%(+0.874)#4,978 |
| 2. | 74601 | 0.99% | 1.8%(-0.851)#274 | 2.1%(-1.16)#16,695 |
1
Common Questions
What are the Top Zip Codes with the Highest Percentage of Population Employed in Architecture & Engineering in Ponca City, OK?
Top Zip Codes with the Highest Percentage of Population Employed in Architecture & Engineering in Ponca City, OK are:
What zip code has the Highest Percentage of Population Employed in Architecture & Engineering in Ponca City, OK?
74604 has the Highest Percentage of Population Employed in Architecture & Engineering in Ponca City, OK with 3.0%.
What is the Percentage of Population Employed in Architecture & Engineering in Ponca City, OK?
Percentage of Population Employed in Architecture & Engineering in Ponca City is 1.6%.
What is the Percentage of Population Employed in Architecture & Engineering in Oklahoma?
Percentage of Population Employed in Architecture & Engineering in Oklahoma is 1.8%.
What is the Percentage of Population Employed in Architecture & Engineering in the United States?
Percentage of Population Employed in Architecture & Engineering in the United States is 2.1%.