Zip Codes with the Highest Percentage of Households with Income Above $200,000 in Ponca City, OK
RELATED REPORTS & OPTIONS
Household Income | $200k+
Ponca City
Compare Zip Codes
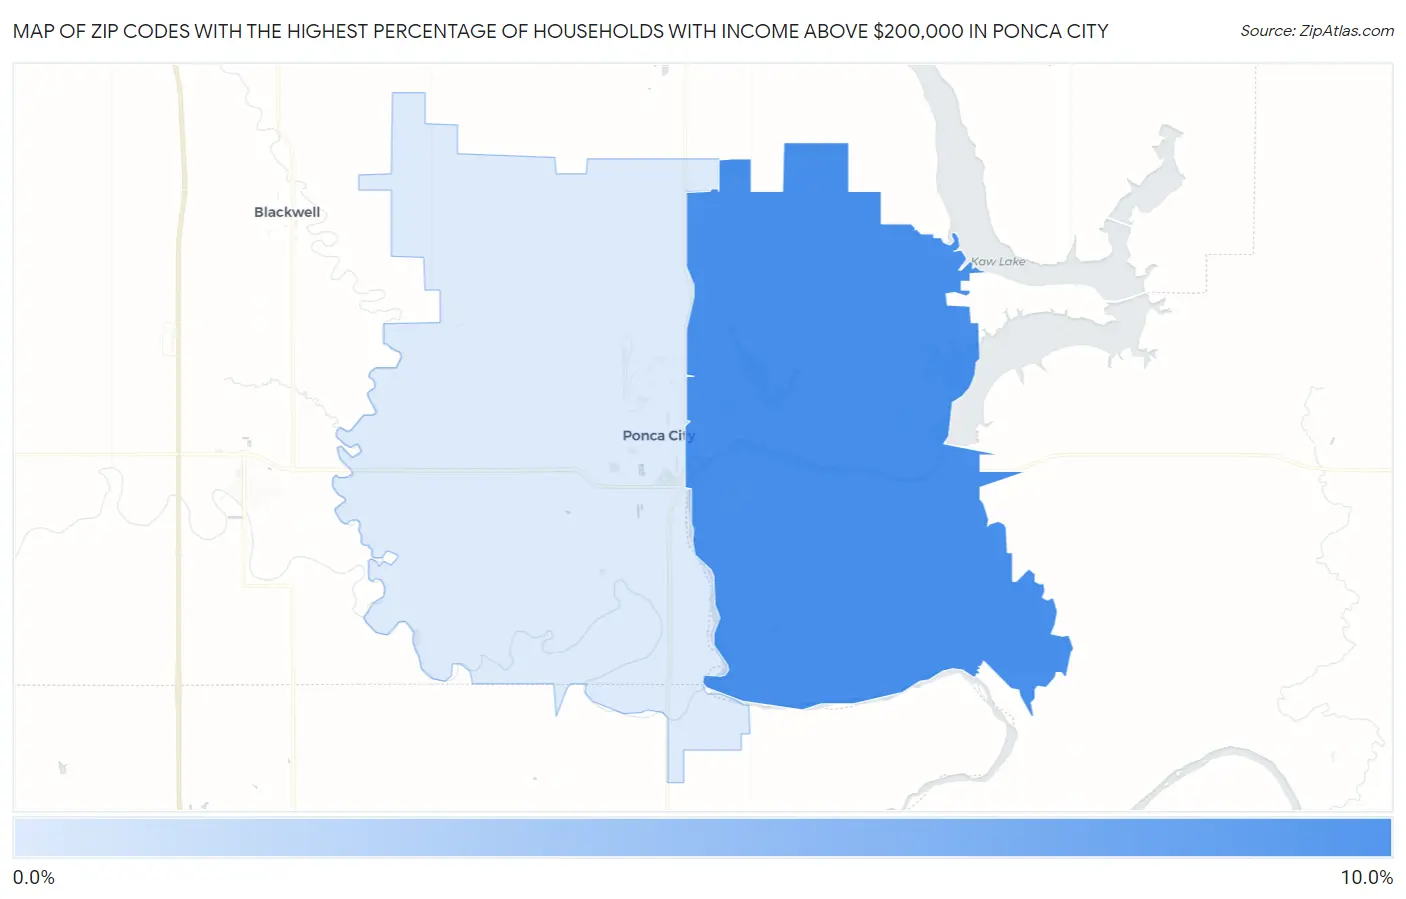
Map of Zip Codes with the Highest Percentage of Households with Income Above $200,000 in Ponca City
0.0%
10.0%
Zip Codes with the Highest Percentage of Households with Income Above $200,000 in Ponca City, OK
| Zip Code | Households with Income > $200k | vs State | vs National | |
| 1. | 74604 | 10.0% | 6.3%(+3.70)#62 | 11.4%(-1.40)#8,268 |
| 2. | 74601 | 1.9% | 6.3%(-4.40)#438 | 11.4%(-9.50)#24,062 |
1
Common Questions
What are the Top Zip Codes with the Highest Percentage of Households with Income Above $200,000 in Ponca City, OK?
Top Zip Codes with the Highest Percentage of Households with Income Above $200,000 in Ponca City, OK are:
What zip code has the Highest Percentage of Households with Income Above $200,000 in Ponca City, OK?
74604 has the Highest Percentage of Households with Income Above $200,000 in Ponca City, OK with 10.0%.
What is the Percentage of Households with Income Above $200,000 in Ponca City, OK?
Percentage of Households with Income Above $200,000 in Ponca City is 4.0%.
What is the Percentage of Households with Income Above $200,000 in Oklahoma?
Percentage of Households with Income Above $200,000 in Oklahoma is 6.3%.
What is the Percentage of Households with Income Above $200,000 in the United States?
Percentage of Households with Income Above $200,000 in the United States is 11.4%.