Zip Codes with the Highest Percentage of Households Heated by Bottled Gas / Liquid Propane in Ponca City, OK
RELATED REPORTS & OPTIONS
Bottled Gas / LP Heating
Ponca City
Compare Zip Codes
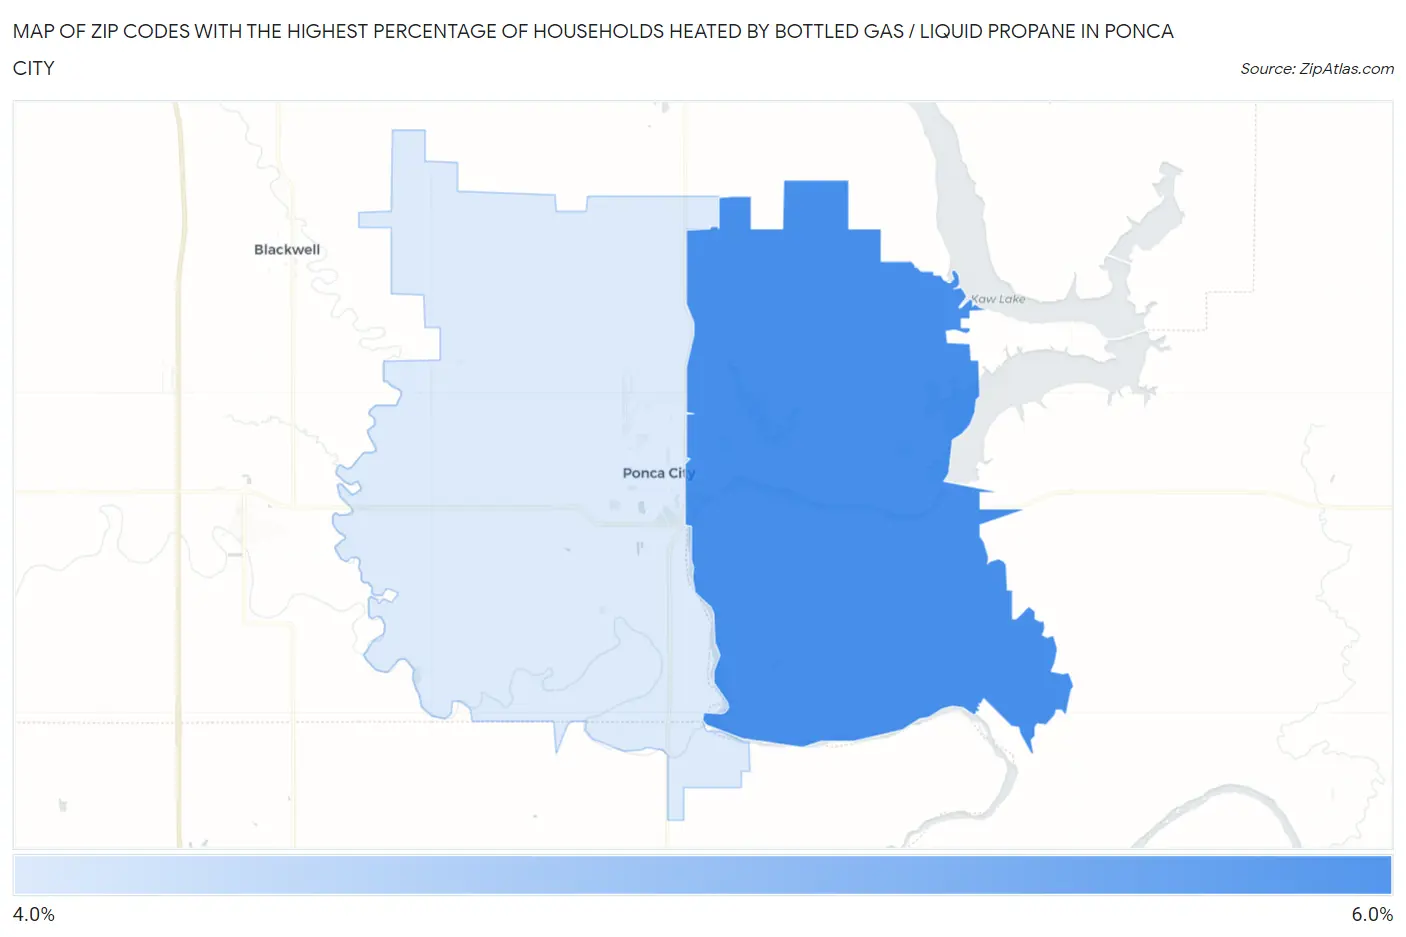
Map of Zip Codes with the Highest Percentage of Households Heated by Bottled Gas / Liquid Propane in Ponca City
0.0%
6.0%
Zip Codes with the Highest Percentage of Households Heated by Bottled Gas / Liquid Propane in Ponca City, OK
| Zip Code | Bottled Gas / LP Heating | vs State | vs National | |
| 1. | 74604 | 5.6% | 6.3%(-0.700)#465 | 4.9%(+0.700)#17,927 |
| 2. | 74601 | 4.2% | 6.3%(-2.10)#493 | 4.9%(-0.700)#19,423 |
1
Common Questions
What are the Top Zip Codes with the Highest Percentage of Households Heated by Bottled Gas / Liquid Propane in Ponca City, OK?
Top Zip Codes with the Highest Percentage of Households Heated by Bottled Gas / Liquid Propane in Ponca City, OK are:
What zip code has the Highest Percentage of Households Heated by Bottled Gas / Liquid Propane in Ponca City, OK?
74604 has the Highest Percentage of Households Heated by Bottled Gas / Liquid Propane in Ponca City, OK with 5.6%.
What is the Percentage of Households Heated by Bottled Gas / Liquid Propane in Ponca City, OK?
Percentage of Households Heated by Bottled Gas / Liquid Propane in Ponca City is 1.9%.
What is the Percentage of Households Heated by Bottled Gas / Liquid Propane in Oklahoma?
Percentage of Households Heated by Bottled Gas / Liquid Propane in Oklahoma is 6.3%.
What is the Percentage of Households Heated by Bottled Gas / Liquid Propane in the United States?
Percentage of Households Heated by Bottled Gas / Liquid Propane in the United States is 4.9%.