Zip Codes with the Highest Percentage of Self-Employed / Not Incorporated in Ponca City, OK
RELATED REPORTS & OPTIONS
Self-Employed / Not Incorporated
Ponca City
Compare Zip Codes
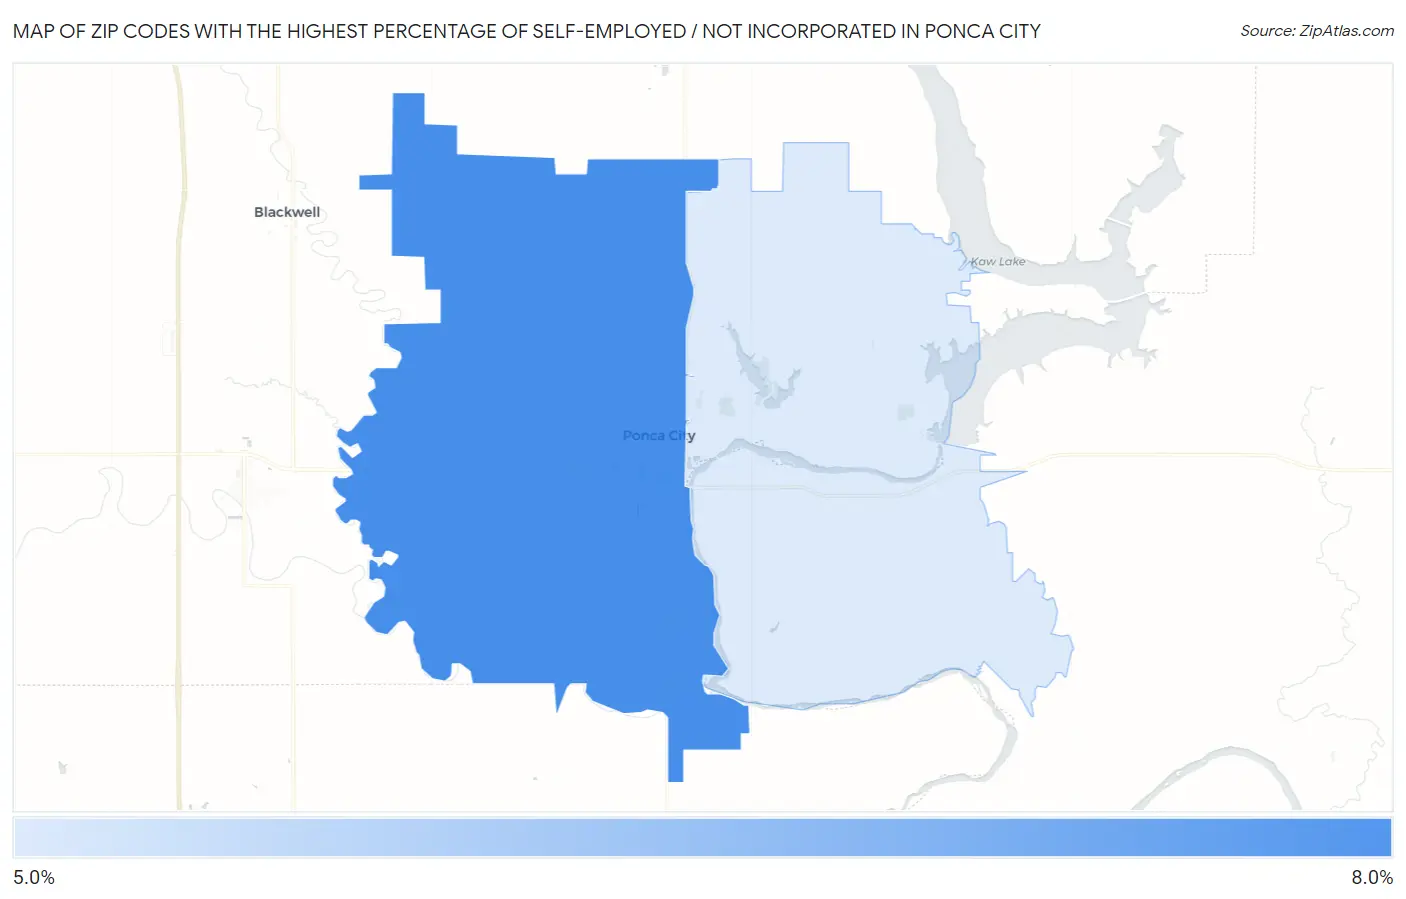
Map of Zip Codes with the Highest Percentage of Self-Employed / Not Incorporated in Ponca City
0.0%
8.0%
Zip Codes with the Highest Percentage of Self-Employed / Not Incorporated in Ponca City, OK
| Zip Code | % Self-Employed / Not Incorporated | vs State | vs National | |
| 1. | 74601 | 6.6% | 6.5%(+0.035)#388 | 5.8%(+0.746)#14,265 |
| 2. | 74604 | 5.8% | 6.5%(-0.754)#450 | 5.8%(-0.043)#16,790 |
1
Common Questions
What are the Top Zip Codes with the Highest Percentage of Self-Employed / Not Incorporated in Ponca City, OK?
Top Zip Codes with the Highest Percentage of Self-Employed / Not Incorporated in Ponca City, OK are:
What zip code has the Highest Percentage of Self-Employed / Not Incorporated in Ponca City, OK?
74601 has the Highest Percentage of Self-Employed / Not Incorporated in Ponca City, OK with 6.6%.
What is the Percentage of Self-Employed / Not Incorporated in Ponca City, OK?
Percentage of Self-Employed / Not Incorporated in Ponca City is 5.1%.
What is the Percentage of Self-Employed / Not Incorporated in Oklahoma?
Percentage of Self-Employed / Not Incorporated in Oklahoma is 6.5%.
What is the Percentage of Self-Employed / Not Incorporated in the United States?
Percentage of Self-Employed / Not Incorporated in the United States is 5.8%.