Zip Codes with the Highest Percentage of Population Employed in Architecture & Engineering in Oklahoma City, OK
RELATED REPORTS & OPTIONS
Architecture & Engineering
Oklahoma City
Compare Zip Codes
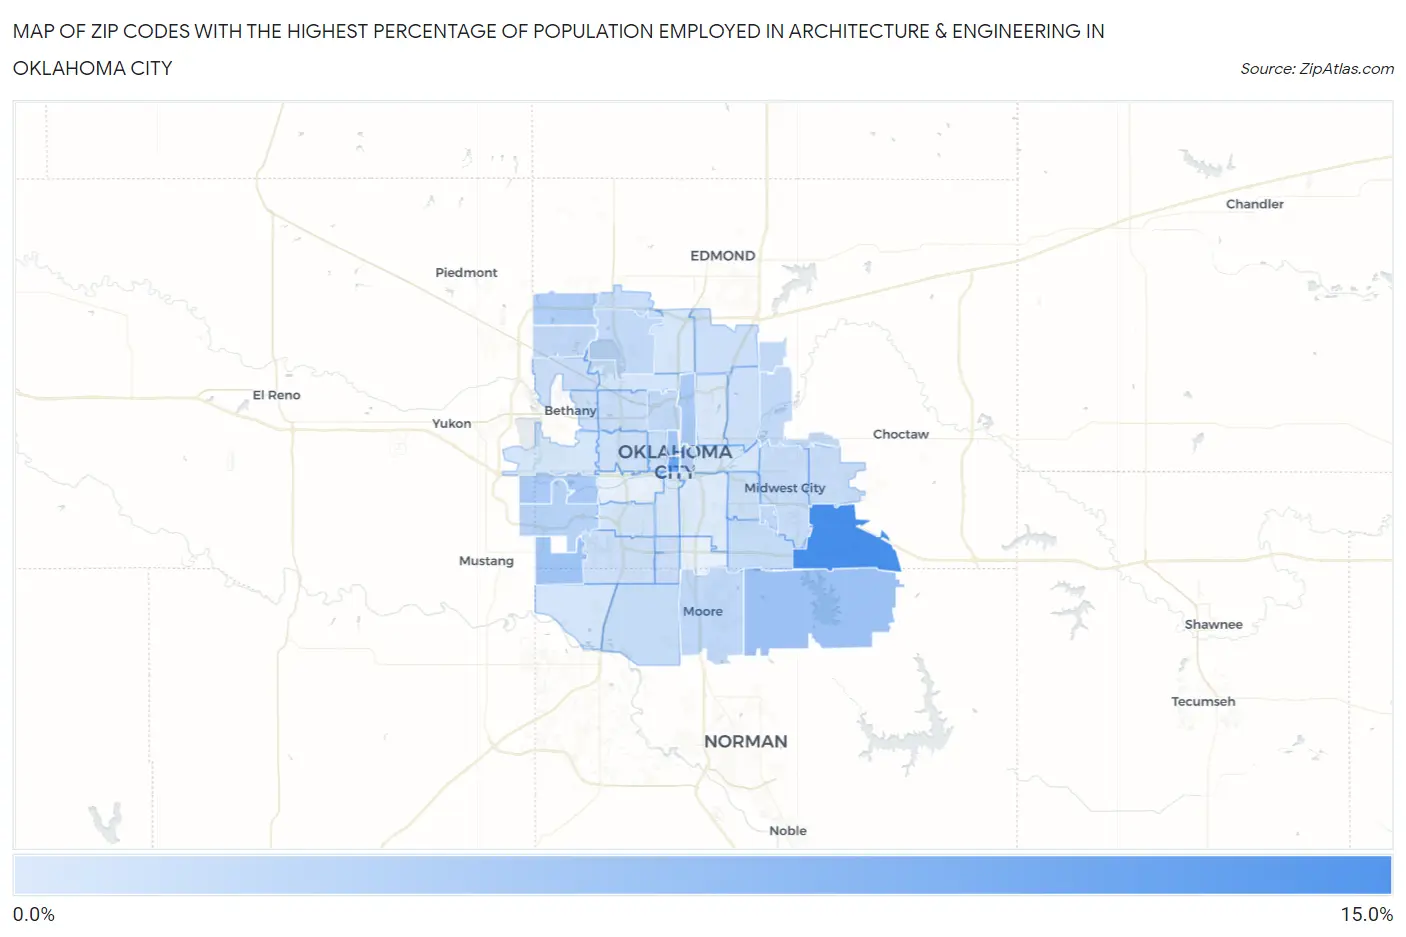
Map of Zip Codes with the Highest Percentage of Population Employed in Architecture & Engineering in Oklahoma City
0.0%
15.0%
Zip Codes with the Highest Percentage of Population Employed in Architecture & Engineering in Oklahoma City, OK
| Zip Code | % Employed | vs State | vs National | |
| 1. | 73150 | 14.5% | 1.8%(+12.7)#3 | 2.1%(+12.4)#156 |
| 2. | 73102 | 10.7% | 1.8%(+8.91)#8 | 2.1%(+8.60)#295 |
| 3. | 73165 | 6.0% | 1.8%(+4.21)#16 | 2.1%(+3.90)#1,060 |
| 4. | 73169 | 5.9% | 1.8%(+4.06)#17 | 2.1%(+3.75)#1,133 |
| 5. | 73103 | 5.4% | 1.8%(+3.60)#20 | 2.1%(+3.29)#1,368 |
| 6. | 73128 | 4.8% | 1.8%(+2.93)#27 | 2.1%(+2.62)#1,860 |
| 7. | 73105 | 4.6% | 1.8%(+2.79)#29 | 2.1%(+2.48)#1,997 |
| 8. | 73142 | 4.2% | 1.8%(+2.32)#33 | 2.1%(+2.00)#2,549 |
| 9. | 73104 | 3.7% | 1.8%(+1.82)#42 | 2.1%(+1.51)#3,378 |
| 10. | 73179 | 3.5% | 1.8%(+1.71)#46 | 2.1%(+1.40)#3,619 |
| 11. | 73160 | 2.7% | 1.8%(+0.869)#81 | 2.1%(+0.558)#6,125 |
| 12. | 73141 | 2.6% | 1.8%(+0.801)#87 | 2.1%(+0.490)#6,412 |
| 13. | 73151 | 2.6% | 1.8%(+0.773)#90 | 2.1%(+0.462)#6,528 |
| 14. | 73145 | 2.6% | 1.8%(+0.771)#91 | 2.1%(+0.459)#6,539 |
| 15. | 73120 | 2.5% | 1.8%(+0.681)#98 | 2.1%(+0.370)#6,914 |
| 16. | 73118 | 2.5% | 1.8%(+0.679)#99 | 2.1%(+0.368)#6,926 |
| 17. | 73162 | 2.5% | 1.8%(+0.667)#102 | 2.1%(+0.356)#6,973 |
| 18. | 73135 | 2.3% | 1.8%(+0.417)#120 | 2.1%(+0.106)#8,173 |
| 19. | 73170 | 2.2% | 1.8%(+0.373)#122 | 2.1%(+0.062)#8,430 |
| 20. | 73134 | 2.0% | 1.8%(+0.172)#141 | 2.1%(-0.139)#9,543 |
| 21. | 73110 | 1.9% | 1.8%(+0.081)#153 | 2.1%(-0.230)#10,115 |
| 22. | 73112 | 1.9% | 1.8%(+0.019)#159 | 2.1%(-0.292)#10,504 |
| 23. | 73130 | 1.8% | 1.8%(+0.011)#161 | 2.1%(-0.300)#10,547 |
| 24. | 73132 | 1.8% | 1.8%(-0.072)#168 | 2.1%(-0.383)#11,035 |
| 25. | 73139 | 1.7% | 1.8%(-0.139)#176 | 2.1%(-0.450)#11,490 |
| 26. | 73106 | 1.6% | 1.8%(-0.192)#180 | 2.1%(-0.503)#11,866 |
| 27. | 73115 | 1.6% | 1.8%(-0.217)#183 | 2.1%(-0.528)#12,043 |
| 28. | 73159 | 1.6% | 1.8%(-0.263)#188 | 2.1%(-0.574)#12,339 |
| 29. | 73121 | 1.5% | 1.8%(-0.317)#194 | 2.1%(-0.628)#12,722 |
| 30. | 73122 | 1.5% | 1.8%(-0.321)#195 | 2.1%(-0.632)#12,755 |
| 31. | 73131 | 1.5% | 1.8%(-0.350)#200 | 2.1%(-0.661)#12,978 |
| 32. | 73107 | 1.3% | 1.8%(-0.498)#218 | 2.1%(-0.809)#14,029 |
| 33. | 73173 | 0.93% | 1.8%(-0.904)#279 | 2.1%(-1.21)#17,087 |
| 34. | 73116 | 0.93% | 1.8%(-0.909)#280 | 2.1%(-1.22)#17,143 |
| 35. | 73119 | 0.80% | 1.8%(-1.04)#308 | 2.1%(-1.35)#18,166 |
| 36. | 73127 | 0.76% | 1.8%(-1.08)#314 | 2.1%(-1.39)#18,478 |
| 37. | 73117 | 0.75% | 1.8%(-1.09)#317 | 2.1%(-1.40)#18,571 |
| 38. | 73114 | 0.66% | 1.8%(-1.18)#334 | 2.1%(-1.49)#19,179 |
| 39. | 73109 | 0.51% | 1.8%(-1.33)#363 | 2.1%(-1.64)#20,233 |
| 40. | 73111 | 0.47% | 1.8%(-1.37)#373 | 2.1%(-1.68)#20,487 |
| 41. | 73129 | 0.058% | 1.8%(-1.78)#420 | 2.1%(-2.09)#22,449 |
1
Common Questions
What are the Top 10 Zip Codes with the Highest Percentage of Population Employed in Architecture & Engineering in Oklahoma City, OK?
Top 10 Zip Codes with the Highest Percentage of Population Employed in Architecture & Engineering in Oklahoma City, OK are:
What zip code has the Highest Percentage of Population Employed in Architecture & Engineering in Oklahoma City, OK?
73150 has the Highest Percentage of Population Employed in Architecture & Engineering in Oklahoma City, OK with 14.5%.
What is the Percentage of Population Employed in Architecture & Engineering in Oklahoma City, OK?
Percentage of Population Employed in Architecture & Engineering in Oklahoma City is 2.3%.
What is the Percentage of Population Employed in Architecture & Engineering in Oklahoma?
Percentage of Population Employed in Architecture & Engineering in Oklahoma is 1.8%.
What is the Percentage of Population Employed in Architecture & Engineering in the United States?
Percentage of Population Employed in Architecture & Engineering in the United States is 2.1%.