Zip Codes with the Highest Percentage of Population Employed in Architecture & Engineering in Muskogee, OK
RELATED REPORTS & OPTIONS
Architecture & Engineering
Muskogee
Compare Zip Codes
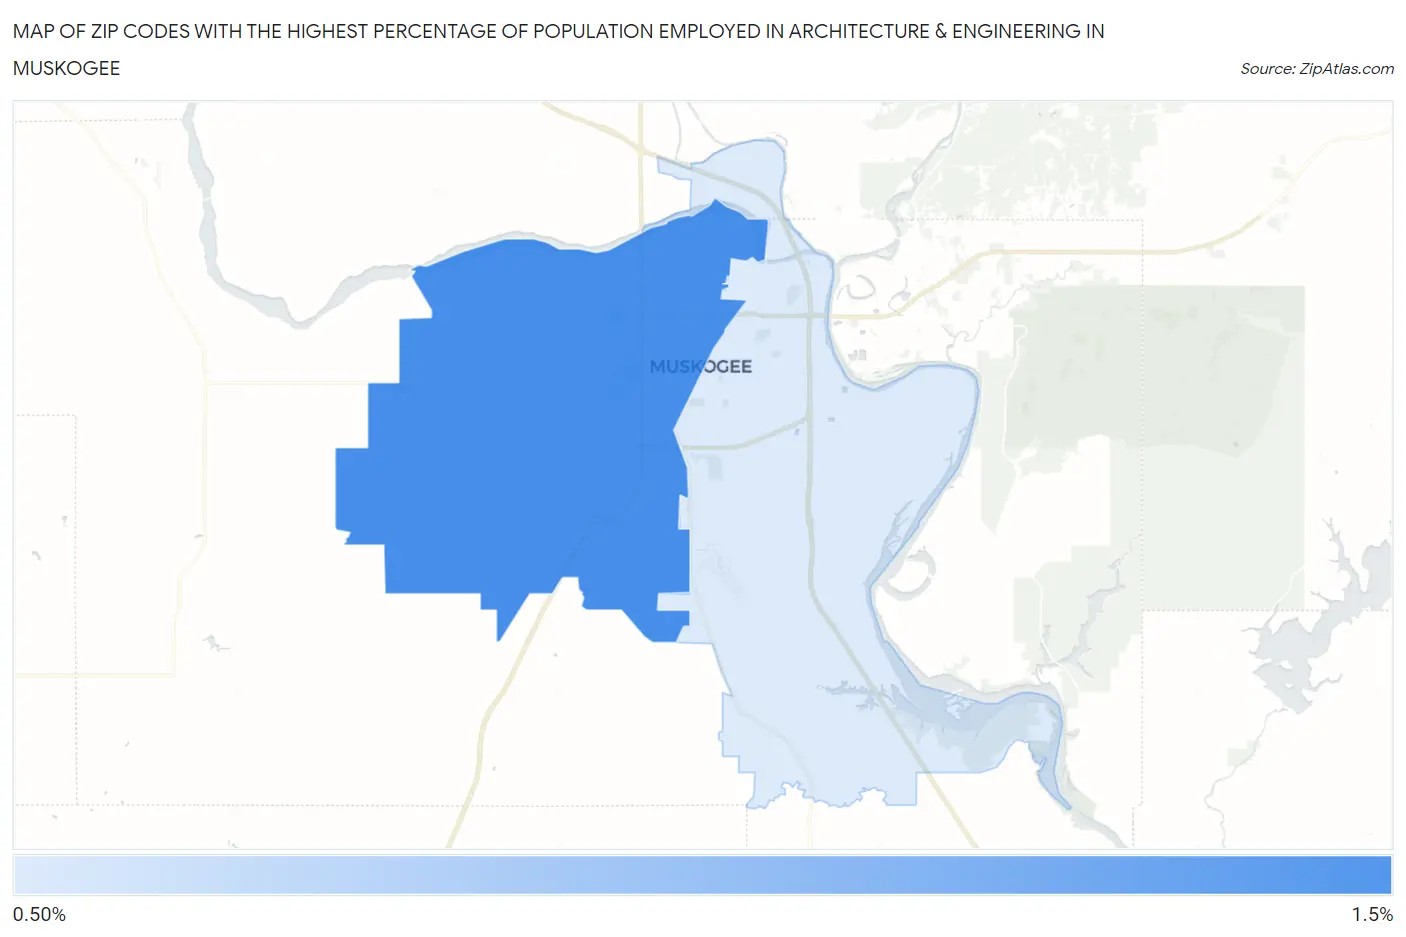
Map of Zip Codes with the Highest Percentage of Population Employed in Architecture & Engineering in Muskogee
0.0%
1.5%
Zip Codes with the Highest Percentage of Population Employed in Architecture & Engineering in Muskogee, OK
| Zip Code | % Employed | vs State | vs National | |
| 1. | 74401 | 1.1% | 1.8%(-0.726)#247 | 2.1%(-1.04)#15,752 |
| 2. | 74403 | 1.1% | 1.8%(-0.784)#262 | 2.1%(-1.10)#16,224 |
1
Common Questions
What are the Top Zip Codes with the Highest Percentage of Population Employed in Architecture & Engineering in Muskogee, OK?
Top Zip Codes with the Highest Percentage of Population Employed in Architecture & Engineering in Muskogee, OK are:
What zip code has the Highest Percentage of Population Employed in Architecture & Engineering in Muskogee, OK?
74401 has the Highest Percentage of Population Employed in Architecture & Engineering in Muskogee, OK with 1.1%.
What is the Percentage of Population Employed in Architecture & Engineering in Muskogee, OK?
Percentage of Population Employed in Architecture & Engineering in Muskogee is 1.1%.
What is the Percentage of Population Employed in Architecture & Engineering in Oklahoma?
Percentage of Population Employed in Architecture & Engineering in Oklahoma is 1.8%.
What is the Percentage of Population Employed in Architecture & Engineering in the United States?
Percentage of Population Employed in Architecture & Engineering in the United States is 2.1%.