Zip Codes with the Highest Poverty Level Among Single Fathers in Oklahoma City, OK

RELATED REPORTS & OPTIONS

Highest Poverty | Single Father
Population
Families and Households
Female Fertility
Female Fertility (Unmarried)
Race (Community Size)
Race (Percentage)
Ancestry (Community Size)
AfricanAlaska NativeAlbanianAmericanApacheArabArapahoArgentineanArmenianAustralianAustrianBahamianBangladeshiBarbadianBasqueBelgianBhutaneseBlackfeetBolivianBrazilianBritishBritish West IndianBulgarianBurmeseCajunCambodianCanadianCelticCentral AmericanCentral American IndianCherokeeCheyenneChickasawChileanChippewaChoctawColombianComancheCreeCreekCroatianCubanCzechCzechoslovakianDanishDelawareDominicanDutchDutch West IndianEastern EuropeanEcuadorianEgyptianEnglishEstonianEthiopianEuropeanFijianFilipinoFinnishFrenchFrench American IndianFrench CanadianGermanGerman RussianGhanaianGreekGuamanian / ChamorroGuatemalanGuyaneseHaitianHonduranHopiHungarianIcelanderIndian (Asian)IndonesianInupiatIranianIraqiIrishIroquoisIsraeliItalianJamaicanJapaneseJordanianKenyanKiowaKoreanLaotianLatvianLebaneseLiberianLithuanianLuxembourgerMalaysianMexicanMexican American IndianMongolianMoroccanNative HawaiianNavajoNew ZealanderNicaraguanNigerianNorthern EuropeanNorwegianOkinawanOsagePakistaniPalestinianPanamanianPennsylvania GermanPeruvianPimaPolishPortuguesePotawatomiPuebloPuerto RicanRomanianRussianSalvadoranSamoanScandinavianScotch-IrishScottishSeminoleSerbianSiouxSlavicSlovakSloveneSouth AfricanSouth AmericanSouth American IndianSpaniardSpanishSpanish American IndianSri LankanSubsaharan AfricanSudaneseSwedishSwissSyrianThaiTlingit-HaidaTonganTrinidadian and TobagonianTurkishU.S. Virgin IslanderUkrainianUruguayanVenezuelanVietnameseWelshWest IndianYugoslavianZimbabwean
Ancestry (Percentage)
AfricanAlaska NativeAlbanianAmericanApacheArabArapahoArgentineanArmenianAustralianAustrianBahamianBangladeshiBarbadianBasqueBelgianBhutaneseBlackfeetBolivianBrazilianBritishBritish West IndianBulgarianBurmeseCajunCambodianCanadianCelticCentral AmericanCentral American IndianCherokeeCheyenneChickasawChileanChippewaChoctawColombianComancheCreeCreekCroatianCubanCzechCzechoslovakianDanishDelawareDominicanDutchDutch West IndianEastern EuropeanEcuadorianEgyptianEnglishEstonianEthiopianEuropeanFijianFilipinoFinnishFrenchFrench American IndianFrench CanadianGermanGerman RussianGhanaianGreekGuamanian / ChamorroGuatemalanGuyaneseHaitianHonduranHopiHungarianIcelanderIndian (Asian)IndonesianInupiatIranianIraqiIrishIroquoisIsraeliItalianJamaicanJapaneseJordanianKenyanKiowaKoreanLaotianLatvianLebaneseLiberianLithuanianLuxembourgerMalaysianMexicanMexican American IndianMongolianMoroccanNative HawaiianNavajoNew ZealanderNicaraguanNigerianNorthern EuropeanNorwegianOkinawanOsagePakistaniPalestinianPanamanianPennsylvania GermanPeruvianPimaPolishPortuguesePotawatomiPuebloPuerto RicanRomanianRussianSalvadoranSamoanScandinavianScotch-IrishScottishSeminoleSerbianSiouxSlavicSlovakSloveneSouth AfricanSouth AmericanSouth American IndianSpaniardSpanishSpanish American IndianSri LankanSubsaharan AfricanSudaneseSwedishSwissSyrianThaiTlingit-HaidaTonganTrinidadian and TobagonianTurkishU.S. Virgin IslanderUkrainianUruguayanVenezuelanVietnameseWelshWest IndianYugoslavianZimbabwean
Immigrant Origin (Total)
AfricaArgentinaAsiaAustraliaAustriaBahamasBangladeshBosnia and HerzegovinaBrazilBulgariaBurma / MyanmarCambodiaCameroonCanadaCaribbeanCentral AmericaChileChinaColombiaCubaDominican RepublicEastern AfricaEastern AsiaEastern EuropeEcuadorEgyptEl SalvadorEnglandEritreaEthiopiaEuropeFranceGermanyGhanaGreeceGuatemalaHondurasHong KongIndiaIndonesiaIranIraqIrelandItalyJamaicaJapanJordanKazakhstanKenyaKoreaKuwaitLaosLatin AmericaLebanonLiberiaMalaysiaMexicoMiddle AfricaMoroccoNepalNetherlandsNicaraguaNigeriaNorthern AfricaNorthern EuropeNorwayOceaniaPakistanPanamaPeruPhilippinesPolandPortugalRussiaSaudi ArabiaScotlandSingaporeSouth AfricaSouth AmericaSouth Central AsiaSouth Eastern AsiaSouthern EuropeSpainSudanSyriaTaiwanThailandTrinidad and TobagoTurkeyUkraineVenezuelaVietnamWestern AfricaWestern AsiaWestern EuropeZaireZimbabwe
Immigrant Origin (Percentage)
AfricaArgentinaAsiaAustraliaAustriaBahamasBangladeshBosnia and HerzegovinaBrazilBulgariaBurma / MyanmarCambodiaCameroonCanadaCaribbeanCentral AmericaChileChinaColombiaCubaDominican RepublicEastern AfricaEastern AsiaEastern EuropeEcuadorEgyptEl SalvadorEnglandEritreaEthiopiaEuropeFranceGermanyGhanaGreeceGuatemalaHondurasHong KongIndiaIndonesiaIranIraqIrelandItalyJamaicaJapanJordanKazakhstanKenyaKoreaKuwaitLaosLatin AmericaLebanonLiberiaMalaysiaMexicoMiddle AfricaMoroccoNepalNetherlandsNicaraguaNigeriaNorthern AfricaNorthern EuropeNorwayOceaniaPakistanPanamaPeruPhilippinesPolandPortugalRussiaSaudi ArabiaScotlandSingaporeSouth AfricaSouth AmericaSouth Central AsiaSouth Eastern AsiaSouthern EuropeSpainSudanSyriaTaiwanThailandTrinidad and TobagoTurkeyUkraineVenezuelaVietnamWestern AfricaWestern AsiaWestern EuropeZaireZimbabwe
Income
Income (Families)
Income (Households)
Poverty
Poverty (Families)
Unemployment
Employment Occupations
Employment Industries
Employer Class
Commute Time
Commute Means
School Enrollment
Education by Degree Field
Occupancy
Finances
Physical Characteristics
Oklahoma City
Compare Zip Codes
Comparison Subject

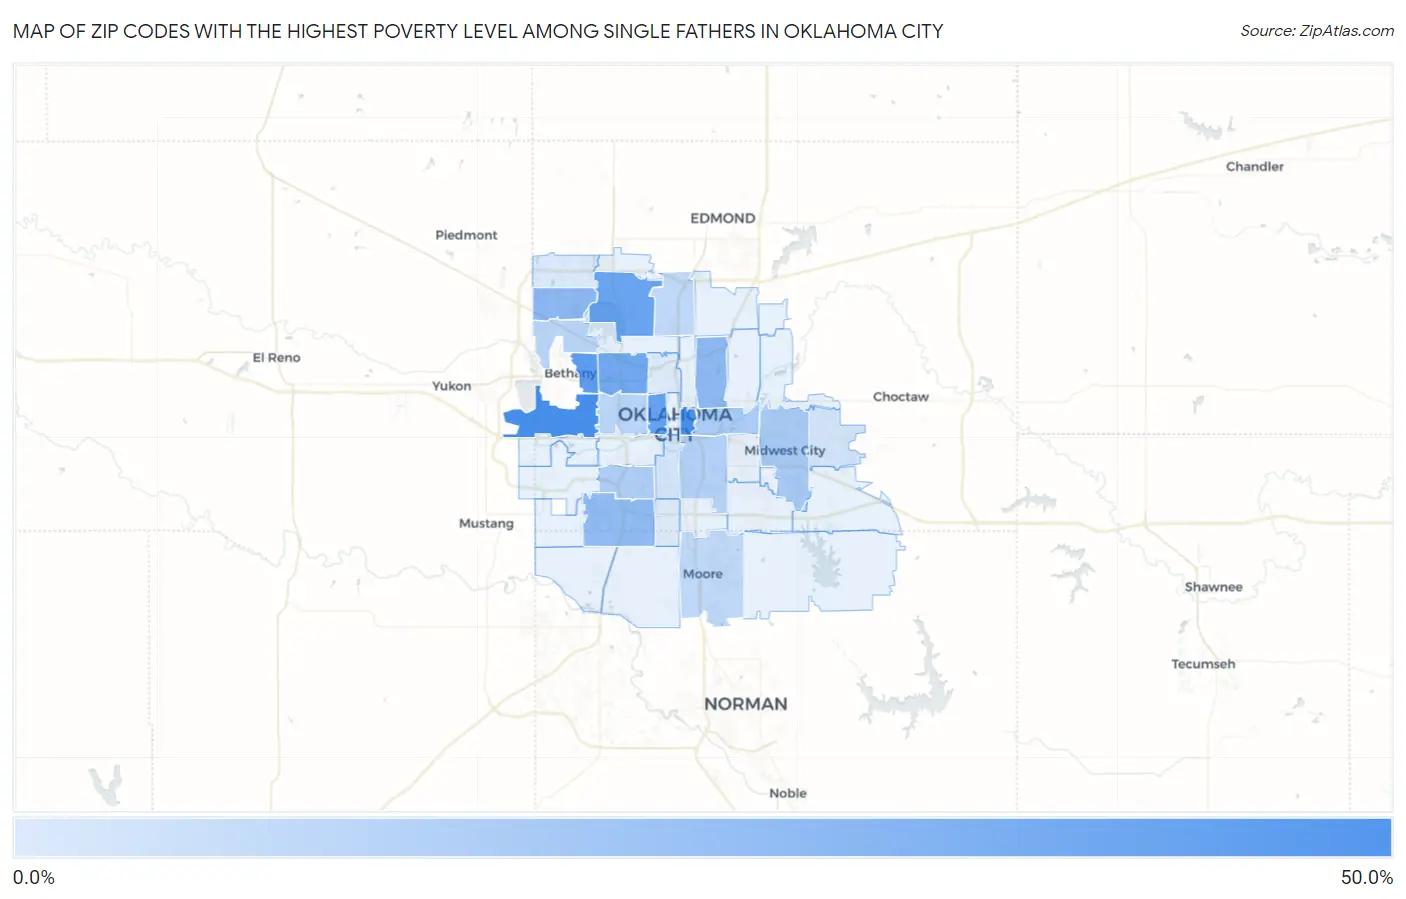
Map of Zip Codes with the Highest Poverty Level Among Single Fathers in Oklahoma City

0.0%
50.0%
Zip Codes with the Highest Poverty Level Among Single Fathers in Oklahoma City Map

Zip Codes with the Highest Poverty Level Among Single Fathers in Oklahoma City, OK

Zip Code Single Father Poverty vs State vs National
1.7312748.7%17.2%(+31.5)#6513.7%(+35.0)#2,489
2.7310448.2%17.2%(+31.0)#6613.7%(+34.5)#2,504
3.7312240.7%17.2%(+23.5)#8713.7%(+27.0)#3,049
4.7310638.7%17.2%(+21.5)#9513.7%(+25.0)#3,273
5.7312037.4%17.2%(+20.3)#10013.7%(+23.7)#3,406
6.7311235.1%17.2%(+18.0)#10913.7%(+21.4)#3,647
7.7316226.5%17.2%(+9.32)#14413.7%(+12.8)#4,902
8.7311126.1%17.2%(+8.95)#14713.7%(+12.4)#4,964
9.7315925.0%17.2%(+7.87)#15113.7%(+11.3)#5,141
10.7311018.2%17.2%(+1.06)#19813.7%(+4.51)#6,678
11.7311717.9%17.2%(+0.746)#20213.7%(+4.20)#6,766
12.7311916.4%17.2%(-0.729)#21313.7%(+2.72)#7,155
13.7312915.5%17.2%(-1.66)#22213.7%(+1.79)#7,415
14.7310713.4%17.2%(-3.76)#23713.7%(-0.303)#8,006
15.7313213.4%17.2%(-3.80)#23813.7%(-0.343)#8,019
16.7316012.2%17.2%(-4.92)#24613.7%(-1.47)#8,370
17.7311412.2%17.2%(-4.94)#24713.7%(-1.49)#8,374
18.731097.2%17.2%(-9.95)#28213.7%(-6.50)#10,201
19.731306.9%17.2%(-10.2)#28613.7%(-6.77)#10,314
20.731425.5%17.2%(-11.7)#29813.7%(-8.24)#10,867
21.731184.7%17.2%(-12.4)#30213.7%(-9.00)#11,110
22.731394.6%17.2%(-12.5)#30313.7%(-9.08)#11,136

Common Questions

What are the Top 10 Zip Codes with the Highest Poverty Level Among Single Fathers in Oklahoma City, OK?
Top 10 Zip Codes with the Highest Poverty Level Among Single Fathers in Oklahoma City, OK are:
#1
48.7%
#2
48.2%
#3
40.7%
#4
38.7%
#5
37.4%
#6
35.1%
#7
26.5%
#8
26.1%
#9
25.0%
#10
18.2%
What zip code has the Highest Poverty Level Among Single Fathers in Oklahoma City, OK?
73127 has the Highest Poverty Level Among Single Fathers in Oklahoma City, OK with 48.7%.
What is the Poverty Level Among Single Fathers in Oklahoma City, OK?
Poverty Level Among Single Fathers in Oklahoma City is 16.6%.
What is the Poverty Level Among Single Fathers in Oklahoma?
Poverty Level Among Single Fathers in Oklahoma is 17.2%.
What is the Poverty Level Among Single Fathers in the United States?
Poverty Level Among Single Fathers in the United States is 13.7%.