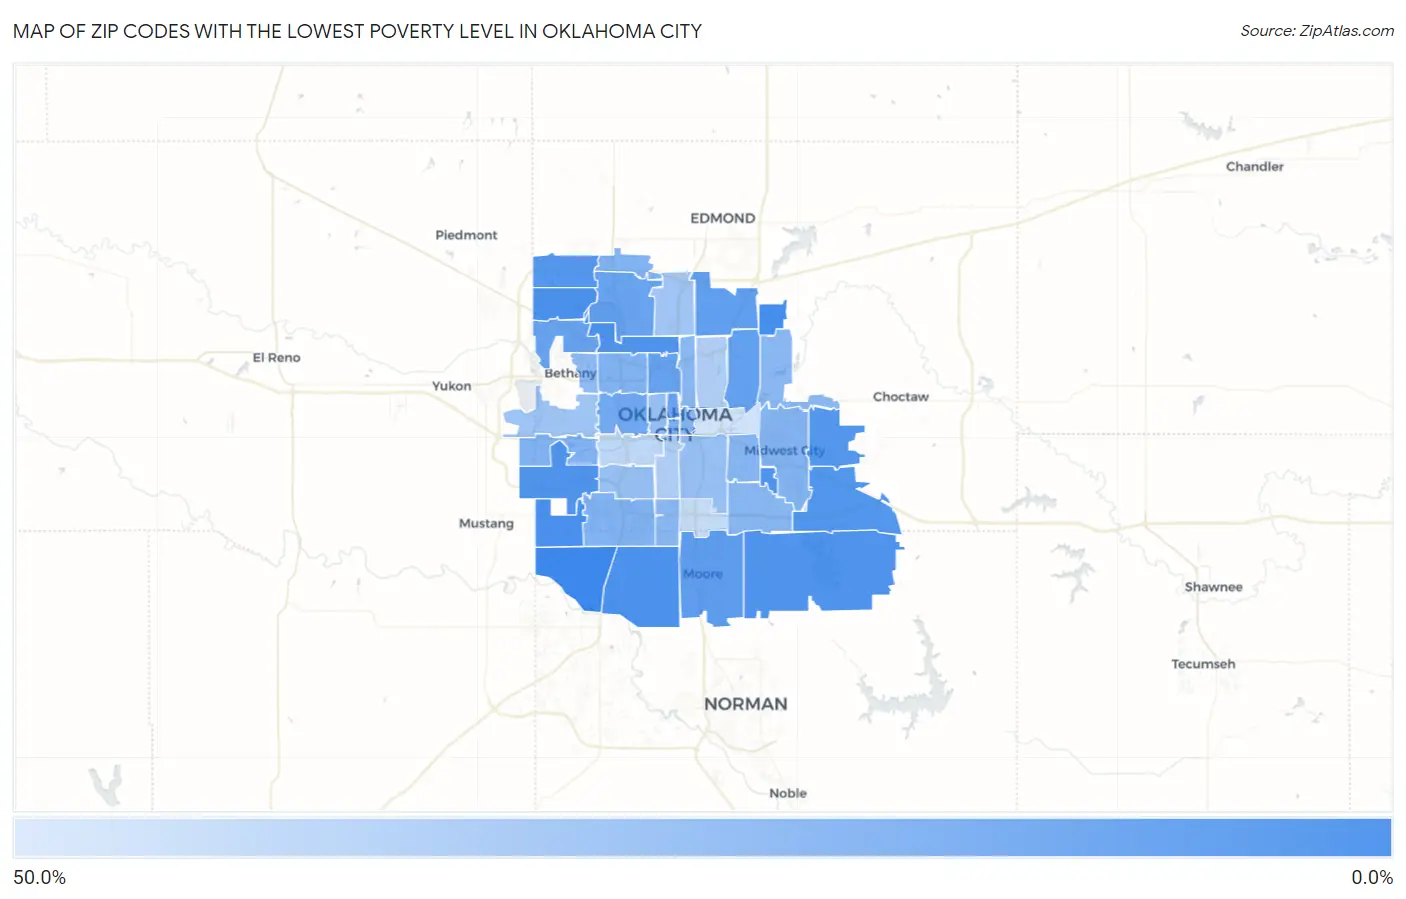
Zip Codes with the Lowest Poverty Level in Oklahoma City, OK
RELATED REPORTS & OPTIONS
Lowest Poverty
Oklahoma City
Compare Zip Codes
Map of Zip Codes with the Lowest Poverty Level in Oklahoma City
50.0%
0.0%
Zip Codes with the Lowest Poverty Level in Oklahoma City, OK
| Zip Code | Poverty | vs State | vs National | |
| 1. | 73173 | 2.6% | 15.2%(-12.6)#14 | 12.5%(-9.92)#1,375 |
| 2. | 73151 | 4.8% | 15.2%(-10.4)#36 | 12.5%(-7.71)#4,520 |
| 3. | 73169 | 5.6% | 15.2%(-9.63)#42 | 12.5%(-6.93)#5,831 |
| 4. | 73170 | 6.2% | 15.2%(-9.06)#51 | 12.5%(-6.37)#6,842 |
| 5. | 73162 | 6.3% | 15.2%(-8.92)#52 | 12.5%(-6.23)#7,072 |
| 6. | 73179 | 6.7% | 15.2%(-8.53)#60 | 12.5%(-5.84)#7,803 |
| 7. | 73145 | 6.8% | 15.2%(-8.40)#63 | 12.5%(-5.71)#8,030 |
| 8. | 73116 | 6.9% | 15.2%(-8.33)#68 | 12.5%(-5.63)#8,174 |
| 9. | 73165 | 7.4% | 15.2%(-7.79)#81 | 12.5%(-5.09)#9,179 |
| 10. | 73150 | 7.8% | 15.2%(-7.47)#93 | 12.5%(-4.78)#9,764 |
| 11. | 73130 | 8.0% | 15.2%(-7.20)#99 | 12.5%(-4.50)#10,270 |
| 12. | 73142 | 8.2% | 15.2%(-7.06)#102 | 12.5%(-4.37)#10,507 |
| 13. | 73160 | 10.2% | 15.2%(-4.99)#148 | 12.5%(-2.30)#14,137 |
| 14. | 73131 | 10.8% | 15.2%(-4.46)#167 | 12.5%(-1.77)#15,001 |
| 15. | 73121 | 11.8% | 15.2%(-3.47)#191 | 12.5%(-0.780)#16,549 |
| 16. | 73118 | 12.3% | 15.2%(-2.92)#204 | 12.5%(-0.229)#17,349 |
| 17. | 73132 | 12.4% | 15.2%(-2.87)#207 | 12.5%(-0.175)#17,427 |
| 18. | 73103 | 12.4% | 15.2%(-2.83)#208 | 12.5%(-0.136)#17,486 |
| 19. | 73120 | 12.4% | 15.2%(-2.80)#210 | 12.5%(-0.102)#17,531 |
| 20. | 73107 | 14.6% | 15.2%(-0.604)#285 | 12.5%(+2.09)#20,302 |
| 21. | 73102 | 17.7% | 15.2%(+2.47)#396 | 12.5%(+5.17)#23,387 |
| 22. | 73134 | 18.8% | 15.2%(+3.62)#425 | 12.5%(+6.31)#24,278 |
| 23. | 73112 | 18.9% | 15.2%(+3.62)#426 | 12.5%(+6.32)#24,280 |
| 24. | 73159 | 18.9% | 15.2%(+3.69)#430 | 12.5%(+6.39)#24,338 |
| 25. | 73128 | 19.1% | 15.2%(+3.88)#436 | 12.5%(+6.58)#24,491 |
| 26. | 73110 | 19.7% | 15.2%(+4.46)#445 | 12.5%(+7.15)#24,892 |
| 27. | 73104 | 20.5% | 15.2%(+5.23)#465 | 12.5%(+7.92)#25,398 |
| 28. | 73115 | 20.8% | 15.2%(+5.58)#474 | 12.5%(+8.27)#25,616 |
| 29. | 73135 | 20.8% | 15.2%(+5.58)#475 | 12.5%(+8.27)#25,618 |
| 30. | 73141 | 20.9% | 15.2%(+5.70)#477 | 12.5%(+8.39)#25,680 |
| 31. | 73105 | 21.2% | 15.2%(+5.95)#486 | 12.5%(+8.64)#25,827 |
| 32. | 73139 | 21.2% | 15.2%(+6.00)#488 | 12.5%(+8.69)#25,855 |
| 33. | 73122 | 22.2% | 15.2%(+7.00)#519 | 12.5%(+9.70)#26,418 |
| 34. | 73119 | 24.7% | 15.2%(+9.49)#548 | 12.5%(+12.2)#27,426 |
| 35. | 73129 | 24.7% | 15.2%(+9.50)#549 | 12.5%(+12.2)#27,431 |
| 36. | 73106 | 24.9% | 15.2%(+9.68)#551 | 12.5%(+12.4)#27,498 |
| 37. | 73127 | 26.4% | 15.2%(+11.2)#568 | 12.5%(+13.9)#27,969 |
| 38. | 73114 | 27.4% | 15.2%(+12.1)#583 | 12.5%(+14.8)#28,237 |
| 39. | 73109 | 30.9% | 15.2%(+15.6)#604 | 12.5%(+18.3)#28,976 |
| 40. | 73111 | 31.3% | 15.2%(+16.1)#607 | 12.5%(+18.8)#29,047 |
| 41. | 73108 | 36.5% | 15.2%(+21.3)#624 | 12.5%(+24.0)#29,829 |
| 42. | 73149 | 37.9% | 15.2%(+22.7)#626 | 12.5%(+25.4)#29,957 |
| 43. | 73117 | 41.1% | 15.2%(+25.8)#630 | 12.5%(+28.5)#30,175 |
1
Common Questions
What are the Top 10 Zip Codes with the Lowest Poverty Level in Oklahoma City, OK?
Top 10 Zip Codes with the Lowest Poverty Level in Oklahoma City, OK are:
What zip code has the Lowest Poverty Level in Oklahoma City, OK?
73173 has the Lowest Poverty Level in Oklahoma City, OK with 2.6%.
What is the Poverty Level in Oklahoma City, OK?
Poverty Level in Oklahoma City is 15.0%.
What is the Poverty Level in Oklahoma?
Poverty Level in Oklahoma is 15.2%.
What is the Poverty Level in the United States?
Poverty Level in the United States is 12.5%.