Zip Codes with the Highest Percentage of Population with a Degree in Computers and Mathematics in Oklahoma City, OK

RELATED REPORTS & OPTIONS

Computers and Mathematics
Population
Families and Households
Female Fertility
Female Fertility (Unmarried)
Race (Community Size)
Race (Percentage)
Ancestry (Community Size)
AfricanAlaska NativeAlbanianAmericanApacheArabArapahoArgentineanArmenianAustralianAustrianBahamianBangladeshiBarbadianBasqueBelgianBhutaneseBlackfeetBolivianBrazilianBritishBritish West IndianBulgarianBurmeseCajunCambodianCanadianCelticCentral AmericanCentral American IndianCherokeeCheyenneChickasawChileanChippewaChoctawColombianComancheCreeCreekCroatianCubanCzechCzechoslovakianDanishDelawareDominicanDutchDutch West IndianEastern EuropeanEcuadorianEgyptianEnglishEstonianEthiopianEuropeanFijianFilipinoFinnishFrenchFrench American IndianFrench CanadianGermanGerman RussianGhanaianGreekGuamanian / ChamorroGuatemalanGuyaneseHaitianHonduranHopiHungarianIcelanderIndian (Asian)IndonesianInupiatIranianIraqiIrishIroquoisIsraeliItalianJamaicanJapaneseJordanianKenyanKiowaKoreanLaotianLatvianLebaneseLiberianLithuanianLuxembourgerMalaysianMexicanMexican American IndianMongolianMoroccanNative HawaiianNavajoNew ZealanderNicaraguanNigerianNorthern EuropeanNorwegianOkinawanOsagePakistaniPalestinianPanamanianPennsylvania GermanPeruvianPimaPolishPortuguesePotawatomiPuebloPuerto RicanRomanianRussianSalvadoranSamoanScandinavianScotch-IrishScottishSeminoleSerbianSiouxSlavicSlovakSloveneSouth AfricanSouth AmericanSouth American IndianSpaniardSpanishSpanish American IndianSri LankanSubsaharan AfricanSudaneseSwedishSwissSyrianThaiTlingit-HaidaTonganTrinidadian and TobagonianTurkishU.S. Virgin IslanderUkrainianUruguayanVenezuelanVietnameseWelshWest IndianYugoslavianZimbabwean
Ancestry (Percentage)
AfricanAlaska NativeAlbanianAmericanApacheArabArapahoArgentineanArmenianAustralianAustrianBahamianBangladeshiBarbadianBasqueBelgianBhutaneseBlackfeetBolivianBrazilianBritishBritish West IndianBulgarianBurmeseCajunCambodianCanadianCelticCentral AmericanCentral American IndianCherokeeCheyenneChickasawChileanChippewaChoctawColombianComancheCreeCreekCroatianCubanCzechCzechoslovakianDanishDelawareDominicanDutchDutch West IndianEastern EuropeanEcuadorianEgyptianEnglishEstonianEthiopianEuropeanFijianFilipinoFinnishFrenchFrench American IndianFrench CanadianGermanGerman RussianGhanaianGreekGuamanian / ChamorroGuatemalanGuyaneseHaitianHonduranHopiHungarianIcelanderIndian (Asian)IndonesianInupiatIranianIraqiIrishIroquoisIsraeliItalianJamaicanJapaneseJordanianKenyanKiowaKoreanLaotianLatvianLebaneseLiberianLithuanianLuxembourgerMalaysianMexicanMexican American IndianMongolianMoroccanNative HawaiianNavajoNew ZealanderNicaraguanNigerianNorthern EuropeanNorwegianOkinawanOsagePakistaniPalestinianPanamanianPennsylvania GermanPeruvianPimaPolishPortuguesePotawatomiPuebloPuerto RicanRomanianRussianSalvadoranSamoanScandinavianScotch-IrishScottishSeminoleSerbianSiouxSlavicSlovakSloveneSouth AfricanSouth AmericanSouth American IndianSpaniardSpanishSpanish American IndianSri LankanSubsaharan AfricanSudaneseSwedishSwissSyrianThaiTlingit-HaidaTonganTrinidadian and TobagonianTurkishU.S. Virgin IslanderUkrainianUruguayanVenezuelanVietnameseWelshWest IndianYugoslavianZimbabwean
Immigrant Origin (Total)
AfricaArgentinaAsiaAustraliaAustriaBahamasBangladeshBosnia and HerzegovinaBrazilBulgariaBurma / MyanmarCambodiaCameroonCanadaCaribbeanCentral AmericaChileChinaColombiaCubaDominican RepublicEastern AfricaEastern AsiaEastern EuropeEcuadorEgyptEl SalvadorEnglandEritreaEthiopiaEuropeFranceGermanyGhanaGreeceGuatemalaHondurasHong KongIndiaIndonesiaIranIraqIrelandItalyJamaicaJapanJordanKazakhstanKenyaKoreaKuwaitLaosLatin AmericaLebanonLiberiaMalaysiaMexicoMiddle AfricaMoroccoNepalNetherlandsNicaraguaNigeriaNorthern AfricaNorthern EuropeNorwayOceaniaPakistanPanamaPeruPhilippinesPolandPortugalRussiaSaudi ArabiaScotlandSingaporeSouth AfricaSouth AmericaSouth Central AsiaSouth Eastern AsiaSouthern EuropeSpainSudanSyriaTaiwanThailandTrinidad and TobagoTurkeyUkraineVenezuelaVietnamWestern AfricaWestern AsiaWestern EuropeZaireZimbabwe
Immigrant Origin (Percentage)
AfricaArgentinaAsiaAustraliaAustriaBahamasBangladeshBosnia and HerzegovinaBrazilBulgariaBurma / MyanmarCambodiaCameroonCanadaCaribbeanCentral AmericaChileChinaColombiaCubaDominican RepublicEastern AfricaEastern AsiaEastern EuropeEcuadorEgyptEl SalvadorEnglandEritreaEthiopiaEuropeFranceGermanyGhanaGreeceGuatemalaHondurasHong KongIndiaIndonesiaIranIraqIrelandItalyJamaicaJapanJordanKazakhstanKenyaKoreaKuwaitLaosLatin AmericaLebanonLiberiaMalaysiaMexicoMiddle AfricaMoroccoNepalNetherlandsNicaraguaNigeriaNorthern AfricaNorthern EuropeNorwayOceaniaPakistanPanamaPeruPhilippinesPolandPortugalRussiaSaudi ArabiaScotlandSingaporeSouth AfricaSouth AmericaSouth Central AsiaSouth Eastern AsiaSouthern EuropeSpainSudanSyriaTaiwanThailandTrinidad and TobagoTurkeyUkraineVenezuelaVietnamWestern AfricaWestern AsiaWestern EuropeZaireZimbabwe
Income
Income (Families)
Income (Households)
Poverty
Poverty (Families)
Unemployment
Employment Occupations
Employment Industries
Employer Class
Commute Time
Commute Means
School Enrollment
Education by Degree Field
Occupancy
Finances
Physical Characteristics
Oklahoma City
Compare Zip Codes
Comparison Subject

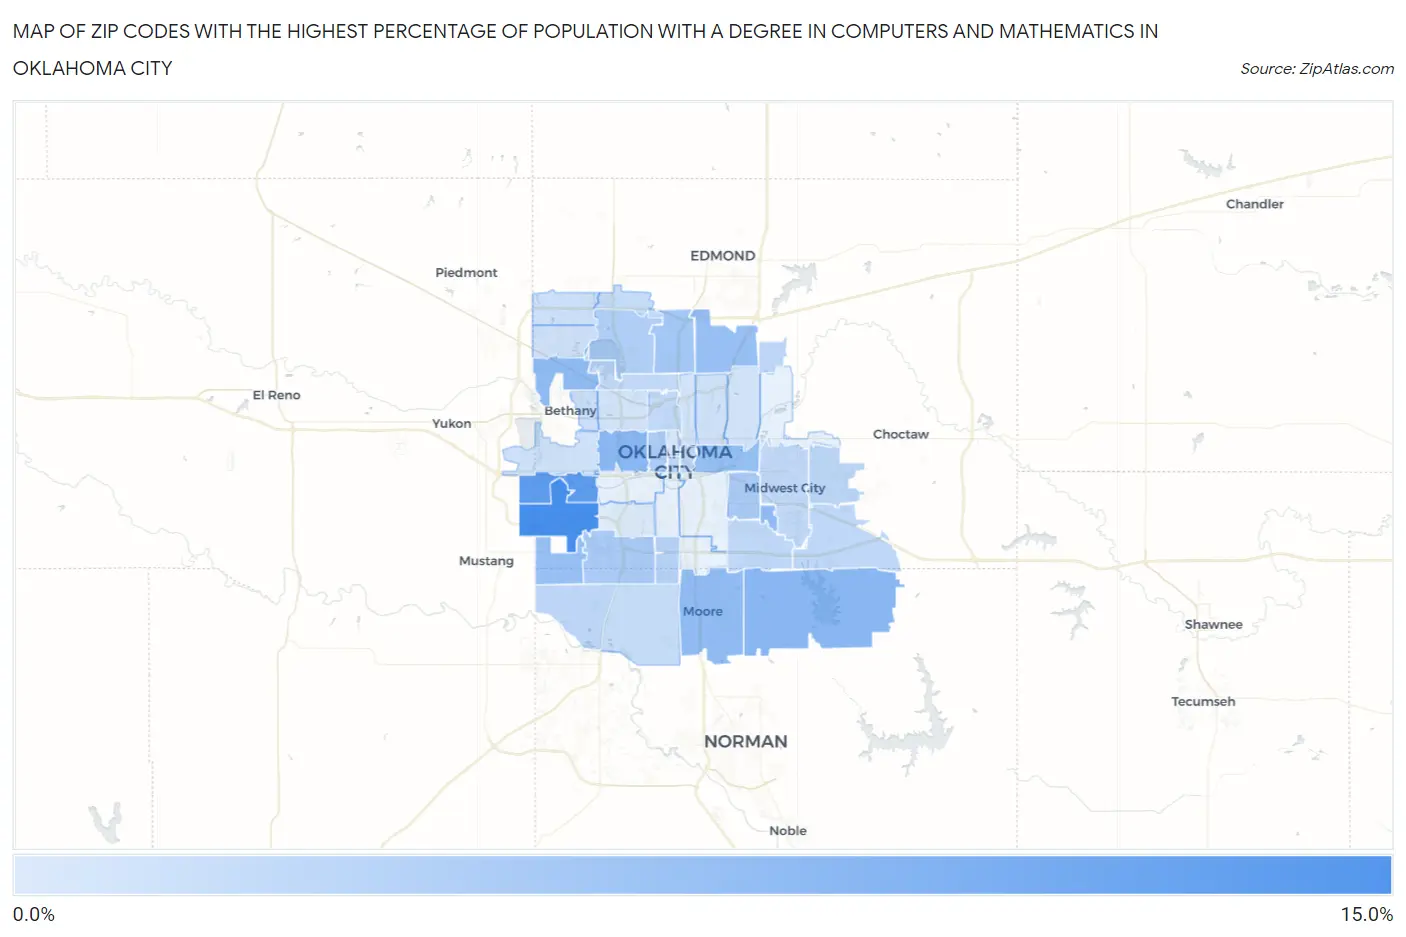
Map of Zip Codes with the Highest Percentage of Population with a Degree in Computers and Mathematics in Oklahoma City

0.0%
15.0%
Zip Codes with the Highest Percentage of Population with a Degree in Computers and Mathematics in Oklahoma City Map

Zip Codes with the Highest Percentage of Population with a Degree in Computers and Mathematics in Oklahoma City, OK

Zip Code % Graduates vs State vs National
1.7317912.6%3.4%(+9.18)#144.9%(+7.73)#1,106
2.7312810.6%3.4%(+7.14)#214.9%(+5.70)#1,558
3.731077.0%3.4%(+3.60)#564.9%(+2.15)#3,776
4.731657.0%3.4%(+3.59)#574.9%(+2.15)#3,780
5.731326.5%3.4%(+3.08)#634.9%(+1.63)#4,421
6.731606.5%3.4%(+3.07)#654.9%(+1.63)#4,440
7.731456.4%3.4%(+2.92)#714.9%(+1.48)#4,661
8.731176.0%3.4%(+2.59)#764.9%(+1.14)#5,232
9.731316.0%3.4%(+2.53)#784.9%(+1.08)#5,344
10.731695.9%3.4%(+2.50)#794.9%(+1.05)#5,390
11.731144.9%3.4%(+1.49)#1054.9%(+0.047)#7,587
12.731594.4%3.4%(+0.981)#1224.9%(-0.466)#9,100
13.731154.4%3.4%(+0.948)#1254.9%(-0.499)#9,219
14.731064.2%3.4%(+0.779)#1314.9%(-0.668)#9,744
15.731203.8%3.4%(+0.361)#1564.9%(-1.09)#11,162
16.731393.5%3.4%(+0.063)#1734.9%(-1.38)#12,245
17.731023.2%3.4%(-0.237)#1974.9%(-1.68)#13,349
18.731513.0%3.4%(-0.456)#2154.9%(-1.90)#14,124
19.731302.9%3.4%(-0.503)#2184.9%(-1.95)#14,271
20.731732.9%3.4%(-0.550)#2204.9%(-2.00)#14,442
21.731502.8%3.4%(-0.607)#2244.9%(-2.05)#14,651
22.731042.8%3.4%(-0.652)#2274.9%(-2.10)#14,807
23.731352.8%3.4%(-0.653)#2284.9%(-2.10)#14,810
24.731102.6%3.4%(-0.817)#2384.9%(-2.26)#15,423
25.731162.6%3.4%(-0.822)#2394.9%(-2.27)#15,436
26.731182.5%3.4%(-0.946)#2434.9%(-2.39)#15,882
27.731702.3%3.4%(-1.15)#2544.9%(-2.60)#16,613
28.731342.2%3.4%(-1.28)#2674.9%(-2.73)#17,080
29.731221.9%3.4%(-1.58)#2954.9%(-3.02)#18,017
30.731421.6%3.4%(-1.84)#3154.9%(-3.29)#18,851
31.731111.5%3.4%(-1.91)#3214.9%(-3.35)#19,023
32.731621.5%3.4%(-1.96)#3274.9%(-3.41)#19,193
33.731271.4%3.4%(-2.00)#3304.9%(-3.45)#19,295
34.731121.3%3.4%(-2.12)#3414.9%(-3.57)#19,627
35.731211.3%3.4%(-2.15)#3464.9%(-3.60)#19,745
36.731051.3%3.4%(-2.16)#3474.9%(-3.61)#19,767
37.731030.71%3.4%(-2.74)#3844.9%(-4.18)#21,126
38.731190.43%3.4%(-3.01)#3984.9%(-4.46)#21,563

Common Questions

What are the Top 10 Zip Codes with the Highest Percentage of Population with a Degree in Computers and Mathematics in Oklahoma City, OK?
Top 10 Zip Codes with the Highest Percentage of Population with a Degree in Computers and Mathematics in Oklahoma City, OK are:
#1
12.6%
#2
10.6%
#3
7.0%
#4
7.0%
#5
6.5%
#6
6.5%
#7
6.4%
#8
6.0%
#9
6.0%
#10
5.9%
What zip code has the Highest Percentage of Population with a Degree in Computers and Mathematics in Oklahoma City, OK?
73179 has the Highest Percentage of Population with a Degree in Computers and Mathematics in Oklahoma City, OK with 12.6%.
What is the Percentage of Population with a Degree in Computers and Mathematics in Oklahoma City, OK?
Percentage of Population with a Degree in Computers and Mathematics in Oklahoma City is 3.4%.
What is the Percentage of Population with a Degree in Computers and Mathematics in Oklahoma?
Percentage of Population with a Degree in Computers and Mathematics in Oklahoma is 3.4%.
What is the Percentage of Population with a Degree in Computers and Mathematics in the United States?
Percentage of Population with a Degree in Computers and Mathematics in the United States is 4.9%.