Suissevale, NH
Suissevale Map
Suissevale Overview
406
TOTAL POPULATION
190
MALE POPULATION
216
FEMALE POPULATION
87.96
MALES / 100 FEMALES
113.68
FEMALES / 100 MALES
56.1
MEDIAN AGE
2.9
AVG FAMILY SIZE
2.3
AVG HOUSEHOLD SIZE
$62,612
PER CAPITA INCOME
$170,083
AVG FAMILY INCOME
$95,486
AVG HOUSEHOLD INCOME
0.41
INEQUALITY / GINI INDEX
200
LABOR FORCE [ PEOPLE ]
66.0%
PERCENT IN LABOR FORCE
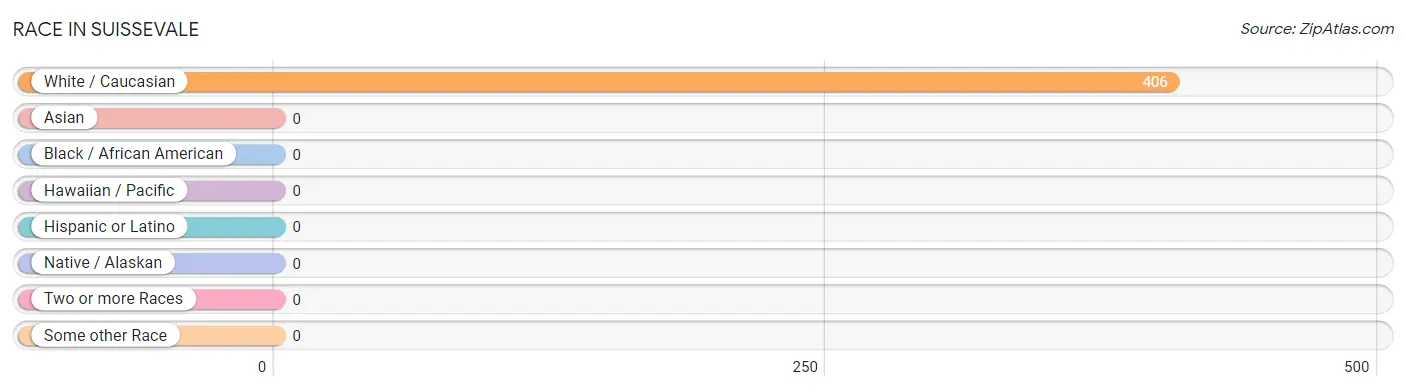
Race in Suissevale
The most populous races in Suissevale are , and White / Caucasian (406 | 100.0%).
| Race | # Population | % Population |
| Asian | 0 | 0.0% |
| Black / African American | 0 | 0.0% |
| Hawaiian / Pacific | 0 | 0.0% |
| Hispanic or Latino | 0 | 0.0% |
| Native / Alaskan | 0 | 0.0% |
| White / Caucasian | 406 | 100.0% |
| Two or more Races | 0 | 0.0% |
| Some other Race | 0 | 0.0% |
| Total | 406 | 100.0% |
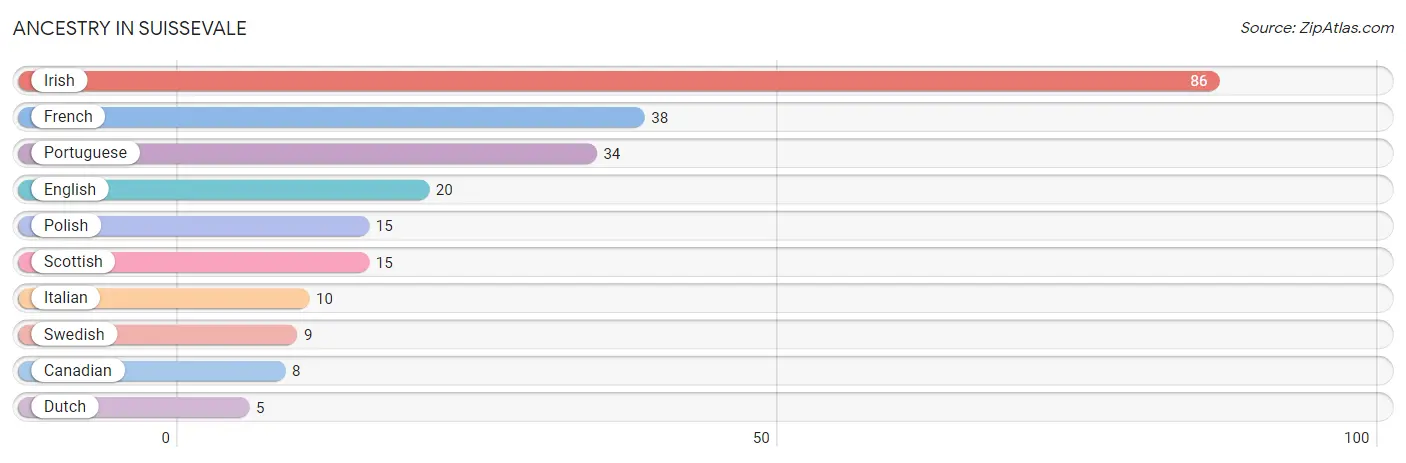
Ancestry in Suissevale
The most populous ancestries reported in Suissevale are Irish (86 | 21.2%), French (38 | 9.4%), Portuguese (34 | 8.4%), English (20 | 4.9%), and Polish (15 | 3.7%), together accounting for 47.5% of all Suissevale residents.
| Ancestry | # Population | % Population |
| Canadian | 8 | 2.0% |
| Dutch | 5 | 1.2% |
| English | 20 | 4.9% |
| French | 38 | 9.4% |
| Irish | 86 | 21.2% |
| Italian | 10 | 2.5% |
| Polish | 15 | 3.7% |
| Portuguese | 34 | 8.4% |
| Scottish | 15 | 3.7% |
| Swedish | 9 | 2.2% | View All 10 Rows |
Immigrants in Suissevale

| Immigration Origin | # Population | % Population | View All 0 Rows |
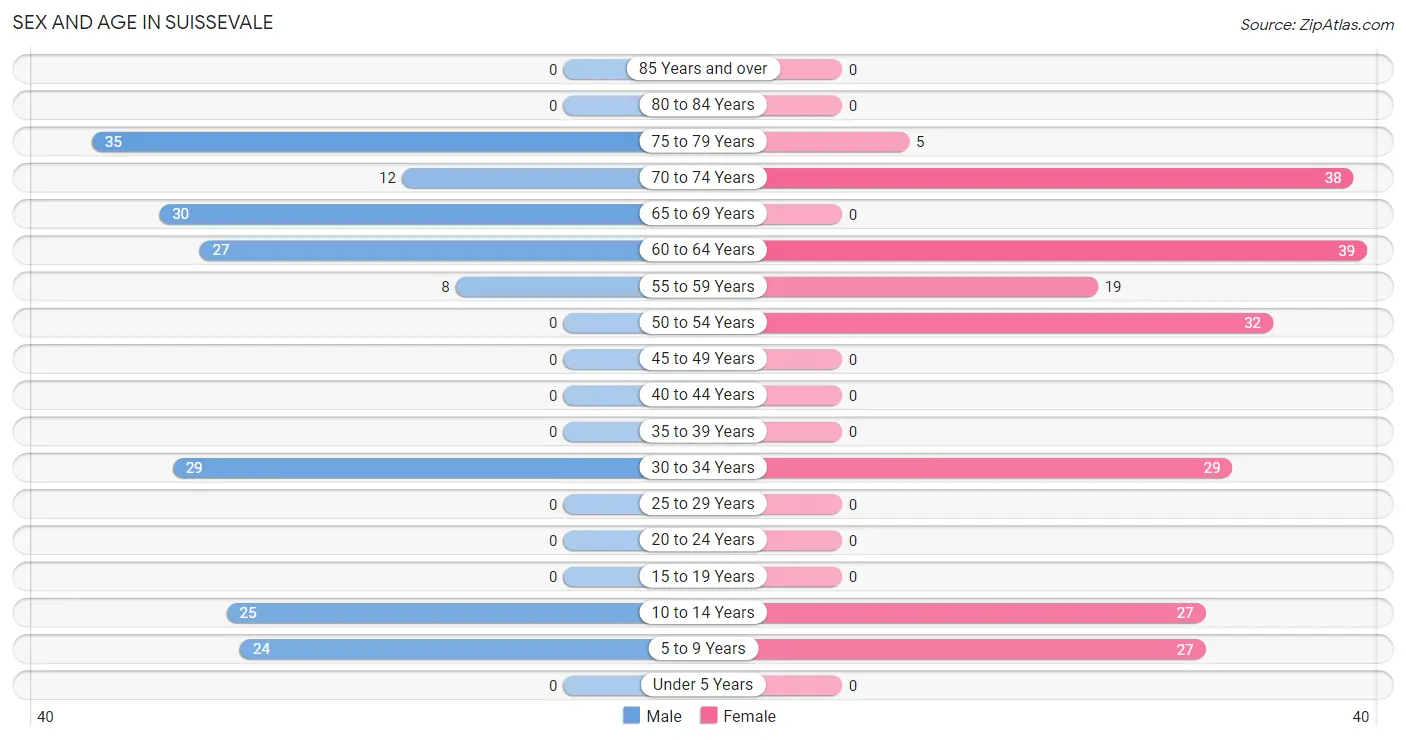
Sex and Age in Suissevale
Sex and Age in Suissevale
The most populous age groups in Suissevale are 75 to 79 Years (35 | 18.4%) for men and 60 to 64 Years (39 | 18.1%) for women.
| Age Bracket | Male | Female |
| Under 5 Years | 0 (0.0%) | 0 (0.0%) |
| 5 to 9 Years | 24 (12.6%) | 27 (12.5%) |
| 10 to 14 Years | 25 (13.2%) | 27 (12.5%) |
| 15 to 19 Years | 0 (0.0%) | 0 (0.0%) |
| 20 to 24 Years | 0 (0.0%) | 0 (0.0%) |
| 25 to 29 Years | 0 (0.0%) | 0 (0.0%) |
| 30 to 34 Years | 29 (15.3%) | 29 (13.4%) |
| 35 to 39 Years | 0 (0.0%) | 0 (0.0%) |
| 40 to 44 Years | 0 (0.0%) | 0 (0.0%) |
| 45 to 49 Years | 0 (0.0%) | 0 (0.0%) |
| 50 to 54 Years | 0 (0.0%) | 32 (14.8%) |
| 55 to 59 Years | 8 (4.2%) | 19 (8.8%) |
| 60 to 64 Years | 27 (14.2%) | 39 (18.1%) |
| 65 to 69 Years | 30 (15.8%) | 0 (0.0%) |
| 70 to 74 Years | 12 (6.3%) | 38 (17.6%) |
| 75 to 79 Years | 35 (18.4%) | 5 (2.3%) |
| 80 to 84 Years | 0 (0.0%) | 0 (0.0%) |
| 85 Years and over | 0 (0.0%) | 0 (0.0%) |
| Total | 190 (100.0%) | 216 (100.0%) |
Families and Households in Suissevale
Median Family Size in Suissevale
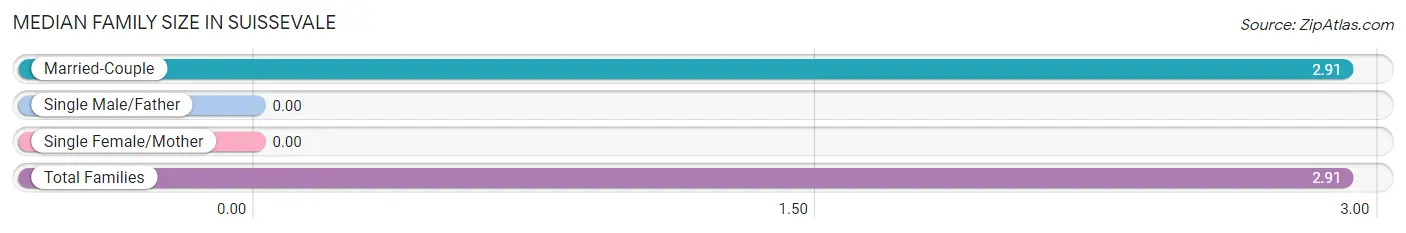
| Family Type | # Families | Family Size |
| Married-Couple | 116 (100.0%) | 2.91 |
| Single Male/Father | 0 (0.0%) | - |
| Single Female/Mother | 0 (0.0%) | - |
| Total Families | 116 (100.0%) | 2.91 |
Median Household Size in Suissevale
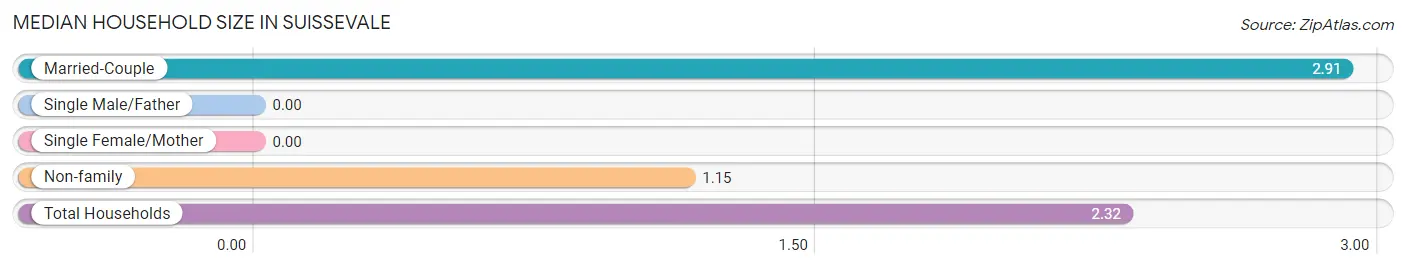
| Household Type | # Households | Household Size |
| Married-Couple | 116 (66.3%) | 2.91 |
| Single Male/Father | 0 (0.0%) | - |
| Single Female/Mother | 0 (0.0%) | - |
| Non-family | 59 (33.7%) | 1.15 |
| Total Households | 175 (100.0%) | 2.32 |
Household Size by Marriage Status in Suissevale
Out of a total of 175 households in Suissevale, 116 (66.3%) are family households, while 59 (33.7%) are nonfamily households. The most numerous type of family households are 2-person households, comprising 87, and the most common type of nonfamily households are 1-person households, comprising 51.
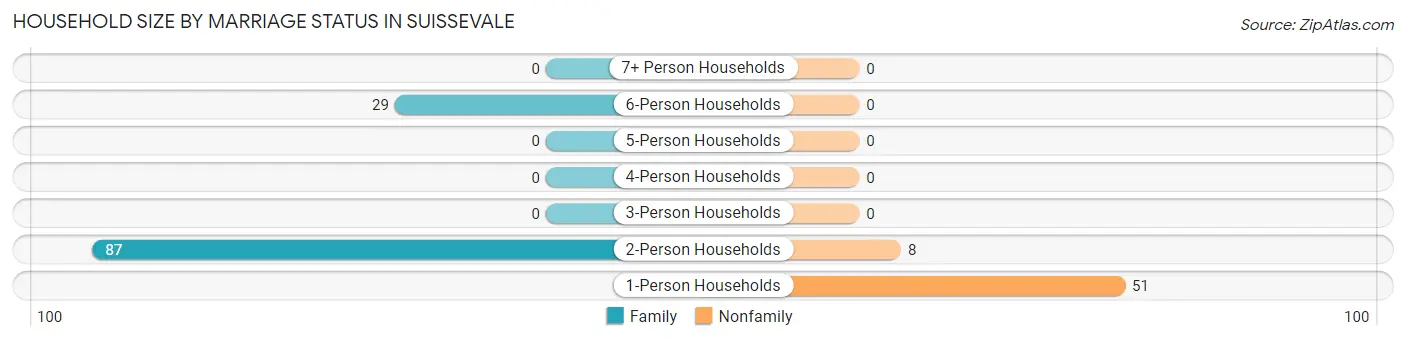
| Household Size | Family Households | Nonfamily Households |
| 1-Person Households | - | 51 (29.1%) |
| 2-Person Households | 87 (49.7%) | 8 (4.6%) |
| 3-Person Households | 0 (0.0%) | 0 (0.0%) |
| 4-Person Households | 0 (0.0%) | 0 (0.0%) |
| 5-Person Households | 0 (0.0%) | 0 (0.0%) |
| 6-Person Households | 29 (16.6%) | 0 (0.0%) |
| 7+ Person Households | 0 (0.0%) | 0 (0.0%) |
| Total | 116 (66.3%) | 59 (33.7%) |
Female Fertility in Suissevale
Fertility by Age in Suissevale
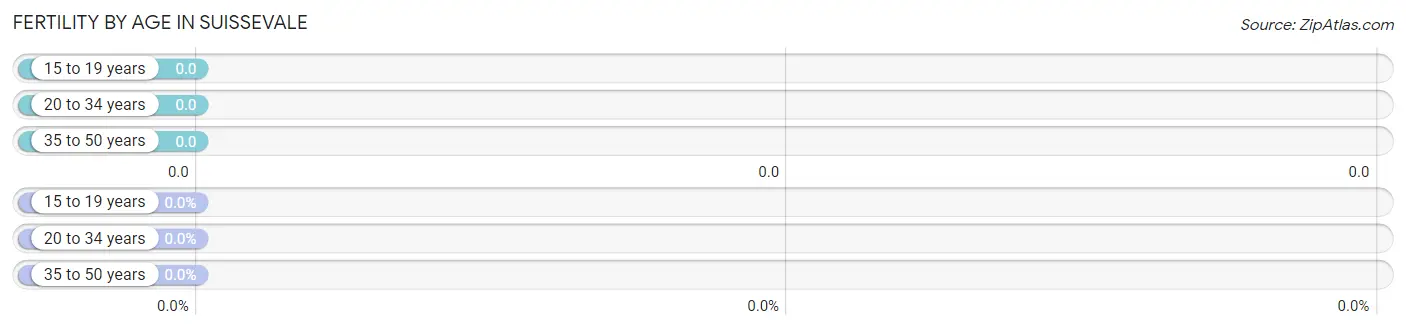
| Age Bracket | Women with Births | Births / 1,000 Women |
| 15 to 19 years | 0 (0.0%) | 0.0 |
| 20 to 34 years | 0 (0.0%) | 0.0 |
| 35 to 50 years | 0 (0.0%) | 0.0 |
| Total | 0 (0.0%) | 0.0 |
Fertility by Age by Marriage Status in Suissevale
| Age Bracket | Married | Unmarried |
| 15 to 19 years | 0 (0.0%) | 0 (0.0%) |
| 20 to 34 years | 0 (0.0%) | 0 (0.0%) |
| 35 to 50 years | 0 (0.0%) | 0 (0.0%) |
| Total | 0 (0.0%) | 0 (0.0%) |
Fertility by Education in Suissevale
| Educational Attainment | Women with Births | Births / 1,000 Women |
| Less than High School | 0 (0.0%) | 0.0 |
| High School Diploma | 0 (0.0%) | 0.0 |
| College or Associate's Degree | 0 (0.0%) | 0.0 |
| Bachelor's Degree | 0 (0.0%) | 0.0 |
| Graduate Degree | 0 (0.0%) | 0.0 |
| Total | 0 (0.0%) | 0.0 |
Fertility by Education by Marriage Status in Suissevale
| Educational Attainment | Married | Unmarried |
| Less than High School | 0 (0.0%) | 0 (0.0%) |
| High School Diploma | 0 (0.0%) | 0 (0.0%) |
| College or Associate's Degree | 0 (0.0%) | 0 (0.0%) |
| Bachelor's Degree | 0 (0.0%) | 0 (0.0%) |
| Graduate Degree | 0 (0.0%) | 0 (0.0%) |
| Total | 0 (0.0%) | 0 (0.0%) |
Income in Suissevale
Income Overview in Suissevale
Per Capita Income in Suissevale is $62,612, while median incomes of families and households are $170,083 and $95,486 respectively.
| Characteristic | Number | Measure |
| Per Capita Income | 406 | $62,612 |
| Median Family Income | 116 | $170,083 |
| Mean Family Income | 116 | $178,663 |
| Median Household Income | 175 | $95,486 |
| Mean Household Income | 175 | $143,487 |
| Income Deficit | 116 | $0 |
| Wage / Income Gap (%) | 406 | 0.00% |
| Wage / Income Gap ($) | 406 | 100.00¢ per $1 |
| Gini / Inequality Index | 406 | 0.41 |
Earnings by Sex in Suissevale
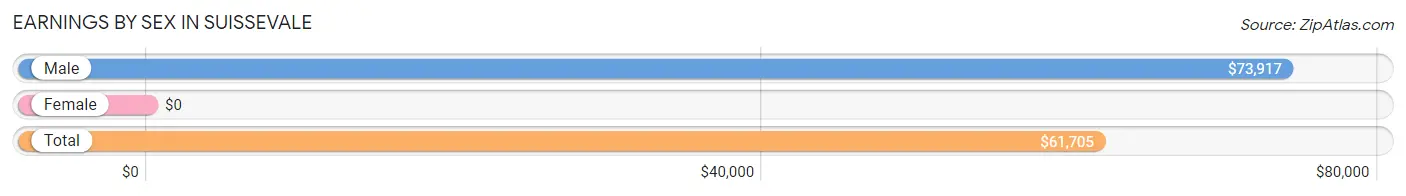
| Sex | Number | Average Earnings |
| Male | 100 (48.8%) | $73,917 |
| Female | 105 (51.2%) | $0 |
| Total | 205 (100.0%) | $61,705 |
Earnings by Sex by Income Bracket in Suissevale
The most common earnings brackets in Suissevale are $65,000 to $74,999 for men (30 | 30.0%) and $75,000 to $99,999 for women (32 | 30.5%).
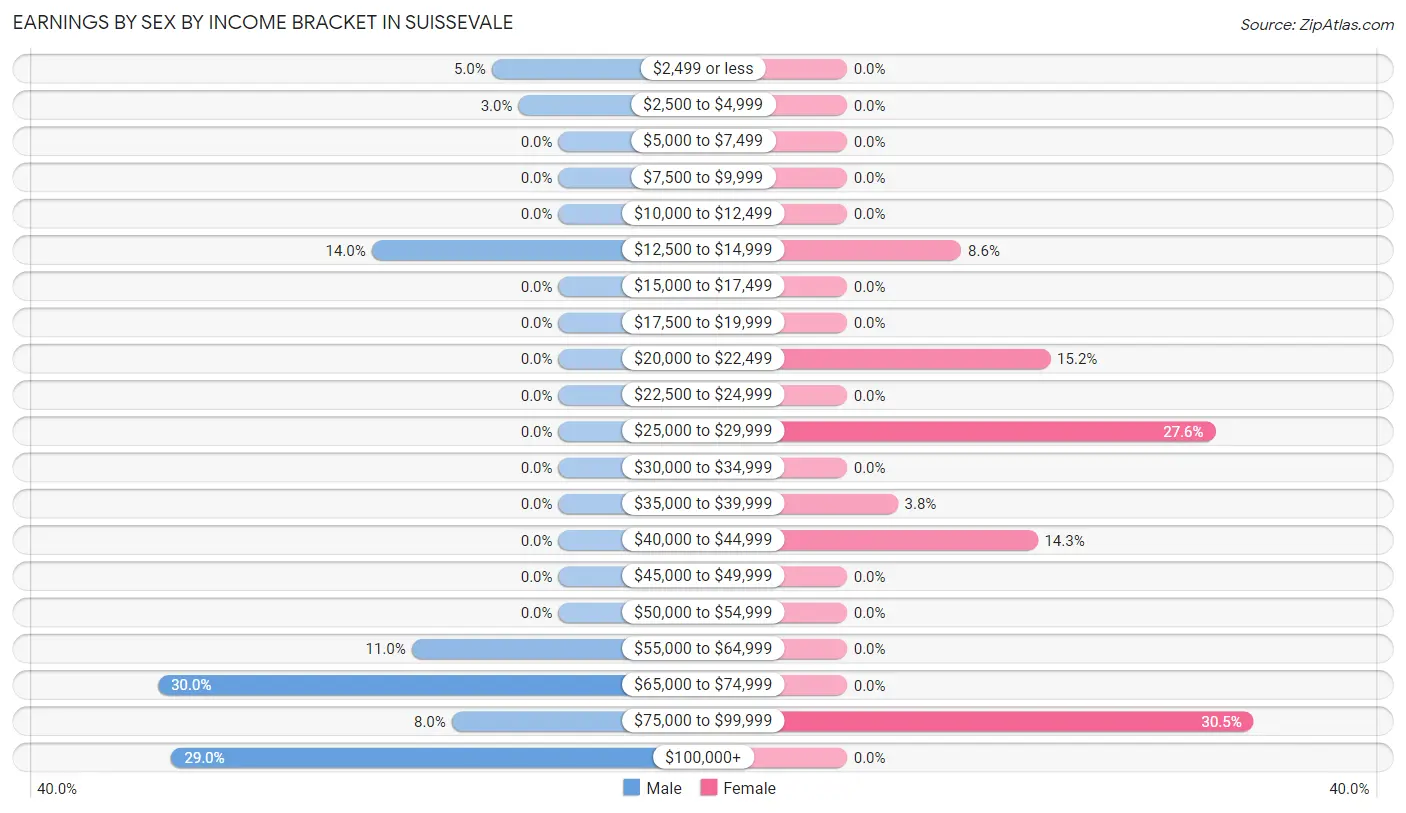
| Income | Male | Female |
| $2,499 or less | 5 (5.0%) | 0 (0.0%) |
| $2,500 to $4,999 | 3 (3.0%) | 0 (0.0%) |
| $5,000 to $7,499 | 0 (0.0%) | 0 (0.0%) |
| $7,500 to $9,999 | 0 (0.0%) | 0 (0.0%) |
| $10,000 to $12,499 | 0 (0.0%) | 0 (0.0%) |
| $12,500 to $14,999 | 14 (14.0%) | 9 (8.6%) |
| $15,000 to $17,499 | 0 (0.0%) | 0 (0.0%) |
| $17,500 to $19,999 | 0 (0.0%) | 0 (0.0%) |
| $20,000 to $22,499 | 0 (0.0%) | 16 (15.2%) |
| $22,500 to $24,999 | 0 (0.0%) | 0 (0.0%) |
| $25,000 to $29,999 | 0 (0.0%) | 29 (27.6%) |
| $30,000 to $34,999 | 0 (0.0%) | 0 (0.0%) |
| $35,000 to $39,999 | 0 (0.0%) | 4 (3.8%) |
| $40,000 to $44,999 | 0 (0.0%) | 15 (14.3%) |
| $45,000 to $49,999 | 0 (0.0%) | 0 (0.0%) |
| $50,000 to $54,999 | 0 (0.0%) | 0 (0.0%) |
| $55,000 to $64,999 | 11 (11.0%) | 0 (0.0%) |
| $65,000 to $74,999 | 30 (30.0%) | 0 (0.0%) |
| $75,000 to $99,999 | 8 (8.0%) | 32 (30.5%) |
| $100,000+ | 29 (29.0%) | 0 (0.0%) |
| Total | 100 (100.0%) | 105 (100.0%) |
Earnings by Sex by Educational Attainment in Suissevale
| Educational Attainment | Male Income | Female Income |
| Less than High School | - | - |
| High School Diploma | - | - |
| College or Associate's Degree | - | - |
| Bachelor's Degree | - | - |
| Graduate Degree | - | - |
| Total | $73,917 | $0 |
Family Income in Suissevale
Family Income Brackets in Suissevale
According to the Suissevale family income data, there are 30 families falling into the $150,000 to $199,999 income range, which is the most common income bracket and makes up 25.9% of all families.
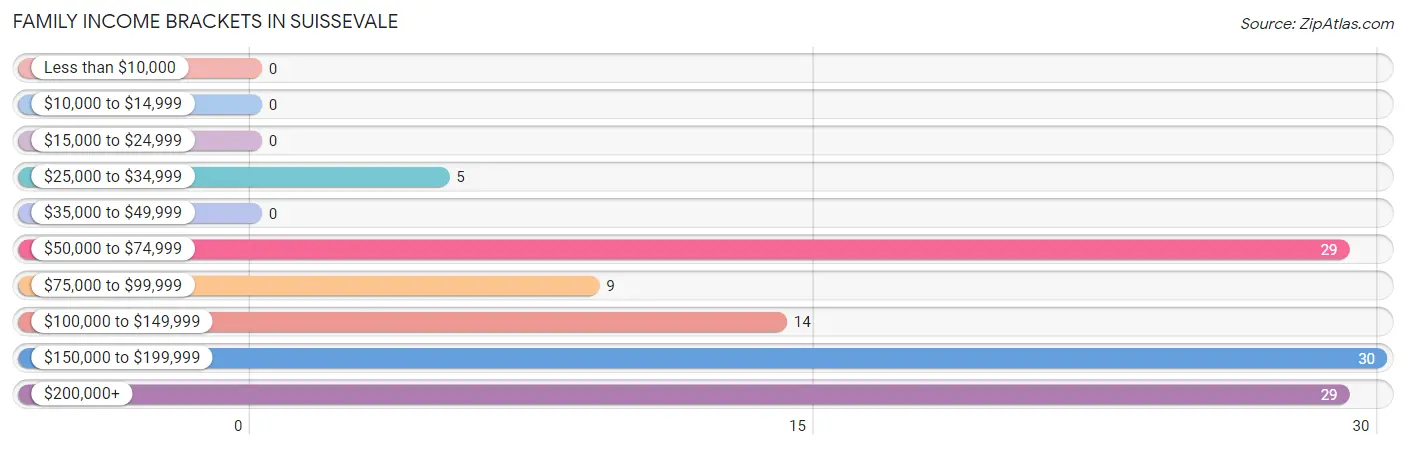
| Income Bracket | # Families | % Families |
| Less than $10,000 | 0 | 0.0% |
| $10,000 to $14,999 | 0 | 0.0% |
| $15,000 to $24,999 | 0 | 0.0% |
| $25,000 to $34,999 | 5 | 4.3% |
| $35,000 to $49,999 | 0 | 0.0% |
| $50,000 to $74,999 | 29 | 25.0% |
| $75,000 to $99,999 | 9 | 7.8% |
| $100,000 to $149,999 | 14 | 12.1% |
| $150,000 to $199,999 | 30 | 25.9% |
| $200,000+ | 29 | 25.0% |
Family Income by Famaliy Size in Suissevale
2-person families (87 | 75.0%) account for the highest median family income in Suissevale with $102,614 per family, while 2-person families (87 | 75.0%) have the highest median income of $51,307 per family member.
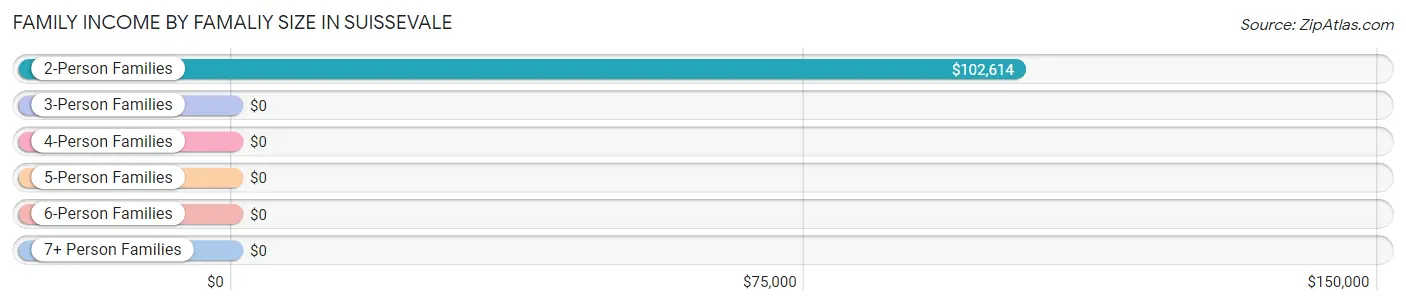
| Income Bracket | # Families | Median Income |
| 2-Person Families | 87 (75.0%) | $102,614 |
| 3-Person Families | 0 (0.0%) | $0 |
| 4-Person Families | 0 (0.0%) | $0 |
| 5-Person Families | 0 (0.0%) | $0 |
| 6-Person Families | 29 (25.0%) | $0 |
| 7+ Person Families | 0 (0.0%) | $0 |
| Total | 116 (100.0%) | $170,083 |
Family Income by Number of Earners in Suissevale
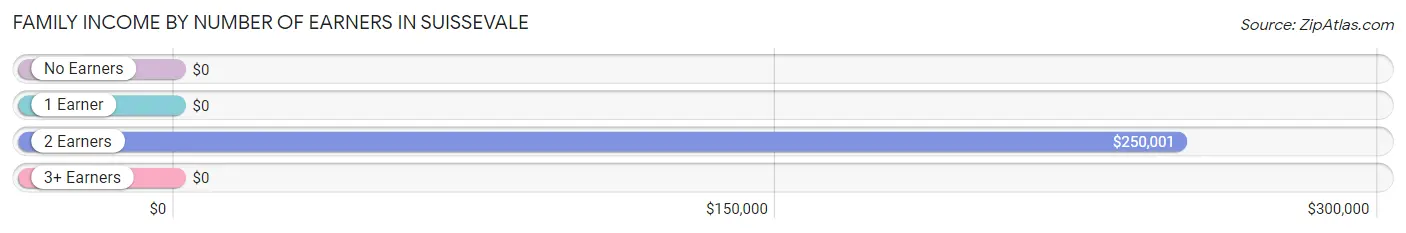
| Number of Earners | # Families | Median Income |
| No Earners | 9 (7.8%) | $0 |
| 1 Earner | 61 (52.6%) | $0 |
| 2 Earners | 46 (39.7%) | $250,001 |
| 3+ Earners | 0 (0.0%) | $0 |
| Total | 116 (100.0%) | $170,083 |
Household Income in Suissevale
Household Income Brackets in Suissevale
With 59 households falling in the category, the $75,000 to $99,999 income range is the most frequent in Suissevale, accounting for 33.7% of all households.
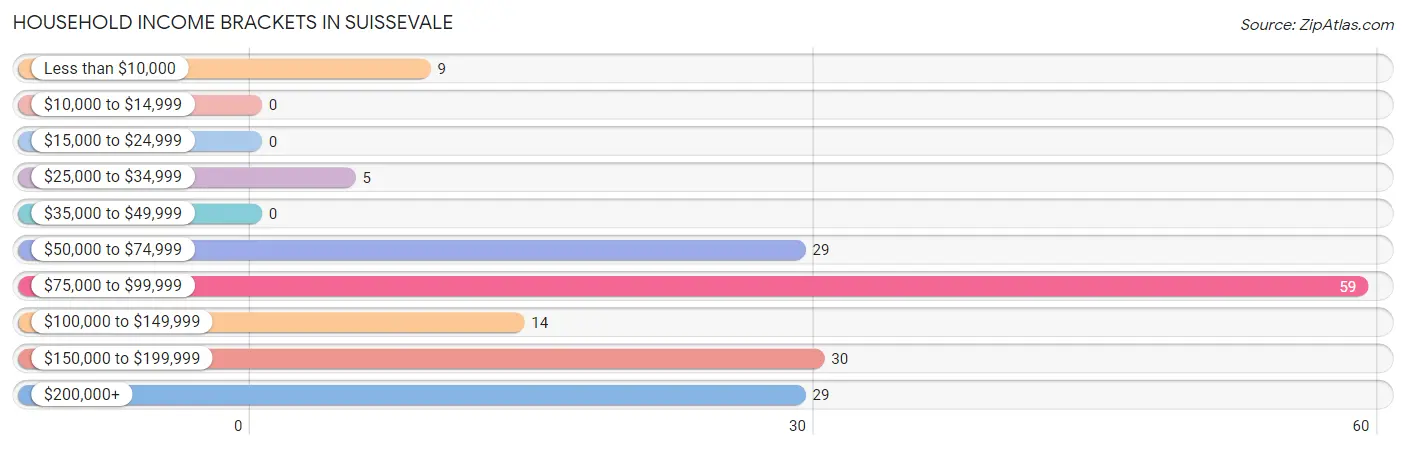
| Income Bracket | # Households | % Households |
| Less than $10,000 | 9 | 5.1% |
| $10,000 to $14,999 | 0 | 0.0% |
| $15,000 to $24,999 | 0 | 0.0% |
| $25,000 to $34,999 | 5 | 2.9% |
| $35,000 to $49,999 | 0 | 0.0% |
| $50,000 to $74,999 | 29 | 16.6% |
| $75,000 to $99,999 | 59 | 33.7% |
| $100,000 to $149,999 | 14 | 8.0% |
| $150,000 to $199,999 | 30 | 17.1% |
| $200,000+ | 29 | 16.6% |
Household Income by Householder Age in Suissevale
The median household income in Suissevale is $95,486, with the highest median household income of $103,750 found in the 65+ years age bracket for the primary householder. A total of 77 households (44.0%) fall into this category.
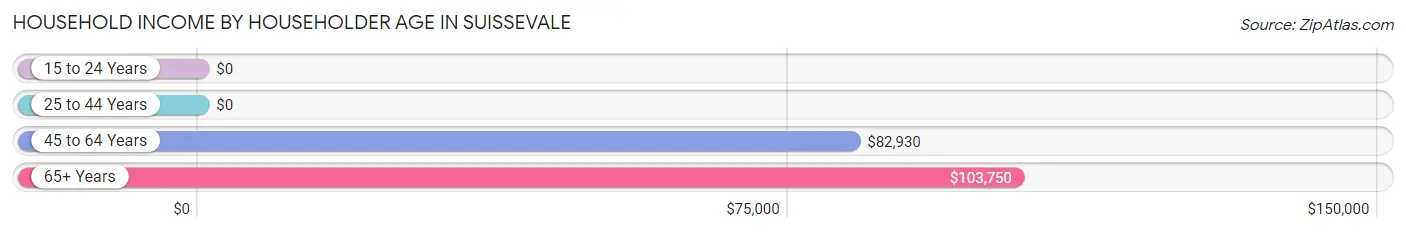
| Income Bracket | # Households | Median Income |
| 15 to 24 Years | 0 (0.0%) | $0 |
| 25 to 44 Years | 29 (16.6%) | $0 |
| 45 to 64 Years | 69 (39.4%) | $82,930 |
| 65+ Years | 77 (44.0%) | $103,750 |
| Total | 175 (100.0%) | $95,486 |
Poverty in Suissevale
Income Below Poverty by Sex and Age in Suissevale
With 4.7% poverty level for males and 4.2% for females among the residents of Suissevale, 65 to 74 year old males and 55 to 64 year old females are the most vulnerable to poverty, with 9 males (21.4%) and 9 females (15.5%) in their respective age groups living below the poverty level.
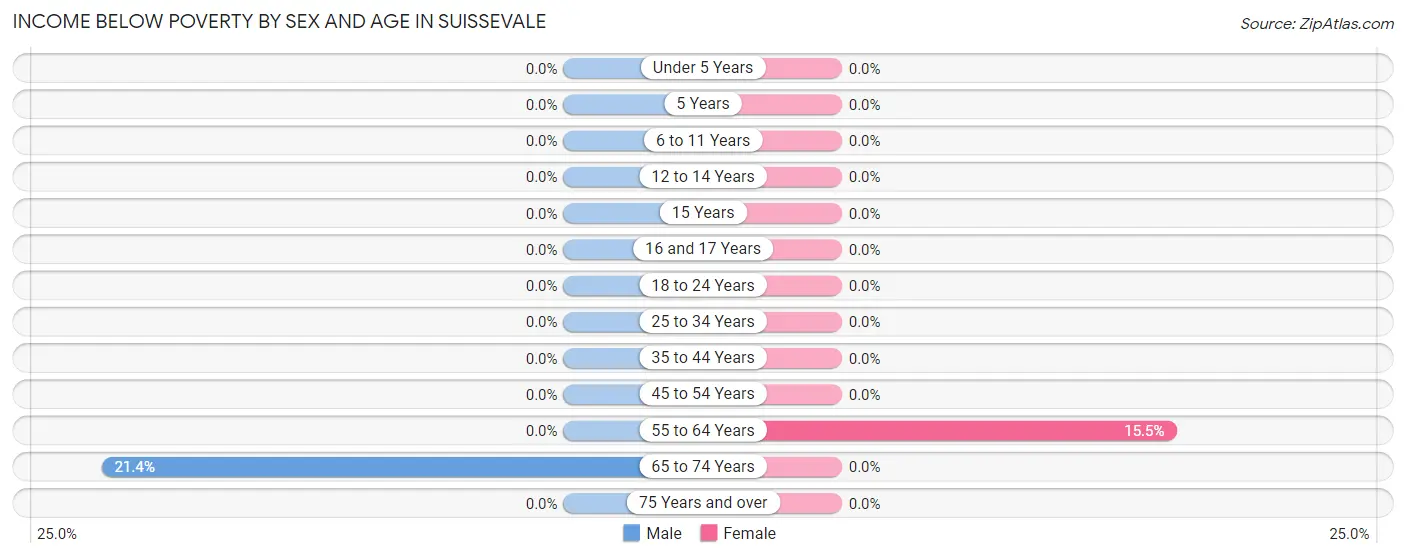
| Age Bracket | Male | Female |
| Under 5 Years | 0 (0.0%) | 0 (0.0%) |
| 5 Years | 0 (0.0%) | 0 (0.0%) |
| 6 to 11 Years | 0 (0.0%) | 0 (0.0%) |
| 12 to 14 Years | 0 (0.0%) | 0 (0.0%) |
| 15 Years | 0 (0.0%) | 0 (0.0%) |
| 16 and 17 Years | 0 (0.0%) | 0 (0.0%) |
| 18 to 24 Years | 0 (0.0%) | 0 (0.0%) |
| 25 to 34 Years | 0 (0.0%) | 0 (0.0%) |
| 35 to 44 Years | 0 (0.0%) | 0 (0.0%) |
| 45 to 54 Years | 0 (0.0%) | 0 (0.0%) |
| 55 to 64 Years | 0 (0.0%) | 9 (15.5%) |
| 65 to 74 Years | 9 (21.4%) | 0 (0.0%) |
| 75 Years and over | 0 (0.0%) | 0 (0.0%) |
| Total | 9 (4.7%) | 9 (4.2%) |
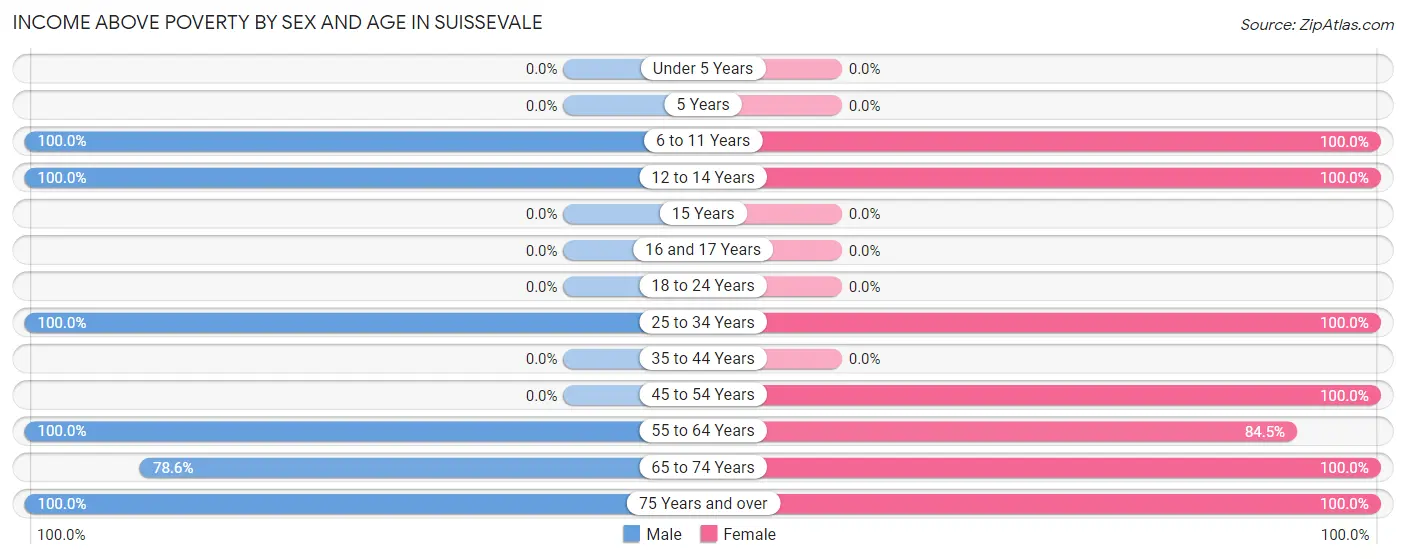
Income Above Poverty by Sex and Age in Suissevale
According to the poverty statistics in Suissevale, males aged 6 to 11 years and females aged 6 to 11 years are the age groups that are most secure financially, with 100.0% of males and 100.0% of females in these age groups living above the poverty line.
| Age Bracket | Male | Female |
| Under 5 Years | 0 (0.0%) | 0 (0.0%) |
| 5 Years | 0 (0.0%) | 0 (0.0%) |
| 6 to 11 Years | 24 (100.0%) | 27 (100.0%) |
| 12 to 14 Years | 25 (100.0%) | 27 (100.0%) |
| 15 Years | 0 (0.0%) | 0 (0.0%) |
| 16 and 17 Years | 0 (0.0%) | 0 (0.0%) |
| 18 to 24 Years | 0 (0.0%) | 0 (0.0%) |
| 25 to 34 Years | 29 (100.0%) | 29 (100.0%) |
| 35 to 44 Years | 0 (0.0%) | 0 (0.0%) |
| 45 to 54 Years | 0 (0.0%) | 32 (100.0%) |
| 55 to 64 Years | 35 (100.0%) | 49 (84.5%) |
| 65 to 74 Years | 33 (78.6%) | 38 (100.0%) |
| 75 Years and over | 35 (100.0%) | 5 (100.0%) |
| Total | 181 (95.3%) | 207 (95.8%) |
Income Below Poverty Among Married-Couple Families in Suissevale
| Children | Above Poverty | Below Poverty |
| No Children | 87 (100.0%) | 0 (0.0%) |
| 1 or 2 Children | 0 (0.0%) | 0 (0.0%) |
| 3 or 4 Children | 29 (100.0%) | 0 (0.0%) |
| 5 or more Children | 0 (0.0%) | 0 (0.0%) |
| Total | 116 (100.0%) | 0 (0.0%) |
Income Below Poverty Among Single-Parent Households in Suissevale
| Children | Single Father | Single Mother |
| No Children | 0 (0.0%) | 0 (0.0%) |
| 1 or 2 Children | 0 (0.0%) | 0 (0.0%) |
| 3 or 4 Children | 0 (0.0%) | 0 (0.0%) |
| 5 or more Children | 0 (0.0%) | 0 (0.0%) |
| Total | 0 (0.0%) | 0 (0.0%) |
Income Below Poverty Among Married-Couple vs Single-Parent Households in Suissevale
| Children | Married-Couple Families | Single-Parent Households |
| No Children | 0 (0.0%) | 0 (0.0%) |
| 1 or 2 Children | 0 (0.0%) | 0 (0.0%) |
| 3 or 4 Children | 0 (0.0%) | 0 (0.0%) |
| 5 or more Children | 0 (0.0%) | 0 (0.0%) |
| Total | 0 (0.0%) | 0 (0.0%) |
Employment Characteristics in Suissevale
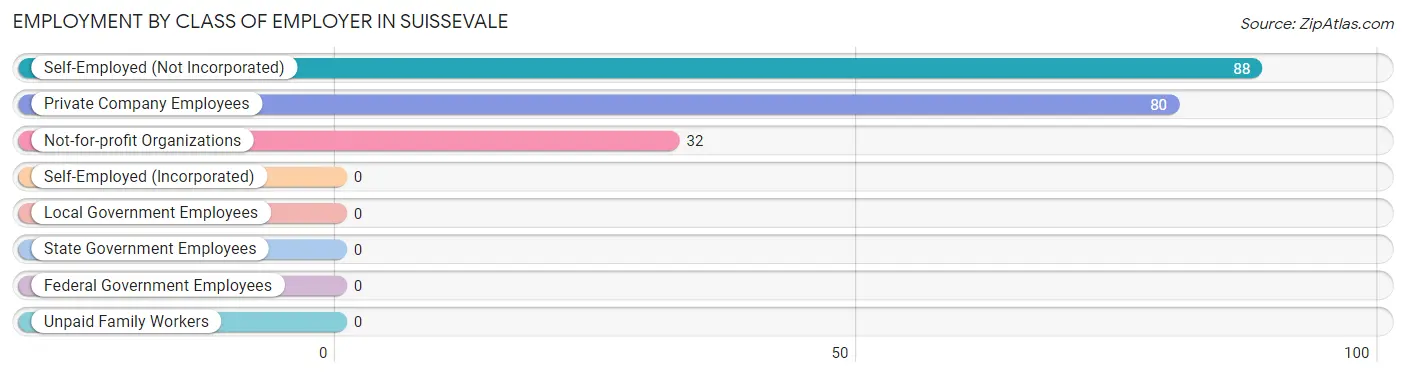
Employment by Class of Employer in Suissevale
Among the 200 employed individuals in Suissevale, self-employed (not incorporated) (88 | 44.0%), private company employees (80 | 40.0%), and not-for-profit organizations (32 | 16.0%) make up the most common classes of employment.
| Employer Class | # Employees | % Employees |
| Private Company Employees | 80 | 40.0% |
| Self-Employed (Incorporated) | 0 | 0.0% |
| Self-Employed (Not Incorporated) | 88 | 44.0% |
| Not-for-profit Organizations | 32 | 16.0% |
| Local Government Employees | 0 | 0.0% |
| State Government Employees | 0 | 0.0% |
| Federal Government Employees | 0 | 0.0% |
| Unpaid Family Workers | 0 | 0.0% |
| Total | 200 | 100.0% |
Employment Status by Age in Suissevale
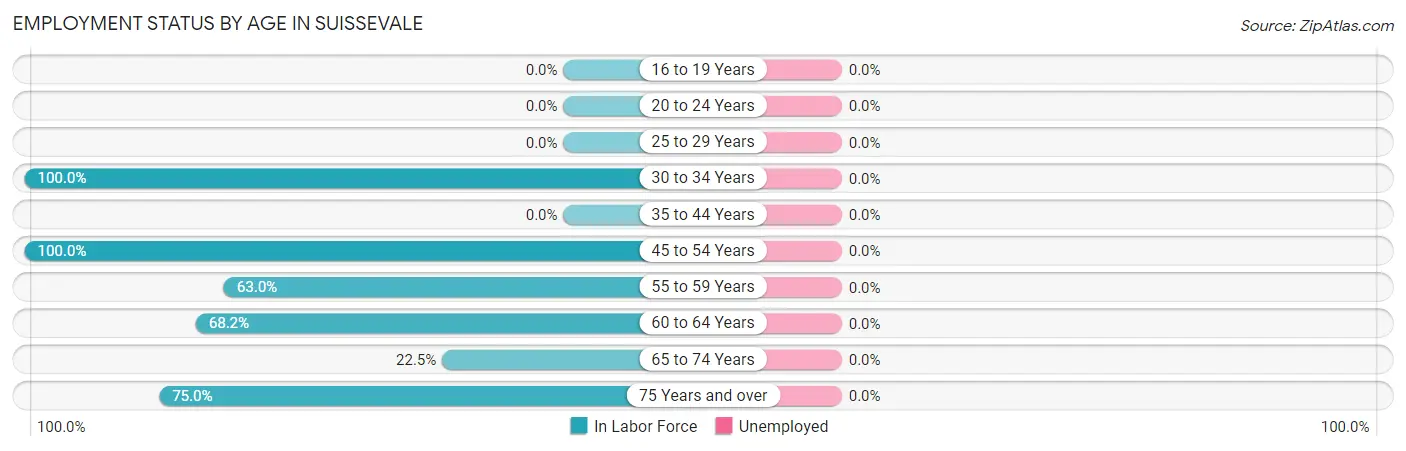
| Age Bracket | In Labor Force | Unemployed |
| 16 to 19 Years | 0 (0.0%) | 0 (0.0%) |
| 20 to 24 Years | 0 (0.0%) | 0 (0.0%) |
| 25 to 29 Years | 0 (0.0%) | 0 (0.0%) |
| 30 to 34 Years | 58 (100.0%) | 0 (0.0%) |
| 35 to 44 Years | 0 (0.0%) | 0 (0.0%) |
| 45 to 54 Years | 32 (100.0%) | 0 (0.0%) |
| 55 to 59 Years | 17 (63.0%) | 0 (0.0%) |
| 60 to 64 Years | 45 (68.2%) | 0 (0.0%) |
| 65 to 74 Years | 18 (22.5%) | 0 (0.0%) |
| 75 Years and over | 30 (75.0%) | 0 (0.0%) |
| Total | 200 (66.0%) | 0 (0.0%) |
Employment Status by Educational Attainment in Suissevale
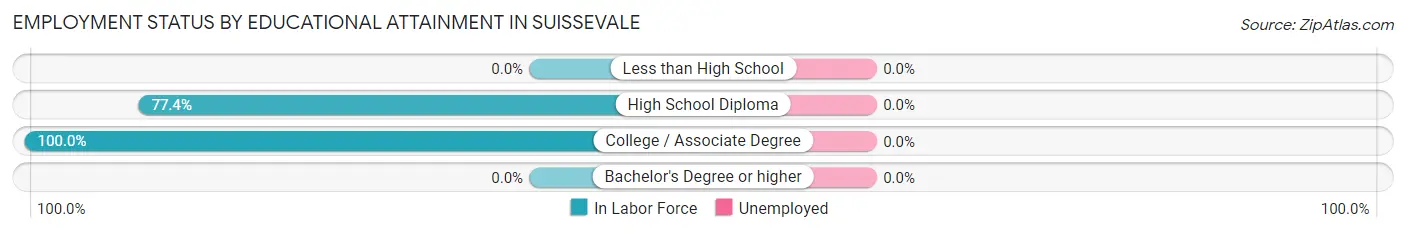
| Educational Attainment | In Labor Force | Unemployed |
| Less than High School | 0 (0.0%) | 0 (0.0%) |
| High School Diploma | 72 (77.4%) | 0 (0.0%) |
| College / Associate Degree | 80 (100.0%) | 0 (0.0%) |
| Bachelor's Degree or higher | 0 (0.0%) | 0 (0.0%) |
| Total | 152 (83.1%) | 0 (0.0%) |
Employment Occupations by Sex in Suissevale
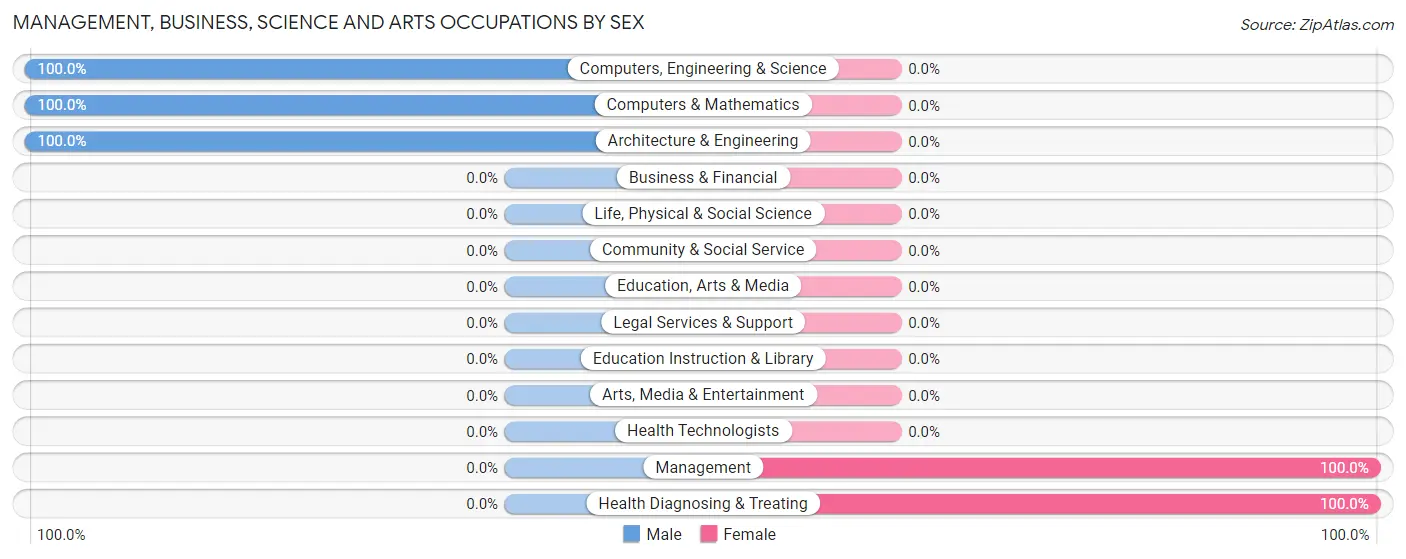
Management, Business, Science and Arts Occupations
The most common Management, Business, Science and Arts occupations in Suissevale are Computers, Engineering & Science (38 | 19.0%), Management (32 | 16.0%), Architecture & Engineering (30 | 15.0%), Computers & Mathematics (8 | 4.0%), and Health Diagnosing & Treating (4 | 2.0%).
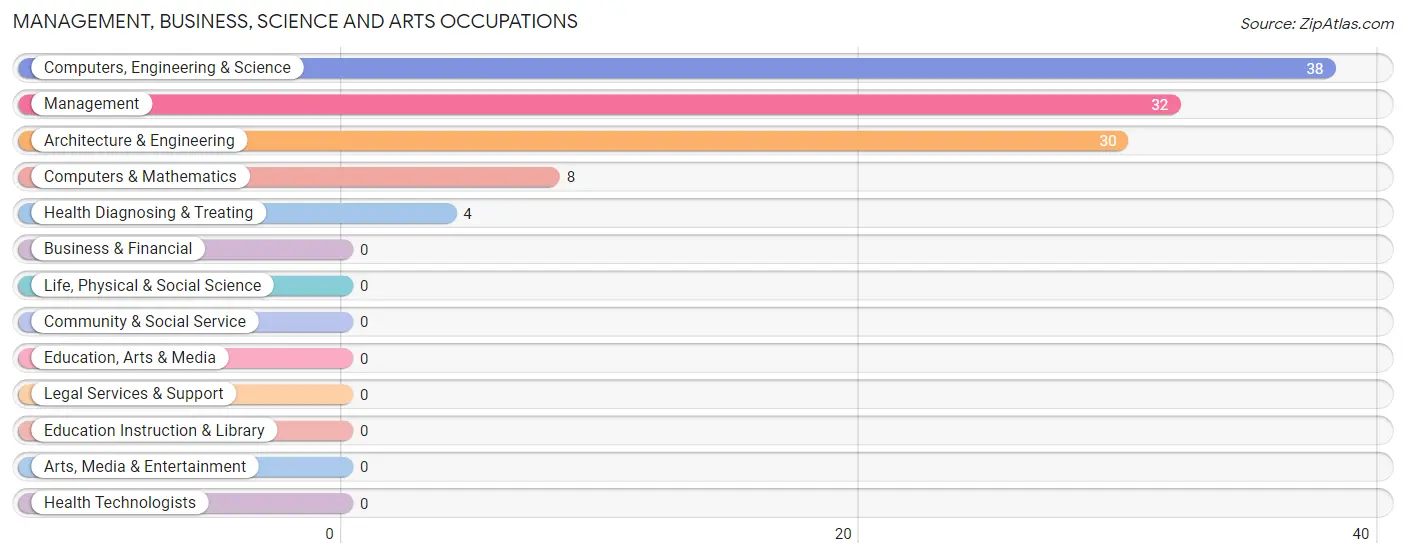
Management, Business, Science and Arts Occupations by Sex
Within the Management, Business, Science and Arts occupations in Suissevale, the most male-oriented occupations are Computers, Engineering & Science (100.0%), Computers & Mathematics (100.0%), and Architecture & Engineering (100.0%), while the most female-oriented occupations are Management (100.0%), and Health Diagnosing & Treating (100.0%).
| Occupation | Male | Female |
| Management | 0 (0.0%) | 32 (100.0%) |
| Business & Financial | 0 (0.0%) | 0 (0.0%) |
| Computers, Engineering & Science | 38 (100.0%) | 0 (0.0%) |
| Computers & Mathematics | 8 (100.0%) | 0 (0.0%) |
| Architecture & Engineering | 30 (100.0%) | 0 (0.0%) |
| Life, Physical & Social Science | 0 (0.0%) | 0 (0.0%) |
| Community & Social Service | 0 (0.0%) | 0 (0.0%) |
| Education, Arts & Media | 0 (0.0%) | 0 (0.0%) |
| Legal Services & Support | 0 (0.0%) | 0 (0.0%) |
| Education Instruction & Library | 0 (0.0%) | 0 (0.0%) |
| Arts, Media & Entertainment | 0 (0.0%) | 0 (0.0%) |
| Health Diagnosing & Treating | 0 (0.0%) | 4 (100.0%) |
| Health Technologists | 0 (0.0%) | 0 (0.0%) |
| Total (Category) | 38 (51.3%) | 36 (48.6%) |
| Total (Overall) | 95 (47.5%) | 105 (52.5%) |
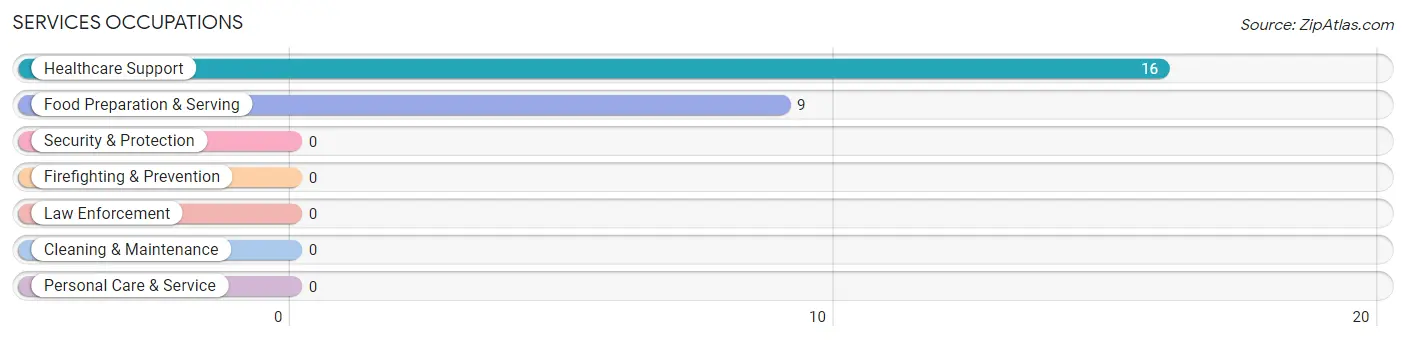
Services Occupations
The most common Services occupations in Suissevale are Healthcare Support (16 | 8.0%), and Food Preparation & Serving (9 | 4.5%).
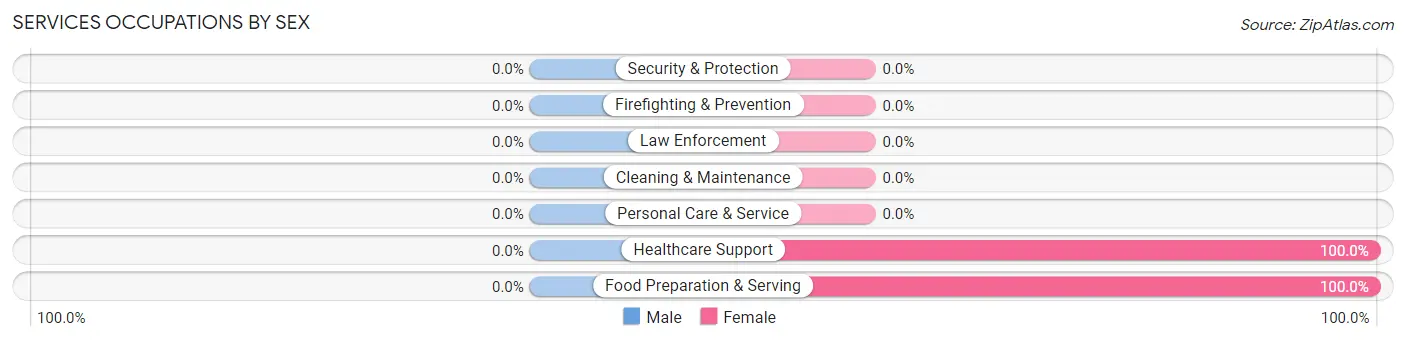
Services Occupations by Sex
| Occupation | Male | Female |
| Healthcare Support | 0 (0.0%) | 16 (100.0%) |
| Security & Protection | 0 (0.0%) | 0 (0.0%) |
| Firefighting & Prevention | 0 (0.0%) | 0 (0.0%) |
| Law Enforcement | 0 (0.0%) | 0 (0.0%) |
| Food Preparation & Serving | 0 (0.0%) | 9 (100.0%) |
| Cleaning & Maintenance | 0 (0.0%) | 0 (0.0%) |
| Personal Care & Service | 0 (0.0%) | 0 (0.0%) |
| Total (Category) | 0 (0.0%) | 25 (100.0%) |
| Total (Overall) | 95 (47.5%) | 105 (52.5%) |
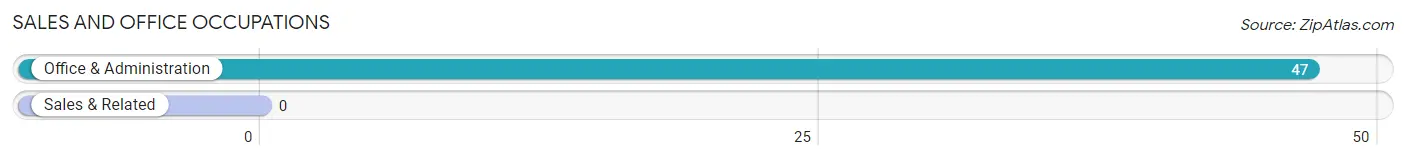
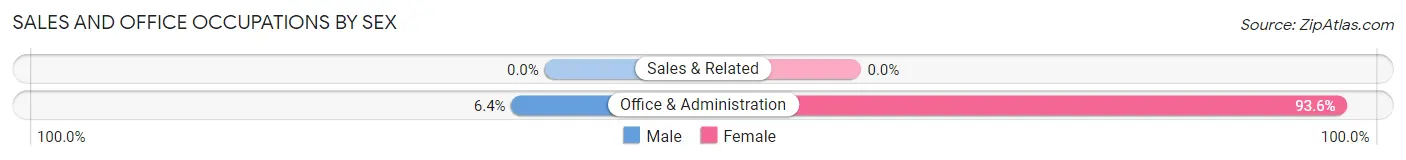
Sales and Office Occupations
The most common Sales and Office occupations in Suissevale are , and Office & Administration (47 | 23.5%).
Sales and Office Occupations by Sex
| Occupation | Male | Female |
| Sales & Related | 0 (0.0%) | 0 (0.0%) |
| Office & Administration | 3 (6.4%) | 44 (93.6%) |
| Total (Category) | 3 (6.4%) | 44 (93.6%) |
| Total (Overall) | 95 (47.5%) | 105 (52.5%) |
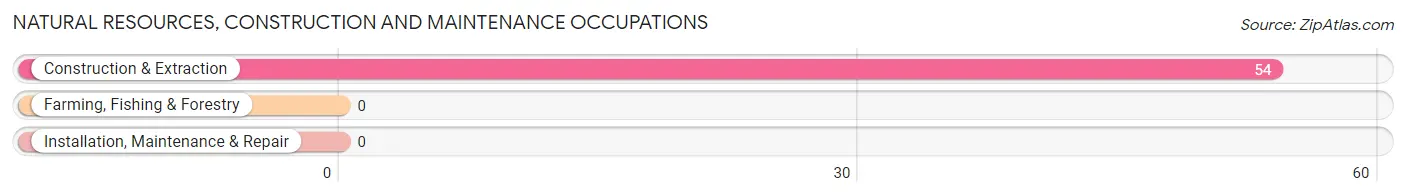
Natural Resources, Construction and Maintenance Occupations
The most common Natural Resources, Construction and Maintenance occupations in Suissevale are , and Construction & Extraction (54 | 27.0%).
Natural Resources, Construction and Maintenance Occupations by Sex
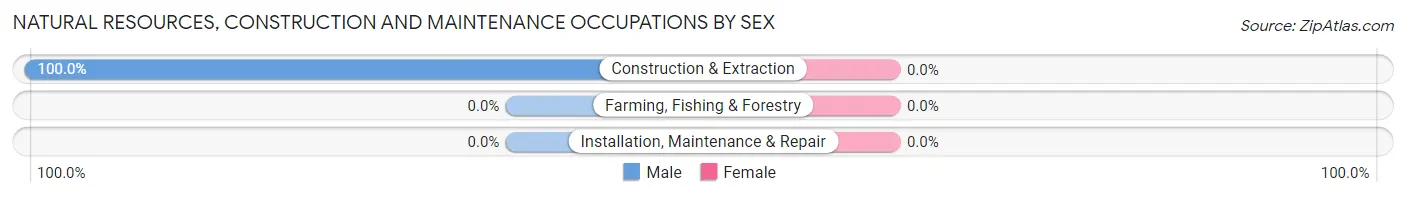
| Occupation | Male | Female |
| Farming, Fishing & Forestry | 0 (0.0%) | 0 (0.0%) |
| Construction & Extraction | 54 (100.0%) | 0 (0.0%) |
| Installation, Maintenance & Repair | 0 (0.0%) | 0 (0.0%) |
| Total (Category) | 54 (100.0%) | 0 (0.0%) |
| Total (Overall) | 95 (47.5%) | 105 (52.5%) |
Production, Transportation and Moving Occupations
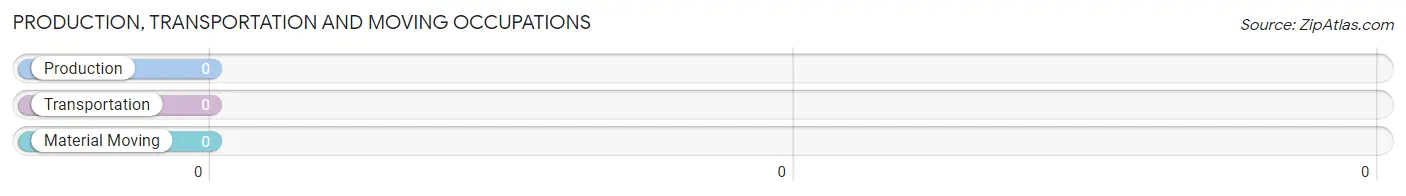
Production, Transportation and Moving Occupations by Sex
| Occupation | Male | Female |
| Production | 0 (0.0%) | 0 (0.0%) |
| Transportation | 0 (0.0%) | 0 (0.0%) |
| Material Moving | 0 (0.0%) | 0 (0.0%) |
| Total (Category) | 0 (0.0%) | 0 (0.0%) |
| Total (Overall) | 95 (47.5%) | 105 (52.5%) |
Employment Industries by Sex in Suissevale
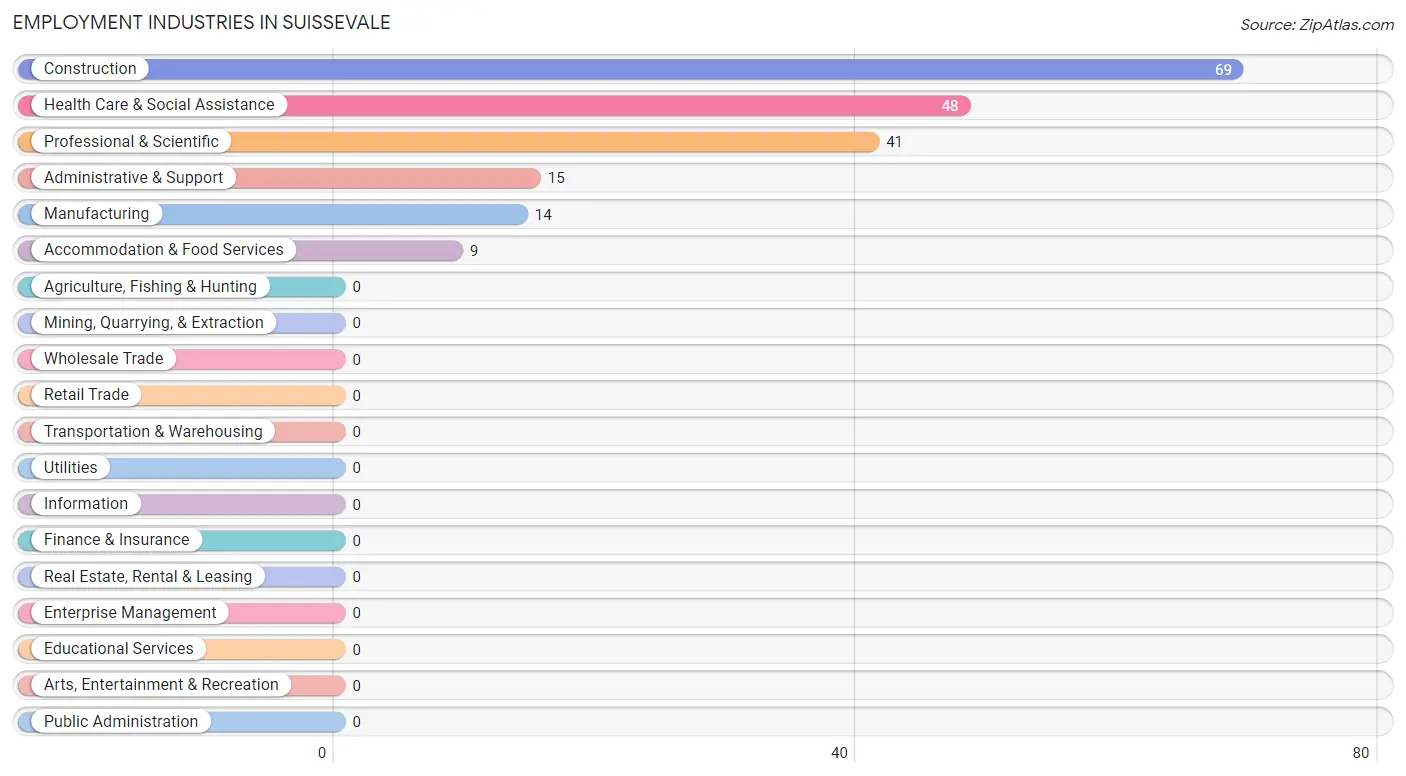
Employment Industries in Suissevale
The major employment industries in Suissevale include Construction (69 | 34.5%), Health Care & Social Assistance (48 | 24.0%), Professional & Scientific (41 | 20.5%), Administrative & Support (15 | 7.5%), and Manufacturing (14 | 7.0%).
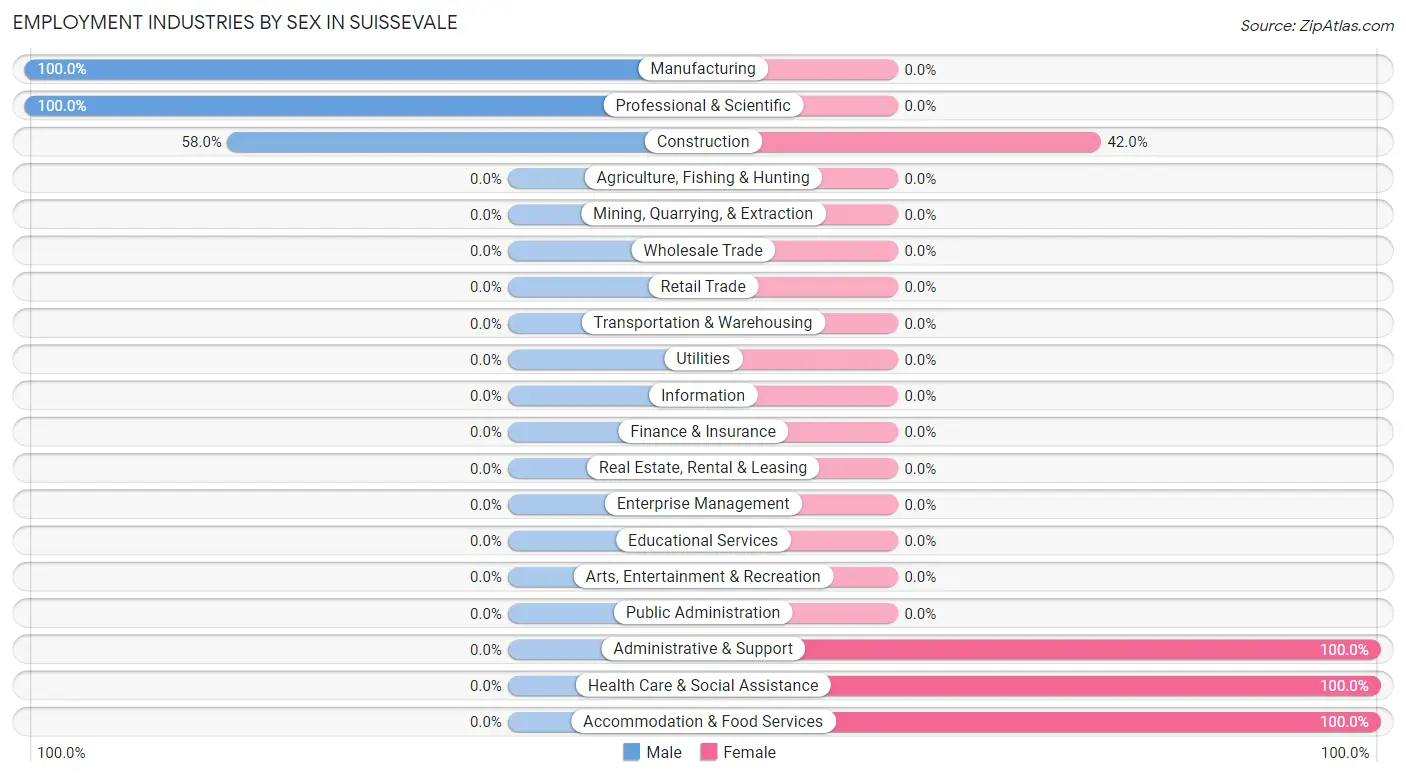
Employment Industries by Sex in Suissevale
The Suissevale industries that see more men than women are Manufacturing (100.0%), Professional & Scientific (100.0%), and Construction (58.0%), whereas the industries that tend to have a higher number of women are Administrative & Support (100.0%), Health Care & Social Assistance (100.0%), and Accommodation & Food Services (100.0%).
| Industry | Male | Female |
| Agriculture, Fishing & Hunting | 0 (0.0%) | 0 (0.0%) |
| Mining, Quarrying, & Extraction | 0 (0.0%) | 0 (0.0%) |
| Construction | 40 (58.0%) | 29 (42.0%) |
| Manufacturing | 14 (100.0%) | 0 (0.0%) |
| Wholesale Trade | 0 (0.0%) | 0 (0.0%) |
| Retail Trade | 0 (0.0%) | 0 (0.0%) |
| Transportation & Warehousing | 0 (0.0%) | 0 (0.0%) |
| Utilities | 0 (0.0%) | 0 (0.0%) |
| Information | 0 (0.0%) | 0 (0.0%) |
| Finance & Insurance | 0 (0.0%) | 0 (0.0%) |
| Real Estate, Rental & Leasing | 0 (0.0%) | 0 (0.0%) |
| Professional & Scientific | 41 (100.0%) | 0 (0.0%) |
| Enterprise Management | 0 (0.0%) | 0 (0.0%) |
| Administrative & Support | 0 (0.0%) | 15 (100.0%) |
| Educational Services | 0 (0.0%) | 0 (0.0%) |
| Health Care & Social Assistance | 0 (0.0%) | 48 (100.0%) |
| Arts, Entertainment & Recreation | 0 (0.0%) | 0 (0.0%) |
| Accommodation & Food Services | 0 (0.0%) | 9 (100.0%) |
| Public Administration | 0 (0.0%) | 0 (0.0%) |
| Total | 95 (47.5%) | 105 (52.5%) |
Education in Suissevale
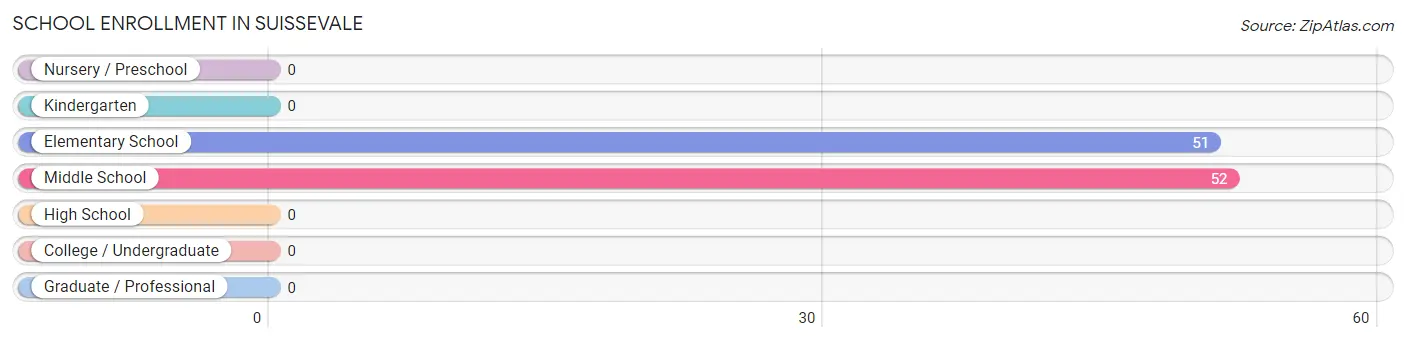
School Enrollment in Suissevale
The most common levels of schooling among the 103 students in Suissevale are middle school (52 | 50.5%), and elementary school (51 | 49.5%).
| School Level | # Students | % Students |
| Nursery / Preschool | 0 | 0.0% |
| Kindergarten | 0 | 0.0% |
| Elementary School | 51 | 49.5% |
| Middle School | 52 | 50.5% |
| High School | 0 | 0.0% |
| College / Undergraduate | 0 | 0.0% |
| Graduate / Professional | 0 | 0.0% |
| Total | 103 | 100.0% |
School Enrollment by Age by Funding Source in Suissevale
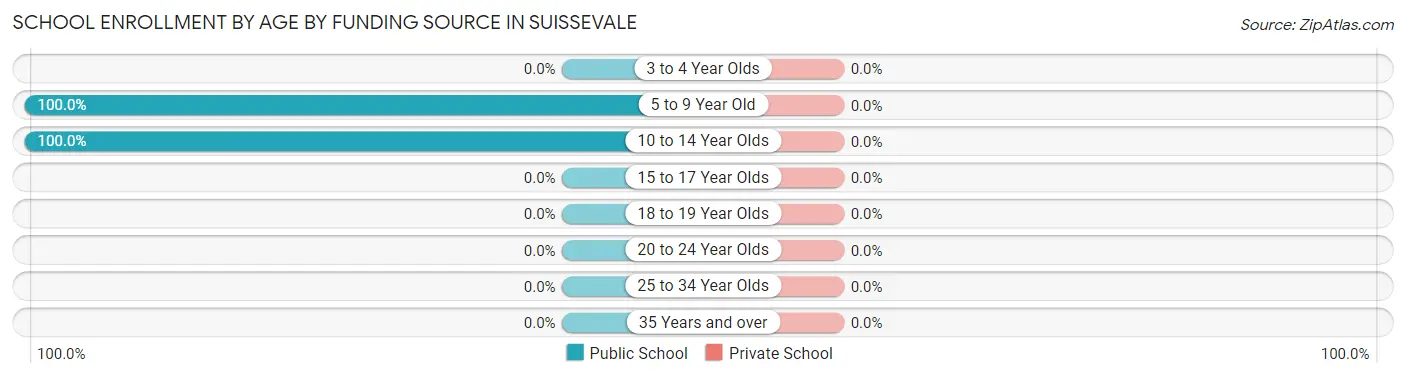
| Age Bracket | Public School | Private School |
| 3 to 4 Year Olds | 0 (0.0%) | 0 (0.0%) |
| 5 to 9 Year Old | 51 (100.0%) | 0 (0.0%) |
| 10 to 14 Year Olds | 52 (100.0%) | 0 (0.0%) |
| 15 to 17 Year Olds | 0 (0.0%) | 0 (0.0%) |
| 18 to 19 Year Olds | 0 (0.0%) | 0 (0.0%) |
| 20 to 24 Year Olds | 0 (0.0%) | 0 (0.0%) |
| 25 to 34 Year Olds | 0 (0.0%) | 0 (0.0%) |
| 35 Years and over | 0 (0.0%) | 0 (0.0%) |
| Total | 103 (100.0%) | 0 (0.0%) |
Educational Attainment by Field of Study in Suissevale
Business (37 | 56.1%), social sciences (10 | 15.1%), literature & languages (10 | 15.1%), and engineering (9 | 13.6%) are the most common fields of study among 66 individuals in Suissevale who have obtained a bachelor's degree or higher.
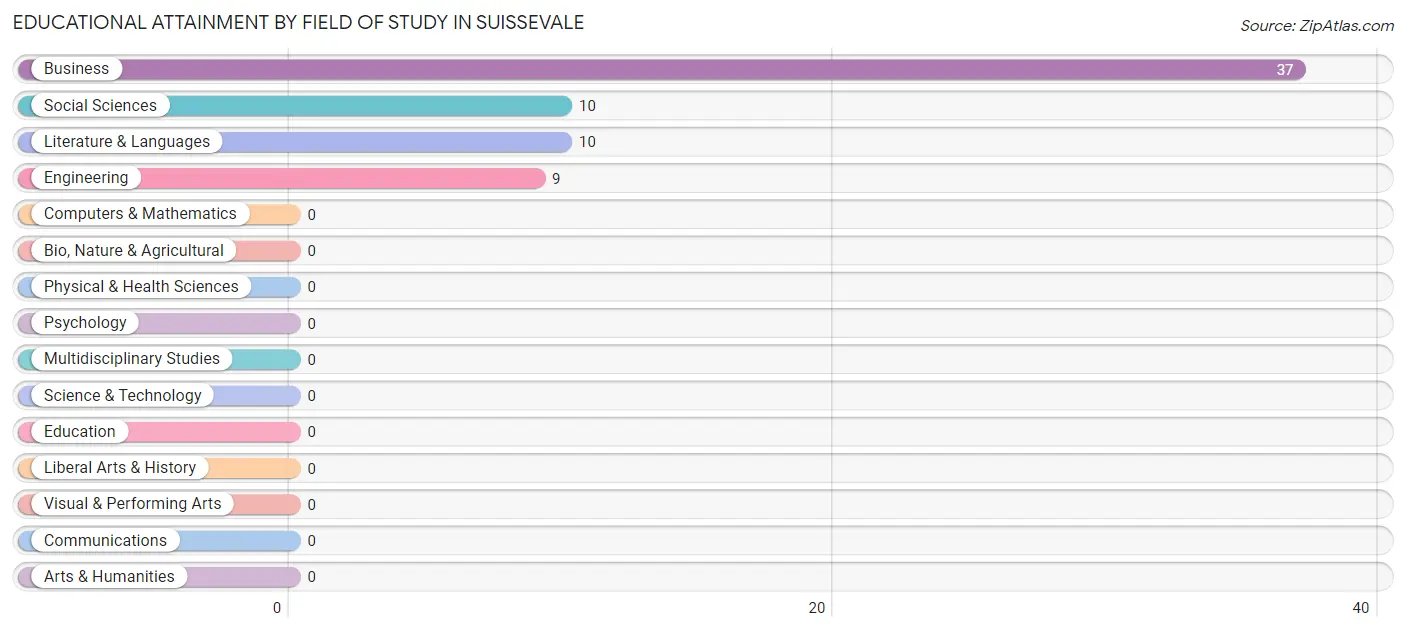
| Field of Study | # Graduates | % Graduates |
| Computers & Mathematics | 0 | 0.0% |
| Bio, Nature & Agricultural | 0 | 0.0% |
| Physical & Health Sciences | 0 | 0.0% |
| Psychology | 0 | 0.0% |
| Social Sciences | 10 | 15.1% |
| Engineering | 9 | 13.6% |
| Multidisciplinary Studies | 0 | 0.0% |
| Science & Technology | 0 | 0.0% |
| Business | 37 | 56.1% |
| Education | 0 | 0.0% |
| Literature & Languages | 10 | 15.1% |
| Liberal Arts & History | 0 | 0.0% |
| Visual & Performing Arts | 0 | 0.0% |
| Communications | 0 | 0.0% |
| Arts & Humanities | 0 | 0.0% |
| Total | 66 | 100.0% |
Transportation & Commute in Suissevale
Vehicle Availability by Sex in Suissevale
The most prevalent vehicle ownership categories in Suissevale are males with 2 vehicles (87, accounting for 91.6%) and females with 2 vehicles (64, making up 82.9%).
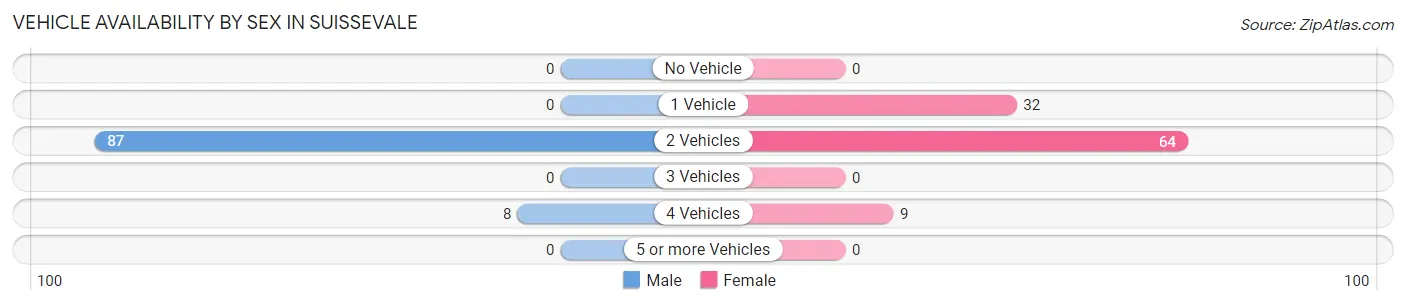
| Vehicles Available | Male | Female |
| No Vehicle | 0 (0.0%) | 0 (0.0%) |
| 1 Vehicle | 0 (0.0%) | 32 (30.5%) |
| 2 Vehicles | 87 (91.6%) | 64 (61.0%) |
| 3 Vehicles | 0 (0.0%) | 0 (0.0%) |
| 4 Vehicles | 8 (8.4%) | 9 (8.6%) |
| 5 or more Vehicles | 0 (0.0%) | 0 (0.0%) |
| Total | 95 (100.0%) | 105 (100.0%) |
Commute Time in Suissevale
The most frequently occuring commute durations in Suissevale are 25 to 29 minutes (45 commuters, 31.0%), less than 5 minutes (32 commuters, 22.1%), and 40 to 44 minutes (29 commuters, 20.0%).
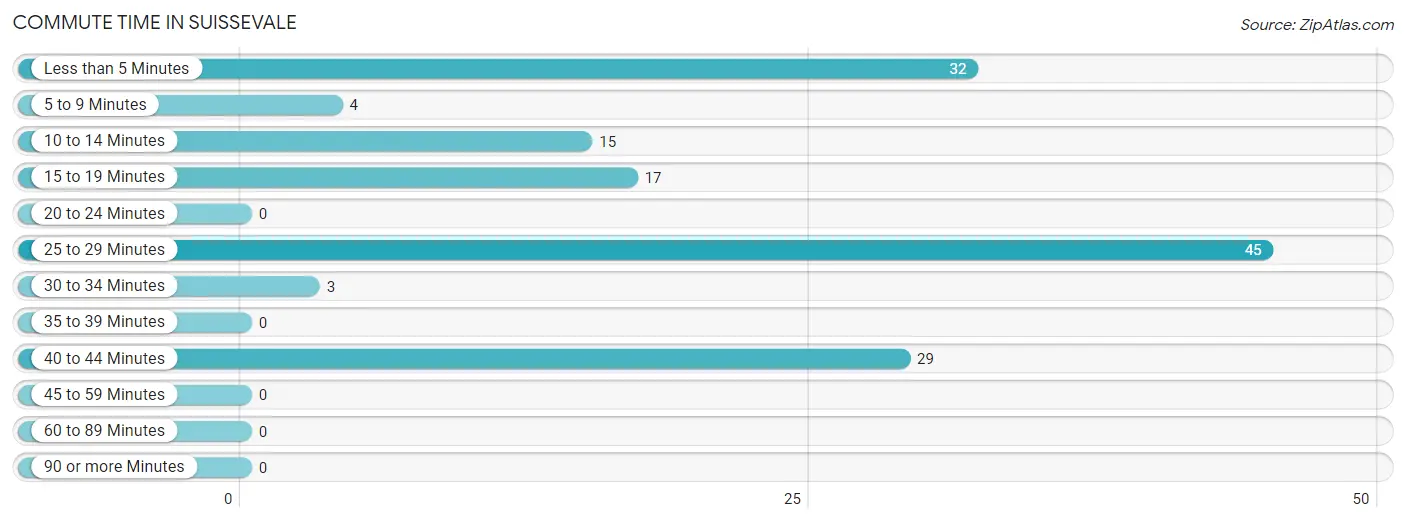
| Commute Time | # Commuters | % Commuters |
| Less than 5 Minutes | 32 | 22.1% |
| 5 to 9 Minutes | 4 | 2.8% |
| 10 to 14 Minutes | 15 | 10.3% |
| 15 to 19 Minutes | 17 | 11.7% |
| 20 to 24 Minutes | 0 | 0.0% |
| 25 to 29 Minutes | 45 | 31.0% |
| 30 to 34 Minutes | 3 | 2.1% |
| 35 to 39 Minutes | 0 | 0.0% |
| 40 to 44 Minutes | 29 | 20.0% |
| 45 to 59 Minutes | 0 | 0.0% |
| 60 to 89 Minutes | 0 | 0.0% |
| 90 or more Minutes | 0 | 0.0% |
Commute Time by Sex in Suissevale
The most common commute times in Suissevale are 40 to 44 minutes (29 commuters, 72.5%) for males and 25 to 29 minutes (45 commuters, 42.9%) for females.
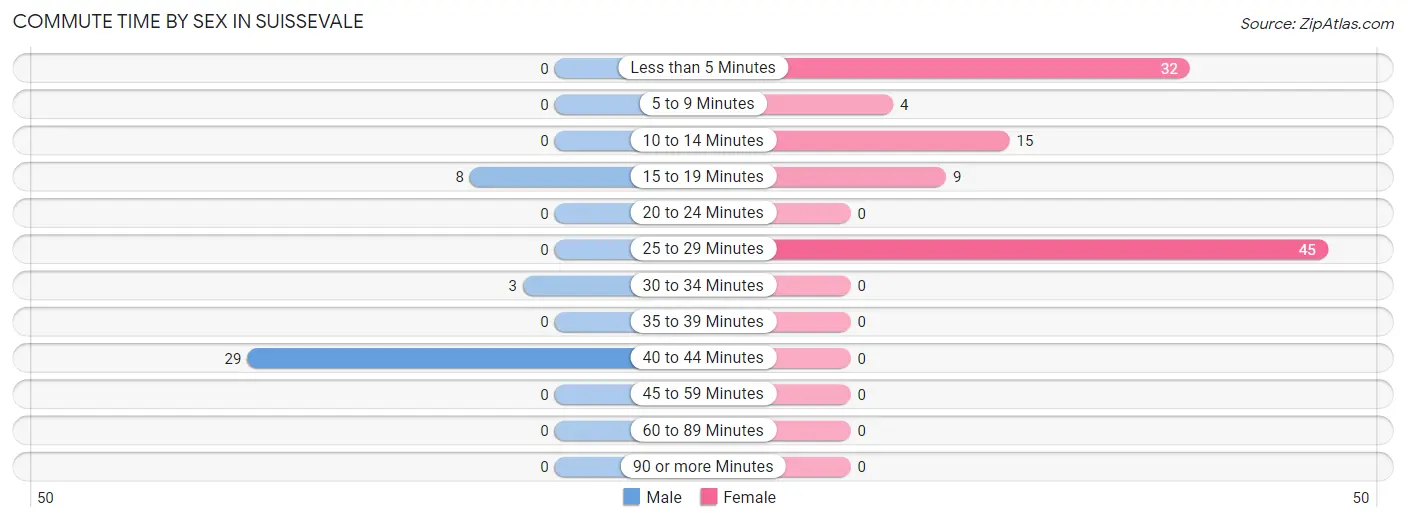
| Commute Time | Male | Female |
| Less than 5 Minutes | 0 (0.0%) | 32 (30.5%) |
| 5 to 9 Minutes | 0 (0.0%) | 4 (3.8%) |
| 10 to 14 Minutes | 0 (0.0%) | 15 (14.3%) |
| 15 to 19 Minutes | 8 (20.0%) | 9 (8.6%) |
| 20 to 24 Minutes | 0 (0.0%) | 0 (0.0%) |
| 25 to 29 Minutes | 0 (0.0%) | 45 (42.9%) |
| 30 to 34 Minutes | 3 (7.5%) | 0 (0.0%) |
| 35 to 39 Minutes | 0 (0.0%) | 0 (0.0%) |
| 40 to 44 Minutes | 29 (72.5%) | 0 (0.0%) |
| 45 to 59 Minutes | 0 (0.0%) | 0 (0.0%) |
| 60 to 89 Minutes | 0 (0.0%) | 0 (0.0%) |
| 90 or more Minutes | 0 (0.0%) | 0 (0.0%) |
Time of Departure to Work by Sex in Suissevale
The most frequent times of departure to work in Suissevale are 5:00 AM to 5:29 AM (32, 80.0%) for males and 6:30 AM to 6:59 AM (56, 53.3%) for females.
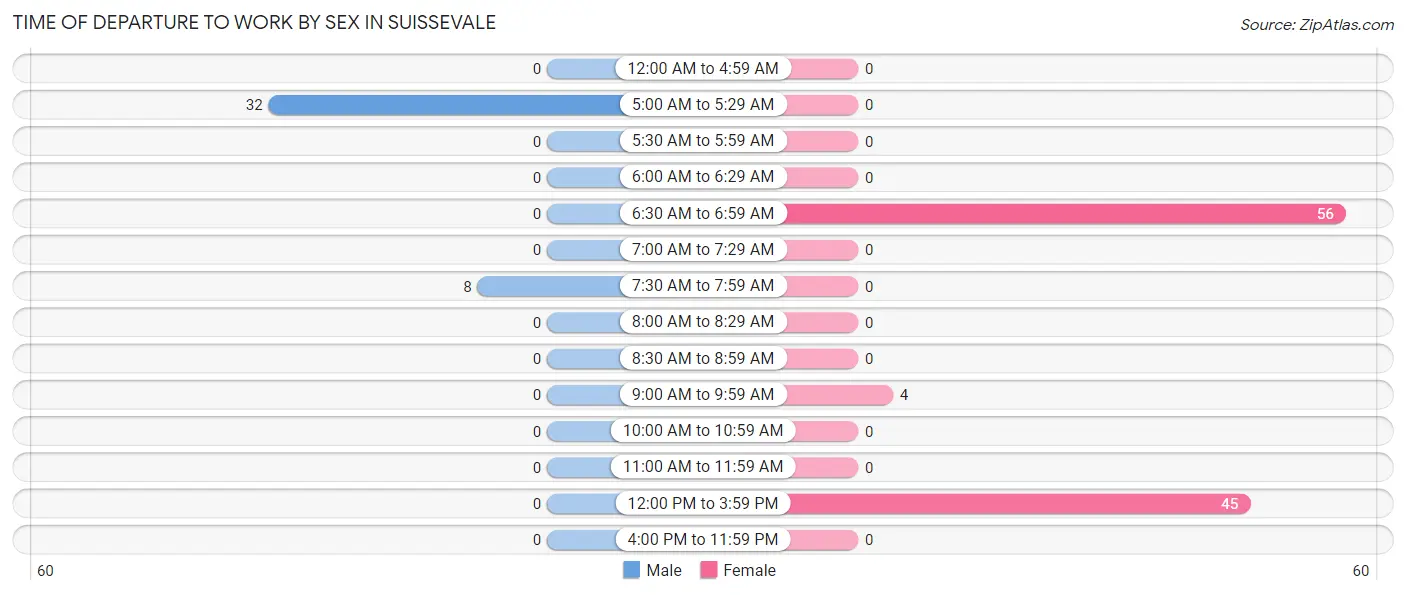
| Time of Departure | Male | Female |
| 12:00 AM to 4:59 AM | 0 (0.0%) | 0 (0.0%) |
| 5:00 AM to 5:29 AM | 32 (80.0%) | 0 (0.0%) |
| 5:30 AM to 5:59 AM | 0 (0.0%) | 0 (0.0%) |
| 6:00 AM to 6:29 AM | 0 (0.0%) | 0 (0.0%) |
| 6:30 AM to 6:59 AM | 0 (0.0%) | 56 (53.3%) |
| 7:00 AM to 7:29 AM | 0 (0.0%) | 0 (0.0%) |
| 7:30 AM to 7:59 AM | 8 (20.0%) | 0 (0.0%) |
| 8:00 AM to 8:29 AM | 0 (0.0%) | 0 (0.0%) |
| 8:30 AM to 8:59 AM | 0 (0.0%) | 0 (0.0%) |
| 9:00 AM to 9:59 AM | 0 (0.0%) | 4 (3.8%) |
| 10:00 AM to 10:59 AM | 0 (0.0%) | 0 (0.0%) |
| 11:00 AM to 11:59 AM | 0 (0.0%) | 0 (0.0%) |
| 12:00 PM to 3:59 PM | 0 (0.0%) | 45 (42.9%) |
| 4:00 PM to 11:59 PM | 0 (0.0%) | 0 (0.0%) |
| Total | 40 (100.0%) | 105 (100.0%) |
Housing Occupancy in Suissevale
Occupancy by Ownership in Suissevale
Of the total 175 dwellings in Suissevale, owner-occupied units account for 146 (83.4%), while renter-occupied units make up 29 (16.6%).
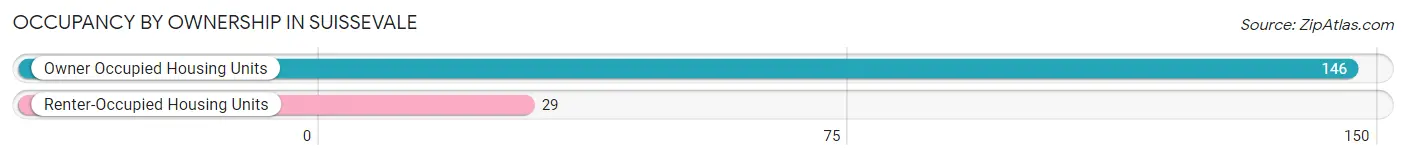
| Occupancy | # Housing Units | % Housing Units |
| Owner Occupied Housing Units | 146 | 83.4% |
| Renter-Occupied Housing Units | 29 | 16.6% |
| Total Occupied Housing Units | 175 | 100.0% |
Occupancy by Household Size in Suissevale
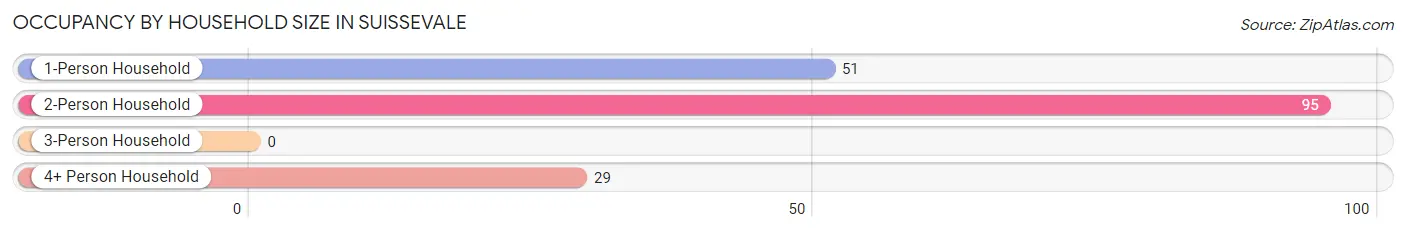
| Household Size | # Housing Units | % Housing Units |
| 1-Person Household | 51 | 29.1% |
| 2-Person Household | 95 | 54.3% |
| 3-Person Household | 0 | 0.0% |
| 4+ Person Household | 29 | 16.6% |
| Total Housing Units | 175 | 100.0% |
Occupancy by Ownership by Household Size in Suissevale
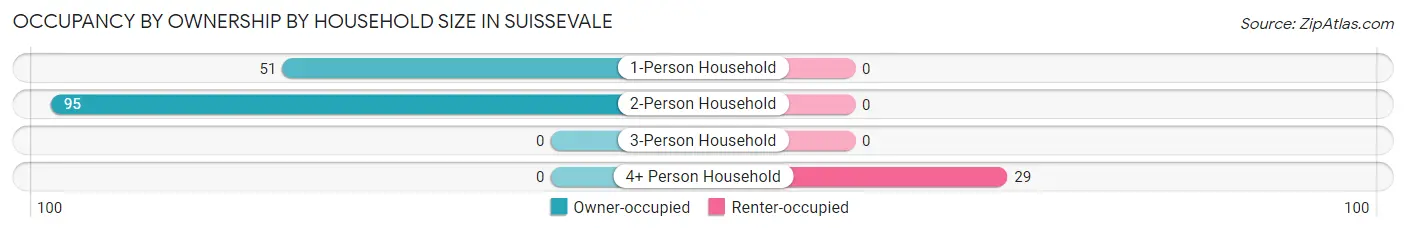
| Household Size | Owner-occupied | Renter-occupied |
| 1-Person Household | 51 (100.0%) | 0 (0.0%) |
| 2-Person Household | 95 (100.0%) | 0 (0.0%) |
| 3-Person Household | 0 (0.0%) | 0 (0.0%) |
| 4+ Person Household | 0 (0.0%) | 29 (100.0%) |
| Total Housing Units | 146 (83.4%) | 29 (16.6%) |
Occupancy by Educational Attainment in Suissevale
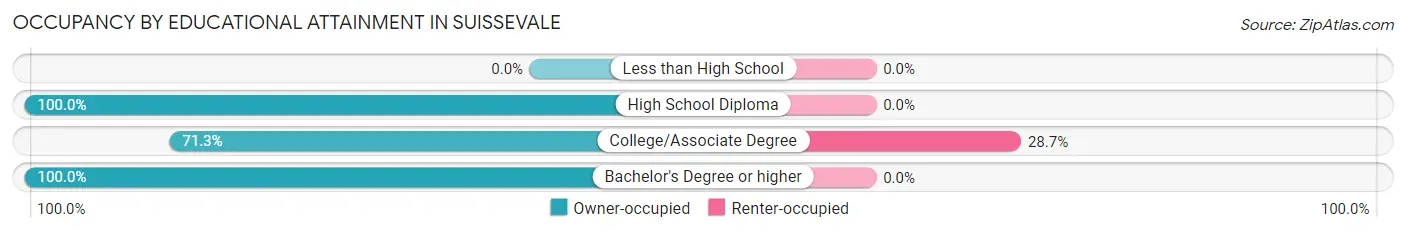
| Household Size | Owner-occupied | Renter-occupied |
| Less than High School | 0 (0.0%) | 0 (0.0%) |
| High School Diploma | 52 (100.0%) | 0 (0.0%) |
| College/Associate Degree | 72 (71.3%) | 29 (28.7%) |
| Bachelor's Degree or higher | 22 (100.0%) | 0 (0.0%) |
Occupancy by Age of Householder in Suissevale
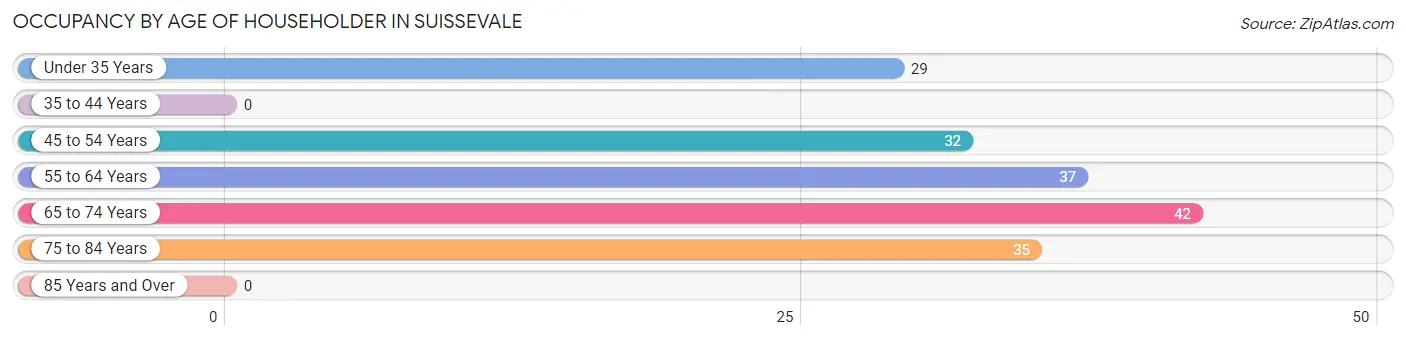
| Age Bracket | # Households | % Households |
| Under 35 Years | 29 | 16.6% |
| 35 to 44 Years | 0 | 0.0% |
| 45 to 54 Years | 32 | 18.3% |
| 55 to 64 Years | 37 | 21.1% |
| 65 to 74 Years | 42 | 24.0% |
| 75 to 84 Years | 35 | 20.0% |
| 85 Years and Over | 0 | 0.0% |
| Total | 175 | 100.0% |
Housing Finances in Suissevale
Median Income by Occupancy in Suissevale
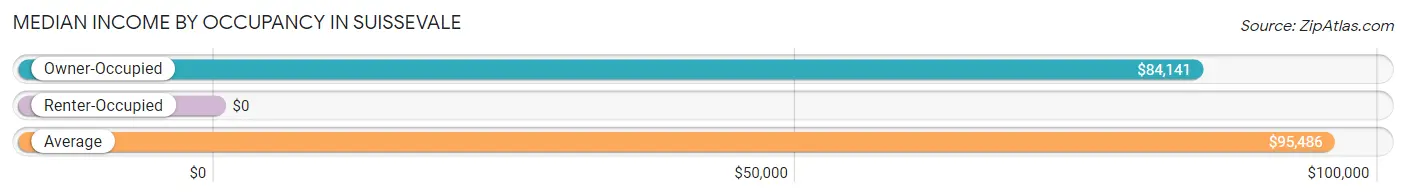
| Occupancy Type | # Households | Median Income |
| Owner-Occupied | 146 (83.4%) | $84,141 |
| Renter-Occupied | 29 (16.6%) | $0 |
| Average | 175 (100.0%) | $95,486 |
Occupancy by Householder Income Bracket in Suissevale
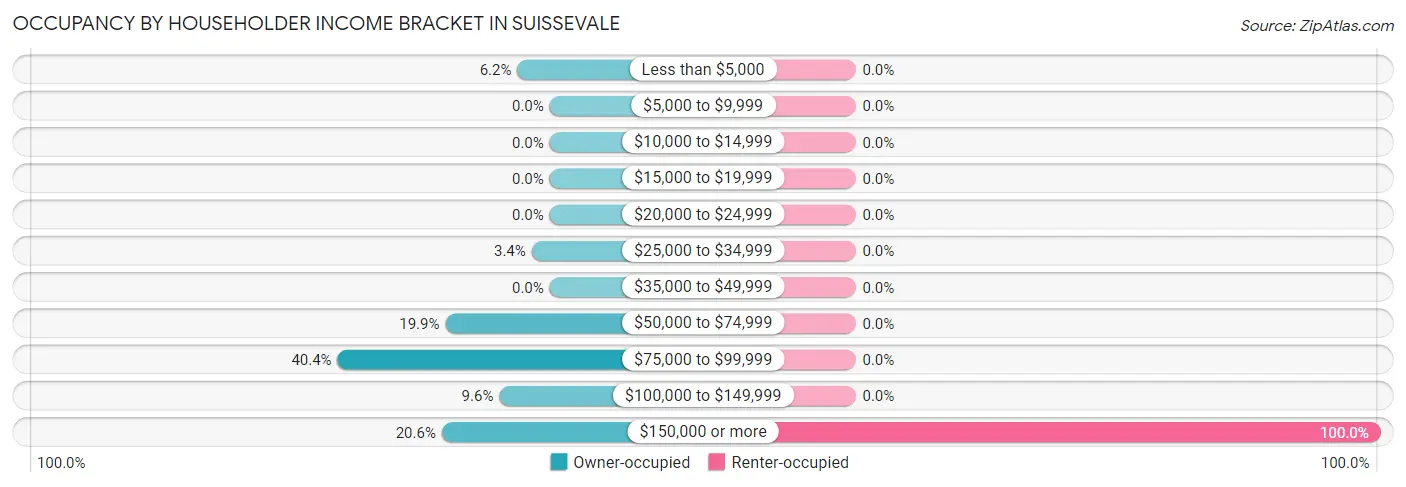
| Income Bracket | Owner-occupied | Renter-occupied |
| Less than $5,000 | 9 (6.2%) | 0 (0.0%) |
| $5,000 to $9,999 | 0 (0.0%) | 0 (0.0%) |
| $10,000 to $14,999 | 0 (0.0%) | 0 (0.0%) |
| $15,000 to $19,999 | 0 (0.0%) | 0 (0.0%) |
| $20,000 to $24,999 | 0 (0.0%) | 0 (0.0%) |
| $25,000 to $34,999 | 5 (3.4%) | 0 (0.0%) |
| $35,000 to $49,999 | 0 (0.0%) | 0 (0.0%) |
| $50,000 to $74,999 | 29 (19.9%) | 0 (0.0%) |
| $75,000 to $99,999 | 59 (40.4%) | 0 (0.0%) |
| $100,000 to $149,999 | 14 (9.6%) | 0 (0.0%) |
| $150,000 or more | 30 (20.5%) | 29 (100.0%) |
| Total | 146 (100.0%) | 29 (100.0%) |
Monthly Housing Cost Tiers in Suissevale
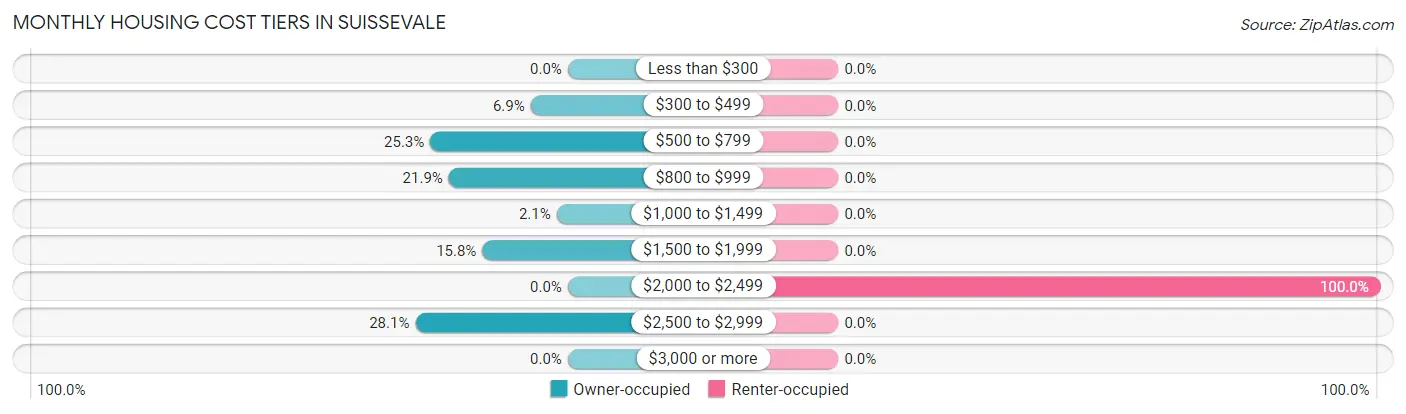
| Monthly Cost | Owner-occupied | Renter-occupied |
| Less than $300 | 0 (0.0%) | 0 (0.0%) |
| $300 to $499 | 10 (6.9%) | 0 (0.0%) |
| $500 to $799 | 37 (25.3%) | 0 (0.0%) |
| $800 to $999 | 32 (21.9%) | 0 (0.0%) |
| $1,000 to $1,499 | 3 (2.1%) | 0 (0.0%) |
| $1,500 to $1,999 | 23 (15.8%) | 0 (0.0%) |
| $2,000 to $2,499 | 0 (0.0%) | 29 (100.0%) |
| $2,500 to $2,999 | 41 (28.1%) | 0 (0.0%) |
| $3,000 or more | 0 (0.0%) | 0 (0.0%) |
| Total | 146 (100.0%) | 29 (100.0%) |
Physical Housing Characteristics in Suissevale
Housing Structures in Suissevale
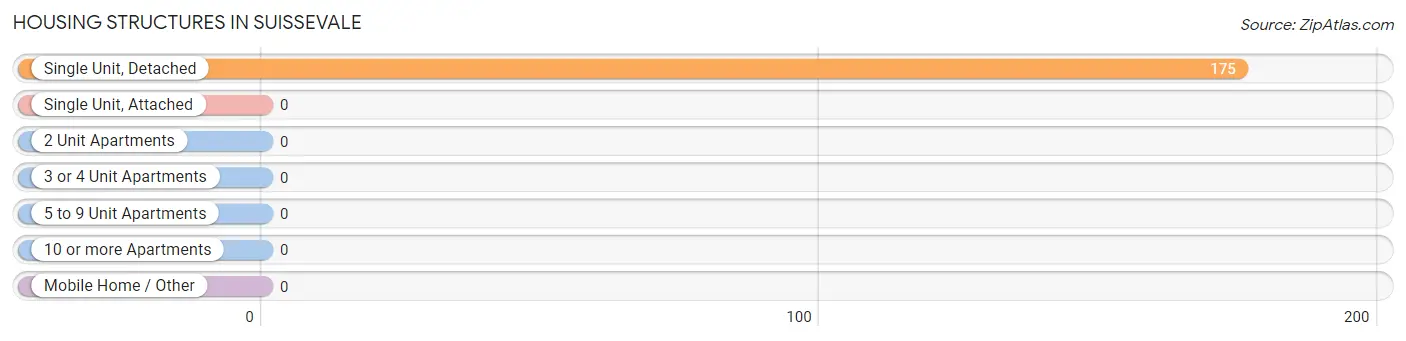
| Structure Type | # Housing Units | % Housing Units |
| Single Unit, Detached | 175 | 100.0% |
| Single Unit, Attached | 0 | 0.0% |
| 2 Unit Apartments | 0 | 0.0% |
| 3 or 4 Unit Apartments | 0 | 0.0% |
| 5 to 9 Unit Apartments | 0 | 0.0% |
| 10 or more Apartments | 0 | 0.0% |
| Mobile Home / Other | 0 | 0.0% |
| Total | 175 | 100.0% |
Housing Structures by Occupancy in Suissevale
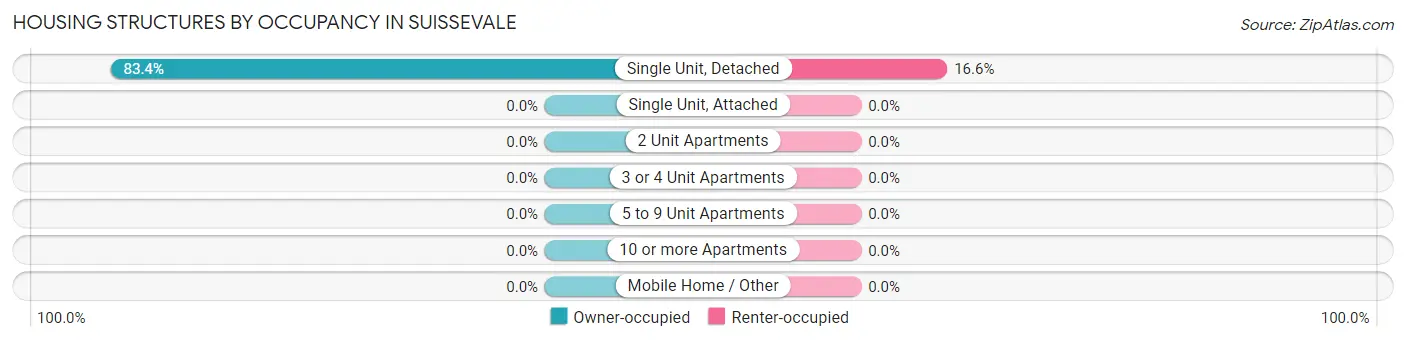
| Structure Type | Owner-occupied | Renter-occupied |
| Single Unit, Detached | 146 (83.4%) | 29 (16.6%) |
| Single Unit, Attached | 0 (0.0%) | 0 (0.0%) |
| 2 Unit Apartments | 0 (0.0%) | 0 (0.0%) |
| 3 or 4 Unit Apartments | 0 (0.0%) | 0 (0.0%) |
| 5 to 9 Unit Apartments | 0 (0.0%) | 0 (0.0%) |
| 10 or more Apartments | 0 (0.0%) | 0 (0.0%) |
| Mobile Home / Other | 0 (0.0%) | 0 (0.0%) |
| Total | 146 (83.4%) | 29 (16.6%) |
Housing Structures by Number of Rooms in Suissevale
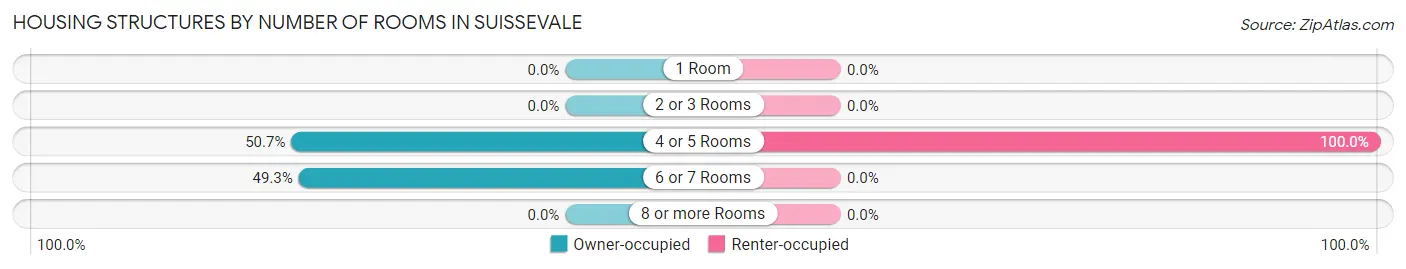
| Number of Rooms | Owner-occupied | Renter-occupied |
| 1 Room | 0 (0.0%) | 0 (0.0%) |
| 2 or 3 Rooms | 0 (0.0%) | 0 (0.0%) |
| 4 or 5 Rooms | 74 (50.7%) | 29 (100.0%) |
| 6 or 7 Rooms | 72 (49.3%) | 0 (0.0%) |
| 8 or more Rooms | 0 (0.0%) | 0 (0.0%) |
| Total | 146 (100.0%) | 29 (100.0%) |
Housing Structure by Heating Type in Suissevale
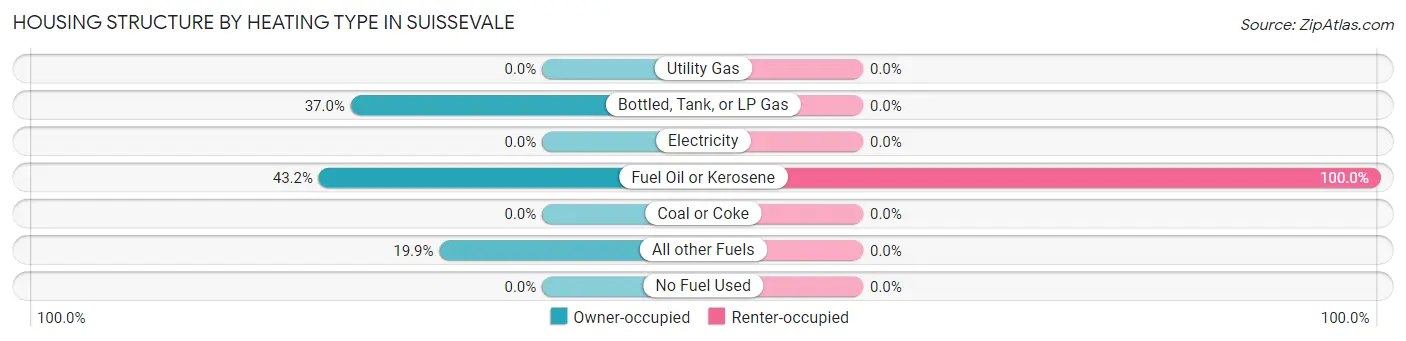
| Heating Type | Owner-occupied | Renter-occupied |
| Utility Gas | 0 (0.0%) | 0 (0.0%) |
| Bottled, Tank, or LP Gas | 54 (37.0%) | 0 (0.0%) |
| Electricity | 0 (0.0%) | 0 (0.0%) |
| Fuel Oil or Kerosene | 63 (43.1%) | 29 (100.0%) |
| Coal or Coke | 0 (0.0%) | 0 (0.0%) |
| All other Fuels | 29 (19.9%) | 0 (0.0%) |
| No Fuel Used | 0 (0.0%) | 0 (0.0%) |
| Total | 146 (100.0%) | 29 (100.0%) |
Household Vehicle Usage in Suissevale
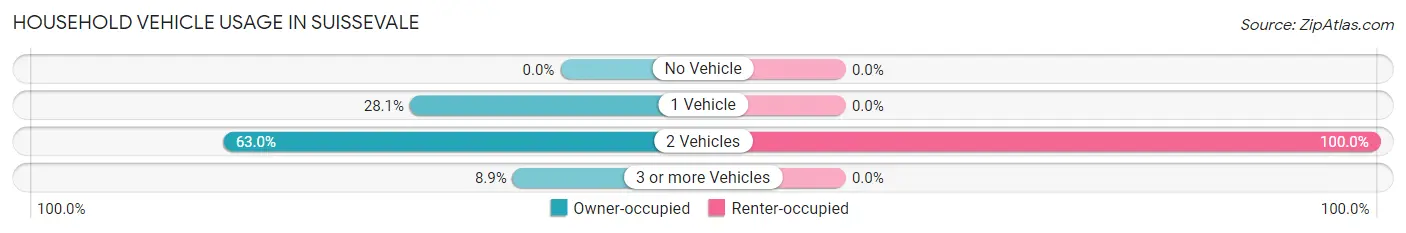
| Vehicles per Household | Owner-occupied | Renter-occupied |
| No Vehicle | 0 (0.0%) | 0 (0.0%) |
| 1 Vehicle | 41 (28.1%) | 0 (0.0%) |
| 2 Vehicles | 92 (63.0%) | 29 (100.0%) |
| 3 or more Vehicles | 13 (8.9%) | 0 (0.0%) |
| Total | 146 (100.0%) | 29 (100.0%) |
Real Estate & Mortgages in Suissevale
Real Estate and Mortgage Overview in Suissevale
| Characteristic | Without Mortgage | With Mortgage |
| Housing Units | 32 | 114 |
| Median Property Value | $240,000 | $282,900 |
| Median Household Income | $95,278 | $30 |
| Monthly Housing Costs | $567 | $0 |
| Real Estate Taxes | $2,696 | $0 |
Property Value by Mortgage Status in Suissevale
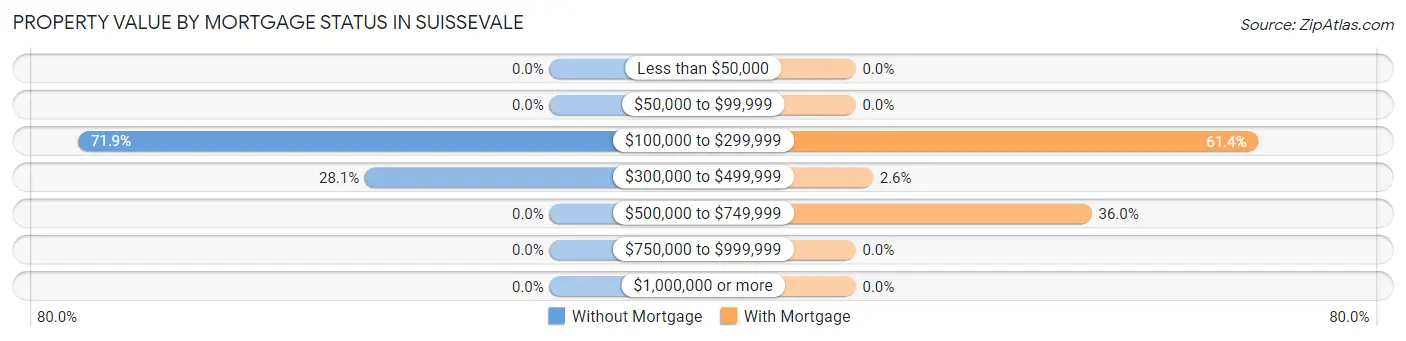
| Property Value | Without Mortgage | With Mortgage |
| Less than $50,000 | 0 (0.0%) | 0 (0.0%) |
| $50,000 to $99,999 | 0 (0.0%) | 0 (0.0%) |
| $100,000 to $299,999 | 23 (71.9%) | 70 (61.4%) |
| $300,000 to $499,999 | 9 (28.1%) | 3 (2.6%) |
| $500,000 to $749,999 | 0 (0.0%) | 41 (36.0%) |
| $750,000 to $999,999 | 0 (0.0%) | 0 (0.0%) |
| $1,000,000 or more | 0 (0.0%) | 0 (0.0%) |
| Total | 32 (100.0%) | 114 (100.0%) |
Household Income by Mortgage Status in Suissevale
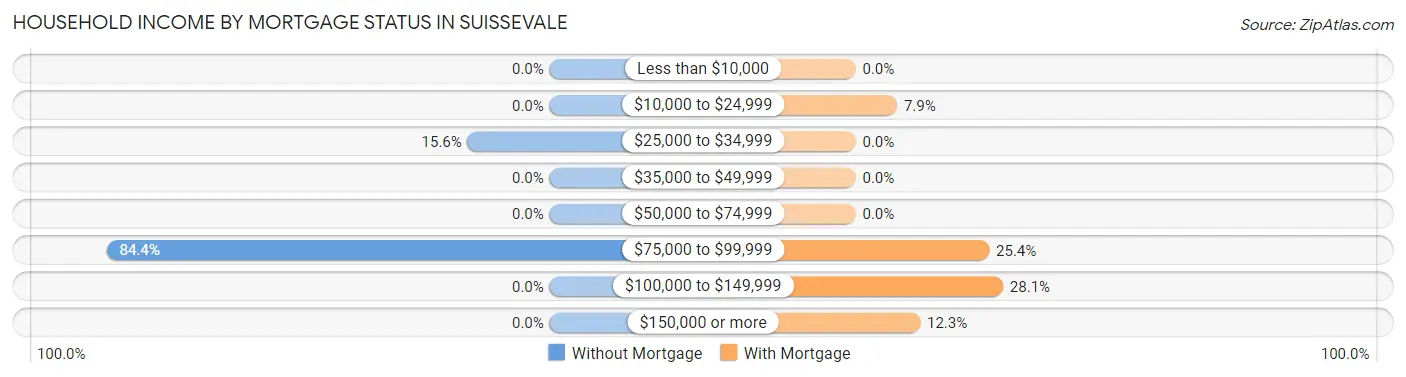
| Household Income | Without Mortgage | With Mortgage |
| Less than $10,000 | 0 (0.0%) | 0 (0.0%) |
| $10,000 to $24,999 | 0 (0.0%) | 9 (7.9%) |
| $25,000 to $34,999 | 5 (15.6%) | 0 (0.0%) |
| $35,000 to $49,999 | 0 (0.0%) | 0 (0.0%) |
| $50,000 to $74,999 | 0 (0.0%) | 0 (0.0%) |
| $75,000 to $99,999 | 27 (84.4%) | 29 (25.4%) |
| $100,000 to $149,999 | 0 (0.0%) | 32 (28.1%) |
| $150,000 or more | 0 (0.0%) | 14 (12.3%) |
| Total | 32 (100.0%) | 114 (100.0%) |
Property Value to Household Income Ratio in Suissevale
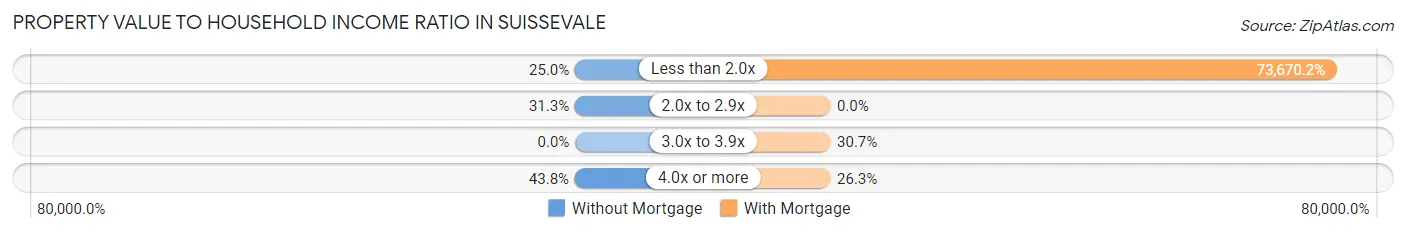
| Value-to-Income Ratio | Without Mortgage | With Mortgage |
| Less than 2.0x | 8 (25.0%) | 83,984 (73,670.2%) |
| 2.0x to 2.9x | 10 (31.2%) | 0 (0.0%) |
| 3.0x to 3.9x | 0 (0.0%) | 35 (30.7%) |
| 4.0x or more | 14 (43.8%) | 30 (26.3%) |
| Total | 32 (100.0%) | 114 (100.0%) |
Real Estate Taxes by Mortgage Status in Suissevale
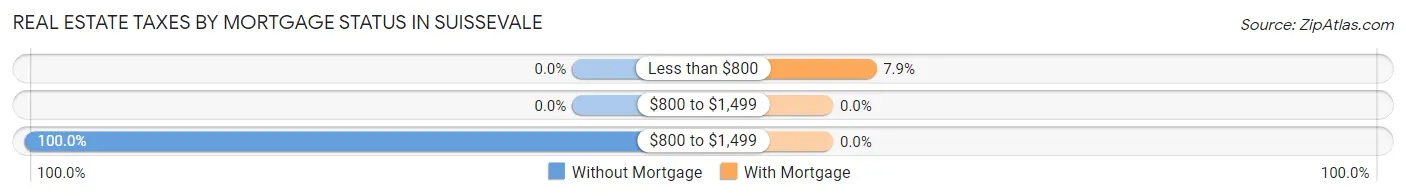
| Property Taxes | Without Mortgage | With Mortgage |
| Less than $800 | 0 (0.0%) | 9 (7.9%) |
| $800 to $1,499 | 0 (0.0%) | 0 (0.0%) |
| $800 to $1,499 | 32 (100.0%) | 0 (0.0%) |
| Total | 32 (100.0%) | 114 (100.0%) |
Health & Disability in Suissevale
Health Insurance Coverage by Age in Suissevale
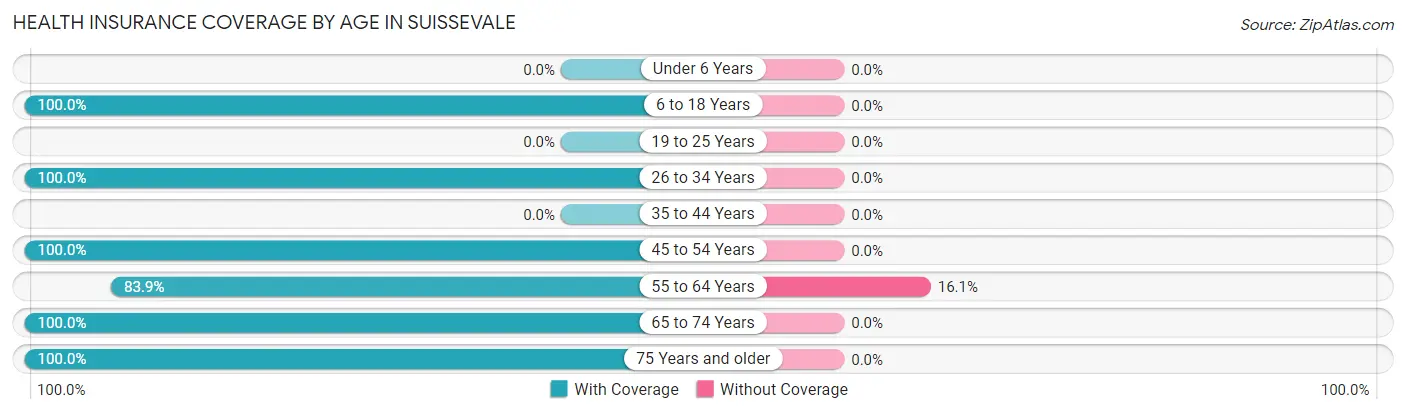
| Age Bracket | With Coverage | Without Coverage |
| Under 6 Years | 0 (0.0%) | 0 (0.0%) |
| 6 to 18 Years | 103 (100.0%) | 0 (0.0%) |
| 19 to 25 Years | 0 (0.0%) | 0 (0.0%) |
| 26 to 34 Years | 58 (100.0%) | 0 (0.0%) |
| 35 to 44 Years | 0 (0.0%) | 0 (0.0%) |
| 45 to 54 Years | 32 (100.0%) | 0 (0.0%) |
| 55 to 64 Years | 78 (83.9%) | 15 (16.1%) |
| 65 to 74 Years | 80 (100.0%) | 0 (0.0%) |
| 75 Years and older | 40 (100.0%) | 0 (0.0%) |
| Total | 391 (96.3%) | 15 (3.7%) |
Health Insurance Coverage by Citizenship Status in Suissevale
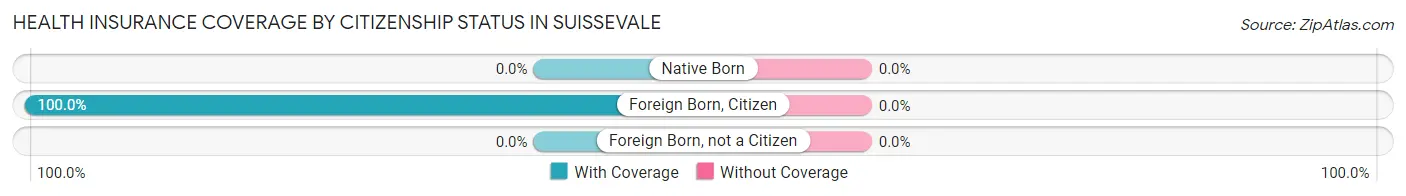
| Citizenship Status | With Coverage | Without Coverage |
| Native Born | 0 (0.0%) | 0 (0.0%) |
| Foreign Born, Citizen | 103 (100.0%) | 0 (0.0%) |
| Foreign Born, not a Citizen | 0 (0.0%) | 0 (0.0%) |
Health Insurance Coverage by Household Income in Suissevale
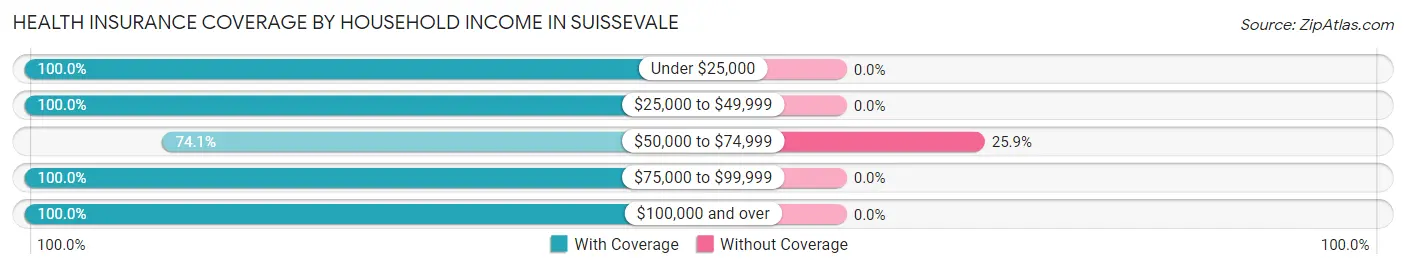
| Household Income | With Coverage | Without Coverage |
| Under $25,000 | 9 (100.0%) | 0 (0.0%) |
| $25,000 to $49,999 | 10 (100.0%) | 0 (0.0%) |
| $50,000 to $74,999 | 43 (74.1%) | 15 (25.9%) |
| $75,000 to $99,999 | 76 (100.0%) | 0 (0.0%) |
| $100,000 and over | 253 (100.0%) | 0 (0.0%) |
Public vs Private Health Insurance Coverage by Age in Suissevale
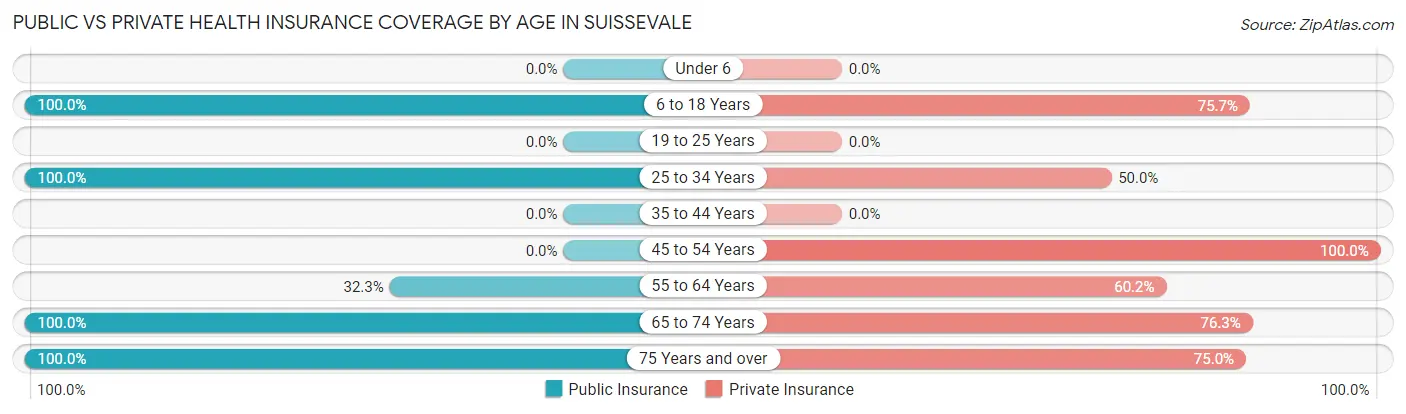
| Age Bracket | Public Insurance | Private Insurance |
| Under 6 | 0 (0.0%) | 0 (0.0%) |
| 6 to 18 Years | 103 (100.0%) | 78 (75.7%) |
| 19 to 25 Years | 0 (0.0%) | 0 (0.0%) |
| 25 to 34 Years | 58 (100.0%) | 29 (50.0%) |
| 35 to 44 Years | 0 (0.0%) | 0 (0.0%) |
| 45 to 54 Years | 0 (0.0%) | 32 (100.0%) |
| 55 to 64 Years | 30 (32.3%) | 56 (60.2%) |
| 65 to 74 Years | 80 (100.0%) | 61 (76.2%) |
| 75 Years and over | 40 (100.0%) | 30 (75.0%) |
| Total | 311 (76.6%) | 286 (70.4%) |
Disability Status by Sex by Age in Suissevale
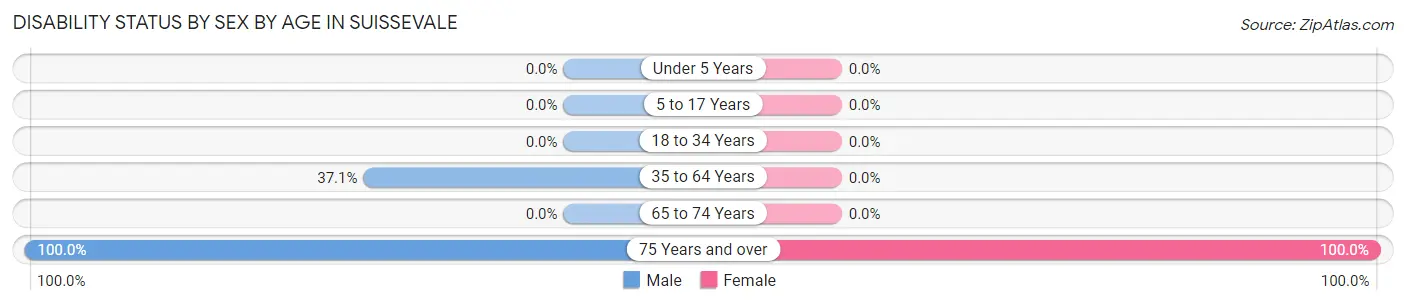
| Age Bracket | Male | Female |
| Under 5 Years | 0 (0.0%) | 0 (0.0%) |
| 5 to 17 Years | 0 (0.0%) | 0 (0.0%) |
| 18 to 34 Years | 0 (0.0%) | 0 (0.0%) |
| 35 to 64 Years | 13 (37.1%) | 0 (0.0%) |
| 65 to 74 Years | 0 (0.0%) | 0 (0.0%) |
| 75 Years and over | 35 (100.0%) | 5 (100.0%) |
Disability Class by Sex by Age in Suissevale
Disability Class: Hearing Difficulty
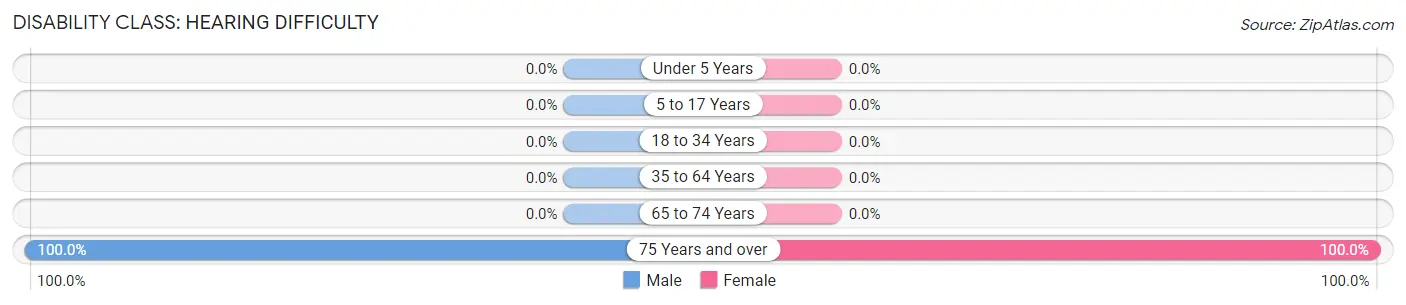
| Age Bracket | Male | Female |
| Under 5 Years | 0 (0.0%) | 0 (0.0%) |
| 5 to 17 Years | 0 (0.0%) | 0 (0.0%) |
| 18 to 34 Years | 0 (0.0%) | 0 (0.0%) |
| 35 to 64 Years | 0 (0.0%) | 0 (0.0%) |
| 65 to 74 Years | 0 (0.0%) | 0 (0.0%) |
| 75 Years and over | 35 (100.0%) | 5 (100.0%) |
Disability Class: Vision Difficulty
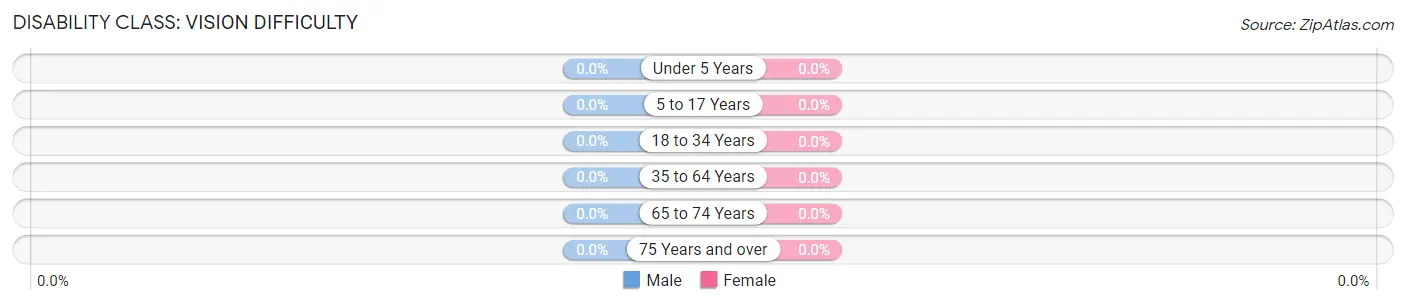
| Age Bracket | Male | Female |
| Under 5 Years | 0 (0.0%) | 0 (0.0%) |
| 5 to 17 Years | 0 (0.0%) | 0 (0.0%) |
| 18 to 34 Years | 0 (0.0%) | 0 (0.0%) |
| 35 to 64 Years | 0 (0.0%) | 0 (0.0%) |
| 65 to 74 Years | 0 (0.0%) | 0 (0.0%) |
| 75 Years and over | 0 (0.0%) | 0 (0.0%) |
Disability Class: Cognitive Difficulty
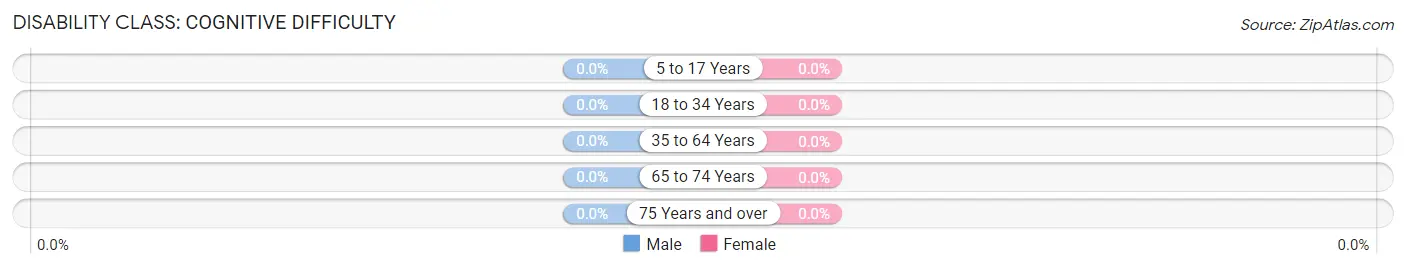
| Age Bracket | Male | Female |
| 5 to 17 Years | 0 (0.0%) | 0 (0.0%) |
| 18 to 34 Years | 0 (0.0%) | 0 (0.0%) |
| 35 to 64 Years | 0 (0.0%) | 0 (0.0%) |
| 65 to 74 Years | 0 (0.0%) | 0 (0.0%) |
| 75 Years and over | 0 (0.0%) | 0 (0.0%) |
Disability Class: Ambulatory Difficulty
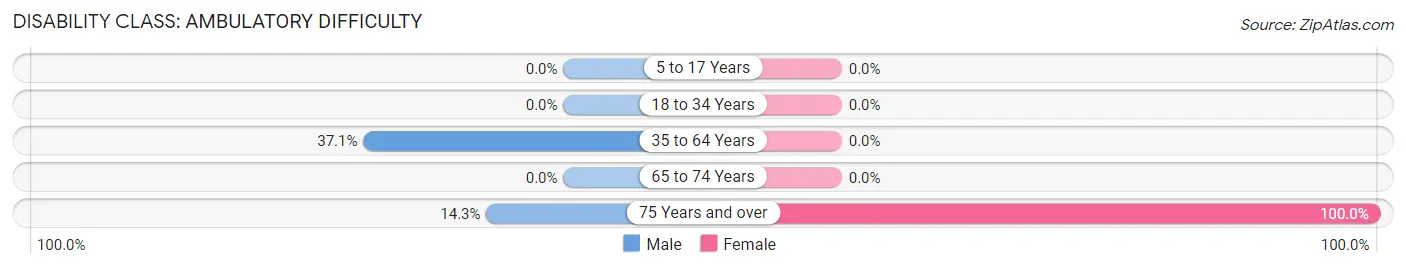
| Age Bracket | Male | Female |
| 5 to 17 Years | 0 (0.0%) | 0 (0.0%) |
| 18 to 34 Years | 0 (0.0%) | 0 (0.0%) |
| 35 to 64 Years | 13 (37.1%) | 0 (0.0%) |
| 65 to 74 Years | 0 (0.0%) | 0 (0.0%) |
| 75 Years and over | 5 (14.3%) | 5 (100.0%) |
Disability Class: Self-Care Difficulty
| Age Bracket | Male | Female |
| 5 to 17 Years | 0 (0.0%) | 0 (0.0%) |
| 18 to 34 Years | 0 (0.0%) | 0 (0.0%) |
| 35 to 64 Years | 0 (0.0%) | 0 (0.0%) |
| 65 to 74 Years | 0 (0.0%) | 0 (0.0%) |
| 75 Years and over | 0 (0.0%) | 0 (0.0%) |
Technology Access in Suissevale
Computing Device Access in Suissevale
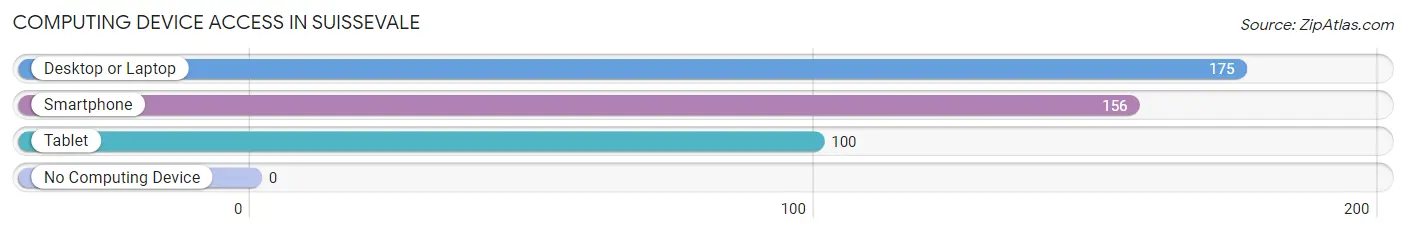
| Device Type | # Households | % Households |
| Desktop or Laptop | 175 | 100.0% |
| Smartphone | 156 | 89.1% |
| Tablet | 100 | 57.1% |
| No Computing Device | 0 | 0.0% |
| Total | 175 | 100.0% |
Internet Access in Suissevale

| Internet Type | # Households | % Households |
| Dial-Up Internet | 5 | 2.9% |
| Broadband Home | 156 | 89.1% |
| Cellular Data Only | 14 | 8.0% |
| Satellite Internet | 0 | 0.0% |
| No Internet | 0 | 0.0% |
| Total | 175 | 100.0% |
Suissevale Summary
Swissvale, New Hampshire is a small town located in the White Mountains region of New Hampshire. It is situated in the eastern part of the state, near the border with Maine. The town was originally settled in 1763 by Swiss immigrants, and was named after the Swiss city of Zurich. The town has a population of approximately 1,000 people, and is known for its picturesque mountain views and outdoor activities.
Geography
Swissvale is located in the White Mountains region of New Hampshire, in the eastern part of the state. It is situated in the foothills of the White Mountains, and is surrounded by the towns of Bartlett, Conway, and Madison. The town is located at an elevation of 1,400 feet, and is approximately 25 miles from the Maine border. The town is situated on the Saco River, and is home to several small lakes and ponds.
The town is primarily forested, with a mix of hardwood and softwood trees. The terrain is mostly hilly, with some flat areas. The town is home to several small mountains, including Mount Washington, which is the highest peak in the White Mountains.
Climate
Swissvale has a humid continental climate, with cold winters and warm summers. The average annual temperature is around 40 degrees Fahrenheit, with temperatures ranging from the low 20s in the winter to the mid-80s in the summer. The town receives an average of around 40 inches of precipitation per year, with most of it falling in the form of snow in the winter months.
Demographics
As of the 2010 census, the population of Swissvale was 1,000 people. The racial makeup of the town was 97.2% White, 0.7% African American, 0.3% Native American, 0.2% Asian, 0.1% Pacific Islander, and 1.5% from two or more races. The median household income was $45,000, and the median family income was $50,000.
Economy
The economy of Swissvale is largely based on tourism and outdoor recreation. The town is home to several ski resorts, including Attitash Mountain Resort and Wildcat Mountain Ski Area. The town is also home to several hiking trails, fishing spots, and other outdoor activities. The town is also home to several small businesses, including restaurants, shops, and lodging.
Swissvale is also home to several small farms, which produce a variety of fruits and vegetables. The town is also home to several small manufacturing companies, which produce a variety of products, including furniture, clothing, and electronics.
Conclusion
Swissvale, New Hampshire is a small town located in the White Mountains region of New Hampshire. It is situated in the eastern part of the state, near the border with Maine. The town was originally settled in 1763 by Swiss immigrants, and was named after the Swiss city of Zurich. The town has a population of approximately 1,000 people, and is known for its picturesque mountain views and outdoor activities. The economy of Swissvale is largely based on tourism and outdoor recreation, as well as small businesses and farms.
Common Questions
What is the Total Population of Suissevale?
Total Population of Suissevale is 406.
What is the Total Male Population of Suissevale?
Total Male Population of Suissevale is 190.
What is the Total Female Population of Suissevale?
Total Female Population of Suissevale is 216.
What is the Ratio of Males per 100 Females in Suissevale?
There are 87.96 Males per 100 Females in Suissevale.
What is the Ratio of Females per 100 Males in Suissevale?
There are 113.68 Females per 100 Males in Suissevale.
What is the Median Population Age in Suissevale?
Median Population Age in Suissevale is 56.1 Years.
What is the Average Family Size in Suissevale
Average Family Size in Suissevale is 2.9 People.
What is the Average Household Size in Suissevale
Average Household Size in Suissevale is 2.3 People.
What is Per Capita Income in Suissevale?
Per Capita income in Suissevale is $62,612.
What is the Median Family Income in Suissevale?
Median Family Income in Suissevale is $170,083.
What is the Median Household income in Suissevale?
Median Household Income in Suissevale is $95,486.
What is Inequality or Gini Index in Suissevale?
Inequality or Gini Index in Suissevale is 0.41.
How Large is the Labor Force in Suissevale?
There are 200 People in the Labor Forcein in Suissevale.
What is the Percentage of People in the Labor Force in Suissevale?
66.0% of People are in the Labor Force in Suissevale.