Virginia, NE
Virginia Map
Virginia Overview
62
TOTAL POPULATION
36
MALE POPULATION
26
FEMALE POPULATION
138.46
MALES / 100 FEMALES
72.22
FEMALES / 100 MALES
54.5
MEDIAN AGE
3.0
AVG FAMILY SIZE
1.8
AVG HOUSEHOLD SIZE
$37,039
PER CAPITA INCOME
$68,750
AVG FAMILY INCOME
$65,000
AVG HOUSEHOLD INCOME
67.0%
WAGE / INCOME GAP [ % ]
33.0¢/ $1
WAGE / INCOME GAP [ $ ]
0.30
INEQUALITY / GINI INDEX
39
LABOR FORCE [ PEOPLE ]
75.0%
PERCENT IN LABOR FORCE
Virginia Zip Codes
Virginia Area Codes
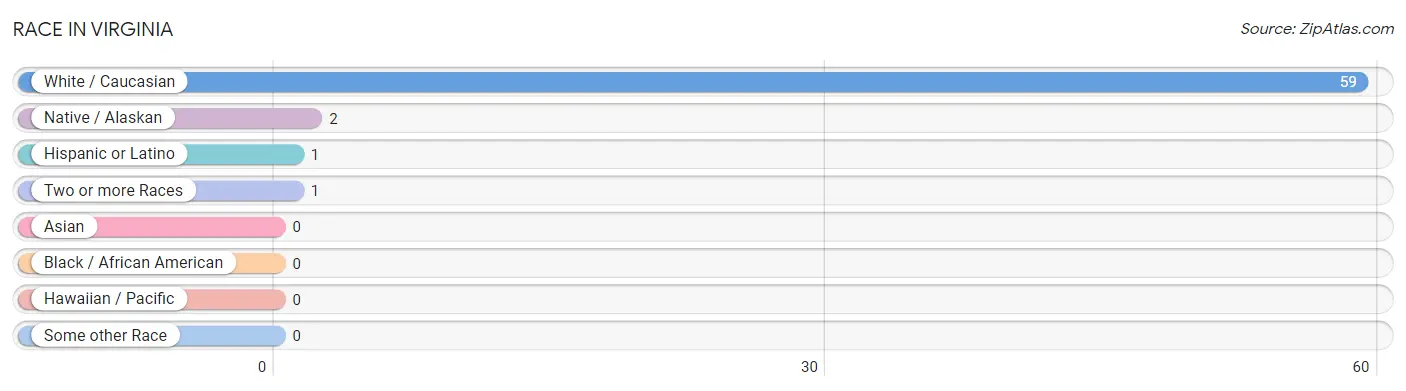
Race in Virginia
The most populous races in Virginia are White / Caucasian (59 | 95.2%), Native / Alaskan (2 | 3.2%), and Hispanic or Latino (1 | 1.6%).
| Race | # Population | % Population |
| Asian | 0 | 0.0% |
| Black / African American | 0 | 0.0% |
| Hawaiian / Pacific | 0 | 0.0% |
| Hispanic or Latino | 1 | 1.6% |
| Native / Alaskan | 2 | 3.2% |
| White / Caucasian | 59 | 95.2% |
| Two or more Races | 1 | 1.6% |
| Some other Race | 0 | 0.0% |
| Total | 62 | 100.0% |
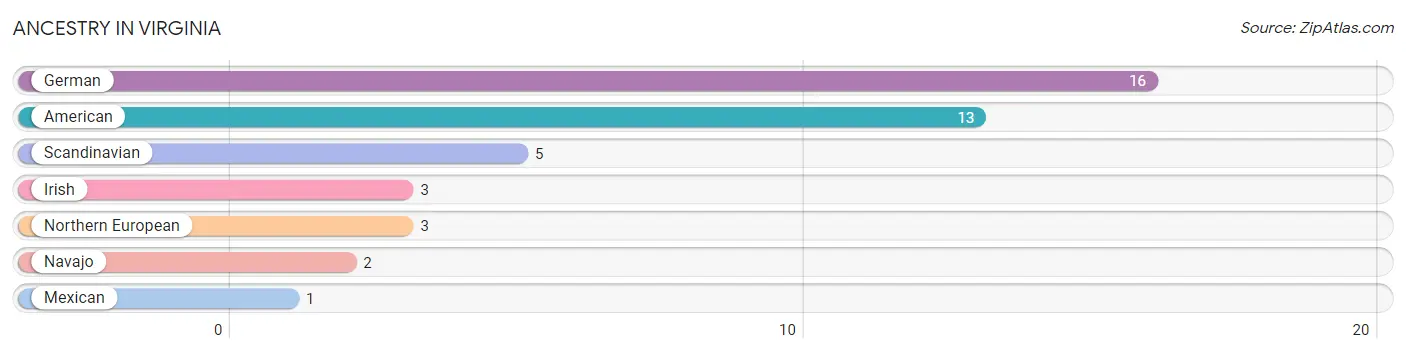
Ancestry in Virginia
The most populous ancestries reported in Virginia are German (16 | 25.8%), American (13 | 21.0%), Scandinavian (5 | 8.1%), Irish (3 | 4.8%), and Northern European (3 | 4.8%), together accounting for 64.5% of all Virginia residents.
| Ancestry | # Population | % Population |
| American | 13 | 21.0% |
| German | 16 | 25.8% |
| Irish | 3 | 4.8% |
| Mexican | 1 | 1.6% |
| Navajo | 2 | 3.2% |
| Northern European | 3 | 4.8% |
| Scandinavian | 5 | 8.1% | View All 7 Rows |
Immigrants in Virginia

| Immigration Origin | # Population | % Population | View All 0 Rows |
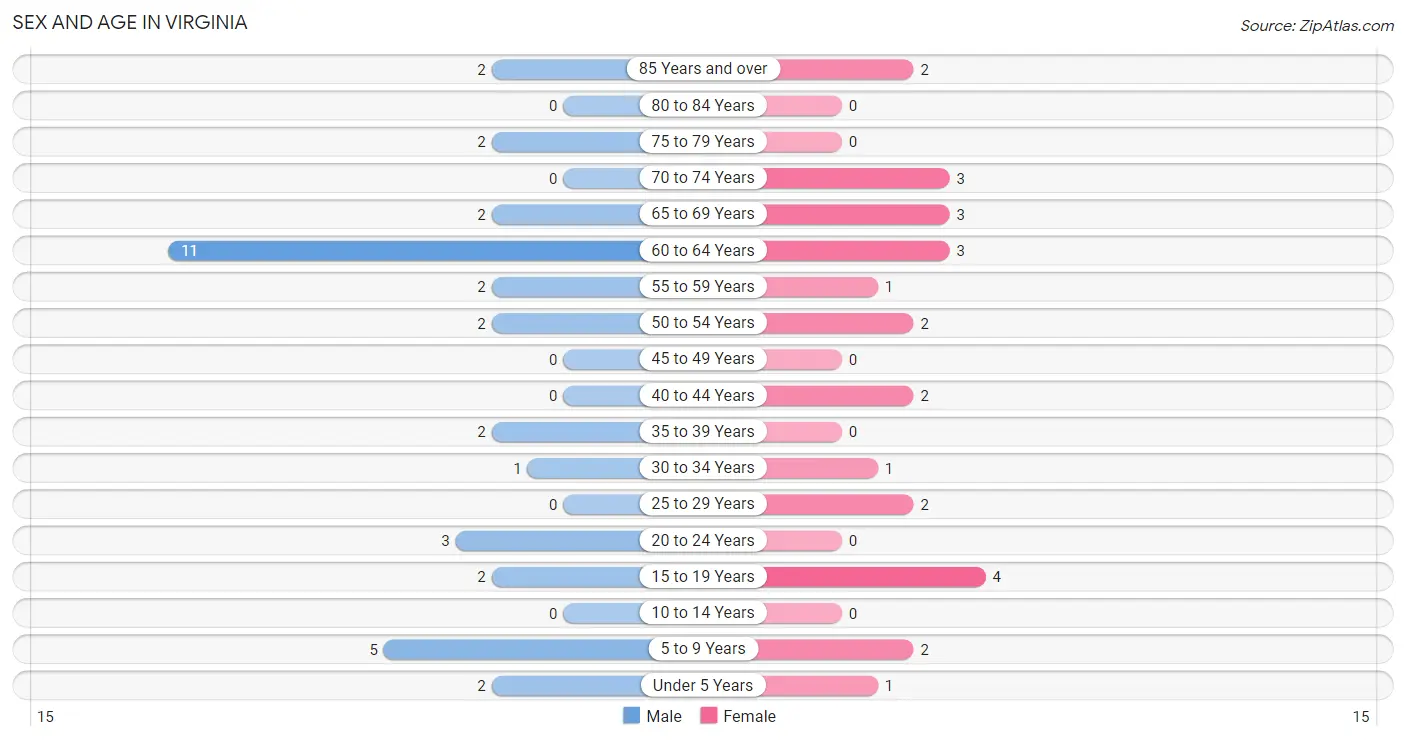
Sex and Age in Virginia
Sex and Age in Virginia
The most populous age groups in Virginia are 60 to 64 Years (11 | 30.6%) for men and 15 to 19 Years (4 | 15.4%) for women.
| Age Bracket | Male | Female |
| Under 5 Years | 2 (5.6%) | 1 (3.8%) |
| 5 to 9 Years | 5 (13.9%) | 2 (7.7%) |
| 10 to 14 Years | 0 (0.0%) | 0 (0.0%) |
| 15 to 19 Years | 2 (5.6%) | 4 (15.4%) |
| 20 to 24 Years | 3 (8.3%) | 0 (0.0%) |
| 25 to 29 Years | 0 (0.0%) | 2 (7.7%) |
| 30 to 34 Years | 1 (2.8%) | 1 (3.8%) |
| 35 to 39 Years | 2 (5.6%) | 0 (0.0%) |
| 40 to 44 Years | 0 (0.0%) | 2 (7.7%) |
| 45 to 49 Years | 0 (0.0%) | 0 (0.0%) |
| 50 to 54 Years | 2 (5.6%) | 2 (7.7%) |
| 55 to 59 Years | 2 (5.6%) | 1 (3.8%) |
| 60 to 64 Years | 11 (30.6%) | 3 (11.5%) |
| 65 to 69 Years | 2 (5.6%) | 3 (11.5%) |
| 70 to 74 Years | 0 (0.0%) | 3 (11.5%) |
| 75 to 79 Years | 2 (5.6%) | 0 (0.0%) |
| 80 to 84 Years | 0 (0.0%) | 0 (0.0%) |
| 85 Years and over | 2 (5.6%) | 2 (7.7%) |
| Total | 36 (100.0%) | 26 (100.0%) |
Families and Households in Virginia
Median Family Size in Virginia
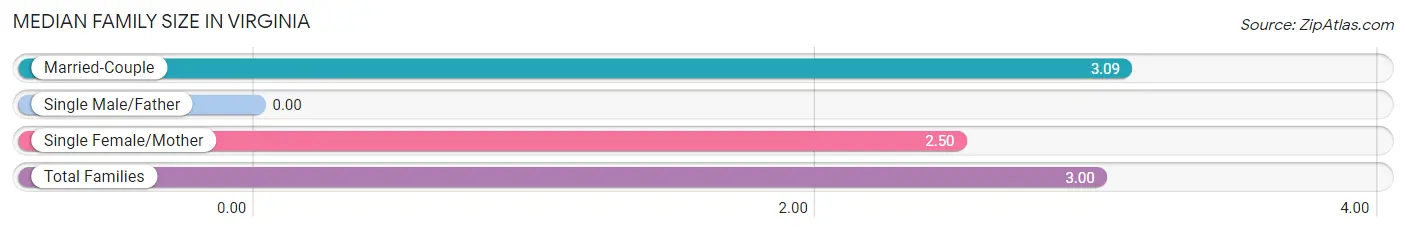
| Family Type | # Families | Family Size |
| Married-Couple | 11 (84.6%) | 3.09 |
| Single Male/Father | 0 (0.0%) | - |
| Single Female/Mother | 2 (15.4%) | 2.50 |
| Total Families | 13 (100.0%) | 3.00 |
Median Household Size in Virginia
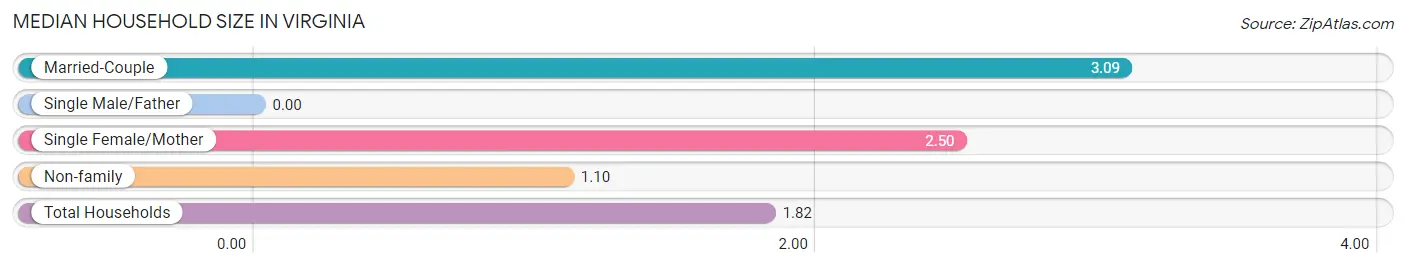
| Household Type | # Households | Household Size |
| Married-Couple | 11 (32.4%) | 3.09 |
| Single Male/Father | 0 (0.0%) | - |
| Single Female/Mother | 2 (5.9%) | 2.50 |
| Non-family | 21 (61.8%) | 1.10 |
| Total Households | 34 (100.0%) | 1.82 |
Household Size by Marriage Status in Virginia
Out of a total of 34 households in Virginia, 13 (38.2%) are family households, while 21 (61.8%) are nonfamily households. The most numerous type of family households are 2-person households, comprising 9, and the most common type of nonfamily households are 1-person households, comprising 19.
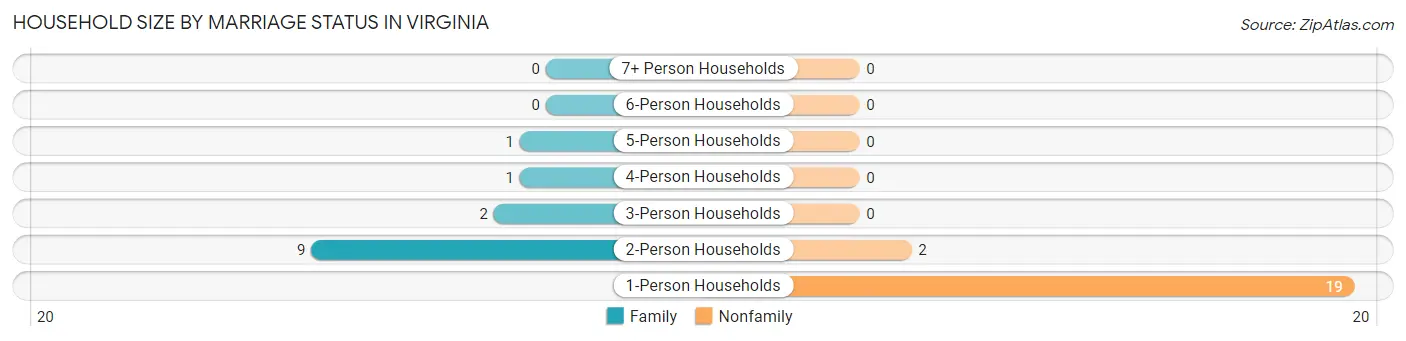
| Household Size | Family Households | Nonfamily Households |
| 1-Person Households | - | 19 (55.9%) |
| 2-Person Households | 9 (26.5%) | 2 (5.9%) |
| 3-Person Households | 2 (5.9%) | 0 (0.0%) |
| 4-Person Households | 1 (2.9%) | 0 (0.0%) |
| 5-Person Households | 1 (2.9%) | 0 (0.0%) |
| 6-Person Households | 0 (0.0%) | 0 (0.0%) |
| 7+ Person Households | 0 (0.0%) | 0 (0.0%) |
| Total | 13 (38.2%) | 21 (61.8%) |
Female Fertility in Virginia
Fertility by Age in Virginia
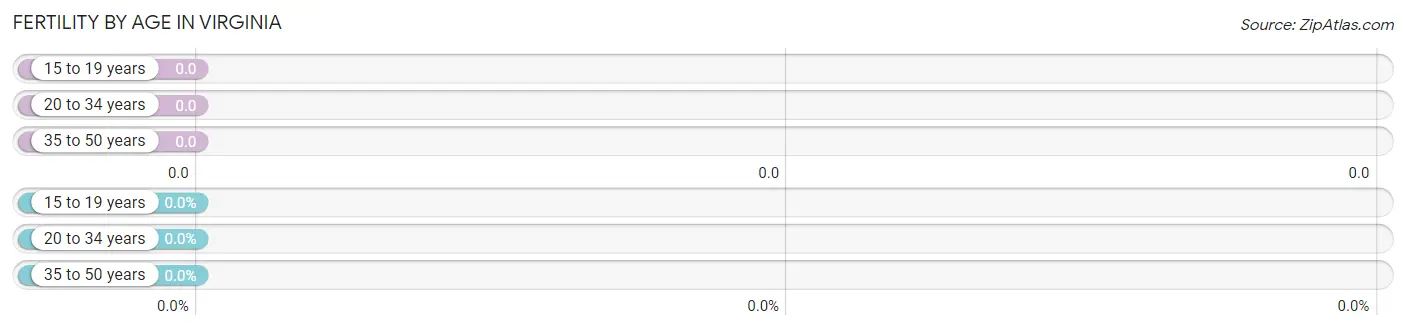
| Age Bracket | Women with Births | Births / 1,000 Women |
| 15 to 19 years | 0 (0.0%) | 0.0 |
| 20 to 34 years | 0 (0.0%) | 0.0 |
| 35 to 50 years | 0 (0.0%) | 0.0 |
| Total | 0 (0.0%) | 0.0 |
Fertility by Age by Marriage Status in Virginia
| Age Bracket | Married | Unmarried |
| 15 to 19 years | 0 (0.0%) | 0 (0.0%) |
| 20 to 34 years | 0 (0.0%) | 0 (0.0%) |
| 35 to 50 years | 0 (0.0%) | 0 (0.0%) |
| Total | 0 (0.0%) | 0 (0.0%) |
Fertility by Education in Virginia
| Educational Attainment | Women with Births | Births / 1,000 Women |
| Less than High School | 0 (0.0%) | 0.0 |
| High School Diploma | 0 (0.0%) | 0.0 |
| College or Associate's Degree | 0 (0.0%) | 0.0 |
| Bachelor's Degree | 0 (0.0%) | 0.0 |
| Graduate Degree | 0 (0.0%) | 0.0 |
| Total | 0 (0.0%) | 0.0 |
Fertility by Education by Marriage Status in Virginia
| Educational Attainment | Married | Unmarried |
| Less than High School | 0 (0.0%) | 0 (0.0%) |
| High School Diploma | 0 (0.0%) | 0 (0.0%) |
| College or Associate's Degree | 0 (0.0%) | 0 (0.0%) |
| Bachelor's Degree | 0 (0.0%) | 0 (0.0%) |
| Graduate Degree | 0 (0.0%) | 0 (0.0%) |
| Total | 0 (0.0%) | 0 (0.0%) |
Income in Virginia
Income Overview in Virginia
Per Capita Income in Virginia is $37,039, while median incomes of families and households are $68,750 and $65,000 respectively.
| Characteristic | Number | Measure |
| Per Capita Income | 62 | $37,039 |
| Median Family Income | 13 | $68,750 |
| Mean Family Income | 13 | $78,531 |
| Median Household Income | 34 | $65,000 |
| Mean Household Income | 34 | $64,109 |
| Income Deficit | 13 | $0 |
| Wage / Income Gap (%) | 62 | 67.02% |
| Wage / Income Gap ($) | 62 | 32.98¢ per $1 |
| Gini / Inequality Index | 62 | 0.30 |
Earnings by Sex in Virginia
Average Earnings in Virginia are $51,250, $58,750 for men and $19,375 for women, a difference of 67.0%.
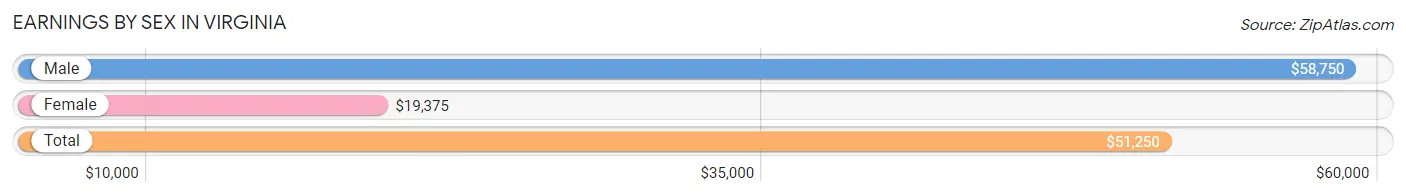
| Sex | Number | Average Earnings |
| Male | 26 (66.7%) | $58,750 |
| Female | 13 (33.3%) | $19,375 |
| Total | 39 (100.0%) | $51,250 |
Earnings by Sex by Income Bracket in Virginia
The most common earnings brackets in Virginia are $65,000 to $74,999 for men (11 | 42.3%) and $5,000 to $7,499 for women (2 | 15.4%).
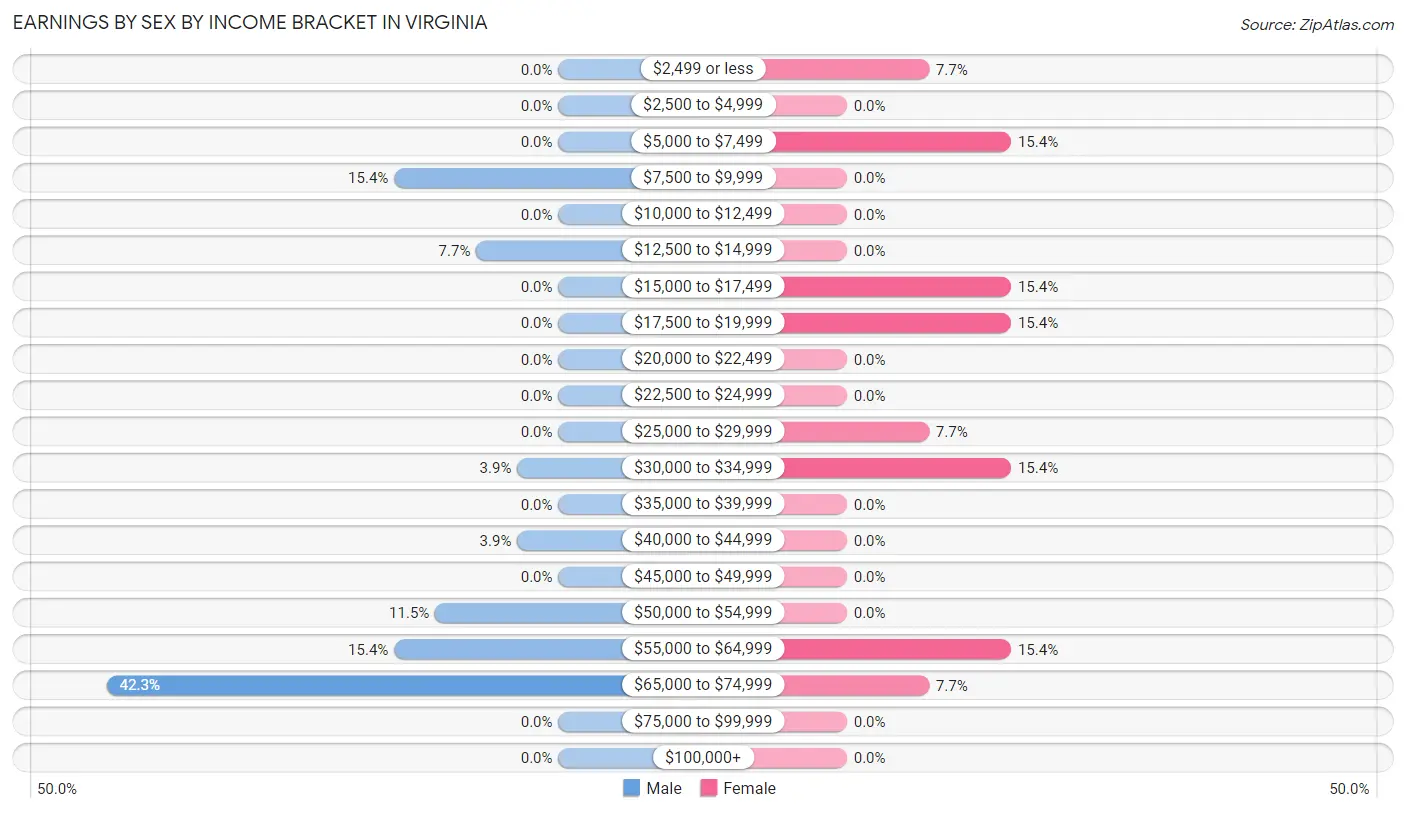
| Income | Male | Female |
| $2,499 or less | 0 (0.0%) | 1 (7.7%) |
| $2,500 to $4,999 | 0 (0.0%) | 0 (0.0%) |
| $5,000 to $7,499 | 0 (0.0%) | 2 (15.4%) |
| $7,500 to $9,999 | 4 (15.4%) | 0 (0.0%) |
| $10,000 to $12,499 | 0 (0.0%) | 0 (0.0%) |
| $12,500 to $14,999 | 2 (7.7%) | 0 (0.0%) |
| $15,000 to $17,499 | 0 (0.0%) | 2 (15.4%) |
| $17,500 to $19,999 | 0 (0.0%) | 2 (15.4%) |
| $20,000 to $22,499 | 0 (0.0%) | 0 (0.0%) |
| $22,500 to $24,999 | 0 (0.0%) | 0 (0.0%) |
| $25,000 to $29,999 | 0 (0.0%) | 1 (7.7%) |
| $30,000 to $34,999 | 1 (3.8%) | 2 (15.4%) |
| $35,000 to $39,999 | 0 (0.0%) | 0 (0.0%) |
| $40,000 to $44,999 | 1 (3.8%) | 0 (0.0%) |
| $45,000 to $49,999 | 0 (0.0%) | 0 (0.0%) |
| $50,000 to $54,999 | 3 (11.5%) | 0 (0.0%) |
| $55,000 to $64,999 | 4 (15.4%) | 2 (15.4%) |
| $65,000 to $74,999 | 11 (42.3%) | 1 (7.7%) |
| $75,000 to $99,999 | 0 (0.0%) | 0 (0.0%) |
| $100,000+ | 0 (0.0%) | 0 (0.0%) |
| Total | 26 (100.0%) | 13 (100.0%) |
Earnings by Sex by Educational Attainment in Virginia
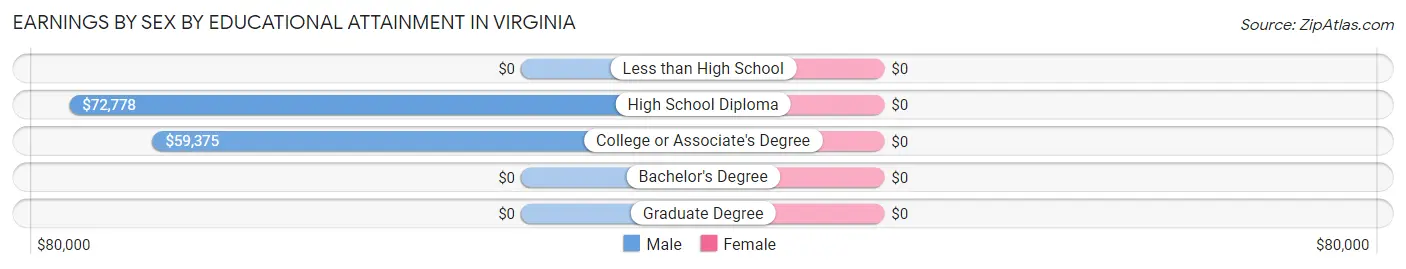
| Educational Attainment | Male Income | Female Income |
| Less than High School | - | - |
| High School Diploma | $72,778 | $0 |
| College or Associate's Degree | $59,375 | $0 |
| Bachelor's Degree | - | - |
| Graduate Degree | - | - |
| Total | $68,125 | $26,250 |
Family Income in Virginia
Family Income Brackets in Virginia
According to the Virginia family income data, there are 4 families falling into the $50,000 to $74,999 income range, which is the most common income bracket and makes up 30.8% of all families.
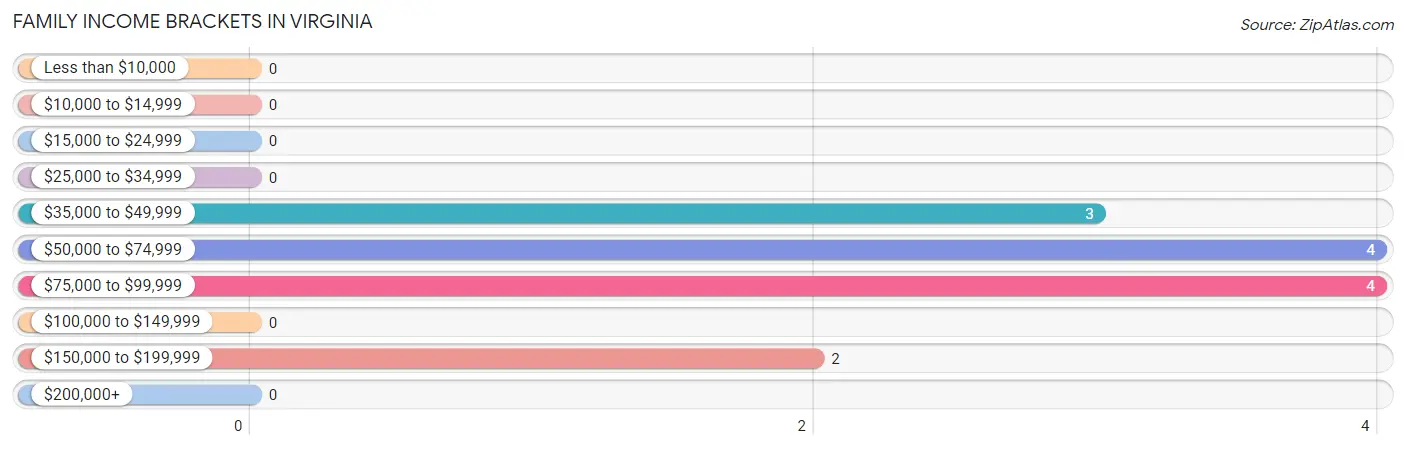
| Income Bracket | # Families | % Families |
| Less than $10,000 | 0 | 0.0% |
| $10,000 to $14,999 | 0 | 0.0% |
| $15,000 to $24,999 | 0 | 0.0% |
| $25,000 to $34,999 | 0 | 0.0% |
| $35,000 to $49,999 | 3 | 23.1% |
| $50,000 to $74,999 | 4 | 30.8% |
| $75,000 to $99,999 | 4 | 30.8% |
| $100,000 to $149,999 | 0 | 0.0% |
| $150,000 to $199,999 | 2 | 15.4% |
| $200,000+ | 0 | 0.0% |
Family Income by Famaliy Size in Virginia
2-person families (9 | 69.2%) account for the highest median family income in Virginia with $76,875 per family, while 2-person families (9 | 69.2%) have the highest median income of $38,438 per family member.
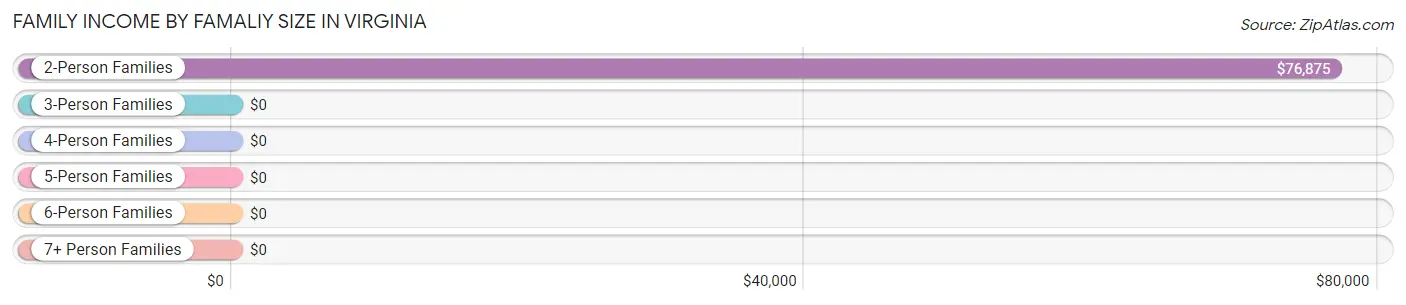
| Income Bracket | # Families | Median Income |
| 2-Person Families | 9 (69.2%) | $76,875 |
| 3-Person Families | 2 (15.4%) | $0 |
| 4-Person Families | 1 (7.7%) | $0 |
| 5-Person Families | 1 (7.7%) | $0 |
| 6-Person Families | 0 (0.0%) | $0 |
| 7+ Person Families | 0 (0.0%) | $0 |
| Total | 13 (100.0%) | $68,750 |
Family Income by Number of Earners in Virginia
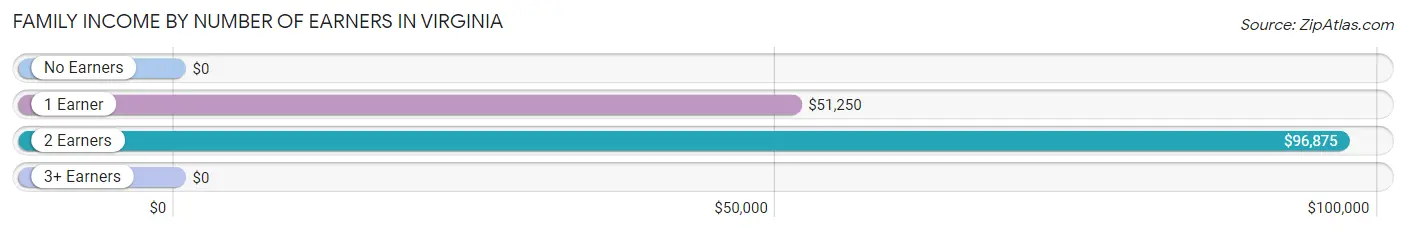
| Number of Earners | # Families | Median Income |
| No Earners | 2 (15.4%) | $0 |
| 1 Earner | 6 (46.2%) | $51,250 |
| 2 Earners | 5 (38.5%) | $96,875 |
| 3+ Earners | 0 (0.0%) | $0 |
| Total | 13 (100.0%) | $68,750 |
Household Income in Virginia
Household Income Brackets in Virginia
With 13 households falling in the category, the $75,000 to $99,999 income range is the most frequent in Virginia, accounting for 38.2% of all households.
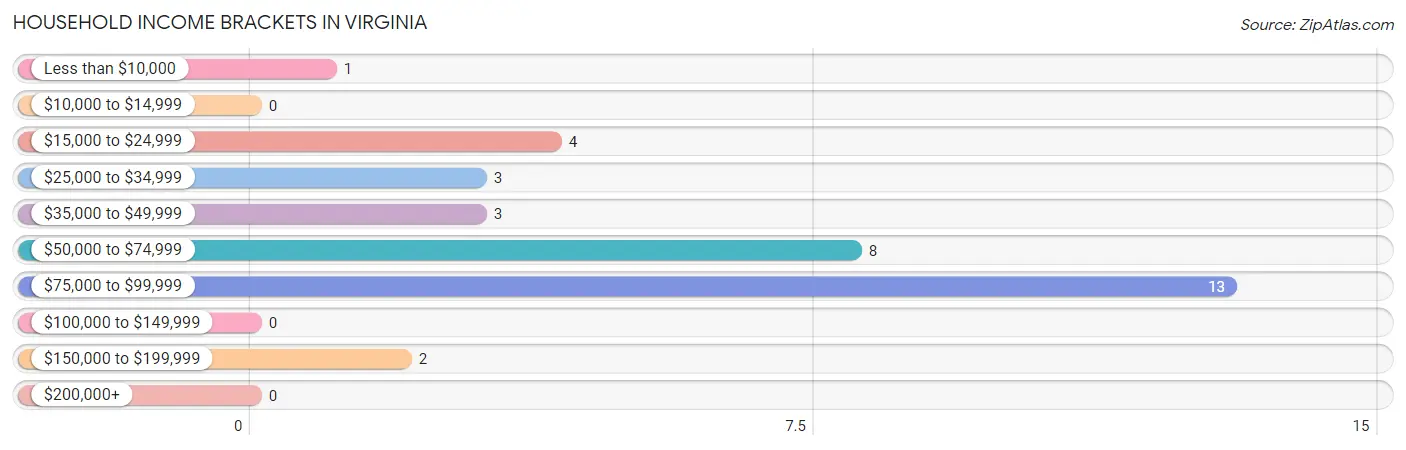
| Income Bracket | # Households | % Households |
| Less than $10,000 | 1 | 2.9% |
| $10,000 to $14,999 | 0 | 0.0% |
| $15,000 to $24,999 | 4 | 11.8% |
| $25,000 to $34,999 | 3 | 8.8% |
| $35,000 to $49,999 | 3 | 8.8% |
| $50,000 to $74,999 | 8 | 23.5% |
| $75,000 to $99,999 | 13 | 38.2% |
| $100,000 to $149,999 | 0 | 0.0% |
| $150,000 to $199,999 | 2 | 5.9% |
| $200,000+ | 0 | 0.0% |
Household Income by Householder Age in Virginia
The median household income in Virginia is $65,000, with the highest median household income of $86,111 found in the 45 to 64 years age bracket for the primary householder. A total of 18 households (52.9%) fall into this category. Meanwhile, the 15 to 24 years age bracket for the primary householder has the lowest median household income of $0, with 5 households (14.7%) in this group.
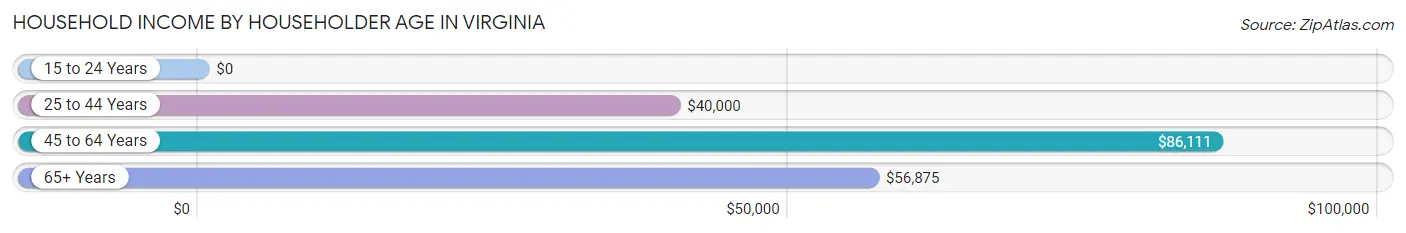
| Income Bracket | # Households | Median Income |
| 15 to 24 Years | 5 (14.7%) | $0 |
| 25 to 44 Years | 4 (11.8%) | $40,000 |
| 45 to 64 Years | 18 (52.9%) | $86,111 |
| 65+ Years | 7 (20.6%) | $56,875 |
| Total | 34 (100.0%) | $65,000 |
Poverty in Virginia
Income Below Poverty by Sex and Age in Virginia
With 8.3% poverty level for males and 7.7% for females among the residents of Virginia, 18 to 24 year old males and 18 to 24 year old females are the most vulnerable to poverty, with 2 males (40.0%) and 2 females (100.0%) in their respective age groups living below the poverty level.
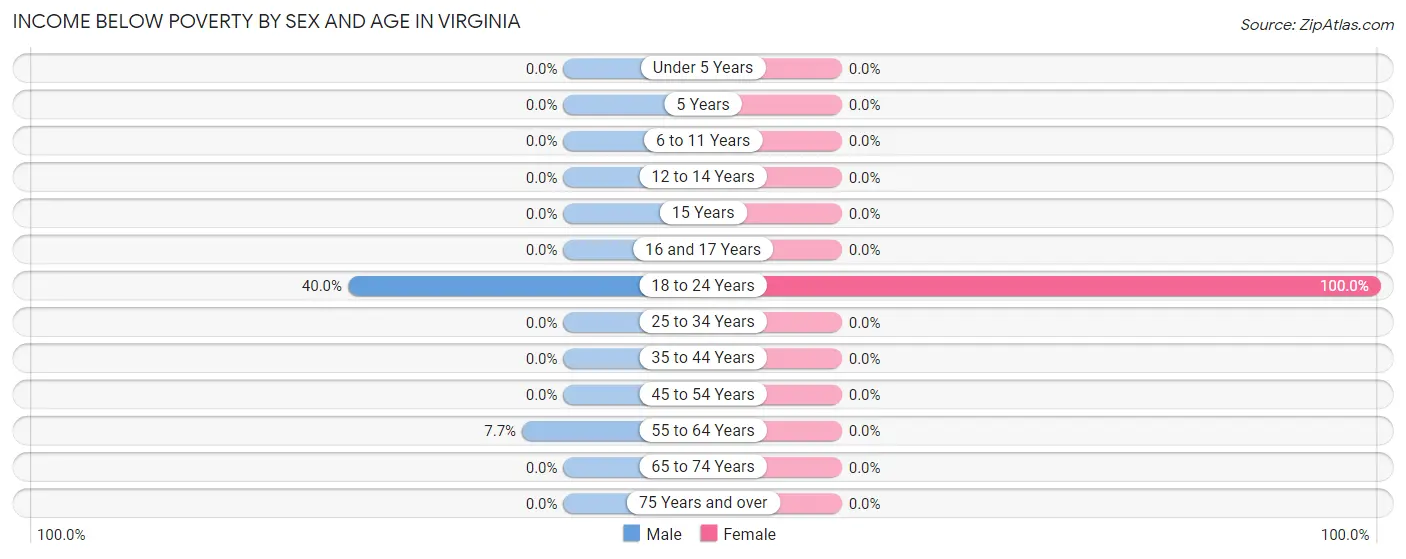
| Age Bracket | Male | Female |
| Under 5 Years | 0 (0.0%) | 0 (0.0%) |
| 5 Years | 0 (0.0%) | 0 (0.0%) |
| 6 to 11 Years | 0 (0.0%) | 0 (0.0%) |
| 12 to 14 Years | 0 (0.0%) | 0 (0.0%) |
| 15 Years | 0 (0.0%) | 0 (0.0%) |
| 16 and 17 Years | 0 (0.0%) | 0 (0.0%) |
| 18 to 24 Years | 2 (40.0%) | 2 (100.0%) |
| 25 to 34 Years | 0 (0.0%) | 0 (0.0%) |
| 35 to 44 Years | 0 (0.0%) | 0 (0.0%) |
| 45 to 54 Years | 0 (0.0%) | 0 (0.0%) |
| 55 to 64 Years | 1 (7.7%) | 0 (0.0%) |
| 65 to 74 Years | 0 (0.0%) | 0 (0.0%) |
| 75 Years and over | 0 (0.0%) | 0 (0.0%) |
| Total | 3 (8.3%) | 2 (7.7%) |
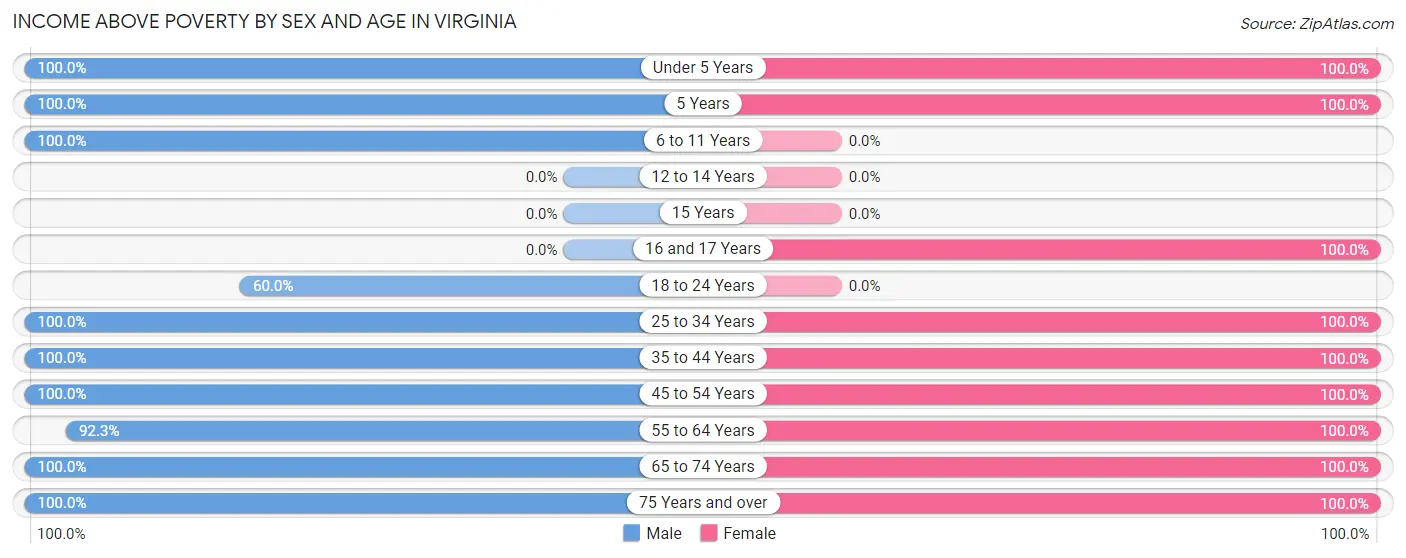
Income Above Poverty by Sex and Age in Virginia
According to the poverty statistics in Virginia, males aged under 5 years and females aged under 5 years are the age groups that are most secure financially, with 100.0% of males and 100.0% of females in these age groups living above the poverty line.
| Age Bracket | Male | Female |
| Under 5 Years | 2 (100.0%) | 1 (100.0%) |
| 5 Years | 3 (100.0%) | 2 (100.0%) |
| 6 to 11 Years | 2 (100.0%) | 0 (0.0%) |
| 12 to 14 Years | 0 (0.0%) | 0 (0.0%) |
| 15 Years | 0 (0.0%) | 0 (0.0%) |
| 16 and 17 Years | 0 (0.0%) | 2 (100.0%) |
| 18 to 24 Years | 3 (60.0%) | 0 (0.0%) |
| 25 to 34 Years | 1 (100.0%) | 3 (100.0%) |
| 35 to 44 Years | 2 (100.0%) | 2 (100.0%) |
| 45 to 54 Years | 2 (100.0%) | 2 (100.0%) |
| 55 to 64 Years | 12 (92.3%) | 4 (100.0%) |
| 65 to 74 Years | 2 (100.0%) | 6 (100.0%) |
| 75 Years and over | 4 (100.0%) | 2 (100.0%) |
| Total | 33 (91.7%) | 24 (92.3%) |
Income Below Poverty Among Married-Couple Families in Virginia
| Children | Above Poverty | Below Poverty |
| No Children | 9 (100.0%) | 0 (0.0%) |
| 1 or 2 Children | 1 (100.0%) | 0 (0.0%) |
| 3 or 4 Children | 1 (100.0%) | 0 (0.0%) |
| 5 or more Children | 0 (0.0%) | 0 (0.0%) |
| Total | 11 (100.0%) | 0 (0.0%) |
Income Below Poverty Among Single-Parent Households in Virginia
| Children | Single Father | Single Mother |
| No Children | 0 (0.0%) | 0 (0.0%) |
| 1 or 2 Children | 0 (0.0%) | 0 (0.0%) |
| 3 or 4 Children | 0 (0.0%) | 0 (0.0%) |
| 5 or more Children | 0 (0.0%) | 0 (0.0%) |
| Total | 0 (0.0%) | 0 (0.0%) |
Income Below Poverty Among Married-Couple vs Single-Parent Households in Virginia
| Children | Married-Couple Families | Single-Parent Households |
| No Children | 0 (0.0%) | 0 (0.0%) |
| 1 or 2 Children | 0 (0.0%) | 0 (0.0%) |
| 3 or 4 Children | 0 (0.0%) | 0 (0.0%) |
| 5 or more Children | 0 (0.0%) | 0 (0.0%) |
| Total | 0 (0.0%) | 0 (0.0%) |
Employment Characteristics in Virginia
Employment by Class of Employer in Virginia
Among the 39 employed individuals in Virginia, private company employees (32 | 82.1%), not-for-profit organizations (3 | 7.7%), and local government employees (2 | 5.1%) make up the most common classes of employment.
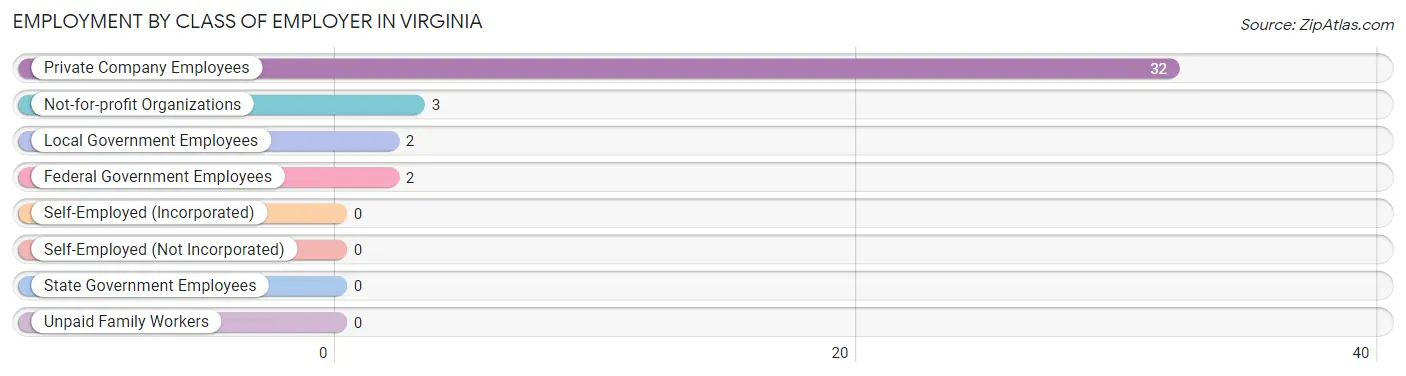
| Employer Class | # Employees | % Employees |
| Private Company Employees | 32 | 82.1% |
| Self-Employed (Incorporated) | 0 | 0.0% |
| Self-Employed (Not Incorporated) | 0 | 0.0% |
| Not-for-profit Organizations | 3 | 7.7% |
| Local Government Employees | 2 | 5.1% |
| State Government Employees | 0 | 0.0% |
| Federal Government Employees | 2 | 5.1% |
| Unpaid Family Workers | 0 | 0.0% |
| Total | 39 | 100.0% |
Employment Status by Age in Virginia
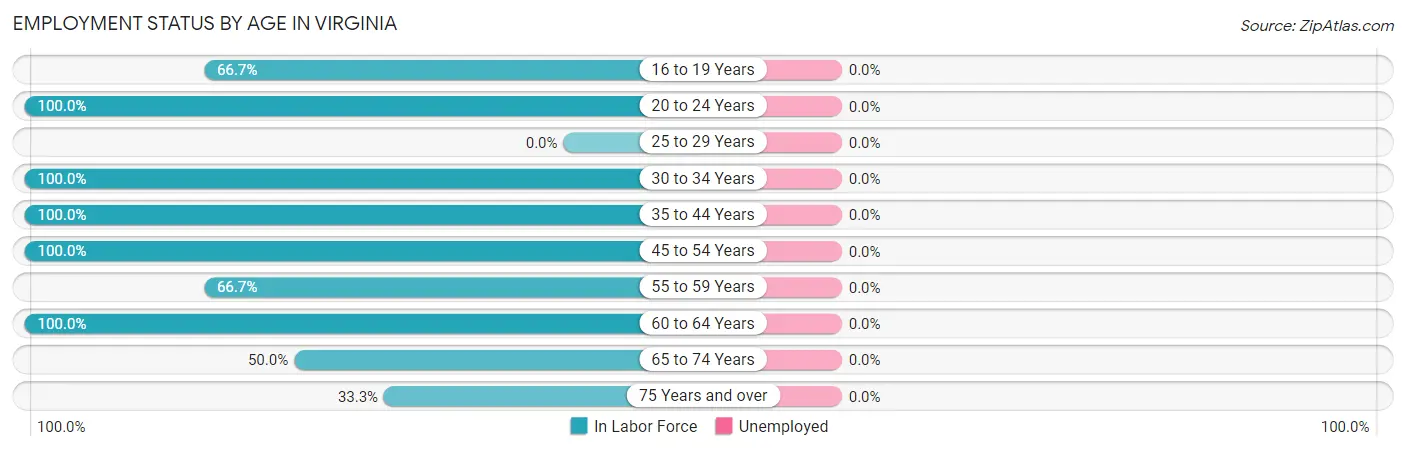
| Age Bracket | In Labor Force | Unemployed |
| 16 to 19 Years | 4 (66.7%) | 0 (0.0%) |
| 20 to 24 Years | 3 (100.0%) | 0 (0.0%) |
| 25 to 29 Years | 0 (0.0%) | 0 (0.0%) |
| 30 to 34 Years | 2 (100.0%) | 0 (0.0%) |
| 35 to 44 Years | 4 (100.0%) | 0 (0.0%) |
| 45 to 54 Years | 4 (100.0%) | 0 (0.0%) |
| 55 to 59 Years | 2 (66.7%) | 0 (0.0%) |
| 60 to 64 Years | 14 (100.0%) | 0 (0.0%) |
| 65 to 74 Years | 4 (50.0%) | 0 (0.0%) |
| 75 Years and over | 2 (33.3%) | 0 (0.0%) |
| Total | 39 (75.0%) | 0 (0.0%) |
Employment Status by Educational Attainment in Virginia
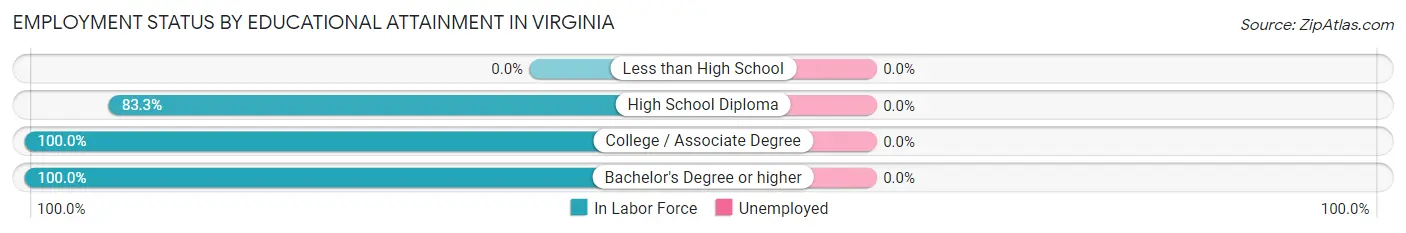
| Educational Attainment | In Labor Force | Unemployed |
| Less than High School | 0 (0.0%) | 0 (0.0%) |
| High School Diploma | 15 (83.3%) | 0 (0.0%) |
| College / Associate Degree | 9 (100.0%) | 0 (0.0%) |
| Bachelor's Degree or higher | 2 (100.0%) | 0 (0.0%) |
| Total | 26 (89.7%) | 0 (0.0%) |
Employment Occupations by Sex in Virginia
Management, Business, Science and Arts Occupations
The most common Management, Business, Science and Arts occupations in Virginia are Community & Social Service (2 | 5.1%), Education, Arts & Media (2 | 5.1%), and Business & Financial (1 | 2.6%).
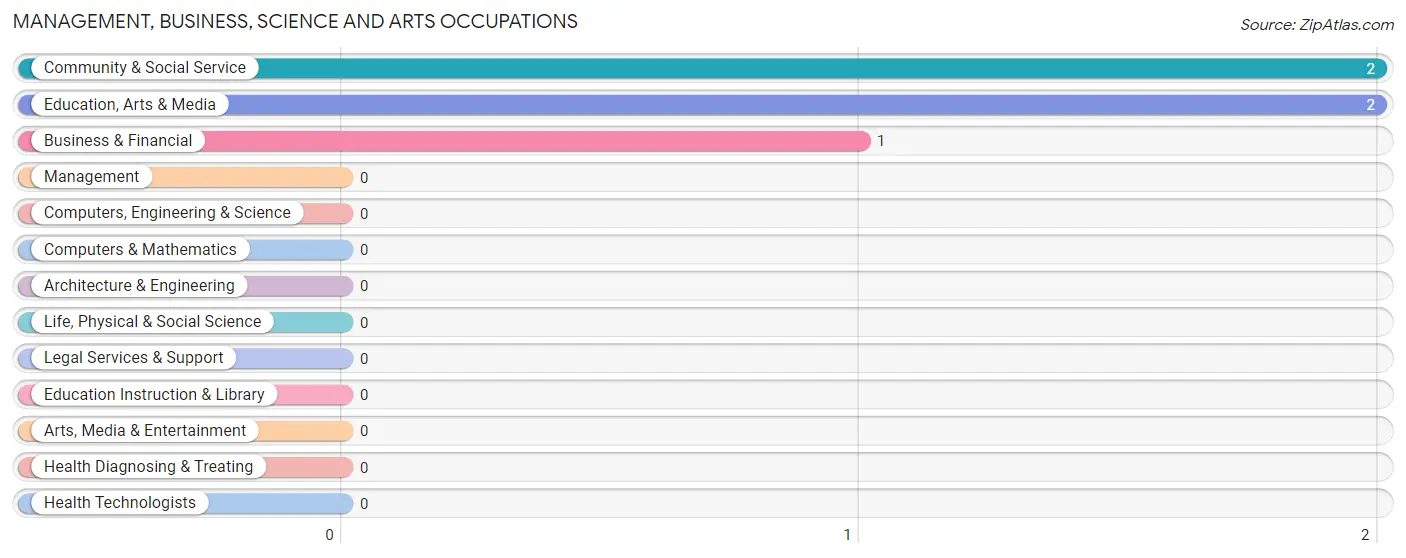
Management, Business, Science and Arts Occupations by Sex
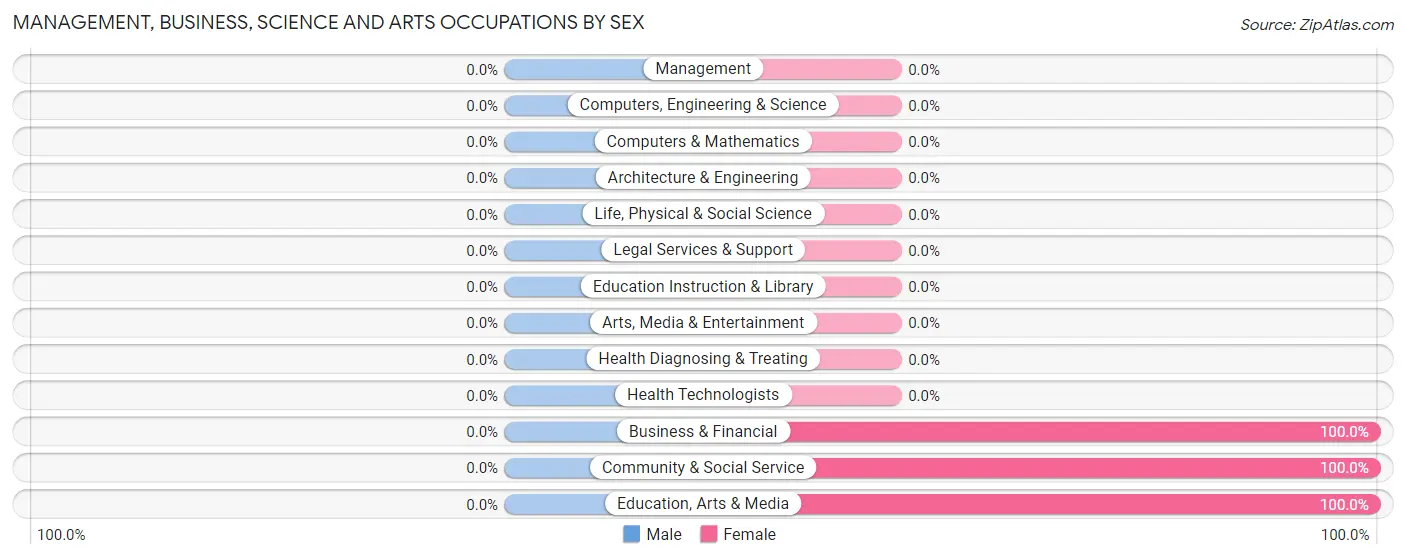
| Occupation | Male | Female |
| Management | 0 (0.0%) | 0 (0.0%) |
| Business & Financial | 0 (0.0%) | 1 (100.0%) |
| Computers, Engineering & Science | 0 (0.0%) | 0 (0.0%) |
| Computers & Mathematics | 0 (0.0%) | 0 (0.0%) |
| Architecture & Engineering | 0 (0.0%) | 0 (0.0%) |
| Life, Physical & Social Science | 0 (0.0%) | 0 (0.0%) |
| Community & Social Service | 0 (0.0%) | 2 (100.0%) |
| Education, Arts & Media | 0 (0.0%) | 2 (100.0%) |
| Legal Services & Support | 0 (0.0%) | 0 (0.0%) |
| Education Instruction & Library | 0 (0.0%) | 0 (0.0%) |
| Arts, Media & Entertainment | 0 (0.0%) | 0 (0.0%) |
| Health Diagnosing & Treating | 0 (0.0%) | 0 (0.0%) |
| Health Technologists | 0 (0.0%) | 0 (0.0%) |
| Total (Category) | 0 (0.0%) | 3 (100.0%) |
| Total (Overall) | 26 (66.7%) | 13 (33.3%) |
Services Occupations
The most common Services occupations in Virginia are Healthcare Support (4 | 10.3%), and Cleaning & Maintenance (3 | 7.7%).
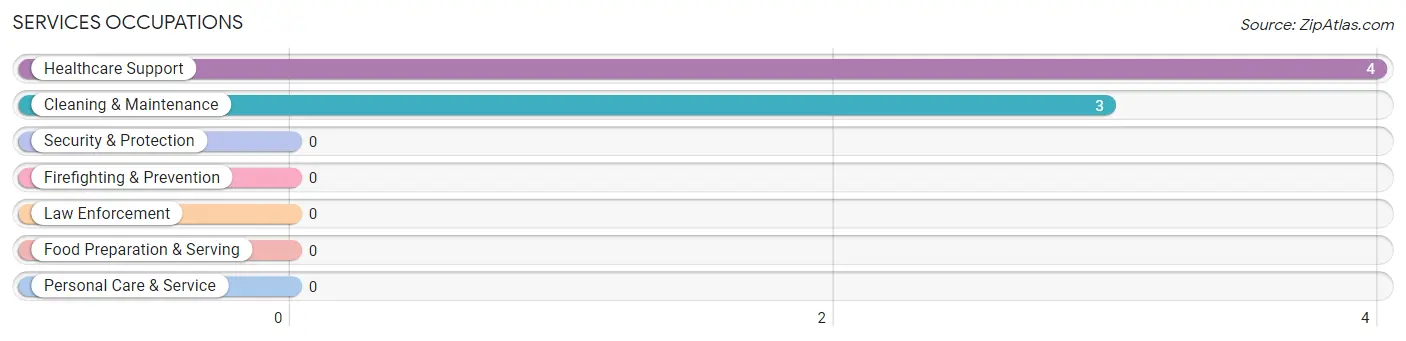
Services Occupations by Sex
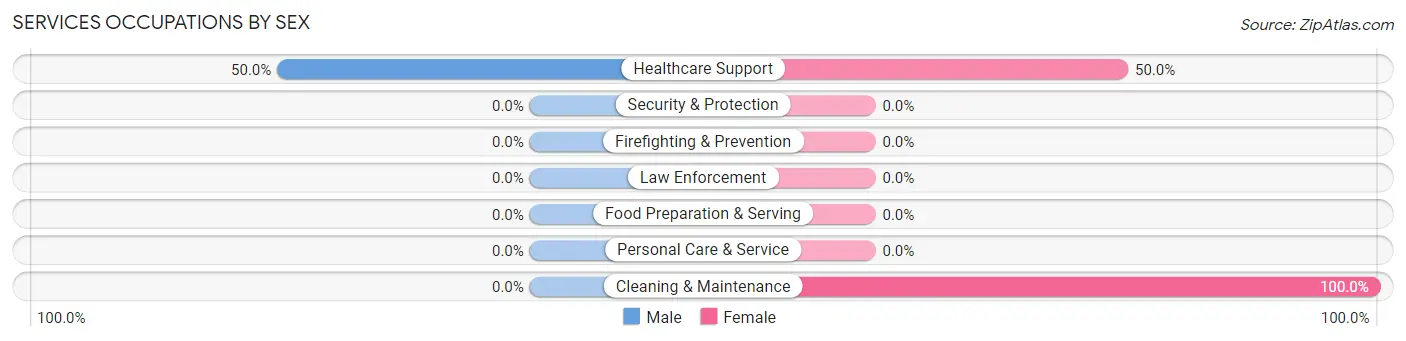
| Occupation | Male | Female |
| Healthcare Support | 2 (50.0%) | 2 (50.0%) |
| Security & Protection | 0 (0.0%) | 0 (0.0%) |
| Firefighting & Prevention | 0 (0.0%) | 0 (0.0%) |
| Law Enforcement | 0 (0.0%) | 0 (0.0%) |
| Food Preparation & Serving | 0 (0.0%) | 0 (0.0%) |
| Cleaning & Maintenance | 0 (0.0%) | 3 (100.0%) |
| Personal Care & Service | 0 (0.0%) | 0 (0.0%) |
| Total (Category) | 2 (28.6%) | 5 (71.4%) |
| Total (Overall) | 26 (66.7%) | 13 (33.3%) |
Sales and Office Occupations
The most common Sales and Office occupations in Virginia are , and Office & Administration (5 | 12.8%).
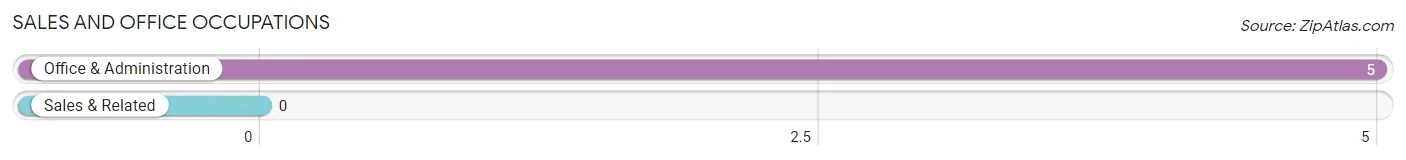
Sales and Office Occupations by Sex
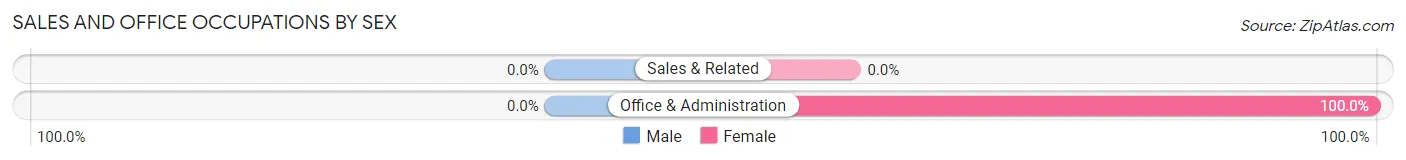
| Occupation | Male | Female |
| Sales & Related | 0 (0.0%) | 0 (0.0%) |
| Office & Administration | 0 (0.0%) | 5 (100.0%) |
| Total (Category) | 0 (0.0%) | 5 (100.0%) |
| Total (Overall) | 26 (66.7%) | 13 (33.3%) |
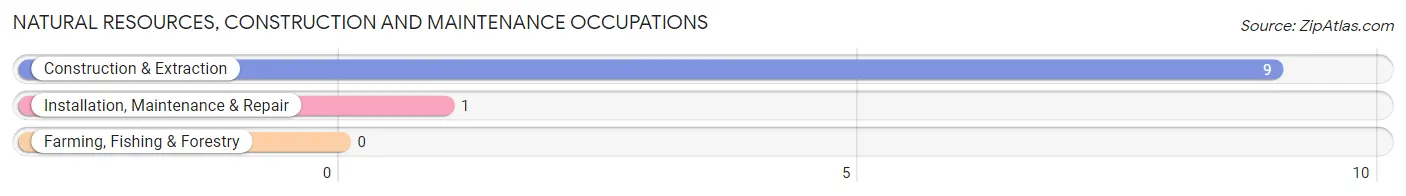
Natural Resources, Construction and Maintenance Occupations
The most common Natural Resources, Construction and Maintenance occupations in Virginia are Construction & Extraction (9 | 23.1%), and Installation, Maintenance & Repair (1 | 2.6%).
Natural Resources, Construction and Maintenance Occupations by Sex
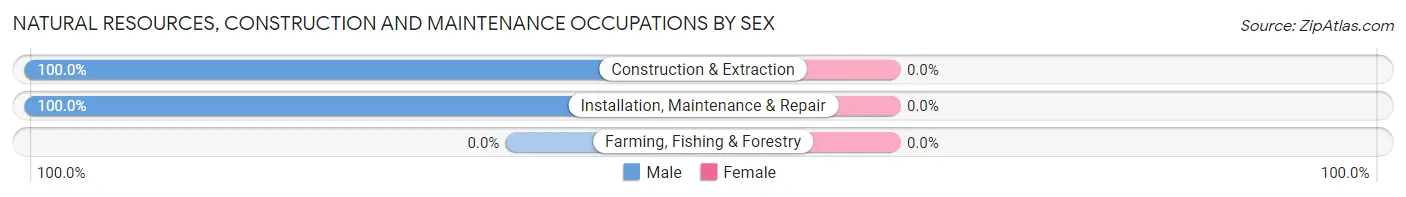
| Occupation | Male | Female |
| Farming, Fishing & Forestry | 0 (0.0%) | 0 (0.0%) |
| Construction & Extraction | 9 (100.0%) | 0 (0.0%) |
| Installation, Maintenance & Repair | 1 (100.0%) | 0 (0.0%) |
| Total (Category) | 10 (100.0%) | 0 (0.0%) |
| Total (Overall) | 26 (66.7%) | 13 (33.3%) |
Production, Transportation and Moving Occupations
The most common Production, Transportation and Moving occupations in Virginia are Production (8 | 20.5%), Transportation (4 | 10.3%), and Material Moving (2 | 5.1%).
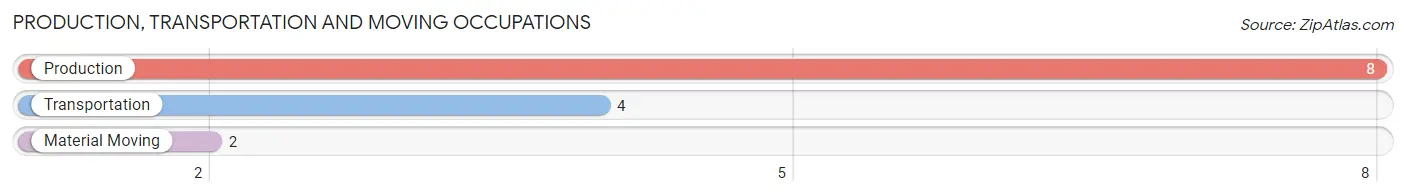
Production, Transportation and Moving Occupations by Sex
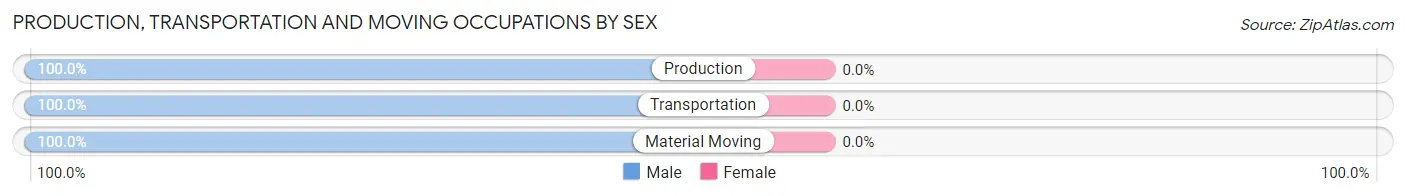
| Occupation | Male | Female |
| Production | 8 (100.0%) | 0 (0.0%) |
| Transportation | 4 (100.0%) | 0 (0.0%) |
| Material Moving | 2 (100.0%) | 0 (0.0%) |
| Total (Category) | 14 (100.0%) | 0 (0.0%) |
| Total (Overall) | 26 (66.7%) | 13 (33.3%) |
Employment Industries by Sex in Virginia
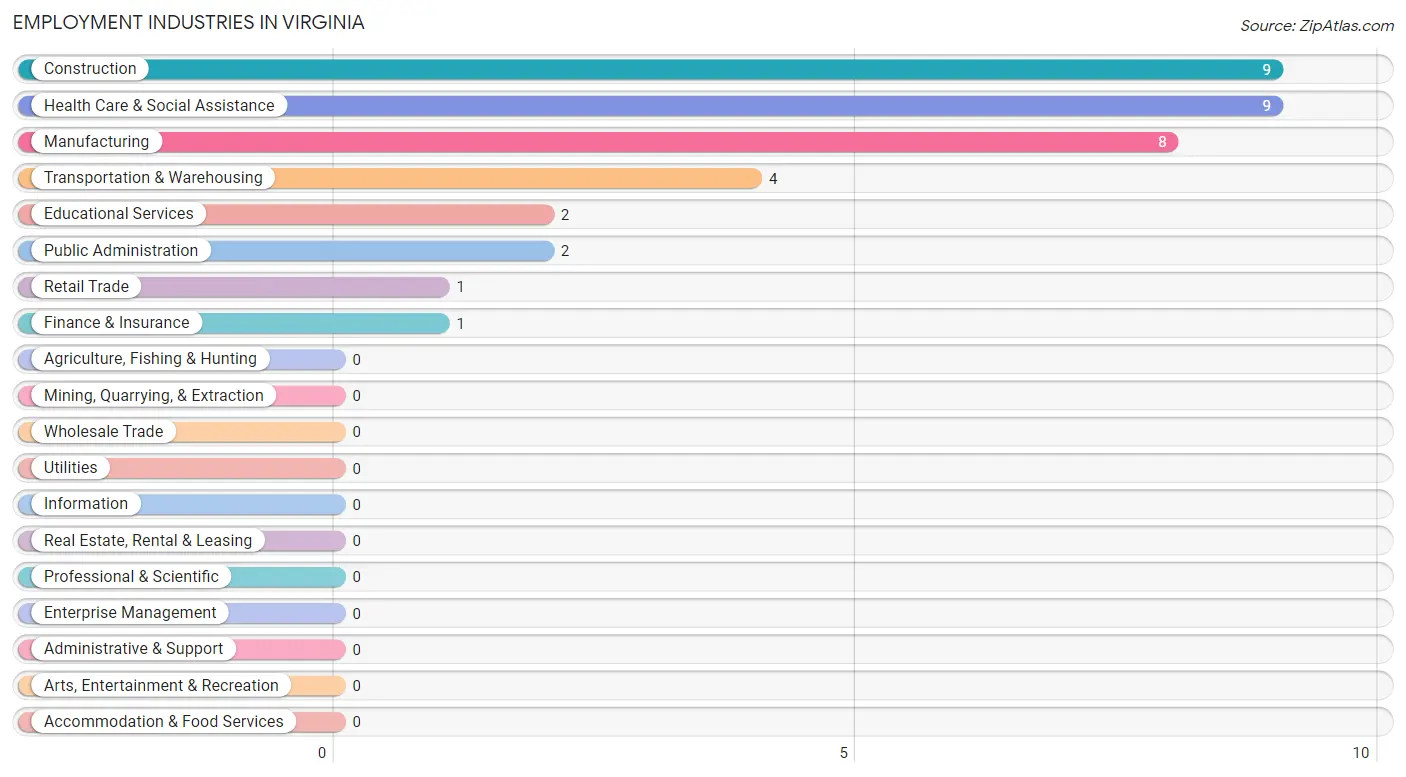
Employment Industries in Virginia
The major employment industries in Virginia include Construction (9 | 23.1%), Health Care & Social Assistance (9 | 23.1%), Manufacturing (8 | 20.5%), Transportation & Warehousing (4 | 10.3%), and Educational Services (2 | 5.1%).
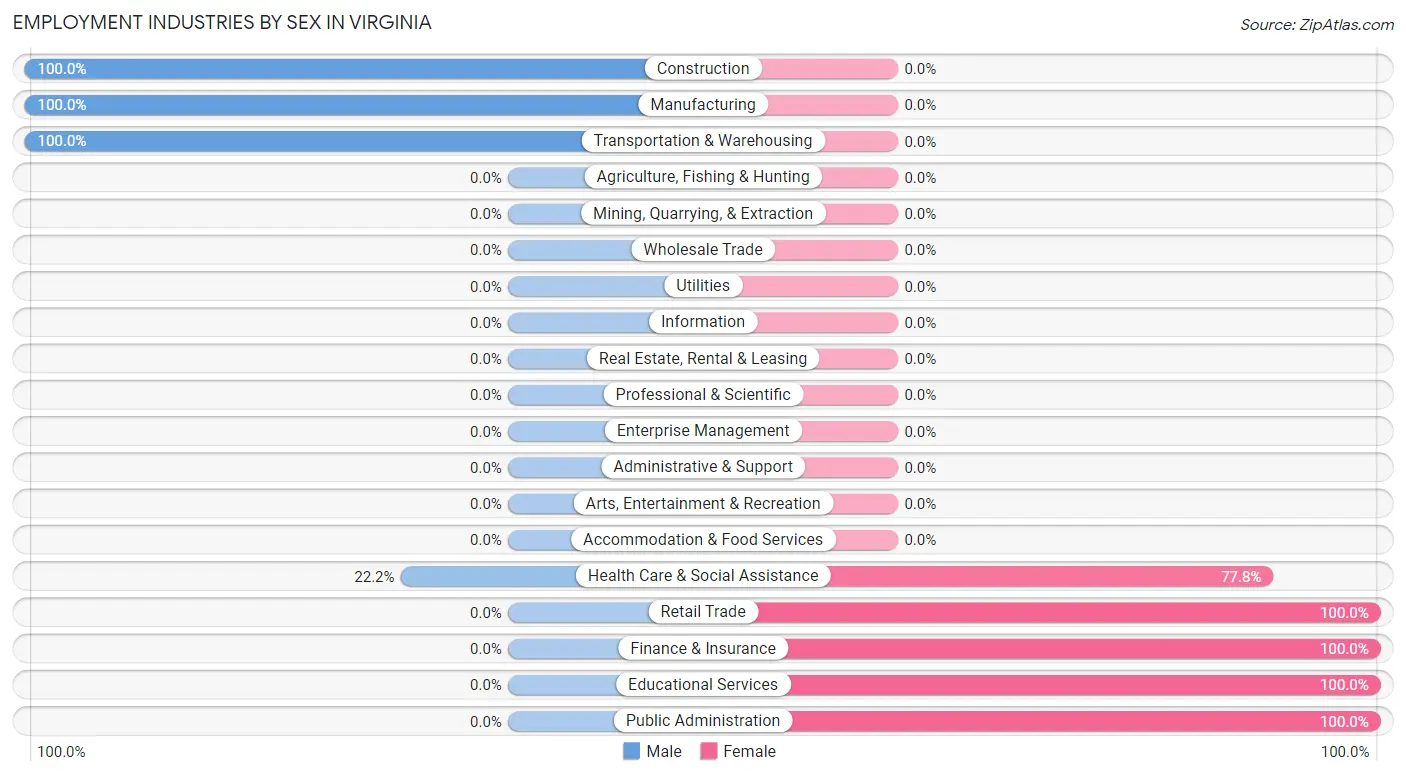
Employment Industries by Sex in Virginia
The Virginia industries that see more men than women are Construction (100.0%), Manufacturing (100.0%), and Transportation & Warehousing (100.0%), whereas the industries that tend to have a higher number of women are Retail Trade (100.0%), Finance & Insurance (100.0%), and Educational Services (100.0%).
| Industry | Male | Female |
| Agriculture, Fishing & Hunting | 0 (0.0%) | 0 (0.0%) |
| Mining, Quarrying, & Extraction | 0 (0.0%) | 0 (0.0%) |
| Construction | 9 (100.0%) | 0 (0.0%) |
| Manufacturing | 8 (100.0%) | 0 (0.0%) |
| Wholesale Trade | 0 (0.0%) | 0 (0.0%) |
| Retail Trade | 0 (0.0%) | 1 (100.0%) |
| Transportation & Warehousing | 4 (100.0%) | 0 (0.0%) |
| Utilities | 0 (0.0%) | 0 (0.0%) |
| Information | 0 (0.0%) | 0 (0.0%) |
| Finance & Insurance | 0 (0.0%) | 1 (100.0%) |
| Real Estate, Rental & Leasing | 0 (0.0%) | 0 (0.0%) |
| Professional & Scientific | 0 (0.0%) | 0 (0.0%) |
| Enterprise Management | 0 (0.0%) | 0 (0.0%) |
| Administrative & Support | 0 (0.0%) | 0 (0.0%) |
| Educational Services | 0 (0.0%) | 2 (100.0%) |
| Health Care & Social Assistance | 2 (22.2%) | 7 (77.8%) |
| Arts, Entertainment & Recreation | 0 (0.0%) | 0 (0.0%) |
| Accommodation & Food Services | 0 (0.0%) | 0 (0.0%) |
| Public Administration | 0 (0.0%) | 2 (100.0%) |
| Total | 26 (66.7%) | 13 (33.3%) |
Education in Virginia
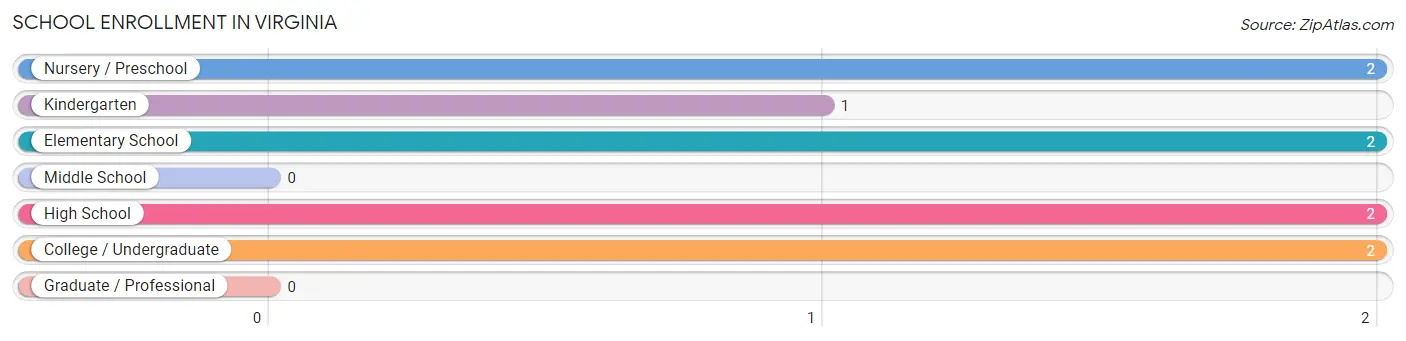
School Enrollment in Virginia
The most common levels of schooling among the 9 students in Virginia are nursery / preschool (2 | 22.2%), elementary school (2 | 22.2%), and high school (2 | 22.2%).
| School Level | # Students | % Students |
| Nursery / Preschool | 2 | 22.2% |
| Kindergarten | 1 | 11.1% |
| Elementary School | 2 | 22.2% |
| Middle School | 0 | 0.0% |
| High School | 2 | 22.2% |
| College / Undergraduate | 2 | 22.2% |
| Graduate / Professional | 0 | 0.0% |
| Total | 9 | 100.0% |
School Enrollment by Age by Funding Source in Virginia
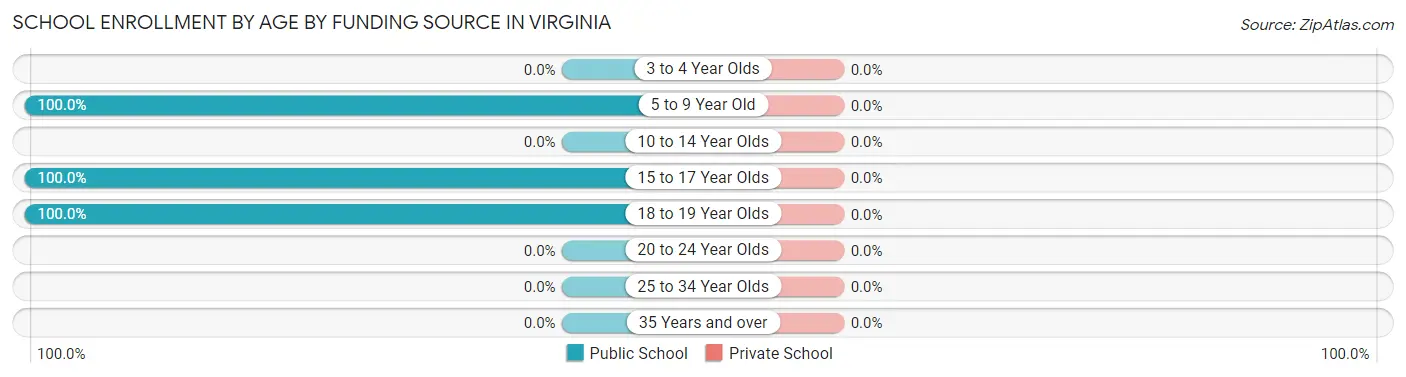
| Age Bracket | Public School | Private School |
| 3 to 4 Year Olds | 0 (0.0%) | 0 (0.0%) |
| 5 to 9 Year Old | 5 (100.0%) | 0 (0.0%) |
| 10 to 14 Year Olds | 0 (0.0%) | 0 (0.0%) |
| 15 to 17 Year Olds | 2 (100.0%) | 0 (0.0%) |
| 18 to 19 Year Olds | 2 (100.0%) | 0 (0.0%) |
| 20 to 24 Year Olds | 0 (0.0%) | 0 (0.0%) |
| 25 to 34 Year Olds | 0 (0.0%) | 0 (0.0%) |
| 35 Years and over | 0 (0.0%) | 0 (0.0%) |
| Total | 9 (100.0%) | 0 (0.0%) |
Educational Attainment by Field of Study in Virginia
Social sciences (2 | 33.3%), education (2 | 33.3%), and liberal arts & history (2 | 33.3%) are the most common fields of study among 6 individuals in Virginia who have obtained a bachelor's degree or higher.
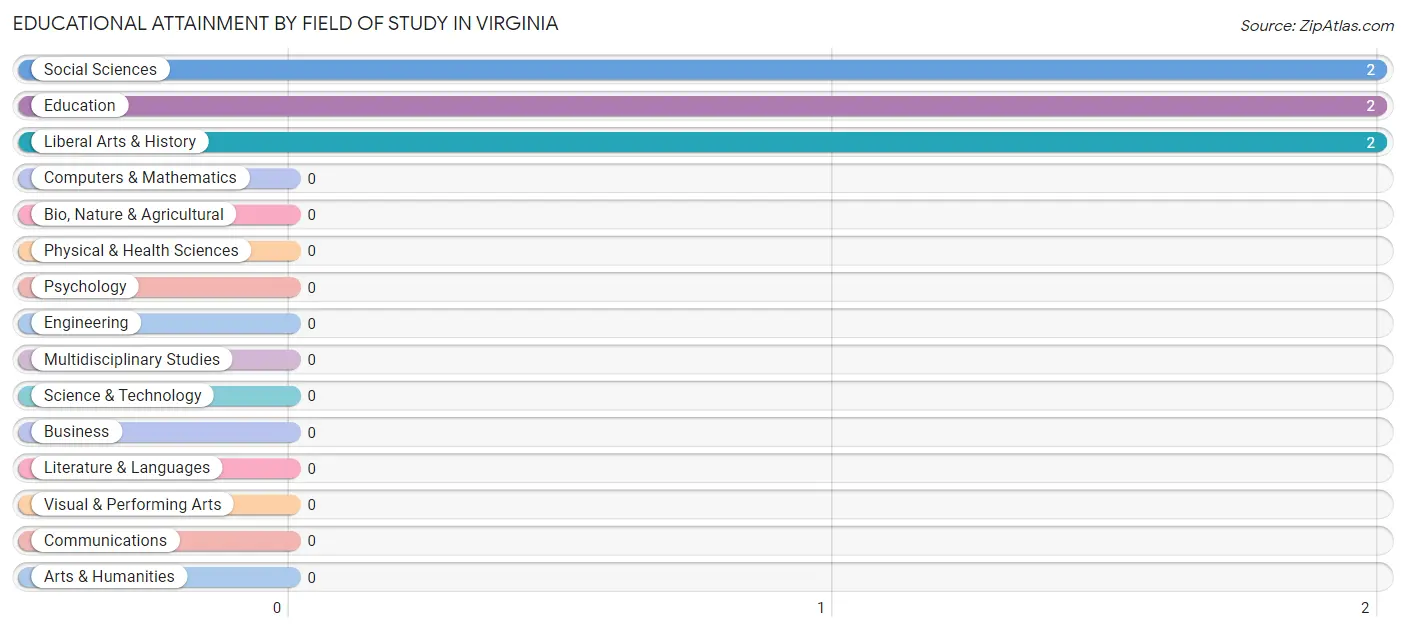
| Field of Study | # Graduates | % Graduates |
| Computers & Mathematics | 0 | 0.0% |
| Bio, Nature & Agricultural | 0 | 0.0% |
| Physical & Health Sciences | 0 | 0.0% |
| Psychology | 0 | 0.0% |
| Social Sciences | 2 | 33.3% |
| Engineering | 0 | 0.0% |
| Multidisciplinary Studies | 0 | 0.0% |
| Science & Technology | 0 | 0.0% |
| Business | 0 | 0.0% |
| Education | 2 | 33.3% |
| Literature & Languages | 0 | 0.0% |
| Liberal Arts & History | 2 | 33.3% |
| Visual & Performing Arts | 0 | 0.0% |
| Communications | 0 | 0.0% |
| Arts & Humanities | 0 | 0.0% |
| Total | 6 | 100.0% |
Transportation & Commute in Virginia
Vehicle Availability by Sex in Virginia
The most prevalent vehicle ownership categories in Virginia are males with 2 vehicles (19, accounting for 73.1%) and females with 2 vehicles (6, making up 146.2%).
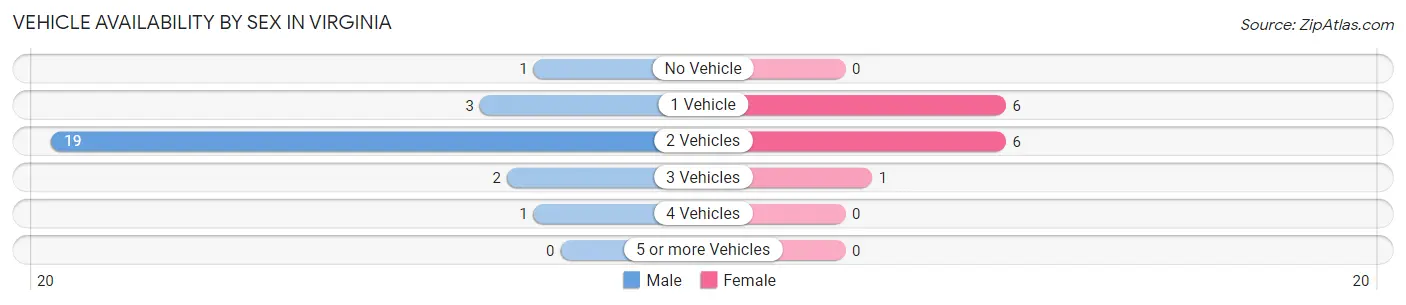
| Vehicles Available | Male | Female |
| No Vehicle | 1 (3.8%) | 0 (0.0%) |
| 1 Vehicle | 3 (11.5%) | 6 (46.2%) |
| 2 Vehicles | 19 (73.1%) | 6 (46.2%) |
| 3 Vehicles | 2 (7.7%) | 1 (7.7%) |
| 4 Vehicles | 1 (3.8%) | 0 (0.0%) |
| 5 or more Vehicles | 0 (0.0%) | 0 (0.0%) |
| Total | 26 (100.0%) | 13 (100.0%) |
Commute Time in Virginia
The most frequently occuring commute durations in Virginia are 90 or more minutes (9 commuters, 23.1%), 30 to 34 minutes (8 commuters, 20.5%), and 20 to 24 minutes (6 commuters, 15.4%).
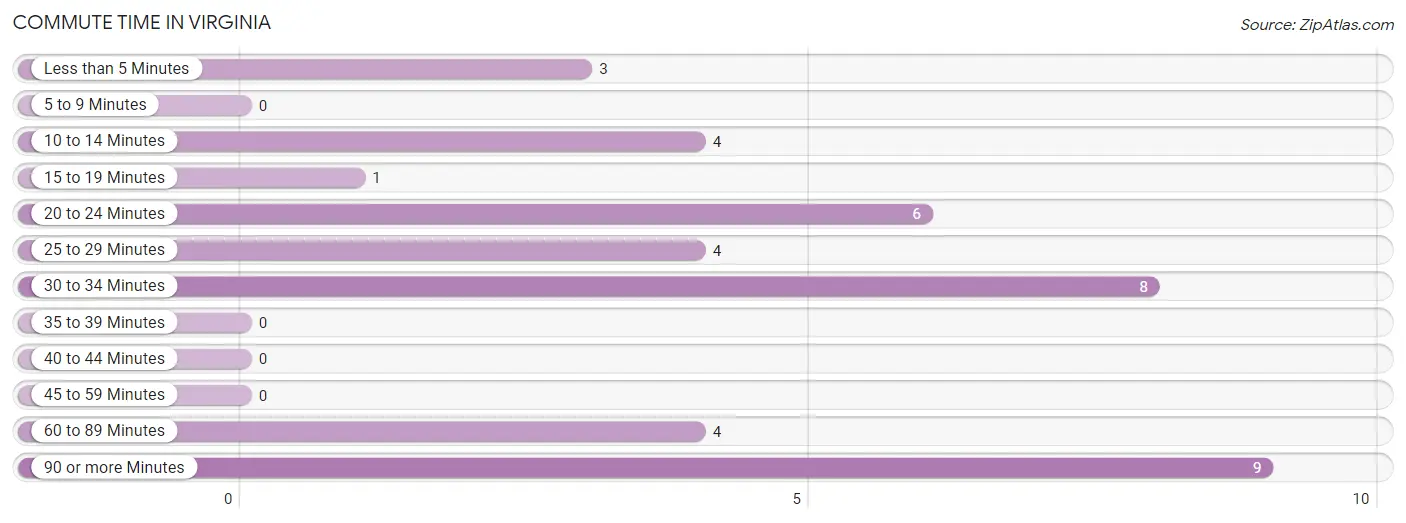
| Commute Time | # Commuters | % Commuters |
| Less than 5 Minutes | 3 | 7.7% |
| 5 to 9 Minutes | 0 | 0.0% |
| 10 to 14 Minutes | 4 | 10.3% |
| 15 to 19 Minutes | 1 | 2.6% |
| 20 to 24 Minutes | 6 | 15.4% |
| 25 to 29 Minutes | 4 | 10.3% |
| 30 to 34 Minutes | 8 | 20.5% |
| 35 to 39 Minutes | 0 | 0.0% |
| 40 to 44 Minutes | 0 | 0.0% |
| 45 to 59 Minutes | 0 | 0.0% |
| 60 to 89 Minutes | 4 | 10.3% |
| 90 or more Minutes | 9 | 23.1% |
Commute Time by Sex in Virginia
The most common commute times in Virginia are 90 or more minutes (9 commuters, 34.6%) for males and 10 to 14 minutes (4 commuters, 30.8%) for females.
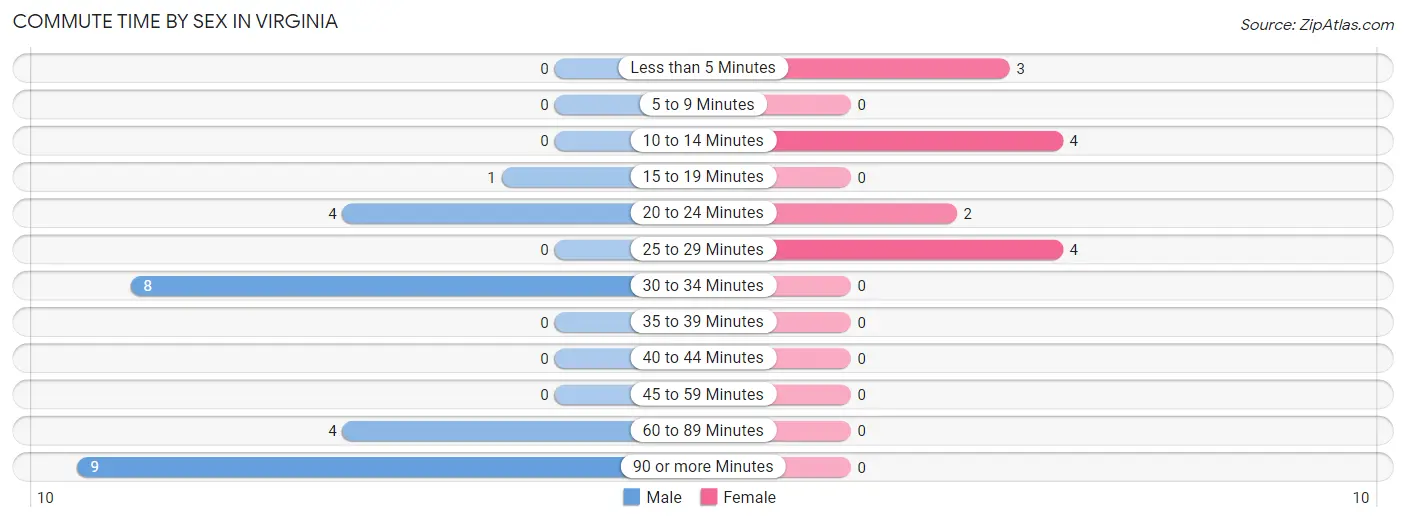
| Commute Time | Male | Female |
| Less than 5 Minutes | 0 (0.0%) | 3 (23.1%) |
| 5 to 9 Minutes | 0 (0.0%) | 0 (0.0%) |
| 10 to 14 Minutes | 0 (0.0%) | 4 (30.8%) |
| 15 to 19 Minutes | 1 (3.8%) | 0 (0.0%) |
| 20 to 24 Minutes | 4 (15.4%) | 2 (15.4%) |
| 25 to 29 Minutes | 0 (0.0%) | 4 (30.8%) |
| 30 to 34 Minutes | 8 (30.8%) | 0 (0.0%) |
| 35 to 39 Minutes | 0 (0.0%) | 0 (0.0%) |
| 40 to 44 Minutes | 0 (0.0%) | 0 (0.0%) |
| 45 to 59 Minutes | 0 (0.0%) | 0 (0.0%) |
| 60 to 89 Minutes | 4 (15.4%) | 0 (0.0%) |
| 90 or more Minutes | 9 (34.6%) | 0 (0.0%) |
Time of Departure to Work by Sex in Virginia
The most frequent times of departure to work in Virginia are 12:00 AM to 4:59 AM (13, 50.0%) for males and 7:00 AM to 7:29 AM (4, 30.8%) for females.
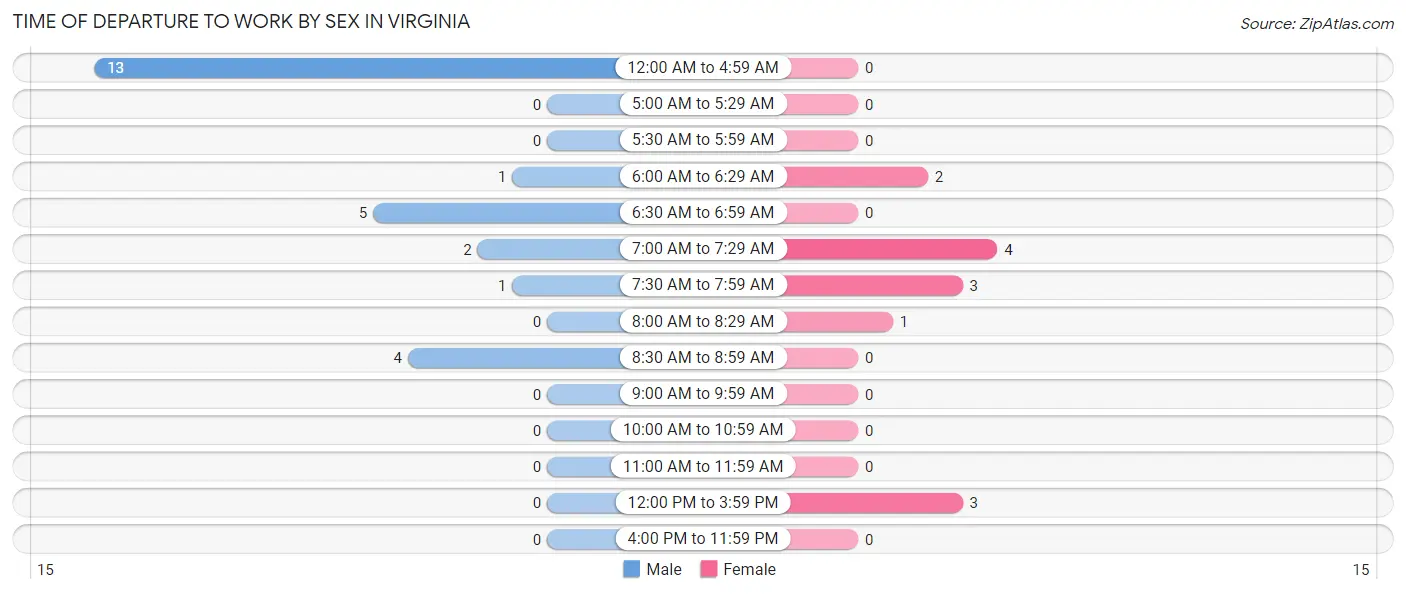
| Time of Departure | Male | Female |
| 12:00 AM to 4:59 AM | 13 (50.0%) | 0 (0.0%) |
| 5:00 AM to 5:29 AM | 0 (0.0%) | 0 (0.0%) |
| 5:30 AM to 5:59 AM | 0 (0.0%) | 0 (0.0%) |
| 6:00 AM to 6:29 AM | 1 (3.8%) | 2 (15.4%) |
| 6:30 AM to 6:59 AM | 5 (19.2%) | 0 (0.0%) |
| 7:00 AM to 7:29 AM | 2 (7.7%) | 4 (30.8%) |
| 7:30 AM to 7:59 AM | 1 (3.8%) | 3 (23.1%) |
| 8:00 AM to 8:29 AM | 0 (0.0%) | 1 (7.7%) |
| 8:30 AM to 8:59 AM | 4 (15.4%) | 0 (0.0%) |
| 9:00 AM to 9:59 AM | 0 (0.0%) | 0 (0.0%) |
| 10:00 AM to 10:59 AM | 0 (0.0%) | 0 (0.0%) |
| 11:00 AM to 11:59 AM | 0 (0.0%) | 0 (0.0%) |
| 12:00 PM to 3:59 PM | 0 (0.0%) | 3 (23.1%) |
| 4:00 PM to 11:59 PM | 0 (0.0%) | 0 (0.0%) |
| Total | 26 (100.0%) | 13 (100.0%) |
Housing Occupancy in Virginia
Occupancy by Ownership in Virginia
Of the total 34 dwellings in Virginia, owner-occupied units account for 29 (85.3%), while renter-occupied units make up 5 (14.7%).
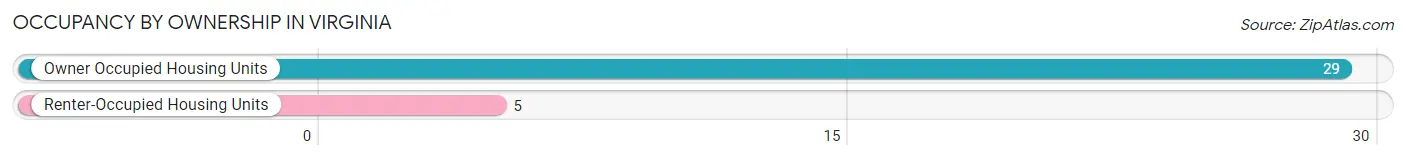
| Occupancy | # Housing Units | % Housing Units |
| Owner Occupied Housing Units | 29 | 85.3% |
| Renter-Occupied Housing Units | 5 | 14.7% |
| Total Occupied Housing Units | 34 | 100.0% |
Occupancy by Household Size in Virginia
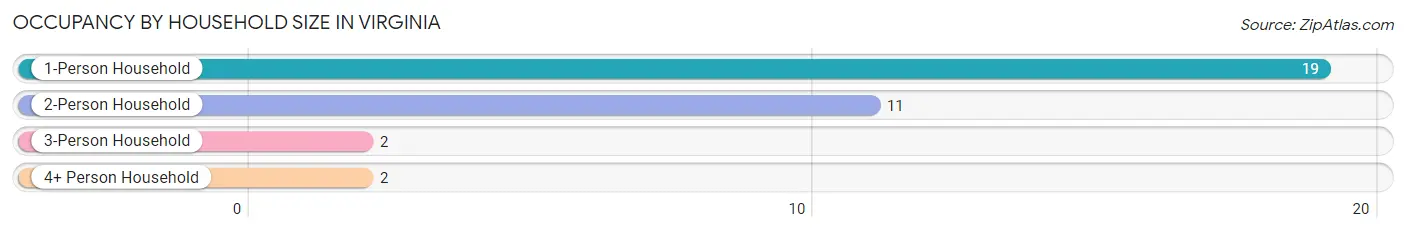
| Household Size | # Housing Units | % Housing Units |
| 1-Person Household | 19 | 55.9% |
| 2-Person Household | 11 | 32.4% |
| 3-Person Household | 2 | 5.9% |
| 4+ Person Household | 2 | 5.9% |
| Total Housing Units | 34 | 100.0% |
Occupancy by Ownership by Household Size in Virginia
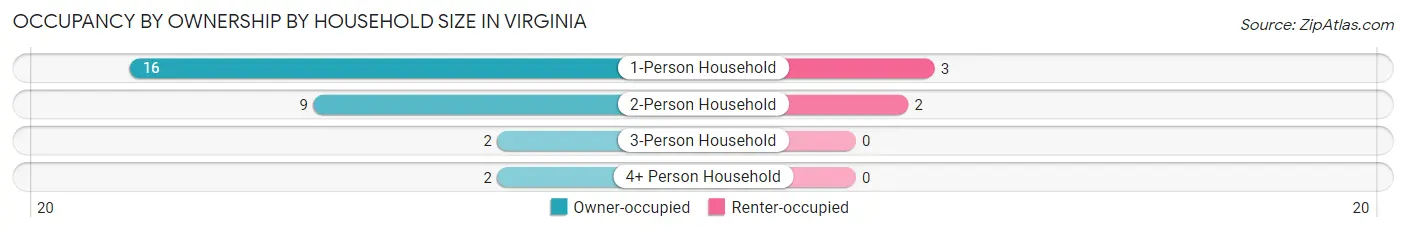
| Household Size | Owner-occupied | Renter-occupied |
| 1-Person Household | 16 (84.2%) | 3 (15.8%) |
| 2-Person Household | 9 (81.8%) | 2 (18.2%) |
| 3-Person Household | 2 (100.0%) | 0 (0.0%) |
| 4+ Person Household | 2 (100.0%) | 0 (0.0%) |
| Total Housing Units | 29 (85.3%) | 5 (14.7%) |
Occupancy by Educational Attainment in Virginia
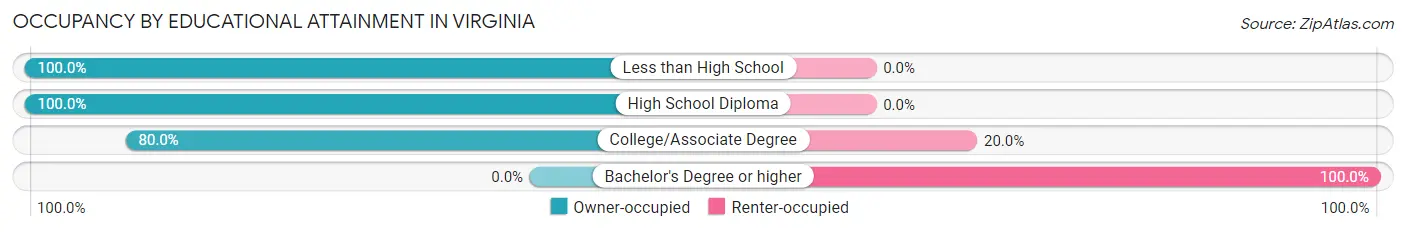
| Household Size | Owner-occupied | Renter-occupied |
| Less than High School | 2 (100.0%) | 0 (0.0%) |
| High School Diploma | 19 (100.0%) | 0 (0.0%) |
| College/Associate Degree | 8 (80.0%) | 2 (20.0%) |
| Bachelor's Degree or higher | 0 (0.0%) | 3 (100.0%) |
Occupancy by Age of Householder in Virginia
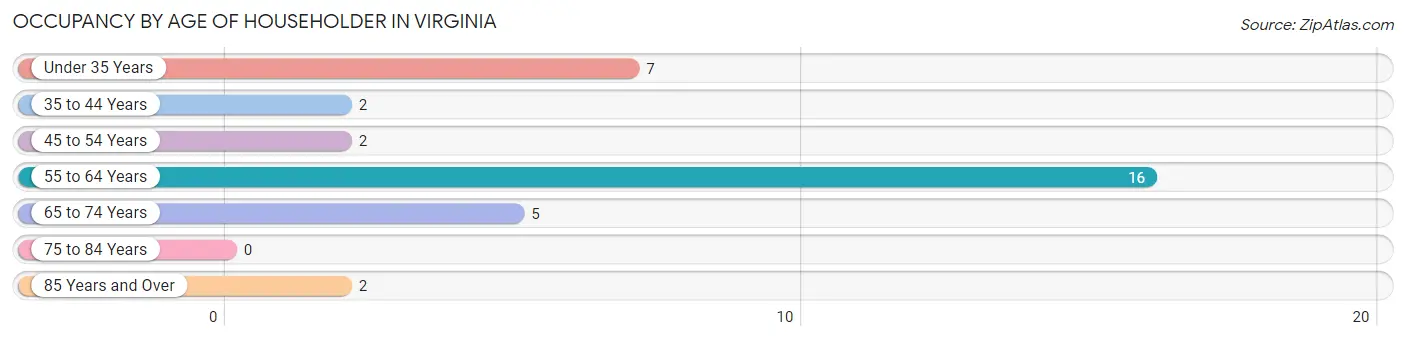
| Age Bracket | # Households | % Households |
| Under 35 Years | 7 | 20.6% |
| 35 to 44 Years | 2 | 5.9% |
| 45 to 54 Years | 2 | 5.9% |
| 55 to 64 Years | 16 | 47.1% |
| 65 to 74 Years | 5 | 14.7% |
| 75 to 84 Years | 0 | 0.0% |
| 85 Years and Over | 2 | 5.9% |
| Total | 34 | 100.0% |
Housing Finances in Virginia
Median Income by Occupancy in Virginia
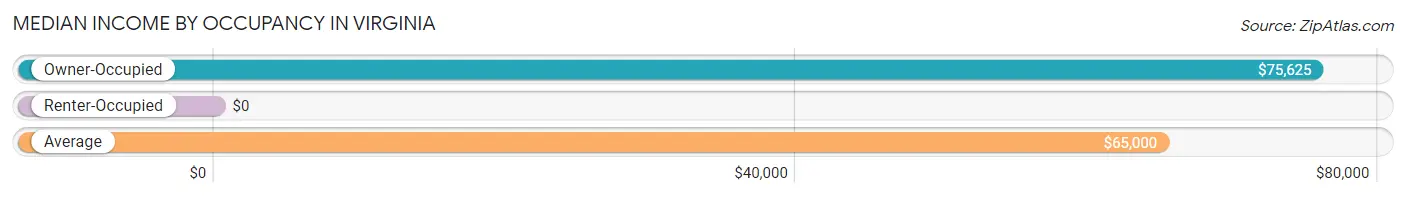
| Occupancy Type | # Households | Median Income |
| Owner-Occupied | 29 (85.3%) | $75,625 |
| Renter-Occupied | 5 (14.7%) | $0 |
| Average | 34 (100.0%) | $65,000 |
Occupancy by Householder Income Bracket in Virginia
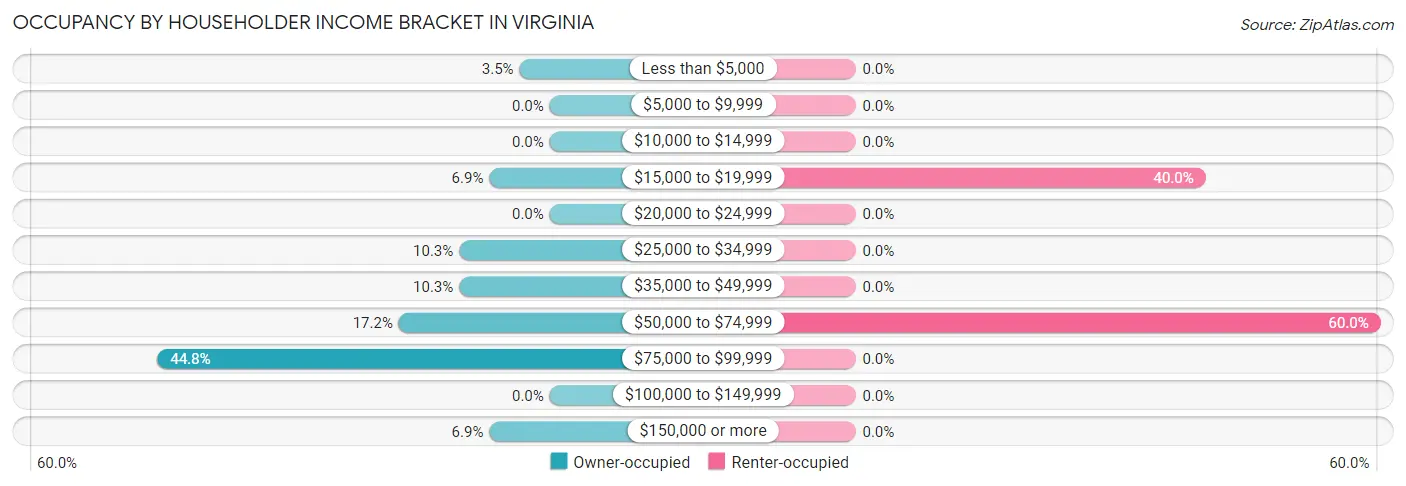
| Income Bracket | Owner-occupied | Renter-occupied |
| Less than $5,000 | 1 (3.5%) | 0 (0.0%) |
| $5,000 to $9,999 | 0 (0.0%) | 0 (0.0%) |
| $10,000 to $14,999 | 0 (0.0%) | 0 (0.0%) |
| $15,000 to $19,999 | 2 (6.9%) | 2 (40.0%) |
| $20,000 to $24,999 | 0 (0.0%) | 0 (0.0%) |
| $25,000 to $34,999 | 3 (10.3%) | 0 (0.0%) |
| $35,000 to $49,999 | 3 (10.3%) | 0 (0.0%) |
| $50,000 to $74,999 | 5 (17.2%) | 3 (60.0%) |
| $75,000 to $99,999 | 13 (44.8%) | 0 (0.0%) |
| $100,000 to $149,999 | 0 (0.0%) | 0 (0.0%) |
| $150,000 or more | 2 (6.9%) | 0 (0.0%) |
| Total | 29 (100.0%) | 5 (100.0%) |
Monthly Housing Cost Tiers in Virginia
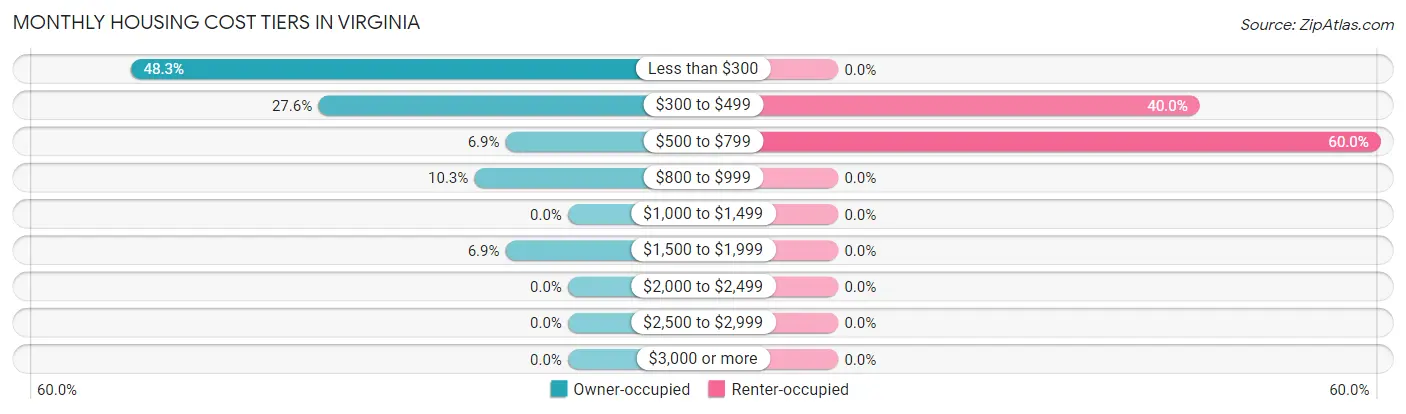
| Monthly Cost | Owner-occupied | Renter-occupied |
| Less than $300 | 14 (48.3%) | 0 (0.0%) |
| $300 to $499 | 8 (27.6%) | 2 (40.0%) |
| $500 to $799 | 2 (6.9%) | 3 (60.0%) |
| $800 to $999 | 3 (10.3%) | 0 (0.0%) |
| $1,000 to $1,499 | 0 (0.0%) | 0 (0.0%) |
| $1,500 to $1,999 | 2 (6.9%) | 0 (0.0%) |
| $2,000 to $2,499 | 0 (0.0%) | 0 (0.0%) |
| $2,500 to $2,999 | 0 (0.0%) | 0 (0.0%) |
| $3,000 or more | 0 (0.0%) | 0 (0.0%) |
| Total | 29 (100.0%) | 5 (100.0%) |
Physical Housing Characteristics in Virginia
Housing Structures in Virginia
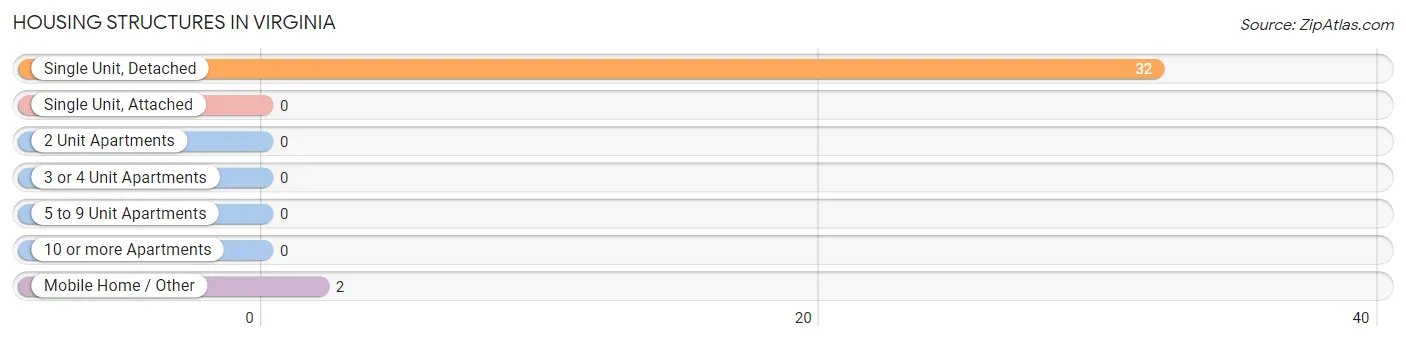
| Structure Type | # Housing Units | % Housing Units |
| Single Unit, Detached | 32 | 94.1% |
| Single Unit, Attached | 0 | 0.0% |
| 2 Unit Apartments | 0 | 0.0% |
| 3 or 4 Unit Apartments | 0 | 0.0% |
| 5 to 9 Unit Apartments | 0 | 0.0% |
| 10 or more Apartments | 0 | 0.0% |
| Mobile Home / Other | 2 | 5.9% |
| Total | 34 | 100.0% |
Housing Structures by Occupancy in Virginia
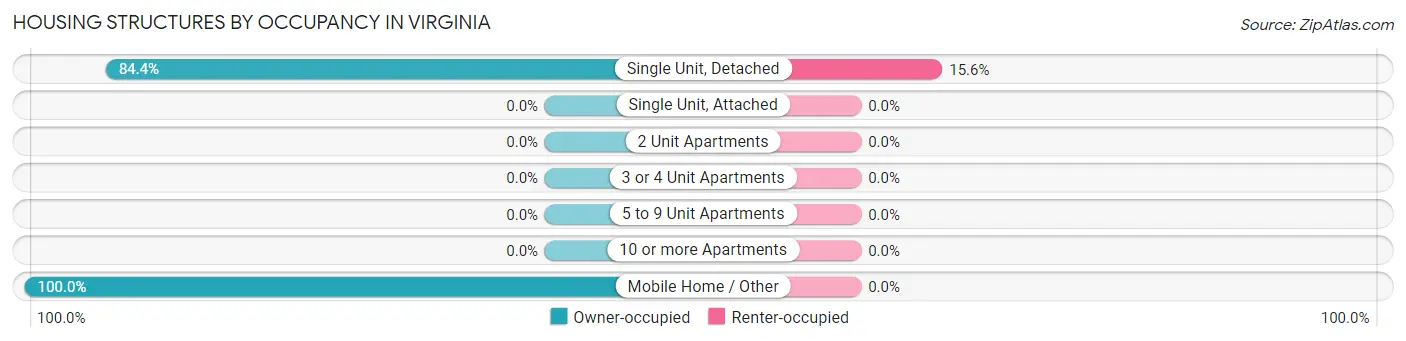
| Structure Type | Owner-occupied | Renter-occupied |
| Single Unit, Detached | 27 (84.4%) | 5 (15.6%) |
| Single Unit, Attached | 0 (0.0%) | 0 (0.0%) |
| 2 Unit Apartments | 0 (0.0%) | 0 (0.0%) |
| 3 or 4 Unit Apartments | 0 (0.0%) | 0 (0.0%) |
| 5 to 9 Unit Apartments | 0 (0.0%) | 0 (0.0%) |
| 10 or more Apartments | 0 (0.0%) | 0 (0.0%) |
| Mobile Home / Other | 2 (100.0%) | 0 (0.0%) |
| Total | 29 (85.3%) | 5 (14.7%) |
Housing Structures by Number of Rooms in Virginia
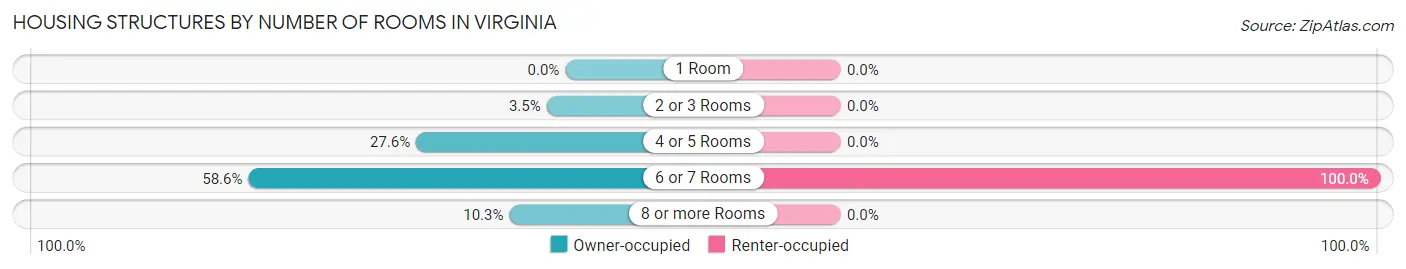
| Number of Rooms | Owner-occupied | Renter-occupied |
| 1 Room | 0 (0.0%) | 0 (0.0%) |
| 2 or 3 Rooms | 1 (3.5%) | 0 (0.0%) |
| 4 or 5 Rooms | 8 (27.6%) | 0 (0.0%) |
| 6 or 7 Rooms | 17 (58.6%) | 5 (100.0%) |
| 8 or more Rooms | 3 (10.3%) | 0 (0.0%) |
| Total | 29 (100.0%) | 5 (100.0%) |
Housing Structure by Heating Type in Virginia
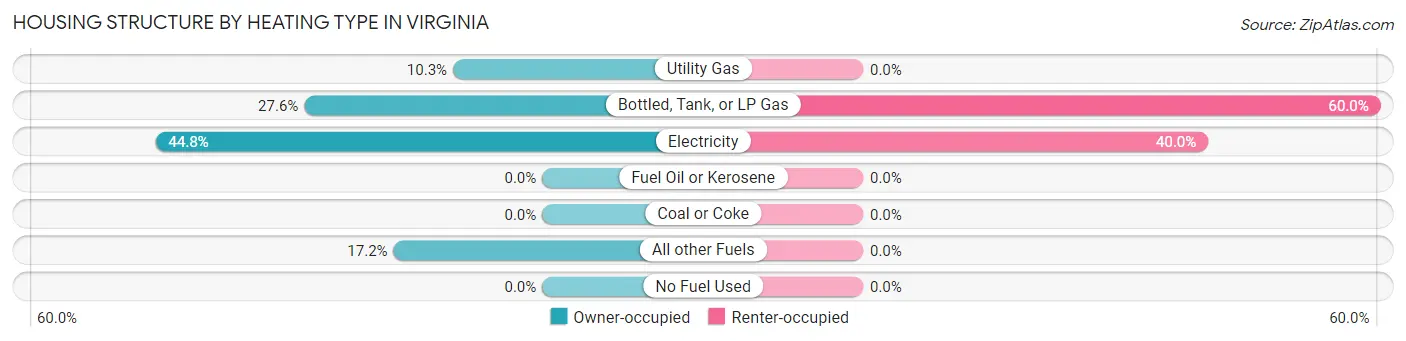
| Heating Type | Owner-occupied | Renter-occupied |
| Utility Gas | 3 (10.3%) | 0 (0.0%) |
| Bottled, Tank, or LP Gas | 8 (27.6%) | 3 (60.0%) |
| Electricity | 13 (44.8%) | 2 (40.0%) |
| Fuel Oil or Kerosene | 0 (0.0%) | 0 (0.0%) |
| Coal or Coke | 0 (0.0%) | 0 (0.0%) |
| All other Fuels | 5 (17.2%) | 0 (0.0%) |
| No Fuel Used | 0 (0.0%) | 0 (0.0%) |
| Total | 29 (100.0%) | 5 (100.0%) |
Household Vehicle Usage in Virginia
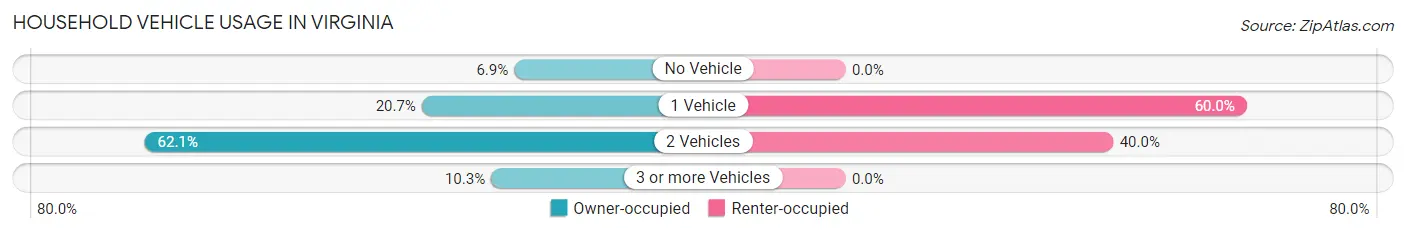
| Vehicles per Household | Owner-occupied | Renter-occupied |
| No Vehicle | 2 (6.9%) | 0 (0.0%) |
| 1 Vehicle | 6 (20.7%) | 3 (60.0%) |
| 2 Vehicles | 18 (62.1%) | 2 (40.0%) |
| 3 or more Vehicles | 3 (10.3%) | 0 (0.0%) |
| Total | 29 (100.0%) | 5 (100.0%) |
Real Estate & Mortgages in Virginia
Real Estate and Mortgage Overview in Virginia
| Characteristic | Without Mortgage | With Mortgage |
| Housing Units | 22 | 7 |
| Median Property Value | - | - |
| Median Household Income | $81,250 | $0 |
| Monthly Housing Costs | $283 | $0 |
| Real Estate Taxes | $455 | $0 |
Property Value by Mortgage Status in Virginia
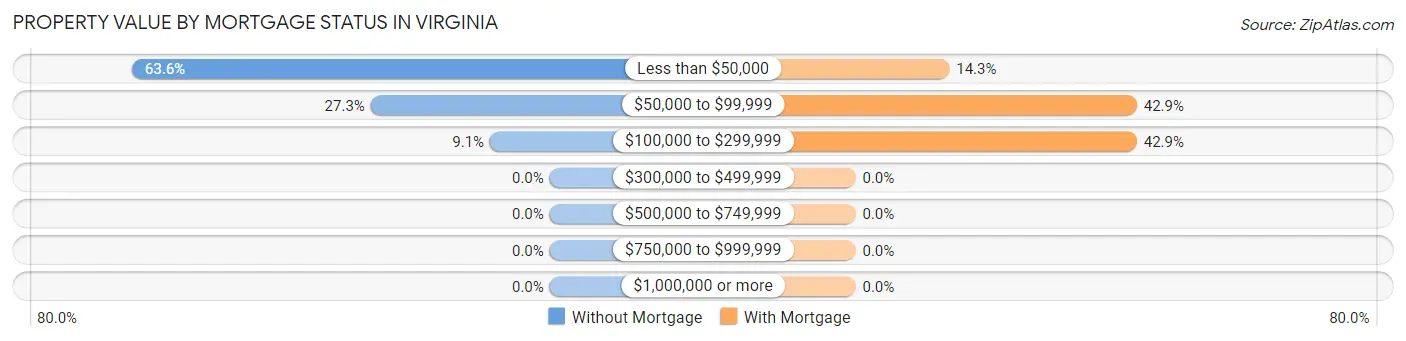
| Property Value | Without Mortgage | With Mortgage |
| Less than $50,000 | 14 (63.6%) | 1 (14.3%) |
| $50,000 to $99,999 | 6 (27.3%) | 3 (42.9%) |
| $100,000 to $299,999 | 2 (9.1%) | 3 (42.9%) |
| $300,000 to $499,999 | 0 (0.0%) | 0 (0.0%) |
| $500,000 to $749,999 | 0 (0.0%) | 0 (0.0%) |
| $750,000 to $999,999 | 0 (0.0%) | 0 (0.0%) |
| $1,000,000 or more | 0 (0.0%) | 0 (0.0%) |
| Total | 22 (100.0%) | 7 (100.0%) |
Household Income by Mortgage Status in Virginia
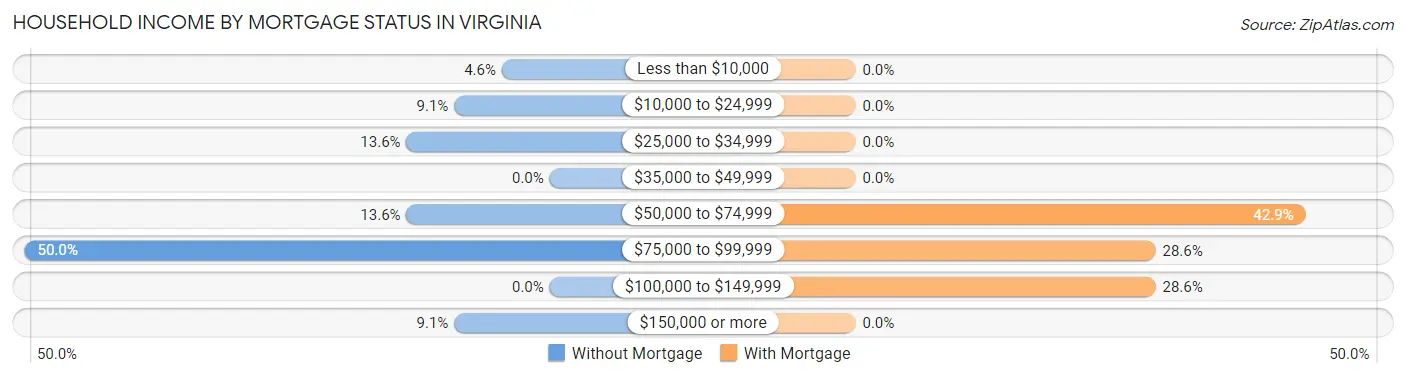
| Household Income | Without Mortgage | With Mortgage |
| Less than $10,000 | 1 (4.5%) | 0 (0.0%) |
| $10,000 to $24,999 | 2 (9.1%) | 0 (0.0%) |
| $25,000 to $34,999 | 3 (13.6%) | 0 (0.0%) |
| $35,000 to $49,999 | 0 (0.0%) | 0 (0.0%) |
| $50,000 to $74,999 | 3 (13.6%) | 3 (42.9%) |
| $75,000 to $99,999 | 11 (50.0%) | 2 (28.6%) |
| $100,000 to $149,999 | 0 (0.0%) | 2 (28.6%) |
| $150,000 or more | 2 (9.1%) | 0 (0.0%) |
| Total | 22 (100.0%) | 7 (100.0%) |
Property Value to Household Income Ratio in Virginia
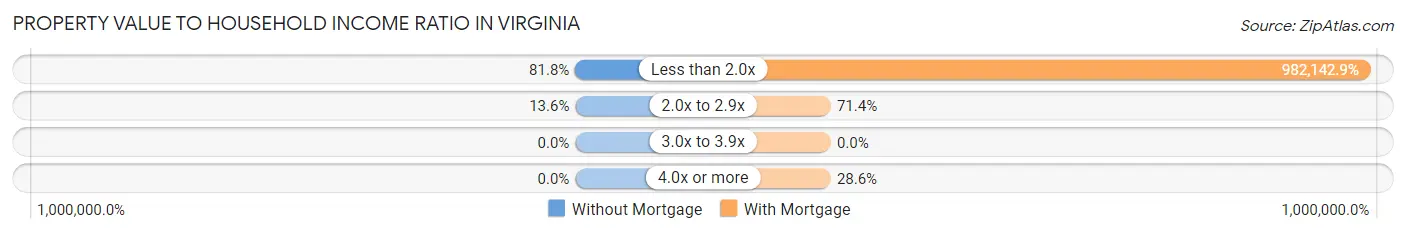
| Value-to-Income Ratio | Without Mortgage | With Mortgage |
| Less than 2.0x | 18 (81.8%) | 68,750 (982,142.9%) |
| 2.0x to 2.9x | 3 (13.6%) | 5 (71.4%) |
| 3.0x to 3.9x | 0 (0.0%) | 0 (0.0%) |
| 4.0x or more | 0 (0.0%) | 2 (28.6%) |
| Total | 22 (100.0%) | 7 (100.0%) |
Real Estate Taxes by Mortgage Status in Virginia
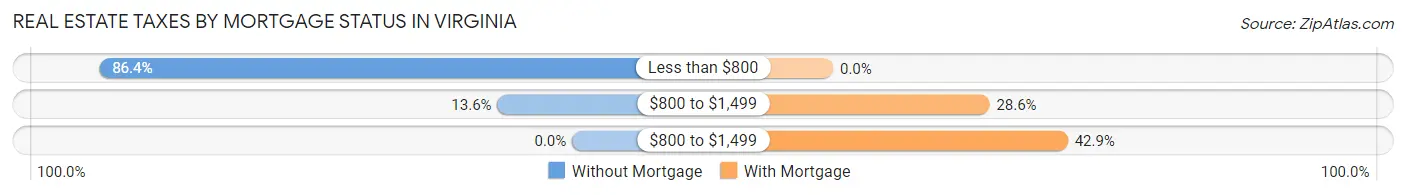
| Property Taxes | Without Mortgage | With Mortgage |
| Less than $800 | 19 (86.4%) | 0 (0.0%) |
| $800 to $1,499 | 3 (13.6%) | 2 (28.6%) |
| $800 to $1,499 | 0 (0.0%) | 3 (42.9%) |
| Total | 22 (100.0%) | 7 (100.0%) |
Health & Disability in Virginia
Health Insurance Coverage by Age in Virginia
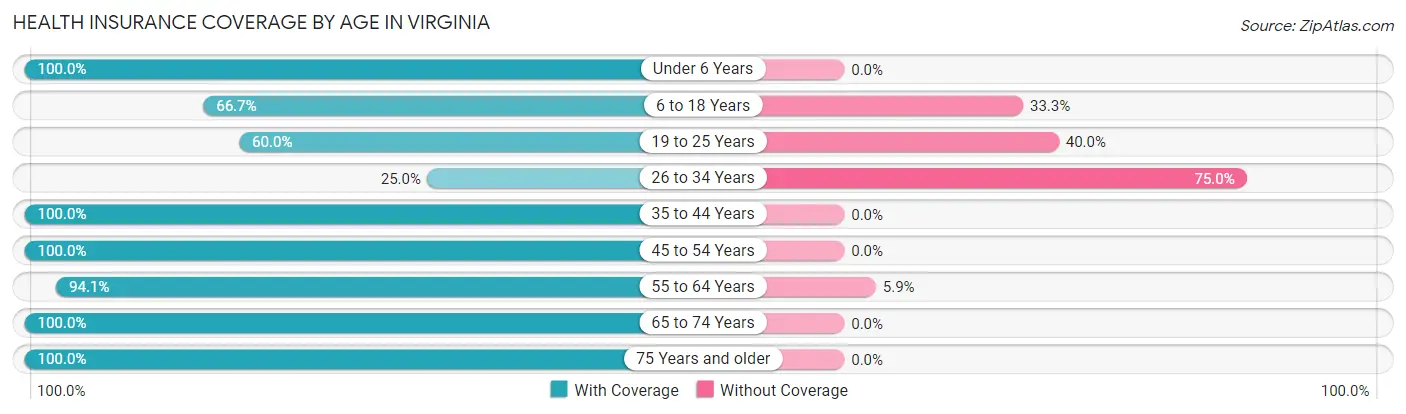
| Age Bracket | With Coverage | Without Coverage |
| Under 6 Years | 8 (100.0%) | 0 (0.0%) |
| 6 to 18 Years | 4 (66.7%) | 2 (33.3%) |
| 19 to 25 Years | 3 (60.0%) | 2 (40.0%) |
| 26 to 34 Years | 1 (25.0%) | 3 (75.0%) |
| 35 to 44 Years | 4 (100.0%) | 0 (0.0%) |
| 45 to 54 Years | 4 (100.0%) | 0 (0.0%) |
| 55 to 64 Years | 16 (94.1%) | 1 (5.9%) |
| 65 to 74 Years | 8 (100.0%) | 0 (0.0%) |
| 75 Years and older | 6 (100.0%) | 0 (0.0%) |
| Total | 54 (87.1%) | 8 (12.9%) |
Health Insurance Coverage by Citizenship Status in Virginia
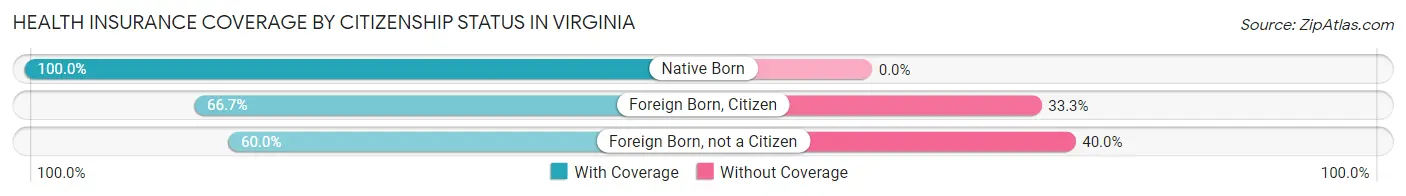
| Citizenship Status | With Coverage | Without Coverage |
| Native Born | 8 (100.0%) | 0 (0.0%) |
| Foreign Born, Citizen | 4 (66.7%) | 2 (33.3%) |
| Foreign Born, not a Citizen | 3 (60.0%) | 2 (40.0%) |
Health Insurance Coverage by Household Income in Virginia
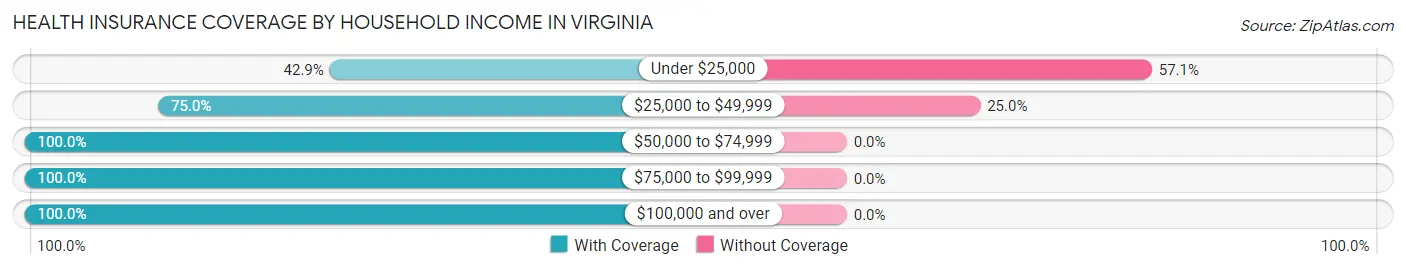
| Household Income | With Coverage | Without Coverage |
| Under $25,000 | 3 (42.9%) | 4 (57.1%) |
| $25,000 to $49,999 | 12 (75.0%) | 4 (25.0%) |
| $50,000 to $74,999 | 18 (100.0%) | 0 (0.0%) |
| $75,000 to $99,999 | 17 (100.0%) | 0 (0.0%) |
| $100,000 and over | 4 (100.0%) | 0 (0.0%) |
Public vs Private Health Insurance Coverage by Age in Virginia
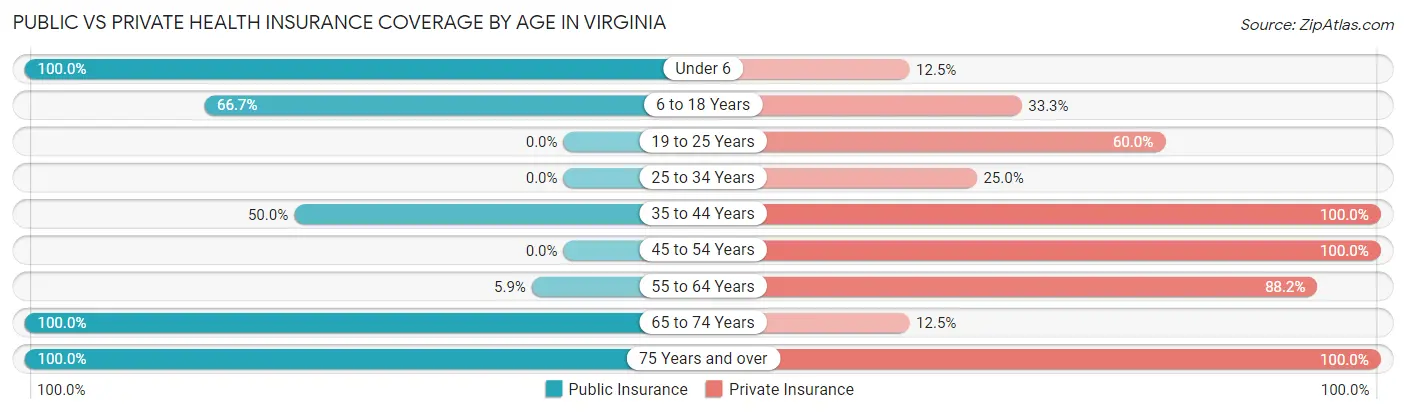
| Age Bracket | Public Insurance | Private Insurance |
| Under 6 | 8 (100.0%) | 1 (12.5%) |
| 6 to 18 Years | 4 (66.7%) | 2 (33.3%) |
| 19 to 25 Years | 0 (0.0%) | 3 (60.0%) |
| 25 to 34 Years | 0 (0.0%) | 1 (25.0%) |
| 35 to 44 Years | 2 (50.0%) | 4 (100.0%) |
| 45 to 54 Years | 0 (0.0%) | 4 (100.0%) |
| 55 to 64 Years | 1 (5.9%) | 15 (88.2%) |
| 65 to 74 Years | 8 (100.0%) | 1 (12.5%) |
| 75 Years and over | 6 (100.0%) | 6 (100.0%) |
| Total | 29 (46.8%) | 37 (59.7%) |
Disability Status by Sex by Age in Virginia
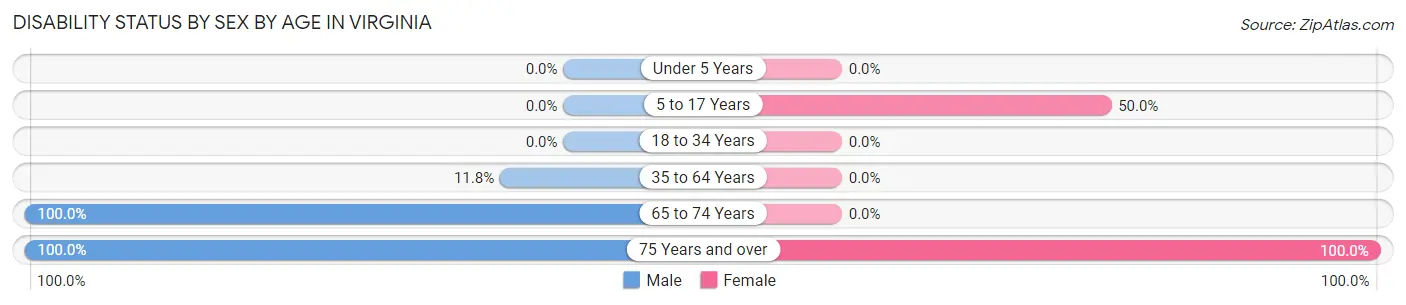
| Age Bracket | Male | Female |
| Under 5 Years | 0 (0.0%) | 0 (0.0%) |
| 5 to 17 Years | 0 (0.0%) | 2 (50.0%) |
| 18 to 34 Years | 0 (0.0%) | 0 (0.0%) |
| 35 to 64 Years | 2 (11.8%) | 0 (0.0%) |
| 65 to 74 Years | 2 (100.0%) | 0 (0.0%) |
| 75 Years and over | 4 (100.0%) | 2 (100.0%) |
Disability Class by Sex by Age in Virginia
Disability Class: Hearing Difficulty
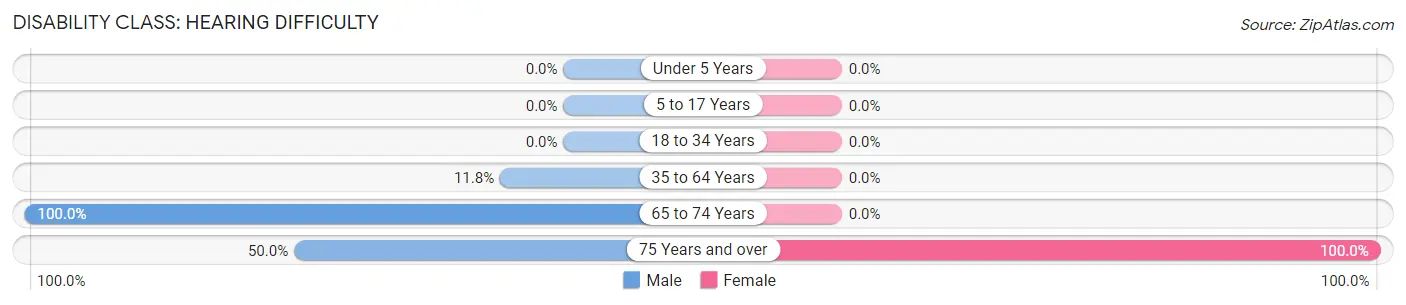
| Age Bracket | Male | Female |
| Under 5 Years | 0 (0.0%) | 0 (0.0%) |
| 5 to 17 Years | 0 (0.0%) | 0 (0.0%) |
| 18 to 34 Years | 0 (0.0%) | 0 (0.0%) |
| 35 to 64 Years | 2 (11.8%) | 0 (0.0%) |
| 65 to 74 Years | 2 (100.0%) | 0 (0.0%) |
| 75 Years and over | 2 (50.0%) | 2 (100.0%) |
Disability Class: Vision Difficulty
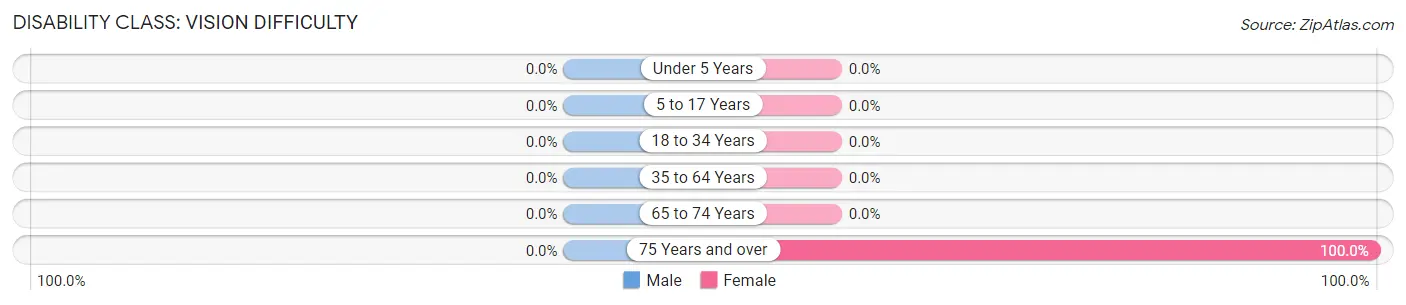
| Age Bracket | Male | Female |
| Under 5 Years | 0 (0.0%) | 0 (0.0%) |
| 5 to 17 Years | 0 (0.0%) | 0 (0.0%) |
| 18 to 34 Years | 0 (0.0%) | 0 (0.0%) |
| 35 to 64 Years | 0 (0.0%) | 0 (0.0%) |
| 65 to 74 Years | 0 (0.0%) | 0 (0.0%) |
| 75 Years and over | 0 (0.0%) | 2 (100.0%) |
Disability Class: Cognitive Difficulty

| Age Bracket | Male | Female |
| 5 to 17 Years | 0 (0.0%) | 0 (0.0%) |
| 18 to 34 Years | 0 (0.0%) | 0 (0.0%) |
| 35 to 64 Years | 0 (0.0%) | 0 (0.0%) |
| 65 to 74 Years | 0 (0.0%) | 0 (0.0%) |
| 75 Years and over | 2 (50.0%) | 2 (100.0%) |
Disability Class: Ambulatory Difficulty
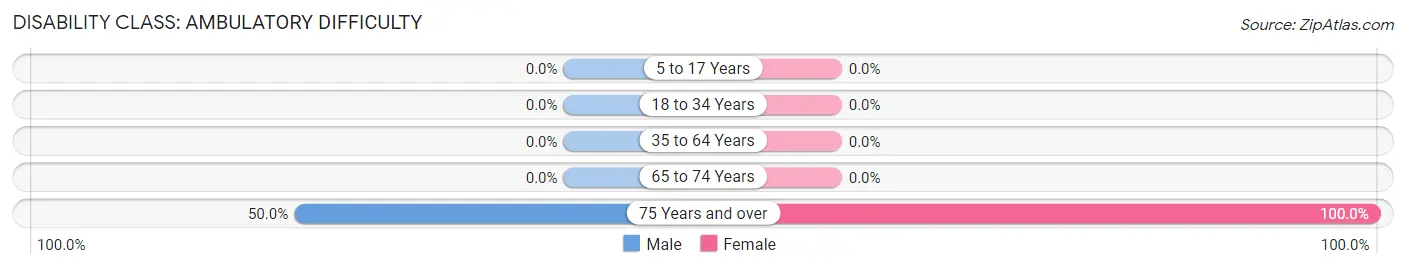
| Age Bracket | Male | Female |
| 5 to 17 Years | 0 (0.0%) | 0 (0.0%) |
| 18 to 34 Years | 0 (0.0%) | 0 (0.0%) |
| 35 to 64 Years | 0 (0.0%) | 0 (0.0%) |
| 65 to 74 Years | 0 (0.0%) | 0 (0.0%) |
| 75 Years and over | 2 (50.0%) | 2 (100.0%) |
Disability Class: Self-Care Difficulty
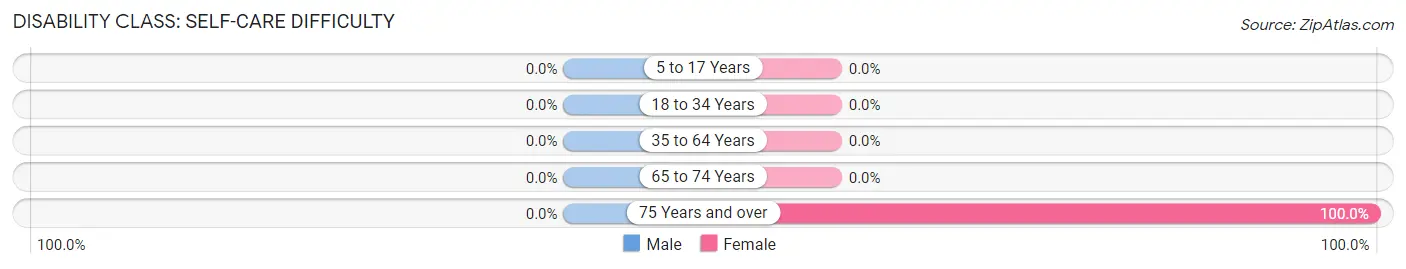
| Age Bracket | Male | Female |
| 5 to 17 Years | 0 (0.0%) | 0 (0.0%) |
| 18 to 34 Years | 0 (0.0%) | 0 (0.0%) |
| 35 to 64 Years | 0 (0.0%) | 0 (0.0%) |
| 65 to 74 Years | 0 (0.0%) | 0 (0.0%) |
| 75 Years and over | 0 (0.0%) | 2 (100.0%) |
Technology Access in Virginia
Computing Device Access in Virginia
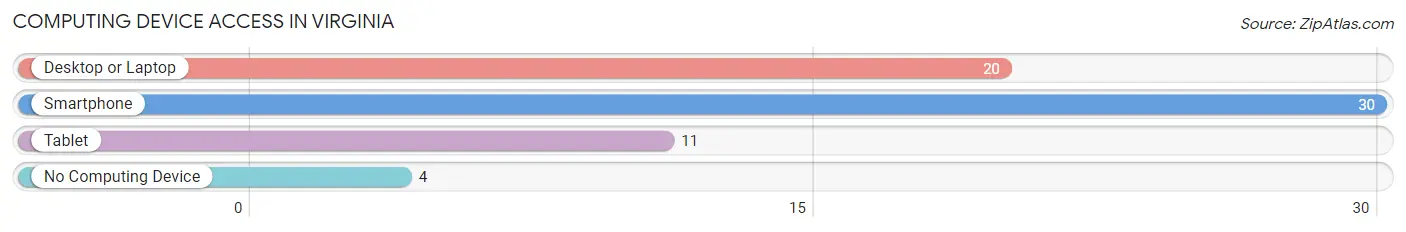
| Device Type | # Households | % Households |
| Desktop or Laptop | 20 | 58.8% |
| Smartphone | 30 | 88.2% |
| Tablet | 11 | 32.4% |
| No Computing Device | 4 | 11.8% |
| Total | 34 | 100.0% |
Internet Access in Virginia
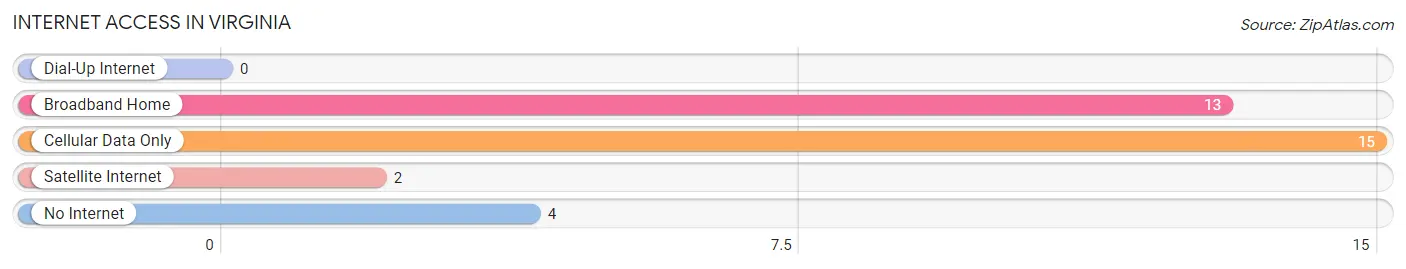
| Internet Type | # Households | % Households |
| Dial-Up Internet | 0 | 0.0% |
| Broadband Home | 13 | 38.2% |
| Cellular Data Only | 15 | 44.1% |
| Satellite Internet | 2 | 5.9% |
| No Internet | 4 | 11.8% |
| Total | 34 | 100.0% |
Virginia Summary
Virginia is a state located in the Mid-Atlantic region of the United States. It is bordered by Maryland to the northeast, the Atlantic Ocean to the east, North Carolina and Tennessee to the south, and West Virginia to the southwest and Kentucky to the west. Virginia is the 12th most populous state in the United States, with an estimated population of 8.5 million in 2019. It is the 35th largest state in terms of land area, with an area of 42,774 square miles.
Geography
Virginia is divided into five distinct geographic regions: the Blue Ridge Mountains, the Piedmont Plateau, the Appalachian Plateau, the Coastal Plain, and the Tidewater. The Blue Ridge Mountains are located in the western part of the state and are part of the Appalachian Mountains. The highest point in the state is Mount Rogers, which is located in the Blue Ridge Mountains and has an elevation of 5,729 feet. The Piedmont Plateau is located in the central part of the state and is characterized by rolling hills and valleys. The Appalachian Plateau is located in the southwestern part of the state and is characterized by steep, rugged terrain. The Coastal Plain is located in the eastern part of the state and is characterized by flat, low-lying land. The Tidewater region is located in the southeastern part of the state and is characterized by flat, low-lying land and numerous rivers and estuaries.
Economy
Virginia has a diverse economy that is driven by a variety of industries. The state’s largest industries include government, agriculture, manufacturing, and services. The government sector is the largest employer in the state, employing over one million people. The state’s agricultural sector is the second largest employer, employing over 200,000 people. The manufacturing sector is the third largest employer, employing over 150,000 people. The services sector is the fourth largest employer, employing over 100,000 people.
Demographics
As of 2019, the population of Virginia was estimated to be 8.5 million. The racial makeup of the state was 68.7% White, 19.7% Black or African American, 6.7% Hispanic or Latino, 2.2% Asian, 0.3% Native American, and 2.2% other. The median household income in the state was $68,867 in 2019. The median age in the state was 38.2 years in 2019.
Conclusion
Virginia is a state located in the Mid-Atlantic region of the United States. It is bordered by Maryland to the northeast, the Atlantic Ocean to the east, North Carolina and Tennessee to the south, and West Virginia to the southwest and Kentucky to the west. Virginia is divided into five distinct geographic regions: the Blue Ridge Mountains, the Piedmont Plateau, the Appalachian Plateau, the Coastal Plain, and the Tidewater. The state’s economy is driven by a variety of industries, including government, agriculture, manufacturing, and services. As of 2019, the population of Virginia was estimated to be 8.5 million, with a median household income of $68,867 and a median age of 38.2 years.
Common Questions
What is the Total Population of Virginia?
Total Population of Virginia is 62.
What is the Total Male Population of Virginia?
Total Male Population of Virginia is 36.
What is the Total Female Population of Virginia?
Total Female Population of Virginia is 26.
What is the Ratio of Males per 100 Females in Virginia?
There are 138.46 Males per 100 Females in Virginia.
What is the Ratio of Females per 100 Males in Virginia?
There are 72.22 Females per 100 Males in Virginia.
What is the Median Population Age in Virginia?
Median Population Age in Virginia is 54.5 Years.
What is the Average Family Size in Virginia
Average Family Size in Virginia is 3.0 People.
What is the Average Household Size in Virginia
Average Household Size in Virginia is 1.8 People.
What is Per Capita Income in Virginia?
Per Capita income in Virginia is $37,039.
What is the Median Family Income in Virginia?
Median Family Income in Virginia is $68,750.
What is the Median Household income in Virginia?
Median Household Income in Virginia is $65,000.
What is Income or Wage Gap in Virginia?
Income or Wage Gap in Virginia is 67.0%.
Women in Virginia earn 33.0 cents for every dollar earned by a man.
What is Inequality or Gini Index in Virginia?
Inequality or Gini Index in Virginia is 0.30.
How Large is the Labor Force in Virginia?
There are 39 People in the Labor Forcein in Virginia.
What is the Percentage of People in the Labor Force in Virginia?
75.0% of People are in the Labor Force in Virginia.