Kenesaw, NE
Kenesaw Map
Kenesaw Overview
826
TOTAL POPULATION
429
MALE POPULATION
397
FEMALE POPULATION
108.06
MALES / 100 FEMALES
92.54
FEMALES / 100 MALES
45.5
MEDIAN AGE
2.9
AVG FAMILY SIZE
2.5
AVG HOUSEHOLD SIZE
$34,923
PER CAPITA INCOME
$82,250
AVG FAMILY INCOME
$77,321
AVG HOUSEHOLD INCOME
41.2%
WAGE / INCOME GAP [ % ]
58.8¢/ $1
WAGE / INCOME GAP [ $ ]
0.37
INEQUALITY / GINI INDEX
405
LABOR FORCE [ PEOPLE ]
60.6%
PERCENT IN LABOR FORCE
3.5%
UNEMPLOYMENT RATE
Kenesaw Zip Codes
Kenesaw Area Codes
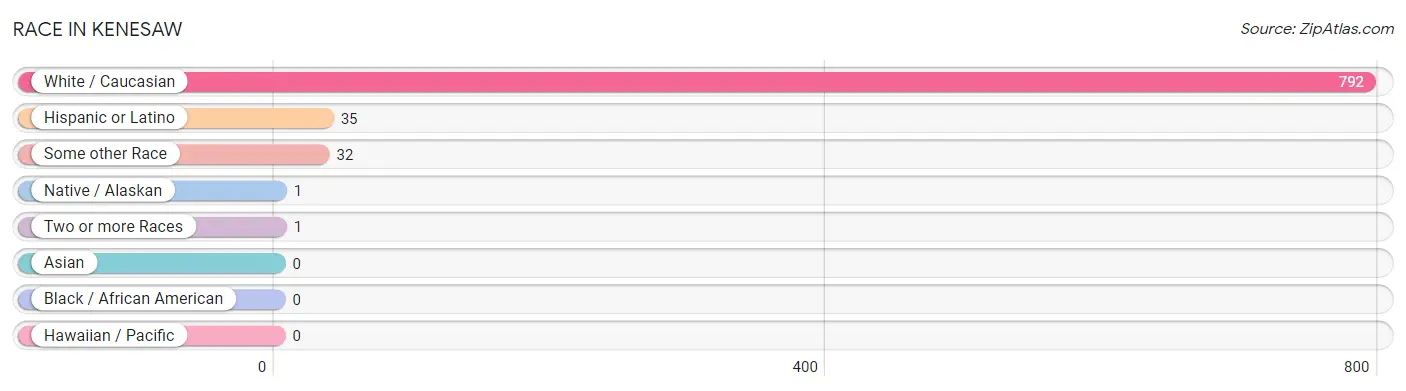
Race in Kenesaw
The most populous races in Kenesaw are White / Caucasian (792 | 95.9%), Hispanic or Latino (35 | 4.2%), and Some other Race (32 | 3.9%).
| Race | # Population | % Population |
| Asian | 0 | 0.0% |
| Black / African American | 0 | 0.0% |
| Hawaiian / Pacific | 0 | 0.0% |
| Hispanic or Latino | 35 | 4.2% |
| Native / Alaskan | 1 | 0.1% |
| White / Caucasian | 792 | 95.9% |
| Two or more Races | 1 | 0.1% |
| Some other Race | 32 | 3.9% |
| Total | 826 | 100.0% |
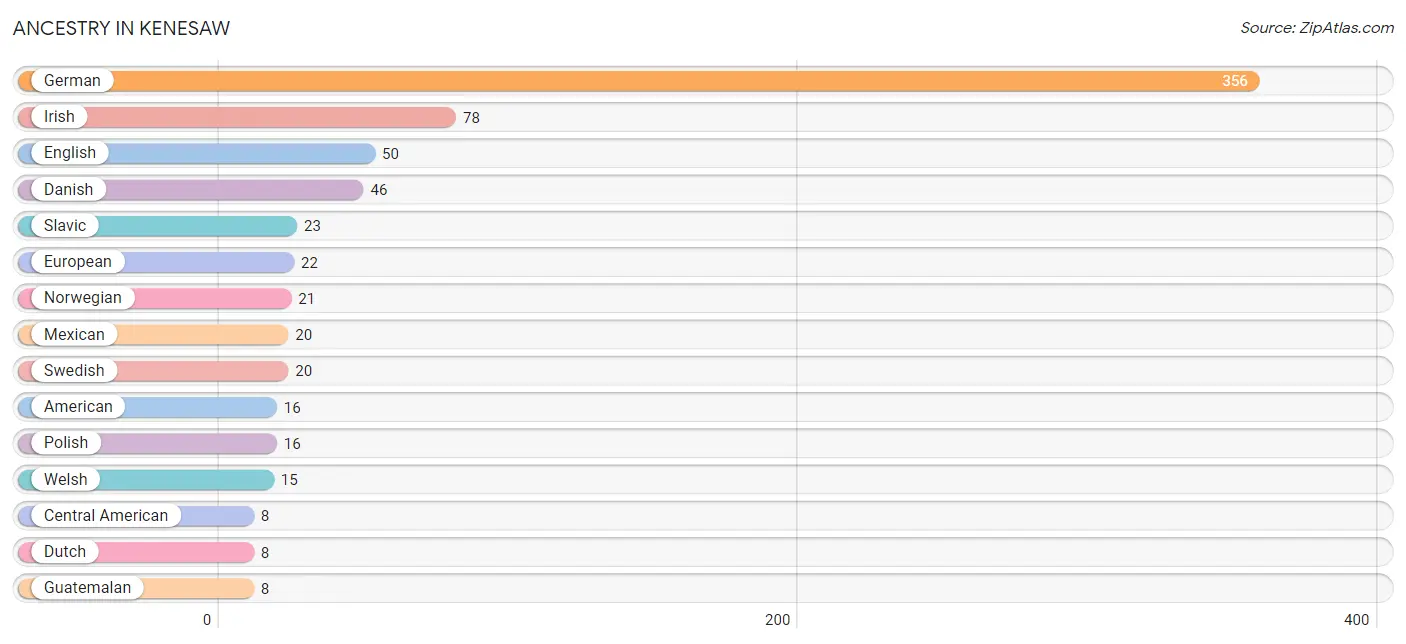
Ancestry in Kenesaw
The most populous ancestries reported in Kenesaw are German (356 | 43.1%), Irish (78 | 9.4%), English (50 | 6.0%), Danish (46 | 5.6%), and Slavic (23 | 2.8%), together accounting for 66.9% of all Kenesaw residents.
| Ancestry | # Population | % Population |
| American | 16 | 1.9% |
| Belgian | 2 | 0.2% |
| British | 3 | 0.4% |
| Central American | 8 | 1.0% |
| Cherokee | 1 | 0.1% |
| Cuban | 3 | 0.4% |
| Czech | 4 | 0.5% |
| Danish | 46 | 5.6% |
| Dutch | 8 | 1.0% |
| English | 50 | 6.0% |
| European | 22 | 2.7% |
| German | 356 | 43.1% |
| Guatemalan | 8 | 1.0% |
| Irish | 78 | 9.4% |
| Italian | 8 | 1.0% |
| Mexican | 20 | 2.4% |
| Norwegian | 21 | 2.5% |
| Polish | 16 | 1.9% |
| Romanian | 4 | 0.5% |
| Scotch-Irish | 4 | 0.5% |
| Scottish | 5 | 0.6% |
| Serbian | 1 | 0.1% |
| Sioux | 1 | 0.1% |
| Slavic | 23 | 2.8% |
| Swedish | 20 | 2.4% |
| Welsh | 15 | 1.8% | View All 26 Rows |
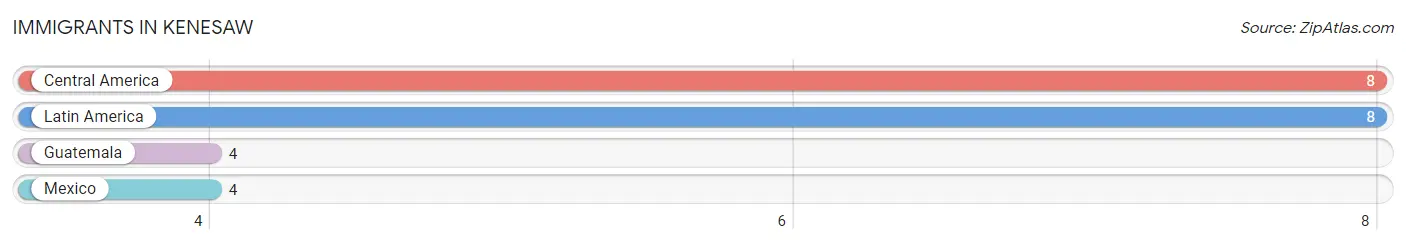
Immigrants in Kenesaw
The most numerous immigrant groups reported in Kenesaw came from Central America (8 | 1.0%), Latin America (8 | 1.0%), Guatemala (4 | 0.5%), and Mexico (4 | 0.5%), together accounting for 2.9% of all Kenesaw residents.
| Immigration Origin | # Population | % Population |
| Central America | 8 | 1.0% |
| Guatemala | 4 | 0.5% |
| Latin America | 8 | 1.0% |
| Mexico | 4 | 0.5% | View All 4 Rows |
Sex and Age in Kenesaw
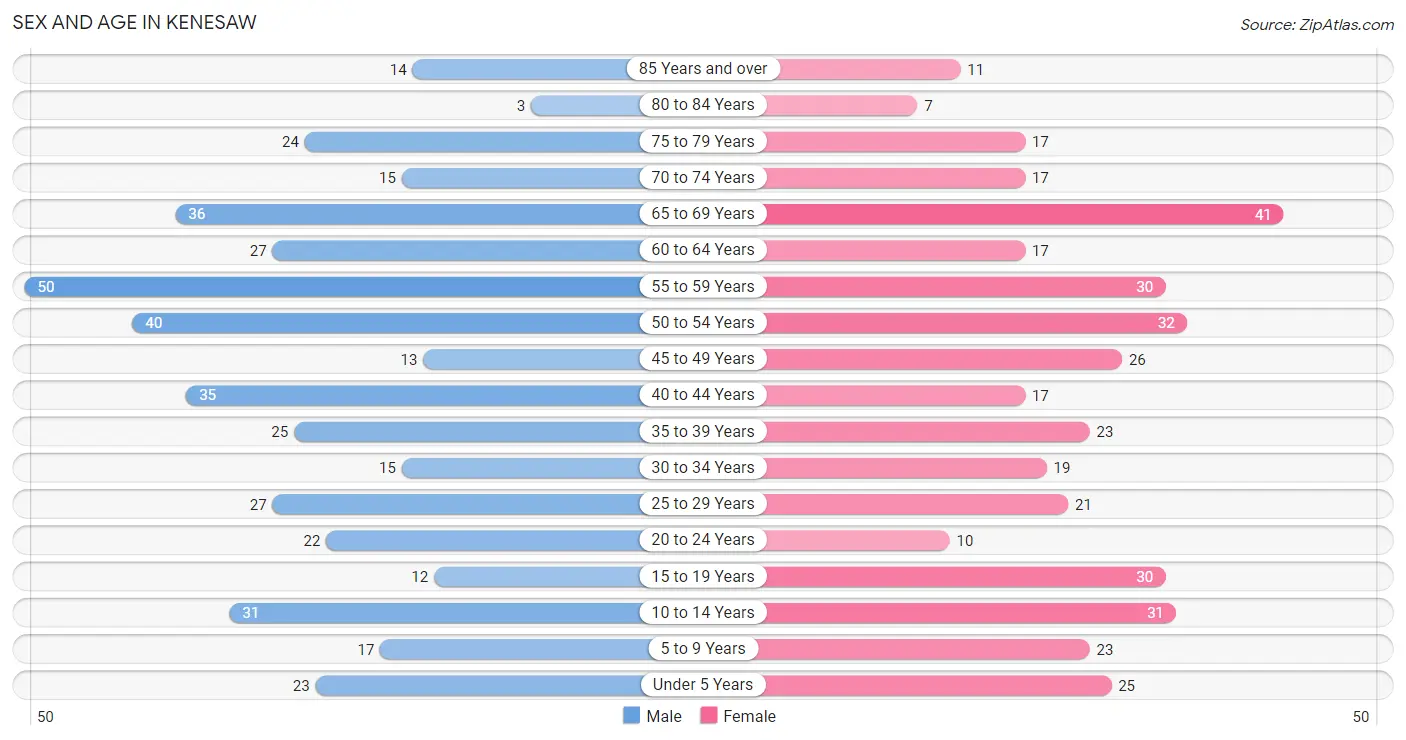
Sex and Age in Kenesaw
The most populous age groups in Kenesaw are 55 to 59 Years (50 | 11.7%) for men and 65 to 69 Years (41 | 10.3%) for women.
| Age Bracket | Male | Female |
| Under 5 Years | 23 (5.4%) | 25 (6.3%) |
| 5 to 9 Years | 17 (4.0%) | 23 (5.8%) |
| 10 to 14 Years | 31 (7.2%) | 31 (7.8%) |
| 15 to 19 Years | 12 (2.8%) | 30 (7.6%) |
| 20 to 24 Years | 22 (5.1%) | 10 (2.5%) |
| 25 to 29 Years | 27 (6.3%) | 21 (5.3%) |
| 30 to 34 Years | 15 (3.5%) | 19 (4.8%) |
| 35 to 39 Years | 25 (5.8%) | 23 (5.8%) |
| 40 to 44 Years | 35 (8.2%) | 17 (4.3%) |
| 45 to 49 Years | 13 (3.0%) | 26 (6.6%) |
| 50 to 54 Years | 40 (9.3%) | 32 (8.1%) |
| 55 to 59 Years | 50 (11.7%) | 30 (7.6%) |
| 60 to 64 Years | 27 (6.3%) | 17 (4.3%) |
| 65 to 69 Years | 36 (8.4%) | 41 (10.3%) |
| 70 to 74 Years | 15 (3.5%) | 17 (4.3%) |
| 75 to 79 Years | 24 (5.6%) | 17 (4.3%) |
| 80 to 84 Years | 3 (0.7%) | 7 (1.8%) |
| 85 Years and over | 14 (3.3%) | 11 (2.8%) |
| Total | 429 (100.0%) | 397 (100.0%) |
Families and Households in Kenesaw
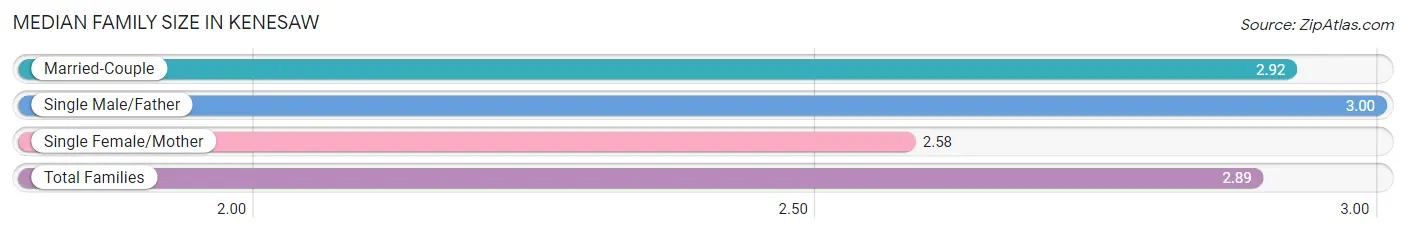
Median Family Size in Kenesaw
The median family size in Kenesaw is 2.89 persons per family, with single male/father families (8 | 3.5%) accounting for the largest median family size of 3 persons per family. On the other hand, single female/mother families (24 | 10.6%) represent the smallest median family size with 2.58 persons per family.
| Family Type | # Families | Family Size |
| Married-Couple | 194 (85.8%) | 2.92 |
| Single Male/Father | 8 (3.5%) | 3.00 |
| Single Female/Mother | 24 (10.6%) | 2.58 |
| Total Families | 226 (100.0%) | 2.89 |
Median Household Size in Kenesaw
The median household size in Kenesaw is 2.48 persons per household, with single male/father households (8 | 2.5%) accounting for the largest median household size of 3.75 persons per household. non-family households (89 | 28.2%) represent the smallest median household size with 1.08 persons per household.

| Household Type | # Households | Household Size |
| Married-Couple | 194 (61.6%) | 2.98 |
| Single Male/Father | 8 (2.5%) | 3.75 |
| Single Female/Mother | 24 (7.6%) | 3.13 |
| Non-family | 89 (28.2%) | 1.08 |
| Total Households | 315 (100.0%) | 2.48 |
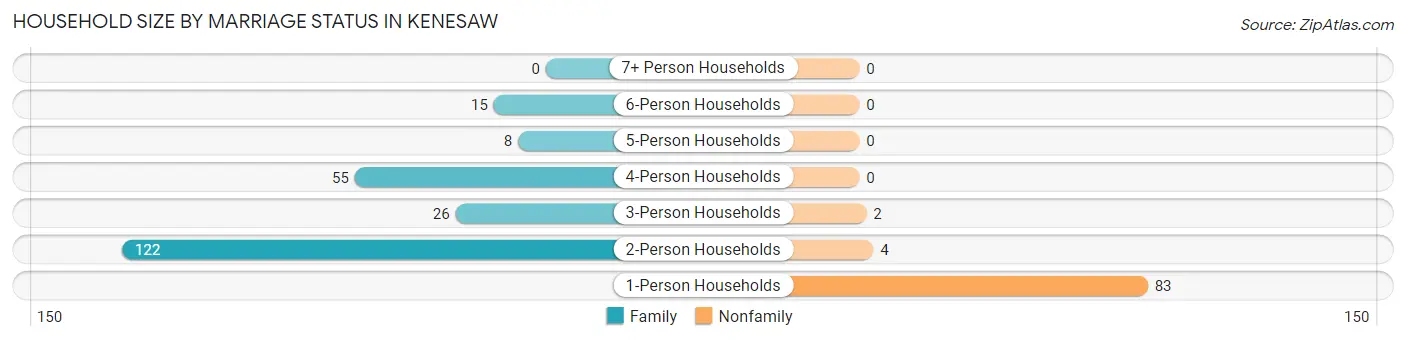
Household Size by Marriage Status in Kenesaw
Out of a total of 315 households in Kenesaw, 226 (71.8%) are family households, while 89 (28.2%) are nonfamily households. The most numerous type of family households are 2-person households, comprising 122, and the most common type of nonfamily households are 1-person households, comprising 83.
| Household Size | Family Households | Nonfamily Households |
| 1-Person Households | - | 83 (26.4%) |
| 2-Person Households | 122 (38.7%) | 4 (1.3%) |
| 3-Person Households | 26 (8.3%) | 2 (0.6%) |
| 4-Person Households | 55 (17.5%) | 0 (0.0%) |
| 5-Person Households | 8 (2.5%) | 0 (0.0%) |
| 6-Person Households | 15 (4.8%) | 0 (0.0%) |
| 7+ Person Households | 0 (0.0%) | 0 (0.0%) |
| Total | 226 (71.8%) | 89 (28.2%) |
Female Fertility in Kenesaw
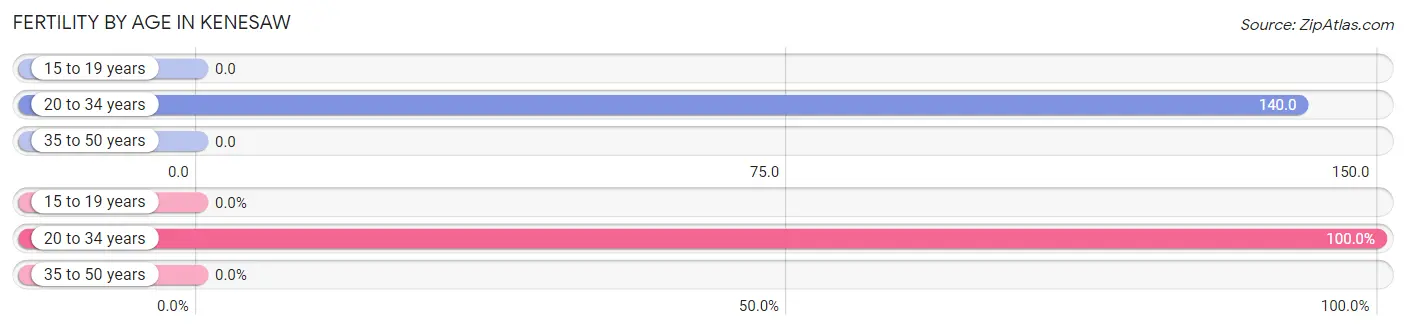
Fertility by Age in Kenesaw
Average fertility rate in Kenesaw is 47.0 births per 1,000 women. Women in the age bracket of 20 to 34 years have the highest fertility rate with 140.0 births per 1,000 women. Women in the age bracket of 20 to 34 years acount for 100.0% of all women with births.
| Age Bracket | Women with Births | Births / 1,000 Women |
| 15 to 19 years | 0 (0.0%) | 0.0 |
| 20 to 34 years | 7 (100.0%) | 140.0 |
| 35 to 50 years | 0 (0.0%) | 0.0 |
| Total | 7 (100.0%) | 47.0 |
Fertility by Age by Marriage Status in Kenesaw
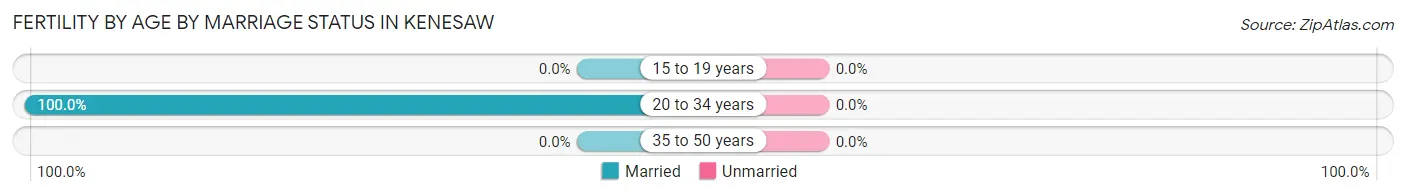
| Age Bracket | Married | Unmarried |
| 15 to 19 years | 0 (0.0%) | 0 (0.0%) |
| 20 to 34 years | 7 (100.0%) | 0 (0.0%) |
| 35 to 50 years | 0 (0.0%) | 0 (0.0%) |
| Total | 7 (100.0%) | 0 (0.0%) |
Fertility by Education in Kenesaw
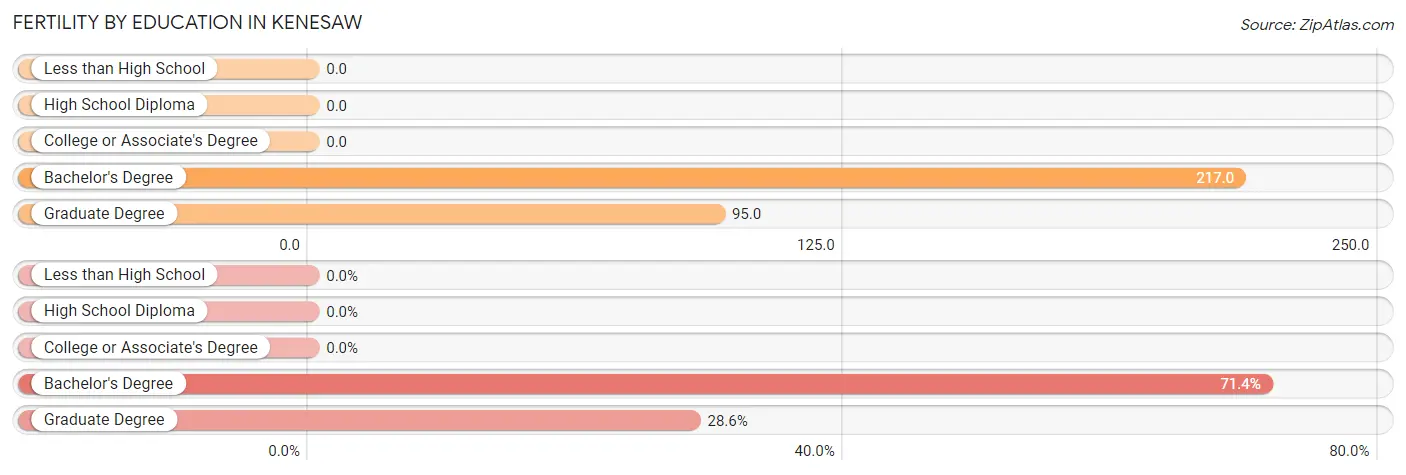
| Educational Attainment | Women with Births | Births / 1,000 Women |
| Less than High School | 0 (0.0%) | 0.0 |
| High School Diploma | 0 (0.0%) | 0.0 |
| College or Associate's Degree | 0 (0.0%) | 0.0 |
| Bachelor's Degree | 5 (71.4%) | 217.0 |
| Graduate Degree | 2 (28.6%) | 95.0 |
| Total | 7 (100.0%) | 47.0 |
Fertility by Education by Marriage Status in Kenesaw
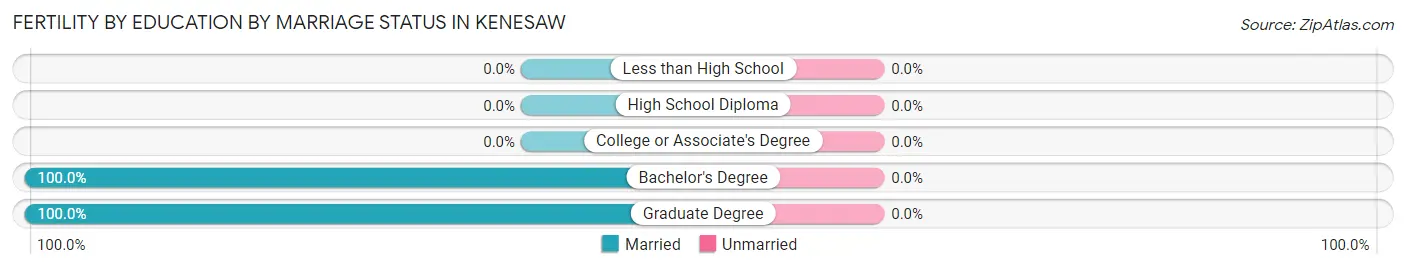
| Educational Attainment | Married | Unmarried |
| Less than High School | 0 (0.0%) | 0 (0.0%) |
| High School Diploma | 0 (0.0%) | 0 (0.0%) |
| College or Associate's Degree | 0 (0.0%) | 0 (0.0%) |
| Bachelor's Degree | 5 (100.0%) | 0 (0.0%) |
| Graduate Degree | 2 (100.0%) | 0 (0.0%) |
| Total | 7 (100.0%) | 0 (0.0%) |
Income in Kenesaw
Income Overview in Kenesaw
Per Capita Income in Kenesaw is $34,923, while median incomes of families and households are $82,250 and $77,321 respectively.
| Characteristic | Number | Measure |
| Per Capita Income | 826 | $34,923 |
| Median Family Income | 226 | $82,250 |
| Mean Family Income | 226 | $95,503 |
| Median Household Income | 315 | $77,321 |
| Mean Household Income | 315 | $86,158 |
| Income Deficit | 226 | $0 |
| Wage / Income Gap (%) | 826 | 41.18% |
| Wage / Income Gap ($) | 826 | 58.82¢ per $1 |
| Gini / Inequality Index | 826 | 0.37 |
Earnings by Sex in Kenesaw
Average Earnings in Kenesaw are $43,661, $53,125 for men and $31,250 for women, a difference of 41.2%.
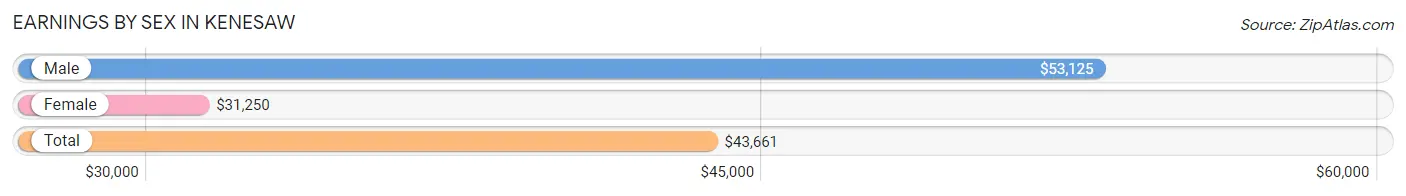
| Sex | Number | Average Earnings |
| Male | 260 (56.2%) | $53,125 |
| Female | 203 (43.8%) | $31,250 |
| Total | 463 (100.0%) | $43,661 |
Earnings by Sex by Income Bracket in Kenesaw
The most common earnings brackets in Kenesaw are $75,000 to $99,999 for men (45 | 17.3%) and $2,499 or less for women (21 | 10.3%).
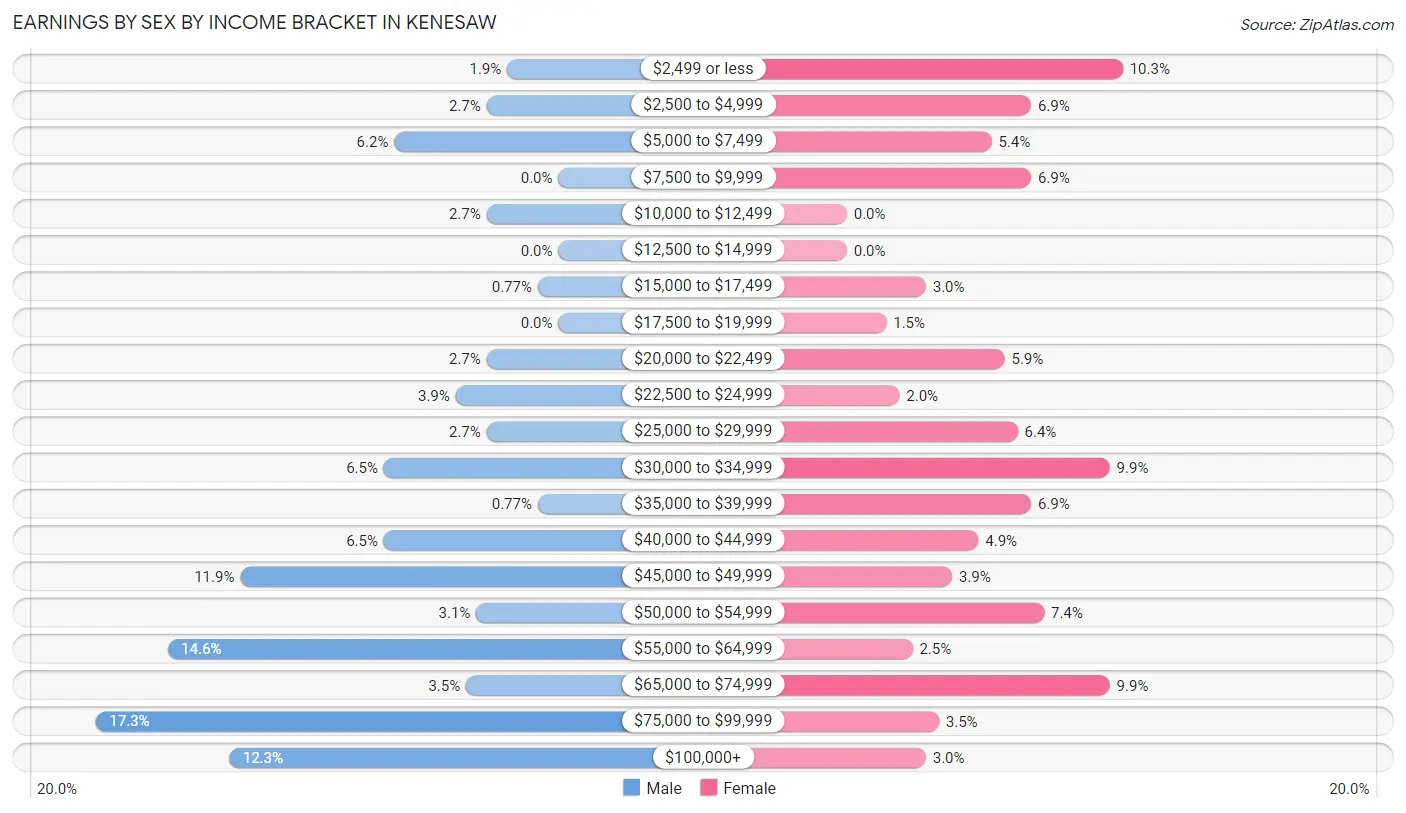
| Income | Male | Female |
| $2,499 or less | 5 (1.9%) | 21 (10.3%) |
| $2,500 to $4,999 | 7 (2.7%) | 14 (6.9%) |
| $5,000 to $7,499 | 16 (6.1%) | 11 (5.4%) |
| $7,500 to $9,999 | 0 (0.0%) | 14 (6.9%) |
| $10,000 to $12,499 | 7 (2.7%) | 0 (0.0%) |
| $12,500 to $14,999 | 0 (0.0%) | 0 (0.0%) |
| $15,000 to $17,499 | 2 (0.8%) | 6 (3.0%) |
| $17,500 to $19,999 | 0 (0.0%) | 3 (1.5%) |
| $20,000 to $22,499 | 7 (2.7%) | 12 (5.9%) |
| $22,500 to $24,999 | 10 (3.8%) | 4 (2.0%) |
| $25,000 to $29,999 | 7 (2.7%) | 13 (6.4%) |
| $30,000 to $34,999 | 17 (6.5%) | 20 (9.9%) |
| $35,000 to $39,999 | 2 (0.8%) | 14 (6.9%) |
| $40,000 to $44,999 | 17 (6.5%) | 10 (4.9%) |
| $45,000 to $49,999 | 31 (11.9%) | 8 (3.9%) |
| $50,000 to $54,999 | 8 (3.1%) | 15 (7.4%) |
| $55,000 to $64,999 | 38 (14.6%) | 5 (2.5%) |
| $65,000 to $74,999 | 9 (3.5%) | 20 (9.9%) |
| $75,000 to $99,999 | 45 (17.3%) | 7 (3.5%) |
| $100,000+ | 32 (12.3%) | 6 (3.0%) |
| Total | 260 (100.0%) | 203 (100.0%) |
Earnings by Sex by Educational Attainment in Kenesaw
Average earnings in Kenesaw are $56,042 for men and $34,231 for women, a difference of 38.9%. Men with an educational attainment of bachelor's degree enjoy the highest average annual earnings of $63,438, while those with high school diploma education earn the least with $46,827. Women with an educational attainment of graduate degree earn the most with the average annual earnings of $51,563, while those with bachelor's degree education have the smallest earnings of $32,917.
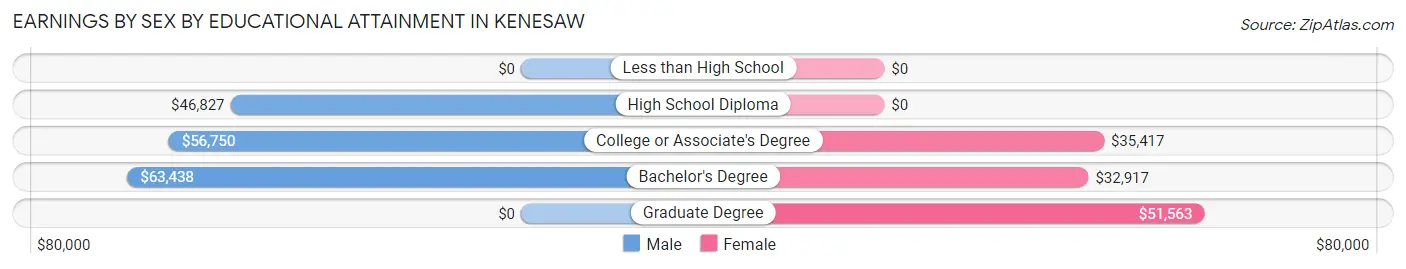
| Educational Attainment | Male Income | Female Income |
| Less than High School | - | - |
| High School Diploma | $46,827 | $0 |
| College or Associate's Degree | $56,750 | $35,417 |
| Bachelor's Degree | $63,438 | $32,917 |
| Graduate Degree | - | - |
| Total | $56,042 | $34,231 |
Family Income in Kenesaw
Family Income Brackets in Kenesaw
According to the Kenesaw family income data, there are 61 families falling into the $100,000 to $149,999 income range, which is the most common income bracket and makes up 27.0% of all families.
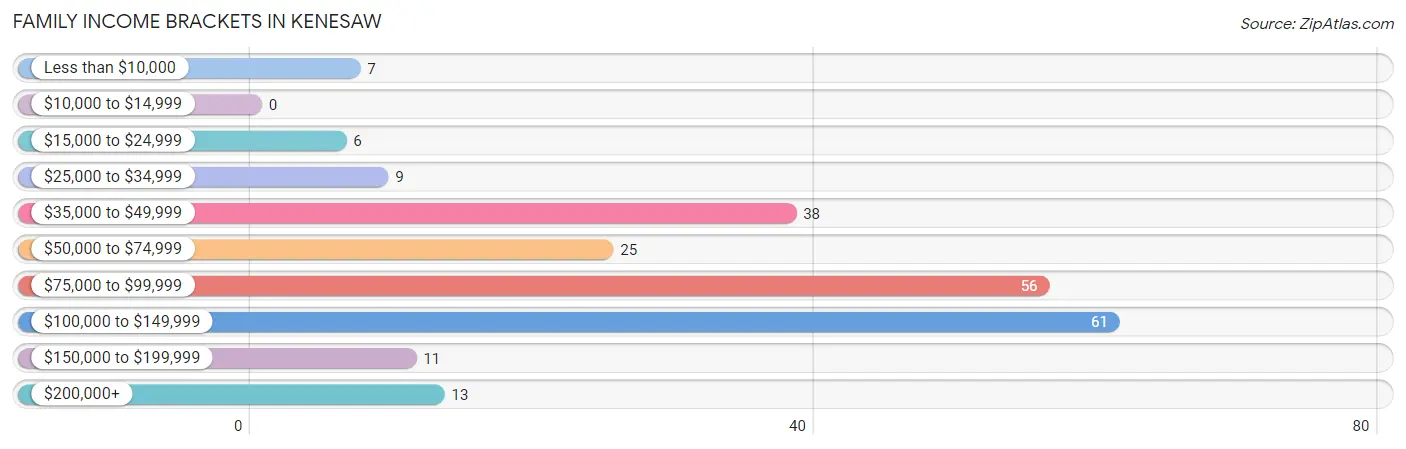
| Income Bracket | # Families | % Families |
| Less than $10,000 | 7 | 3.1% |
| $10,000 to $14,999 | 0 | 0.0% |
| $15,000 to $24,999 | 6 | 2.7% |
| $25,000 to $34,999 | 9 | 4.0% |
| $35,000 to $49,999 | 38 | 16.8% |
| $50,000 to $74,999 | 25 | 11.1% |
| $75,000 to $99,999 | 56 | 24.8% |
| $100,000 to $149,999 | 61 | 27.0% |
| $150,000 to $199,999 | 11 | 4.9% |
| $200,000+ | 13 | 5.8% |
Family Income by Famaliy Size in Kenesaw
4-person families (44 | 19.5%) account for the highest median family income in Kenesaw with $120,417 per family, while 2-person families (124 | 54.9%) have the highest median income of $39,250 per family member.
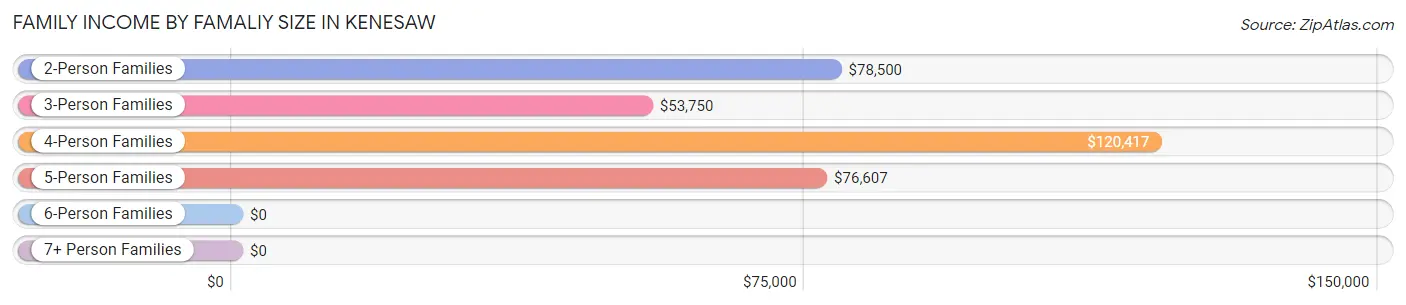
| Income Bracket | # Families | Median Income |
| 2-Person Families | 124 (54.9%) | $78,500 |
| 3-Person Families | 41 (18.1%) | $53,750 |
| 4-Person Families | 44 (19.5%) | $120,417 |
| 5-Person Families | 9 (4.0%) | $76,607 |
| 6-Person Families | 8 (3.5%) | $0 |
| 7+ Person Families | 0 (0.0%) | $0 |
| Total | 226 (100.0%) | $82,250 |
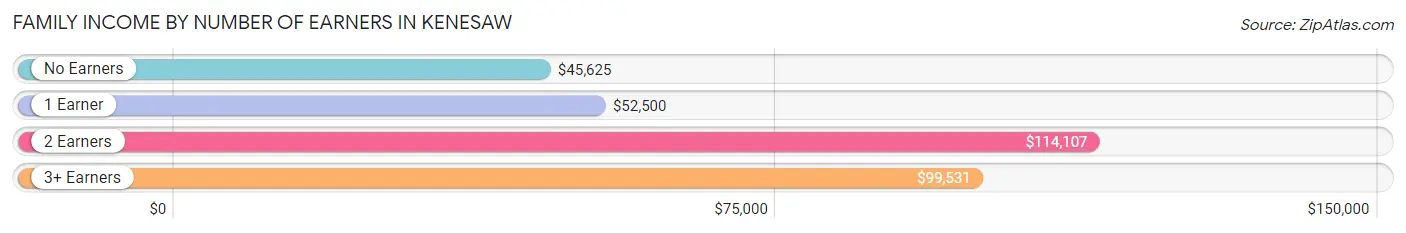
Family Income by Number of Earners in Kenesaw
The median family income in Kenesaw is $82,250, with families comprising 2 earners (94) having the highest median family income of $114,107, while families with no earners (41) have the lowest median family income of $45,625, accounting for 41.6% and 18.1% of families, respectively.
| Number of Earners | # Families | Median Income |
| No Earners | 41 (18.1%) | $45,625 |
| 1 Earner | 58 (25.7%) | $52,500 |
| 2 Earners | 94 (41.6%) | $114,107 |
| 3+ Earners | 33 (14.6%) | $99,531 |
| Total | 226 (100.0%) | $82,250 |
Household Income in Kenesaw
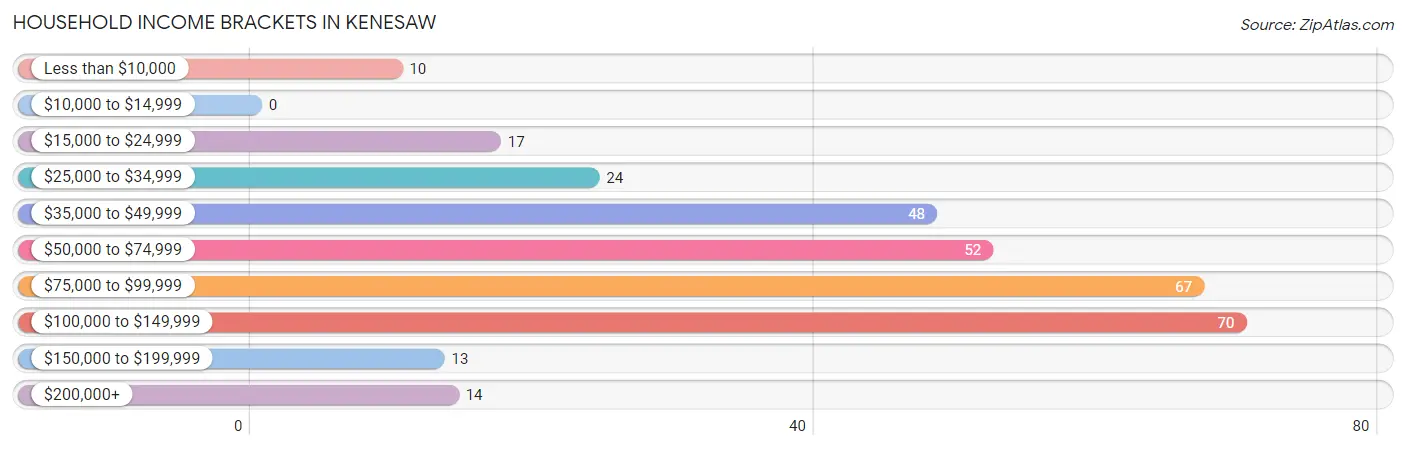
Household Income Brackets in Kenesaw
With 70 households falling in the category, the $100,000 to $149,999 income range is the most frequent in Kenesaw, accounting for 22.2% of all households.
| Income Bracket | # Households | % Households |
| Less than $10,000 | 10 | 3.2% |
| $10,000 to $14,999 | 0 | 0.0% |
| $15,000 to $24,999 | 17 | 5.4% |
| $25,000 to $34,999 | 24 | 7.6% |
| $35,000 to $49,999 | 48 | 15.2% |
| $50,000 to $74,999 | 52 | 16.5% |
| $75,000 to $99,999 | 67 | 21.3% |
| $100,000 to $149,999 | 70 | 22.2% |
| $150,000 to $199,999 | 13 | 4.1% |
| $200,000+ | 14 | 4.4% |
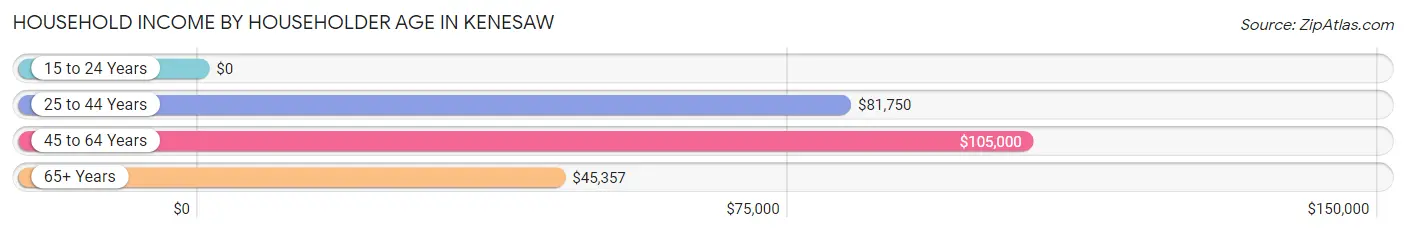
Household Income by Householder Age in Kenesaw
The median household income in Kenesaw is $77,321, with the highest median household income of $105,000 found in the 45 to 64 years age bracket for the primary householder. A total of 104 households (33.0%) fall into this category. Meanwhile, the 15 to 24 years age bracket for the primary householder has the lowest median household income of $0, with 4 households (1.3%) in this group.
| Income Bracket | # Households | Median Income |
| 15 to 24 Years | 4 (1.3%) | $0 |
| 25 to 44 Years | 105 (33.3%) | $81,750 |
| 45 to 64 Years | 104 (33.0%) | $105,000 |
| 65+ Years | 102 (32.4%) | $45,357 |
| Total | 315 (100.0%) | $77,321 |
Poverty in Kenesaw
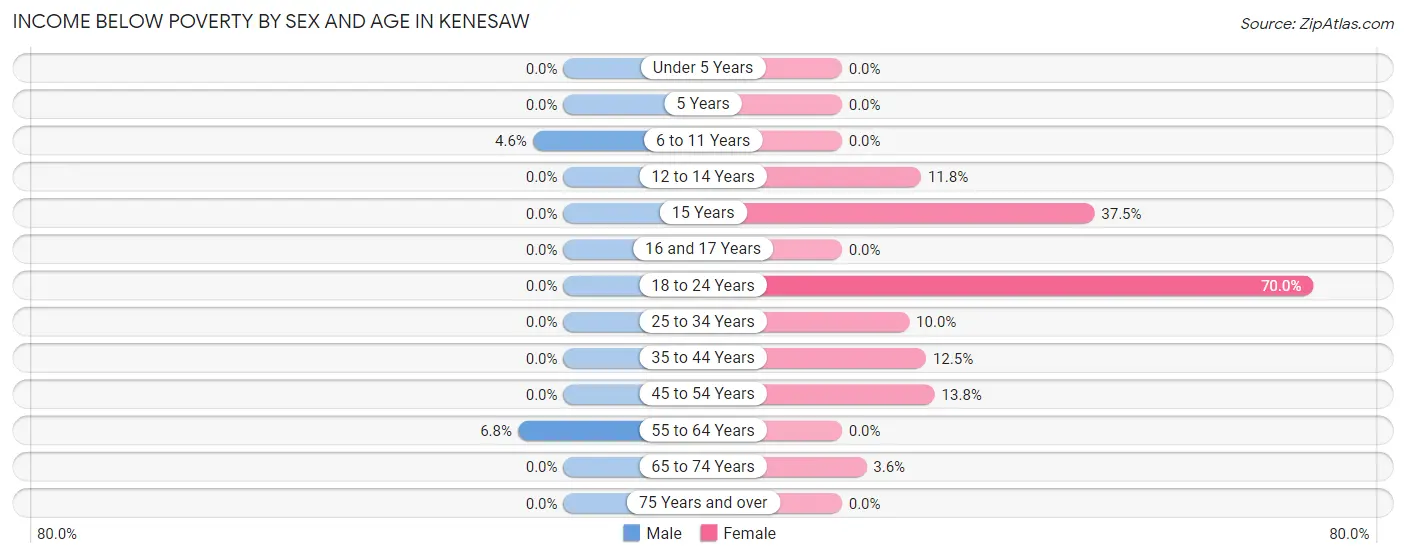
Income Below Poverty by Sex and Age in Kenesaw
With 1.5% poverty level for males and 8.2% for females among the residents of Kenesaw, 55 to 64 year old males and 18 to 24 year old females are the most vulnerable to poverty, with 5 males (6.8%) and 7 females (70.0%) in their respective age groups living below the poverty level.
| Age Bracket | Male | Female |
| Under 5 Years | 0 (0.0%) | 0 (0.0%) |
| 5 Years | 0 (0.0%) | 0 (0.0%) |
| 6 to 11 Years | 1 (4.5%) | 0 (0.0%) |
| 12 to 14 Years | 0 (0.0%) | 2 (11.8%) |
| 15 Years | 0 (0.0%) | 3 (37.5%) |
| 16 and 17 Years | 0 (0.0%) | 0 (0.0%) |
| 18 to 24 Years | 0 (0.0%) | 7 (70.0%) |
| 25 to 34 Years | 0 (0.0%) | 4 (10.0%) |
| 35 to 44 Years | 0 (0.0%) | 5 (12.5%) |
| 45 to 54 Years | 0 (0.0%) | 8 (13.8%) |
| 55 to 64 Years | 5 (6.8%) | 0 (0.0%) |
| 65 to 74 Years | 0 (0.0%) | 2 (3.6%) |
| 75 Years and over | 0 (0.0%) | 0 (0.0%) |
| Total | 6 (1.5%) | 31 (8.2%) |
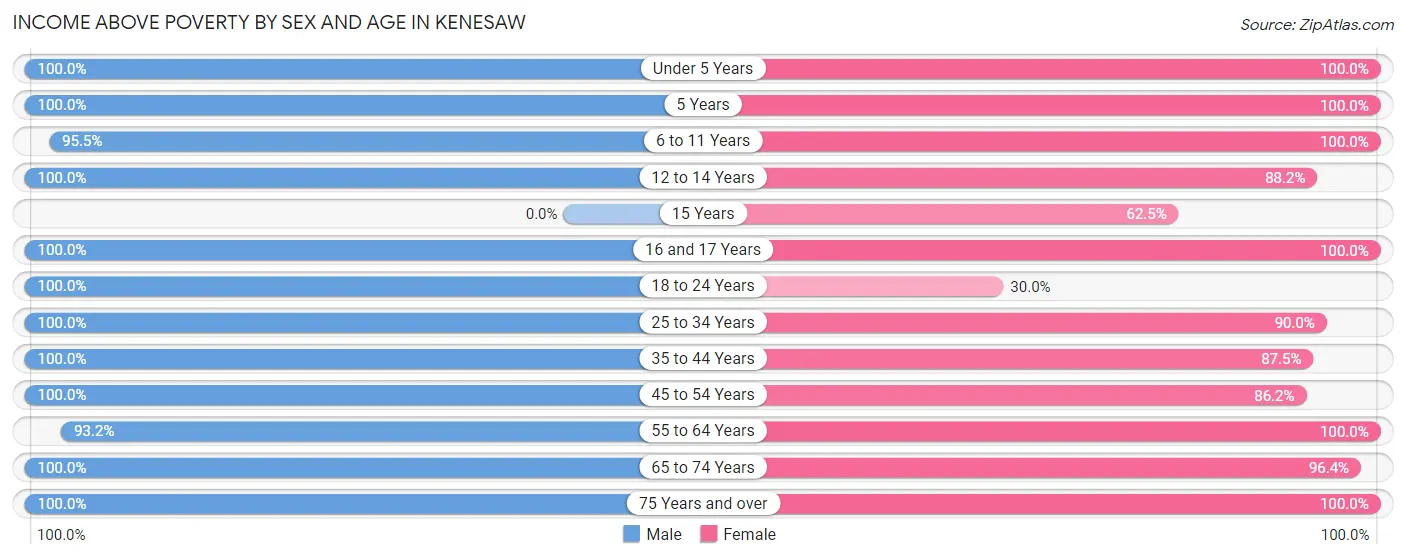
Income Above Poverty by Sex and Age in Kenesaw
According to the poverty statistics in Kenesaw, males aged under 5 years and females aged under 5 years are the age groups that are most secure financially, with 100.0% of males and 100.0% of females in these age groups living above the poverty line.
| Age Bracket | Male | Female |
| Under 5 Years | 23 (100.0%) | 25 (100.0%) |
| 5 Years | 5 (100.0%) | 3 (100.0%) |
| 6 to 11 Years | 21 (95.5%) | 34 (100.0%) |
| 12 to 14 Years | 21 (100.0%) | 15 (88.2%) |
| 15 Years | 0 (0.0%) | 5 (62.5%) |
| 16 and 17 Years | 10 (100.0%) | 22 (100.0%) |
| 18 to 24 Years | 24 (100.0%) | 3 (30.0%) |
| 25 to 34 Years | 42 (100.0%) | 36 (90.0%) |
| 35 to 44 Years | 60 (100.0%) | 35 (87.5%) |
| 45 to 54 Years | 50 (100.0%) | 50 (86.2%) |
| 55 to 64 Years | 69 (93.2%) | 36 (100.0%) |
| 65 to 74 Years | 40 (100.0%) | 53 (96.4%) |
| 75 Years and over | 32 (100.0%) | 29 (100.0%) |
| Total | 397 (98.5%) | 346 (91.8%) |
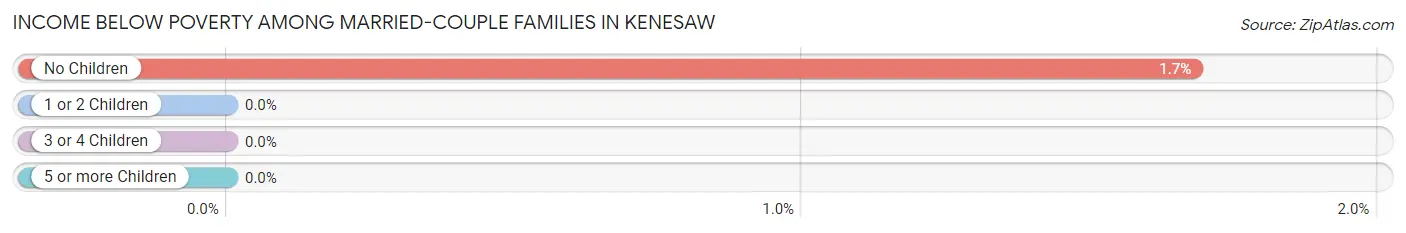
Income Below Poverty Among Married-Couple Families in Kenesaw
The poverty statistics for married-couple families in Kenesaw show that 1.0% or 2 of the total 194 families live below the poverty line. Families with no children have the highest poverty rate of 1.7%, comprising of 2 families. On the other hand, families with 1 or 2 children have the lowest poverty rate of 0.0%, which includes 0 families.
| Children | Above Poverty | Below Poverty |
| No Children | 117 (98.3%) | 2 (1.7%) |
| 1 or 2 Children | 65 (100.0%) | 0 (0.0%) |
| 3 or 4 Children | 10 (100.0%) | 0 (0.0%) |
| 5 or more Children | 0 (0.0%) | 0 (0.0%) |
| Total | 192 (99.0%) | 2 (1.0%) |
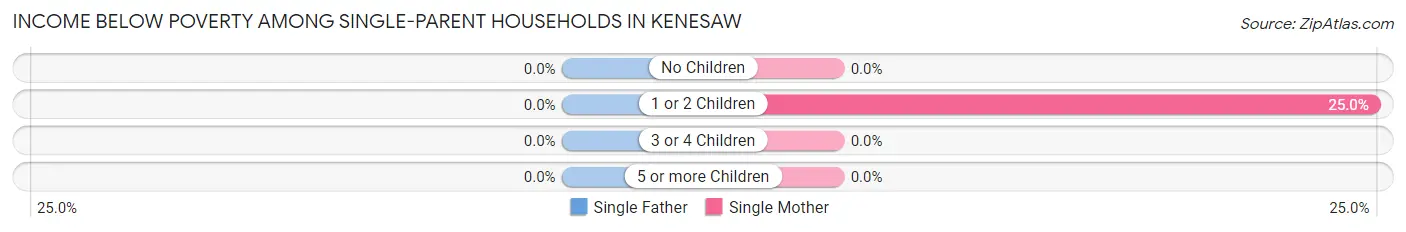
Income Below Poverty Among Single-Parent Households in Kenesaw
| Children | Single Father | Single Mother |
| No Children | 0 (0.0%) | 0 (0.0%) |
| 1 or 2 Children | 0 (0.0%) | 5 (25.0%) |
| 3 or 4 Children | 0 (0.0%) | 0 (0.0%) |
| 5 or more Children | 0 (0.0%) | 0 (0.0%) |
| Total | 0 (0.0%) | 5 (20.8%) |
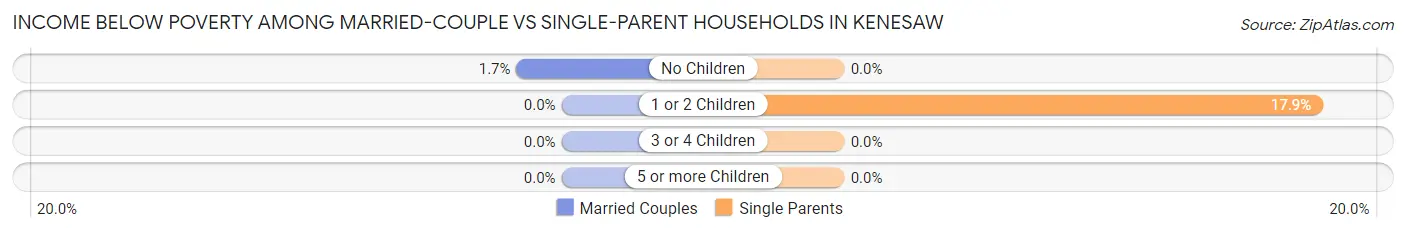
Income Below Poverty Among Married-Couple vs Single-Parent Households in Kenesaw
The poverty data for Kenesaw shows that 2 of the married-couple family households (1.0%) and 5 of the single-parent households (15.6%) are living below the poverty level. Within the married-couple family households, those with no children have the highest poverty rate, with 2 households (1.7%) falling below the poverty line. Among the single-parent households, those with 1 or 2 children have the highest poverty rate, with 5 household (17.9%) living below poverty.
| Children | Married-Couple Families | Single-Parent Households |
| No Children | 2 (1.7%) | 0 (0.0%) |
| 1 or 2 Children | 0 (0.0%) | 5 (17.9%) |
| 3 or 4 Children | 0 (0.0%) | 0 (0.0%) |
| 5 or more Children | 0 (0.0%) | 0 (0.0%) |
| Total | 2 (1.0%) | 5 (15.6%) |
Employment Characteristics in Kenesaw
Employment by Class of Employer in Kenesaw
Among the 391 employed individuals in Kenesaw, private company employees (217 | 55.5%), self-employed (not incorporated) (54 | 13.8%), and not-for-profit organizations (40 | 10.2%) make up the most common classes of employment.
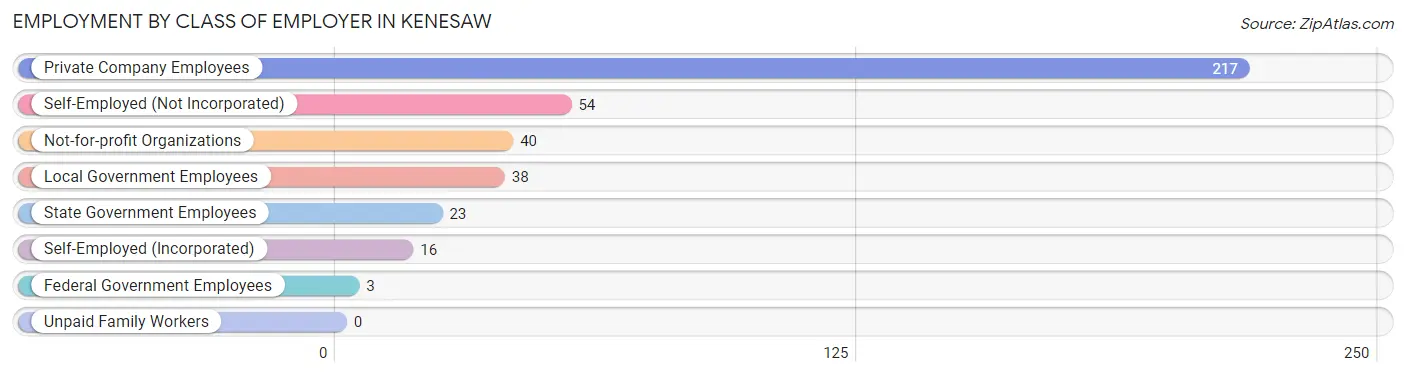
| Employer Class | # Employees | % Employees |
| Private Company Employees | 217 | 55.5% |
| Self-Employed (Incorporated) | 16 | 4.1% |
| Self-Employed (Not Incorporated) | 54 | 13.8% |
| Not-for-profit Organizations | 40 | 10.2% |
| Local Government Employees | 38 | 9.7% |
| State Government Employees | 23 | 5.9% |
| Federal Government Employees | 3 | 0.8% |
| Unpaid Family Workers | 0 | 0.0% |
| Total | 391 | 100.0% |
Employment Status by Age in Kenesaw
According to the labor force statistics for Kenesaw, out of the total population over 16 years of age (668), 60.6% or 405 individuals are in the labor force, with 3.5% or 14 of them unemployed. The age group with the highest labor force participation rate is 25 to 29 years, with 100.0% or 48 individuals in the labor force. Within the labor force, the 20 to 24 years age range has the highest percentage of unemployed individuals, with 19.4% or 6 of them being unemployed.
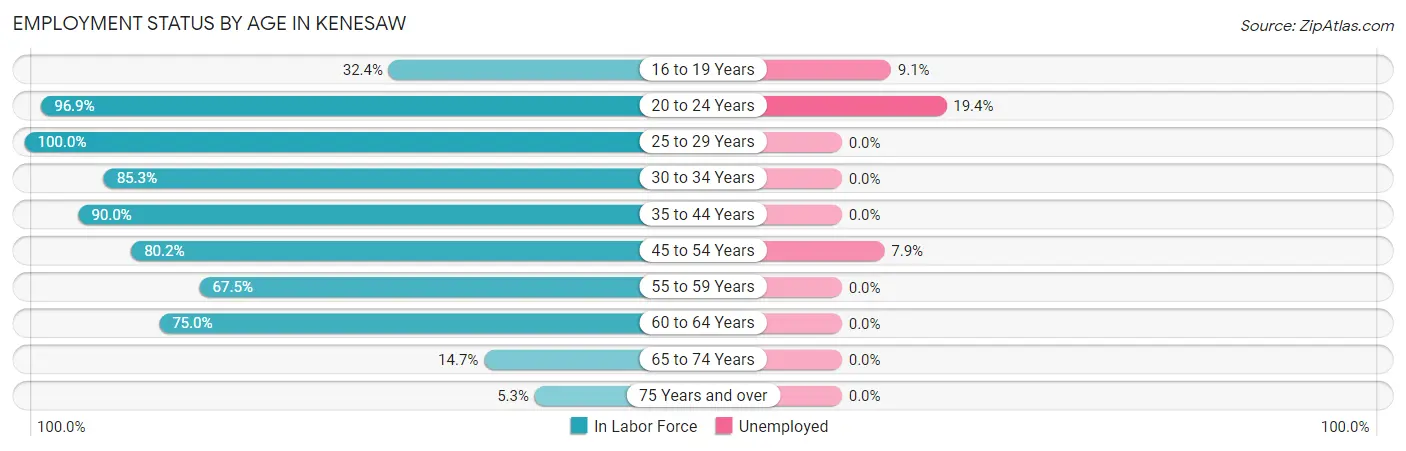
| Age Bracket | In Labor Force | Unemployed |
| 16 to 19 Years | 11 (32.4%) | 1 (9.1%) |
| 20 to 24 Years | 31 (96.9%) | 6 (19.4%) |
| 25 to 29 Years | 48 (100.0%) | 0 (0.0%) |
| 30 to 34 Years | 29 (85.3%) | 0 (0.0%) |
| 35 to 44 Years | 90 (90.0%) | 0 (0.0%) |
| 45 to 54 Years | 89 (80.2%) | 7 (7.9%) |
| 55 to 59 Years | 54 (67.5%) | 0 (0.0%) |
| 60 to 64 Years | 33 (75.0%) | 0 (0.0%) |
| 65 to 74 Years | 16 (14.7%) | 0 (0.0%) |
| 75 Years and over | 4 (5.3%) | 0 (0.0%) |
| Total | 405 (60.6%) | 14 (3.5%) |
Employment Status by Educational Attainment in Kenesaw
According to labor force statistics for Kenesaw, 82.3% of individuals (343) out of the total population between 25 and 64 years of age (417) are in the labor force, with 2.0% or 7 of them being unemployed. The group with the highest labor force participation rate are those with the educational attainment of high school diploma, with 91.7% or 121 individuals in the labor force. Within the labor force, individuals with college / associate degree education have the highest percentage of unemployment, with 5.6% or 7 of them being unemployed.
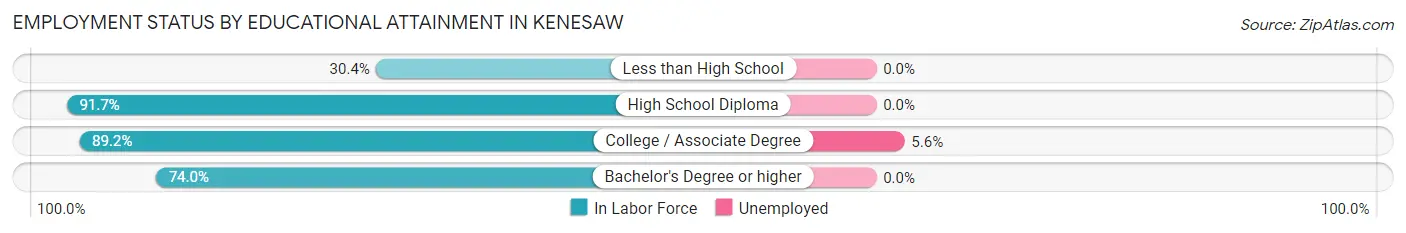
| Educational Attainment | In Labor Force | Unemployed |
| Less than High School | 7 (30.4%) | 0 (0.0%) |
| High School Diploma | 121 (91.7%) | 0 (0.0%) |
| College / Associate Degree | 124 (89.2%) | 8 (5.6%) |
| Bachelor's Degree or higher | 91 (74.0%) | 0 (0.0%) |
| Total | 343 (82.3%) | 8 (2.0%) |
Employment Occupations by Sex in Kenesaw
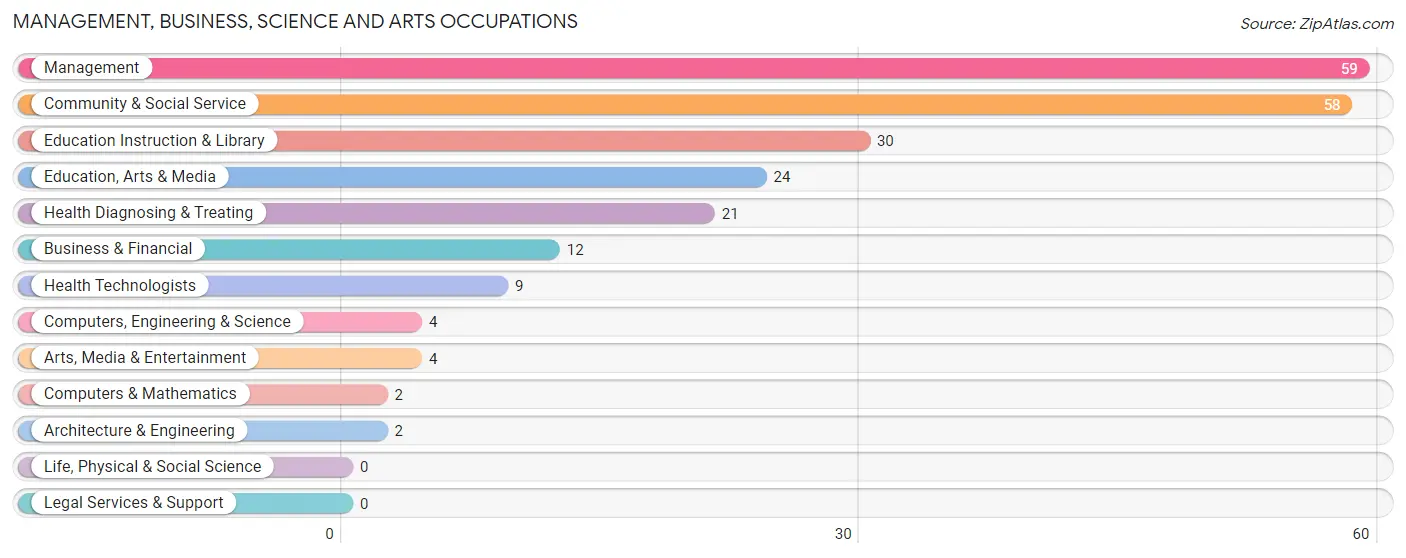
Management, Business, Science and Arts Occupations
The most common Management, Business, Science and Arts occupations in Kenesaw are Management (59 | 15.1%), Community & Social Service (58 | 14.8%), Education Instruction & Library (30 | 7.7%), Education, Arts & Media (24 | 6.1%), and Health Diagnosing & Treating (21 | 5.4%).
Management, Business, Science and Arts Occupations by Sex
Within the Management, Business, Science and Arts occupations in Kenesaw, the most male-oriented occupations are Computers, Engineering & Science (100.0%), Computers & Mathematics (100.0%), and Architecture & Engineering (100.0%), while the most female-oriented occupations are Arts, Media & Entertainment (100.0%), Health Diagnosing & Treating (85.7%), and Education Instruction & Library (80.0%).
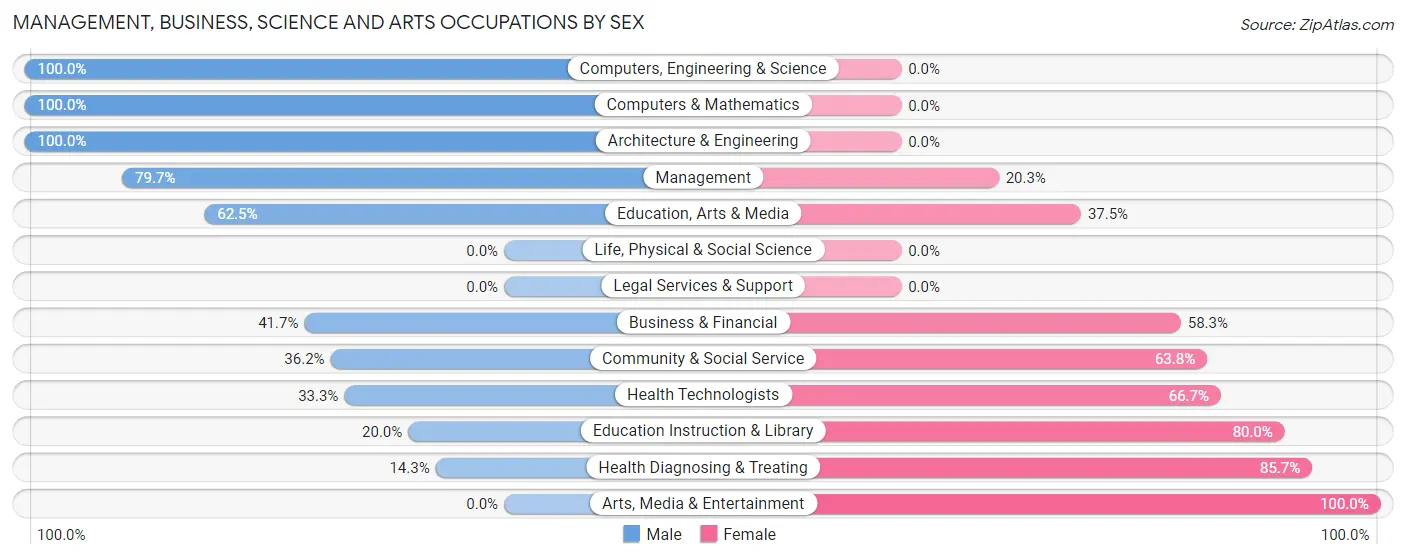
| Occupation | Male | Female |
| Management | 47 (79.7%) | 12 (20.3%) |
| Business & Financial | 5 (41.7%) | 7 (58.3%) |
| Computers, Engineering & Science | 4 (100.0%) | 0 (0.0%) |
| Computers & Mathematics | 2 (100.0%) | 0 (0.0%) |
| Architecture & Engineering | 2 (100.0%) | 0 (0.0%) |
| Life, Physical & Social Science | 0 (0.0%) | 0 (0.0%) |
| Community & Social Service | 21 (36.2%) | 37 (63.8%) |
| Education, Arts & Media | 15 (62.5%) | 9 (37.5%) |
| Legal Services & Support | 0 (0.0%) | 0 (0.0%) |
| Education Instruction & Library | 6 (20.0%) | 24 (80.0%) |
| Arts, Media & Entertainment | 0 (0.0%) | 4 (100.0%) |
| Health Diagnosing & Treating | 3 (14.3%) | 18 (85.7%) |
| Health Technologists | 3 (33.3%) | 6 (66.7%) |
| Total (Category) | 80 (51.9%) | 74 (48.0%) |
| Total (Overall) | 233 (59.6%) | 158 (40.4%) |
Services Occupations
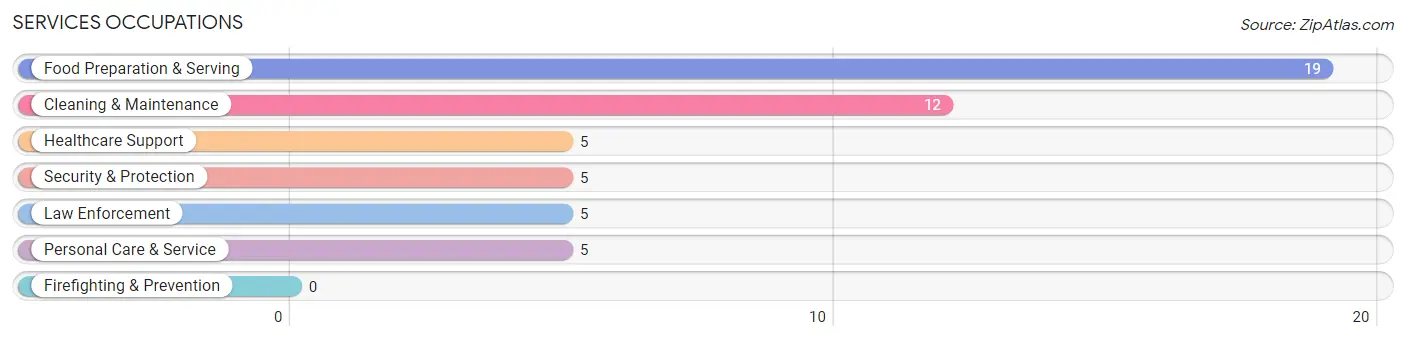
The most common Services occupations in Kenesaw are Food Preparation & Serving (19 | 4.9%), Cleaning & Maintenance (12 | 3.1%), Healthcare Support (5 | 1.3%), Security & Protection (5 | 1.3%), and Law Enforcement (5 | 1.3%).
Services Occupations by Sex
Within the Services occupations in Kenesaw, the most male-oriented occupations are Security & Protection (100.0%), Law Enforcement (100.0%), and Cleaning & Maintenance (41.7%), while the most female-oriented occupations are Healthcare Support (100.0%), Personal Care & Service (100.0%), and Food Preparation & Serving (94.7%).
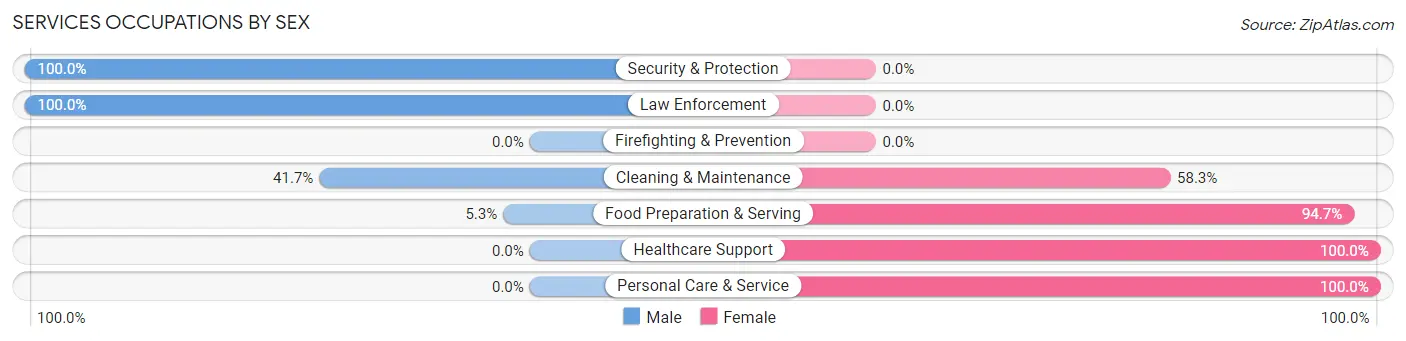
| Occupation | Male | Female |
| Healthcare Support | 0 (0.0%) | 5 (100.0%) |
| Security & Protection | 5 (100.0%) | 0 (0.0%) |
| Firefighting & Prevention | 0 (0.0%) | 0 (0.0%) |
| Law Enforcement | 5 (100.0%) | 0 (0.0%) |
| Food Preparation & Serving | 1 (5.3%) | 18 (94.7%) |
| Cleaning & Maintenance | 5 (41.7%) | 7 (58.3%) |
| Personal Care & Service | 0 (0.0%) | 5 (100.0%) |
| Total (Category) | 11 (23.9%) | 35 (76.1%) |
| Total (Overall) | 233 (59.6%) | 158 (40.4%) |
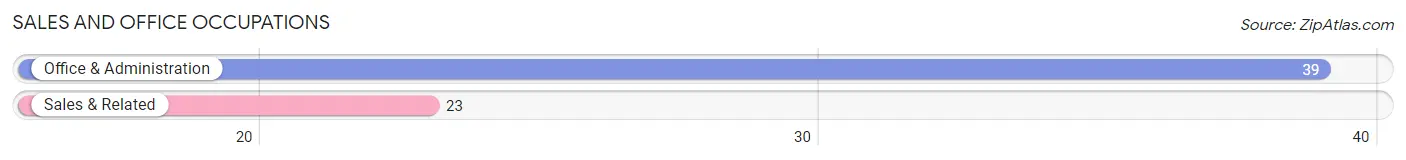
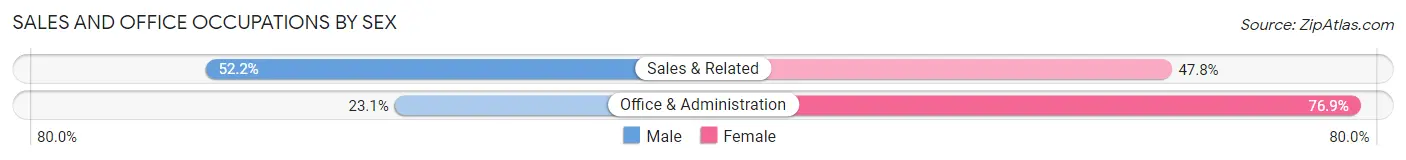
Sales and Office Occupations
The most common Sales and Office occupations in Kenesaw are Office & Administration (39 | 10.0%), and Sales & Related (23 | 5.9%).
Sales and Office Occupations by Sex
| Occupation | Male | Female |
| Sales & Related | 12 (52.2%) | 11 (47.8%) |
| Office & Administration | 9 (23.1%) | 30 (76.9%) |
| Total (Category) | 21 (33.9%) | 41 (66.1%) |
| Total (Overall) | 233 (59.6%) | 158 (40.4%) |
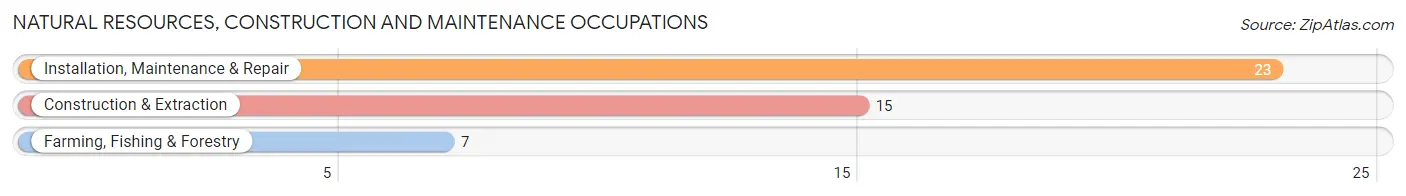
Natural Resources, Construction and Maintenance Occupations
The most common Natural Resources, Construction and Maintenance occupations in Kenesaw are Installation, Maintenance & Repair (23 | 5.9%), Construction & Extraction (15 | 3.8%), and Farming, Fishing & Forestry (7 | 1.8%).
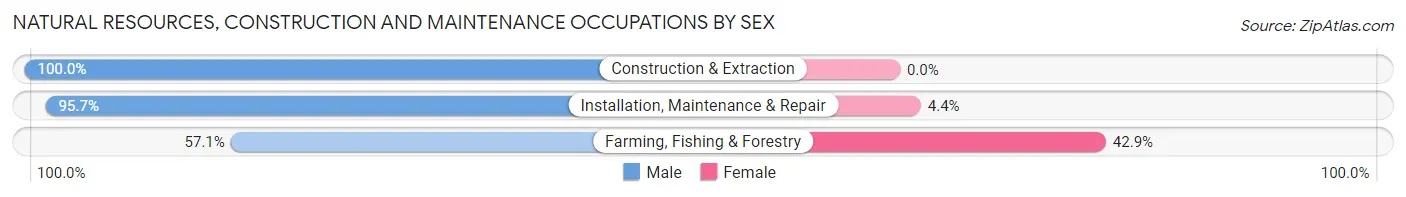
Natural Resources, Construction and Maintenance Occupations by Sex
| Occupation | Male | Female |
| Farming, Fishing & Forestry | 4 (57.1%) | 3 (42.9%) |
| Construction & Extraction | 15 (100.0%) | 0 (0.0%) |
| Installation, Maintenance & Repair | 22 (95.7%) | 1 (4.3%) |
| Total (Category) | 41 (91.1%) | 4 (8.9%) |
| Total (Overall) | 233 (59.6%) | 158 (40.4%) |
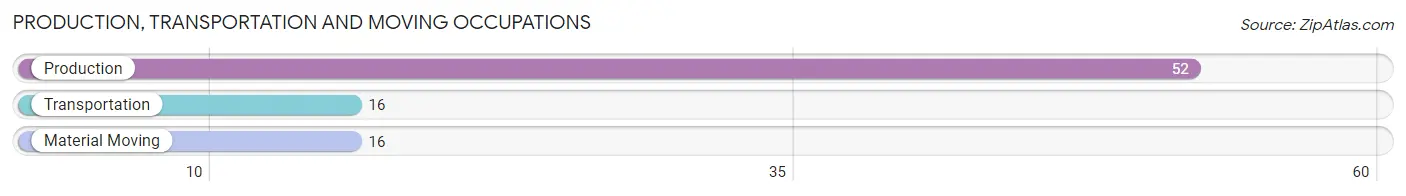
Production, Transportation and Moving Occupations
The most common Production, Transportation and Moving occupations in Kenesaw are Production (52 | 13.3%), Transportation (16 | 4.1%), and Material Moving (16 | 4.1%).
Production, Transportation and Moving Occupations by Sex
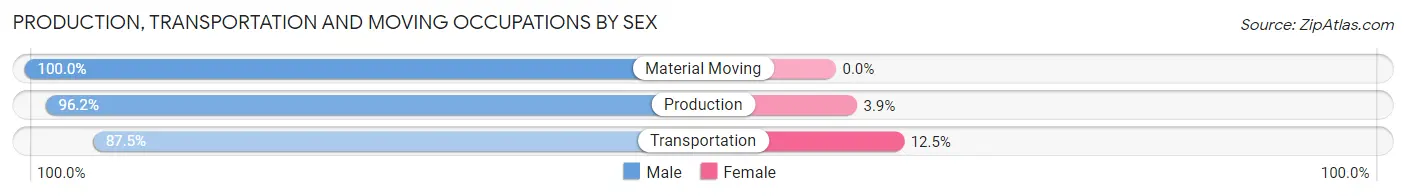
| Occupation | Male | Female |
| Production | 50 (96.2%) | 2 (3.8%) |
| Transportation | 14 (87.5%) | 2 (12.5%) |
| Material Moving | 16 (100.0%) | 0 (0.0%) |
| Total (Category) | 80 (95.2%) | 4 (4.8%) |
| Total (Overall) | 233 (59.6%) | 158 (40.4%) |
Employment Industries by Sex in Kenesaw
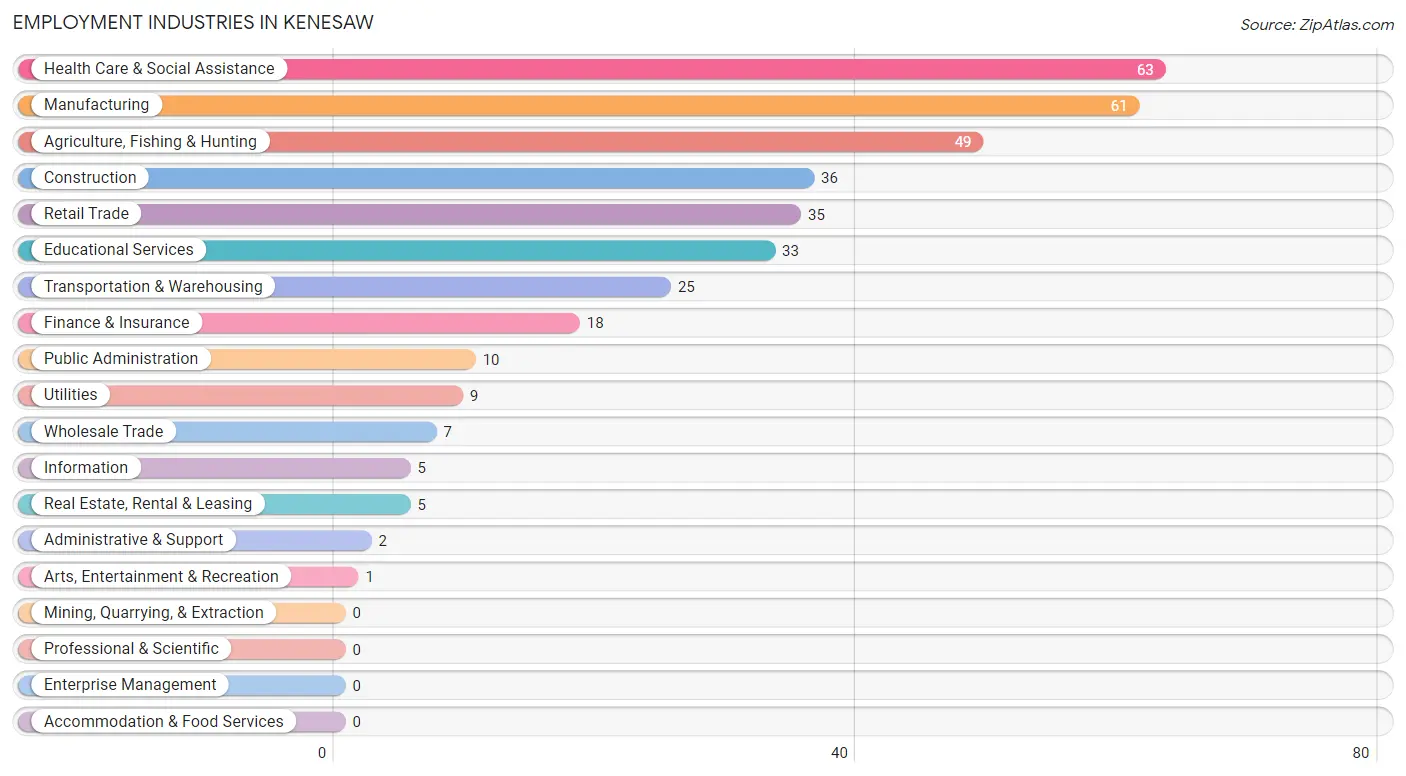
Employment Industries in Kenesaw
The major employment industries in Kenesaw include Health Care & Social Assistance (63 | 16.1%), Manufacturing (61 | 15.6%), Agriculture, Fishing & Hunting (49 | 12.5%), Construction (36 | 9.2%), and Retail Trade (35 | 8.9%).
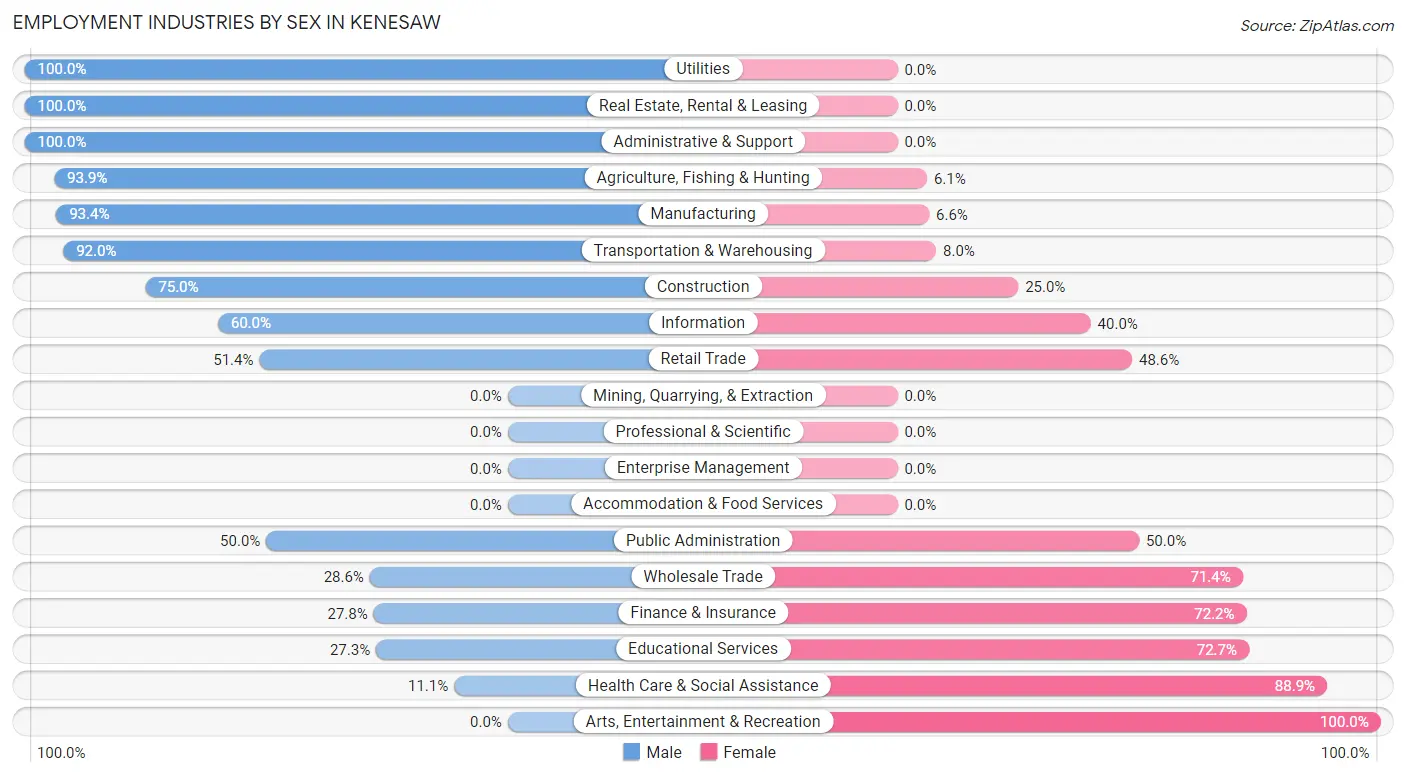
Employment Industries by Sex in Kenesaw
The Kenesaw industries that see more men than women are Utilities (100.0%), Real Estate, Rental & Leasing (100.0%), and Administrative & Support (100.0%), whereas the industries that tend to have a higher number of women are Arts, Entertainment & Recreation (100.0%), Health Care & Social Assistance (88.9%), and Educational Services (72.7%).
| Industry | Male | Female |
| Agriculture, Fishing & Hunting | 46 (93.9%) | 3 (6.1%) |
| Mining, Quarrying, & Extraction | 0 (0.0%) | 0 (0.0%) |
| Construction | 27 (75.0%) | 9 (25.0%) |
| Manufacturing | 57 (93.4%) | 4 (6.6%) |
| Wholesale Trade | 2 (28.6%) | 5 (71.4%) |
| Retail Trade | 18 (51.4%) | 17 (48.6%) |
| Transportation & Warehousing | 23 (92.0%) | 2 (8.0%) |
| Utilities | 9 (100.0%) | 0 (0.0%) |
| Information | 3 (60.0%) | 2 (40.0%) |
| Finance & Insurance | 5 (27.8%) | 13 (72.2%) |
| Real Estate, Rental & Leasing | 5 (100.0%) | 0 (0.0%) |
| Professional & Scientific | 0 (0.0%) | 0 (0.0%) |
| Enterprise Management | 0 (0.0%) | 0 (0.0%) |
| Administrative & Support | 2 (100.0%) | 0 (0.0%) |
| Educational Services | 9 (27.3%) | 24 (72.7%) |
| Health Care & Social Assistance | 7 (11.1%) | 56 (88.9%) |
| Arts, Entertainment & Recreation | 0 (0.0%) | 1 (100.0%) |
| Accommodation & Food Services | 0 (0.0%) | 0 (0.0%) |
| Public Administration | 5 (50.0%) | 5 (50.0%) |
| Total | 233 (59.6%) | 158 (40.4%) |
Education in Kenesaw
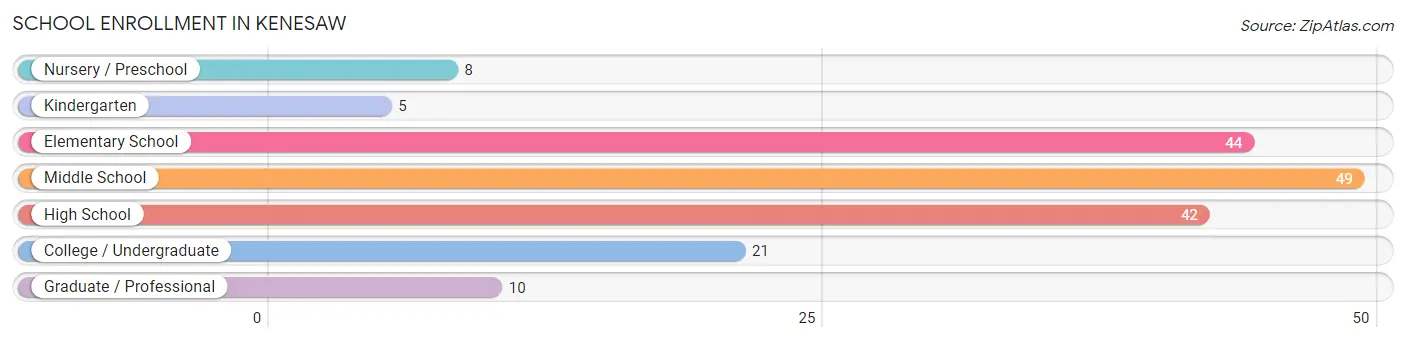
School Enrollment in Kenesaw
The most common levels of schooling among the 179 students in Kenesaw are middle school (49 | 27.4%), elementary school (44 | 24.6%), and high school (42 | 23.5%).
| School Level | # Students | % Students |
| Nursery / Preschool | 8 | 4.5% |
| Kindergarten | 5 | 2.8% |
| Elementary School | 44 | 24.6% |
| Middle School | 49 | 27.4% |
| High School | 42 | 23.5% |
| College / Undergraduate | 21 | 11.7% |
| Graduate / Professional | 10 | 5.6% |
| Total | 179 | 100.0% |
School Enrollment by Age by Funding Source in Kenesaw
Out of a total of 179 students who are enrolled in schools in Kenesaw, 27 (15.1%) attend a private institution, while the remaining 152 (84.9%) are enrolled in public schools. The age group of 20 to 24 year olds has the highest likelihood of being enrolled in private schools, with 9 (64.3% in the age bracket) enrolled. Conversely, the age group of 3 to 4 year olds has the lowest likelihood of being enrolled in a private school, with 7 (100.0% in the age bracket) attending a public institution.
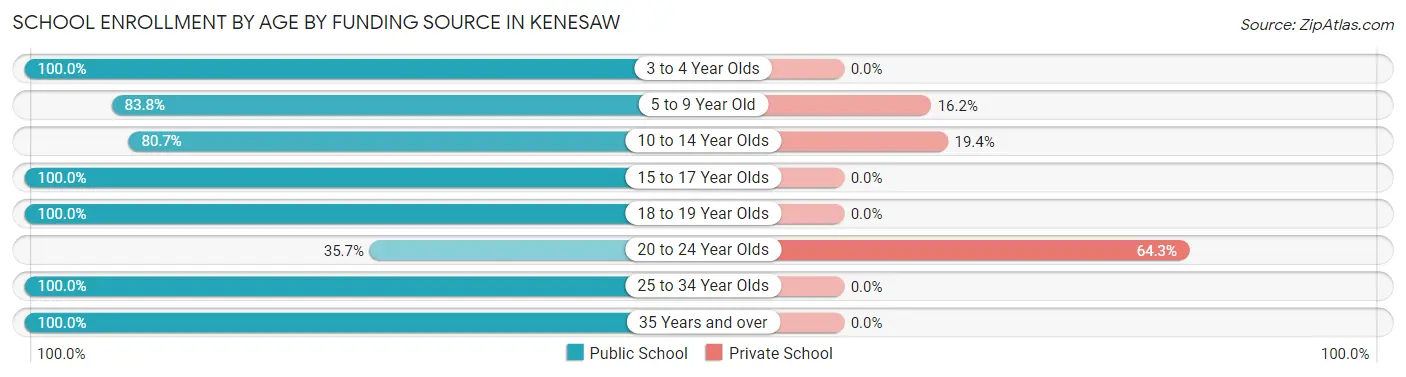
| Age Bracket | Public School | Private School |
| 3 to 4 Year Olds | 7 (100.0%) | 0 (0.0%) |
| 5 to 9 Year Old | 31 (83.8%) | 6 (16.2%) |
| 10 to 14 Year Olds | 50 (80.6%) | 12 (19.4%) |
| 15 to 17 Year Olds | 40 (100.0%) | 0 (0.0%) |
| 18 to 19 Year Olds | 2 (100.0%) | 0 (0.0%) |
| 20 to 24 Year Olds | 5 (35.7%) | 9 (64.3%) |
| 25 to 34 Year Olds | 2 (100.0%) | 0 (0.0%) |
| 35 Years and over | 15 (100.0%) | 0 (0.0%) |
| Total | 152 (84.9%) | 27 (15.1%) |
Educational Attainment by Field of Study in Kenesaw
Business (52 | 24.6%), education (46 | 21.8%), arts & humanities (25 | 11.8%), bio, nature & agricultural (19 | 9.0%), and visual & performing arts (18 | 8.5%) are the most common fields of study among 211 individuals in Kenesaw who have obtained a bachelor's degree or higher.
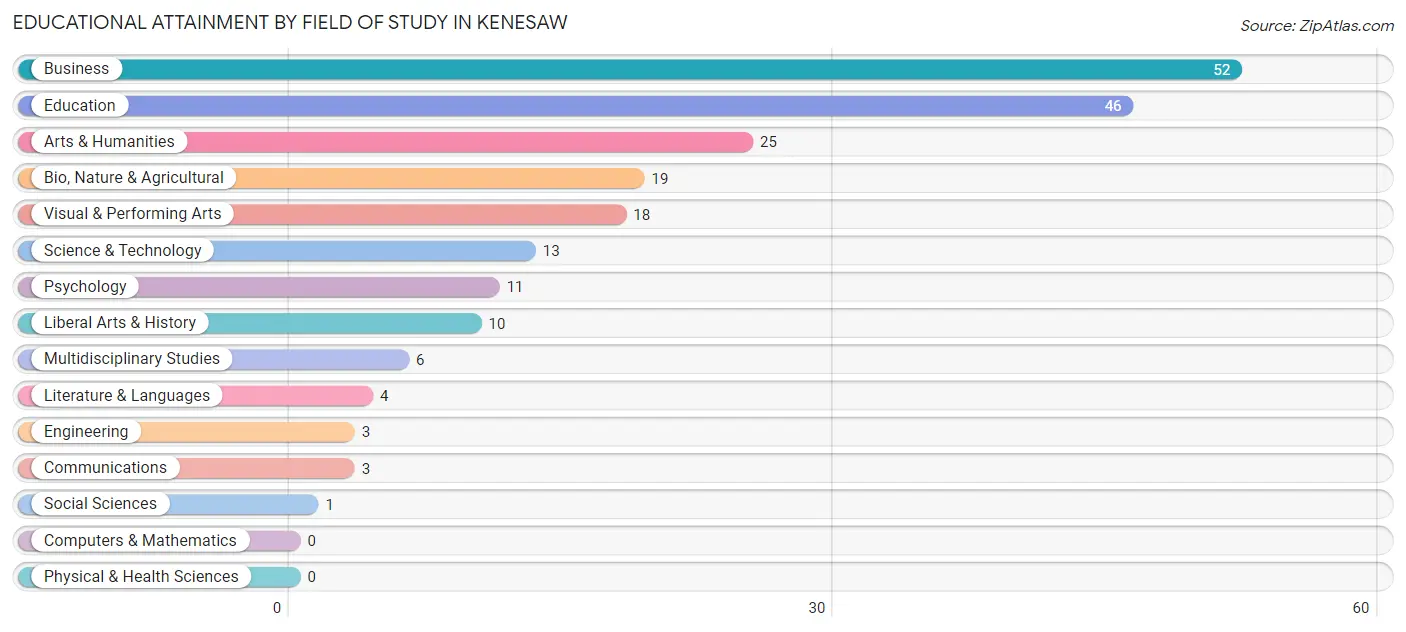
| Field of Study | # Graduates | % Graduates |
| Computers & Mathematics | 0 | 0.0% |
| Bio, Nature & Agricultural | 19 | 9.0% |
| Physical & Health Sciences | 0 | 0.0% |
| Psychology | 11 | 5.2% |
| Social Sciences | 1 | 0.5% |
| Engineering | 3 | 1.4% |
| Multidisciplinary Studies | 6 | 2.8% |
| Science & Technology | 13 | 6.2% |
| Business | 52 | 24.6% |
| Education | 46 | 21.8% |
| Literature & Languages | 4 | 1.9% |
| Liberal Arts & History | 10 | 4.7% |
| Visual & Performing Arts | 18 | 8.5% |
| Communications | 3 | 1.4% |
| Arts & Humanities | 25 | 11.8% |
| Total | 211 | 100.0% |
Transportation & Commute in Kenesaw
Vehicle Availability by Sex in Kenesaw
The most prevalent vehicle ownership categories in Kenesaw are males with 3 vehicles (92, accounting for 39.5%) and females with 3 vehicles (50, making up 58.2%).
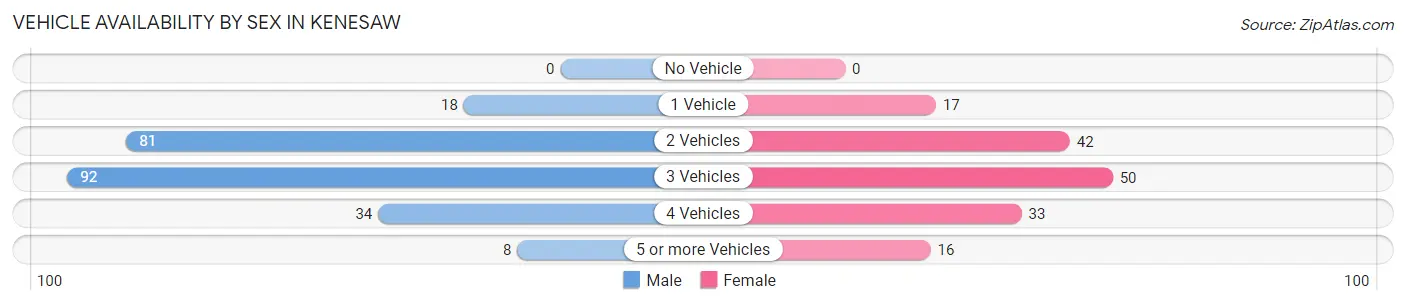
| Vehicles Available | Male | Female |
| No Vehicle | 0 (0.0%) | 0 (0.0%) |
| 1 Vehicle | 18 (7.7%) | 17 (10.8%) |
| 2 Vehicles | 81 (34.8%) | 42 (26.6%) |
| 3 Vehicles | 92 (39.5%) | 50 (31.7%) |
| 4 Vehicles | 34 (14.6%) | 33 (20.9%) |
| 5 or more Vehicles | 8 (3.4%) | 16 (10.1%) |
| Total | 233 (100.0%) | 158 (100.0%) |
Commute Time in Kenesaw
The most frequently occuring commute durations in Kenesaw are 30 to 34 minutes (72 commuters, 19.0%), 25 to 29 minutes (71 commuters, 18.7%), and 5 to 9 minutes (67 commuters, 17.7%).
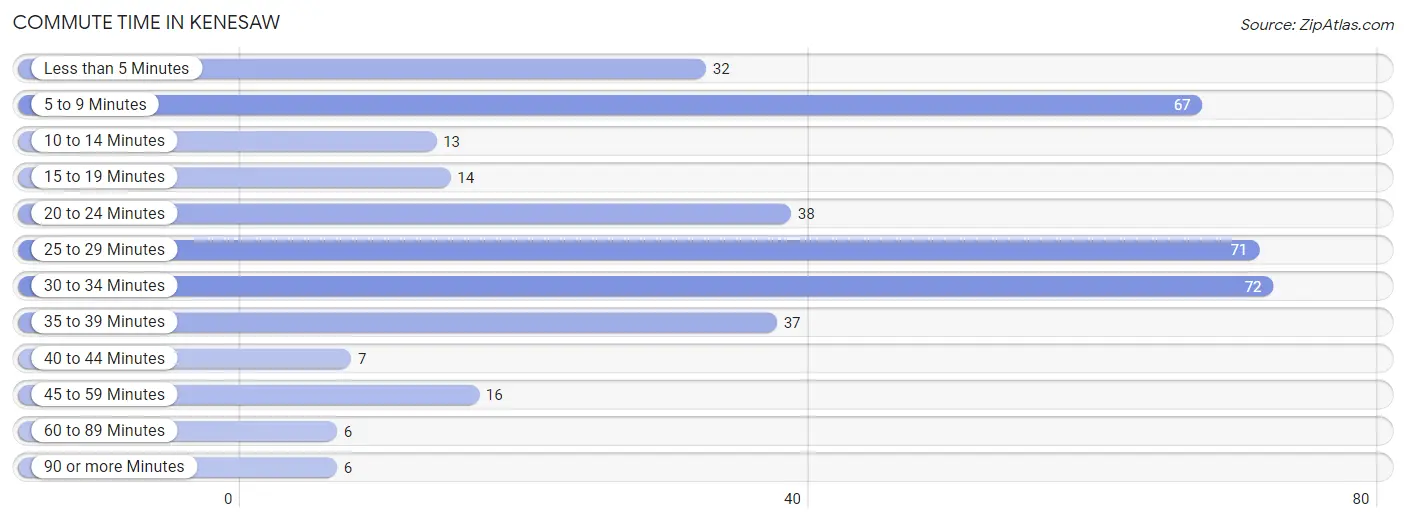
| Commute Time | # Commuters | % Commuters |
| Less than 5 Minutes | 32 | 8.4% |
| 5 to 9 Minutes | 67 | 17.7% |
| 10 to 14 Minutes | 13 | 3.4% |
| 15 to 19 Minutes | 14 | 3.7% |
| 20 to 24 Minutes | 38 | 10.0% |
| 25 to 29 Minutes | 71 | 18.7% |
| 30 to 34 Minutes | 72 | 19.0% |
| 35 to 39 Minutes | 37 | 9.8% |
| 40 to 44 Minutes | 7 | 1.8% |
| 45 to 59 Minutes | 16 | 4.2% |
| 60 to 89 Minutes | 6 | 1.6% |
| 90 or more Minutes | 6 | 1.6% |
Commute Time by Sex in Kenesaw
The most common commute times in Kenesaw are 5 to 9 minutes (49 commuters, 21.8%) for males and 25 to 29 minutes (42 commuters, 27.3%) for females.
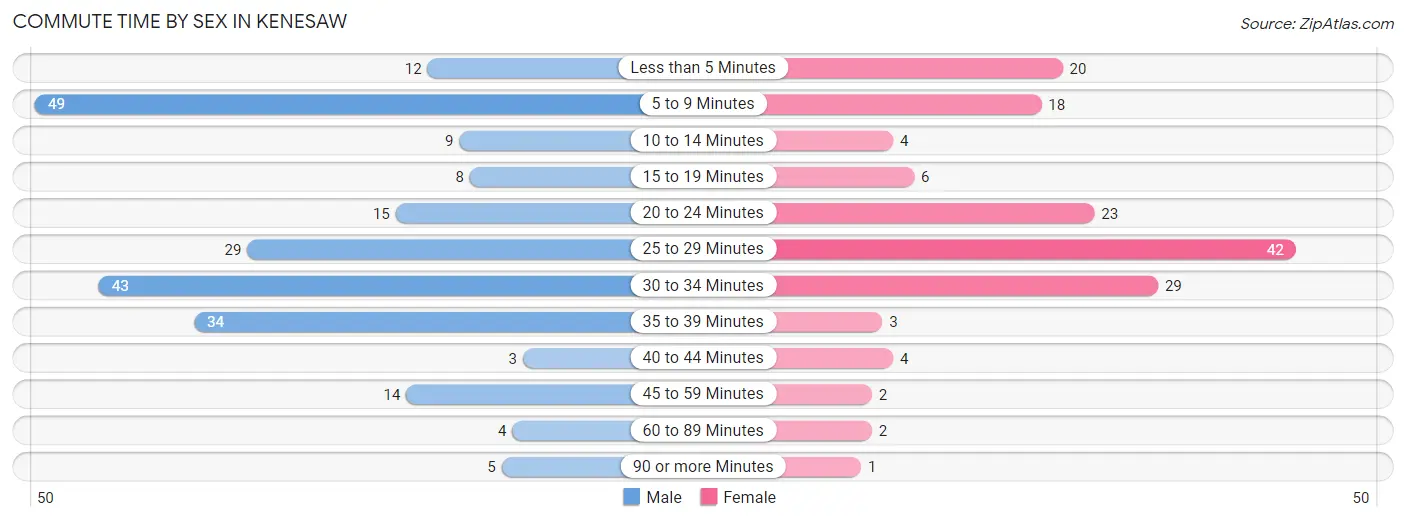
| Commute Time | Male | Female |
| Less than 5 Minutes | 12 (5.3%) | 20 (13.0%) |
| 5 to 9 Minutes | 49 (21.8%) | 18 (11.7%) |
| 10 to 14 Minutes | 9 (4.0%) | 4 (2.6%) |
| 15 to 19 Minutes | 8 (3.6%) | 6 (3.9%) |
| 20 to 24 Minutes | 15 (6.7%) | 23 (14.9%) |
| 25 to 29 Minutes | 29 (12.9%) | 42 (27.3%) |
| 30 to 34 Minutes | 43 (19.1%) | 29 (18.8%) |
| 35 to 39 Minutes | 34 (15.1%) | 3 (1.9%) |
| 40 to 44 Minutes | 3 (1.3%) | 4 (2.6%) |
| 45 to 59 Minutes | 14 (6.2%) | 2 (1.3%) |
| 60 to 89 Minutes | 4 (1.8%) | 2 (1.3%) |
| 90 or more Minutes | 5 (2.2%) | 1 (0.6%) |
Time of Departure to Work by Sex in Kenesaw
The most frequent times of departure to work in Kenesaw are 7:00 AM to 7:29 AM (60, 26.7%) for males and 7:30 AM to 7:59 AM (41, 26.6%) for females.
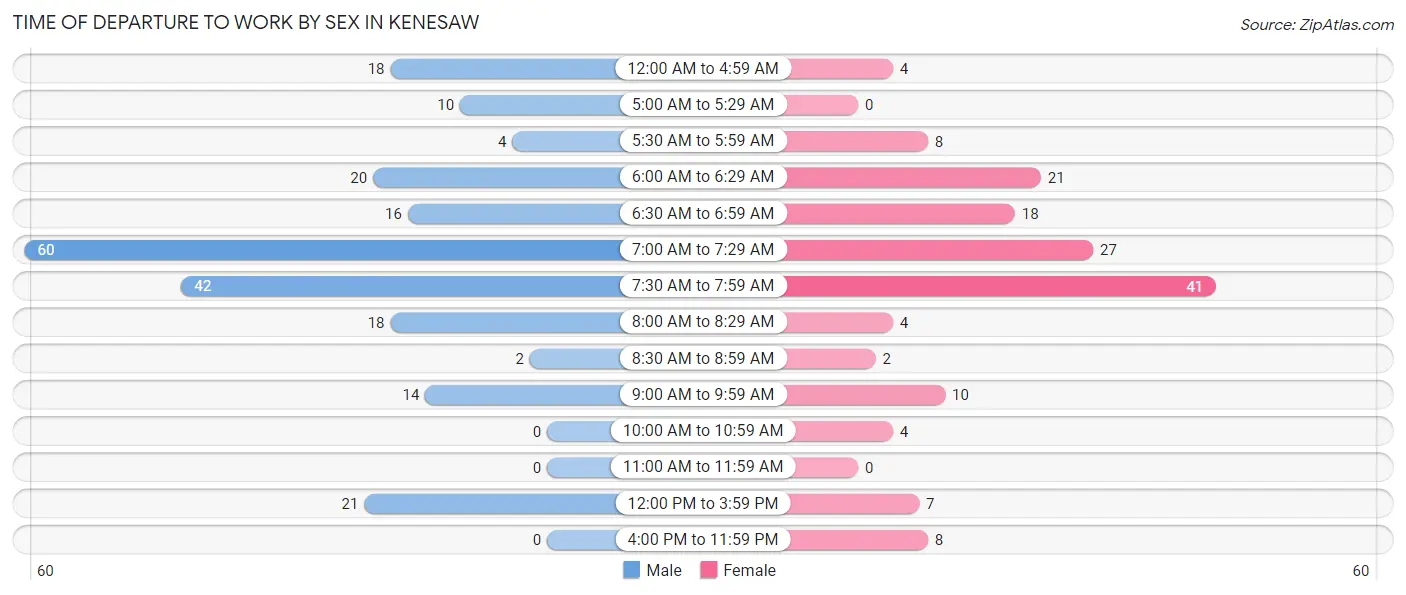
| Time of Departure | Male | Female |
| 12:00 AM to 4:59 AM | 18 (8.0%) | 4 (2.6%) |
| 5:00 AM to 5:29 AM | 10 (4.4%) | 0 (0.0%) |
| 5:30 AM to 5:59 AM | 4 (1.8%) | 8 (5.2%) |
| 6:00 AM to 6:29 AM | 20 (8.9%) | 21 (13.6%) |
| 6:30 AM to 6:59 AM | 16 (7.1%) | 18 (11.7%) |
| 7:00 AM to 7:29 AM | 60 (26.7%) | 27 (17.5%) |
| 7:30 AM to 7:59 AM | 42 (18.7%) | 41 (26.6%) |
| 8:00 AM to 8:29 AM | 18 (8.0%) | 4 (2.6%) |
| 8:30 AM to 8:59 AM | 2 (0.9%) | 2 (1.3%) |
| 9:00 AM to 9:59 AM | 14 (6.2%) | 10 (6.5%) |
| 10:00 AM to 10:59 AM | 0 (0.0%) | 4 (2.6%) |
| 11:00 AM to 11:59 AM | 0 (0.0%) | 0 (0.0%) |
| 12:00 PM to 3:59 PM | 21 (9.3%) | 7 (4.5%) |
| 4:00 PM to 11:59 PM | 0 (0.0%) | 8 (5.2%) |
| Total | 225 (100.0%) | 154 (100.0%) |
Housing Occupancy in Kenesaw
Occupancy by Ownership in Kenesaw
Of the total 315 dwellings in Kenesaw, owner-occupied units account for 273 (86.7%), while renter-occupied units make up 42 (13.3%).
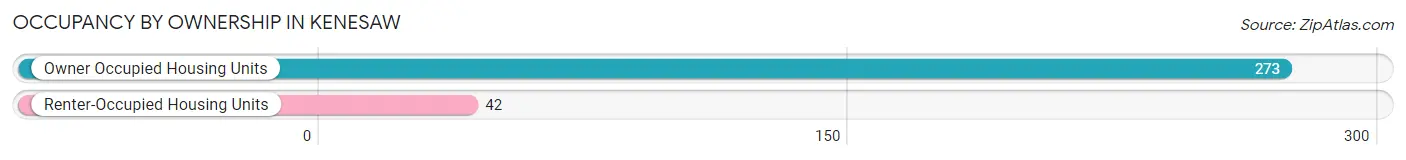
| Occupancy | # Housing Units | % Housing Units |
| Owner Occupied Housing Units | 273 | 86.7% |
| Renter-Occupied Housing Units | 42 | 13.3% |
| Total Occupied Housing Units | 315 | 100.0% |
Occupancy by Household Size in Kenesaw
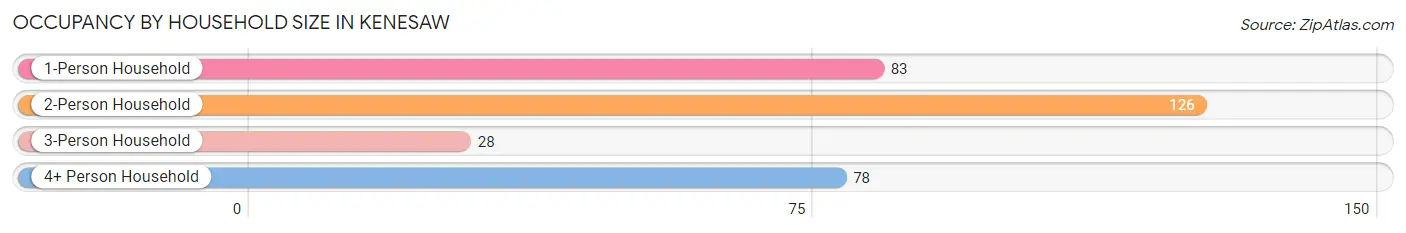
| Household Size | # Housing Units | % Housing Units |
| 1-Person Household | 83 | 26.4% |
| 2-Person Household | 126 | 40.0% |
| 3-Person Household | 28 | 8.9% |
| 4+ Person Household | 78 | 24.8% |
| Total Housing Units | 315 | 100.0% |
Occupancy by Ownership by Household Size in Kenesaw
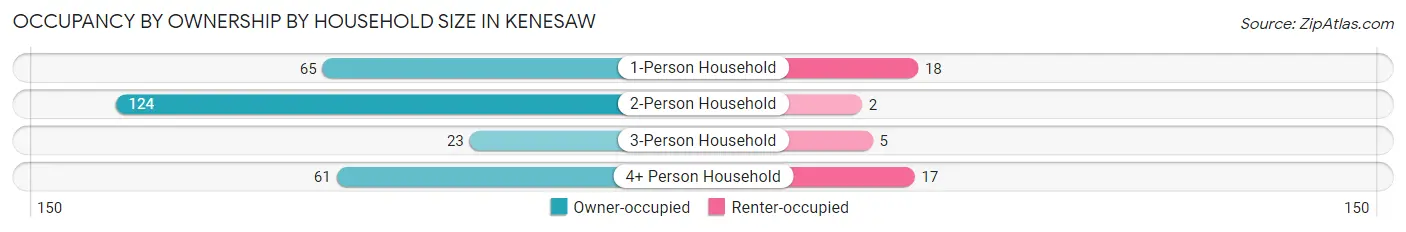
| Household Size | Owner-occupied | Renter-occupied |
| 1-Person Household | 65 (78.3%) | 18 (21.7%) |
| 2-Person Household | 124 (98.4%) | 2 (1.6%) |
| 3-Person Household | 23 (82.1%) | 5 (17.9%) |
| 4+ Person Household | 61 (78.2%) | 17 (21.8%) |
| Total Housing Units | 273 (86.7%) | 42 (13.3%) |
Occupancy by Educational Attainment in Kenesaw
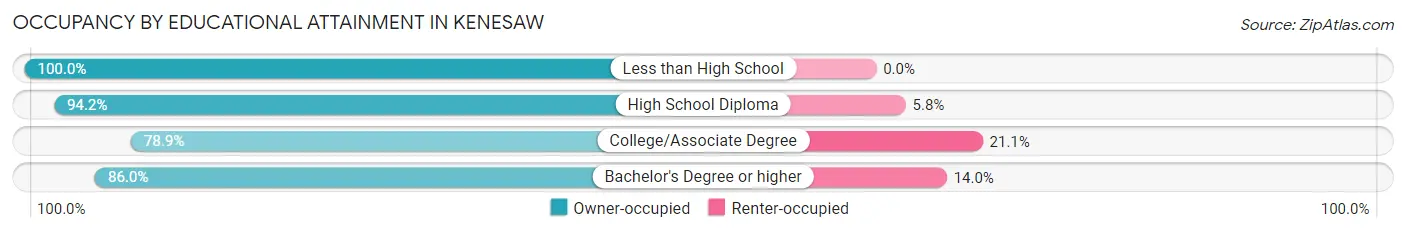
| Household Size | Owner-occupied | Renter-occupied |
| Less than High School | 10 (100.0%) | 0 (0.0%) |
| High School Diploma | 97 (94.2%) | 6 (5.8%) |
| College/Associate Degree | 86 (78.9%) | 23 (21.1%) |
| Bachelor's Degree or higher | 80 (86.0%) | 13 (14.0%) |
Occupancy by Age of Householder in Kenesaw
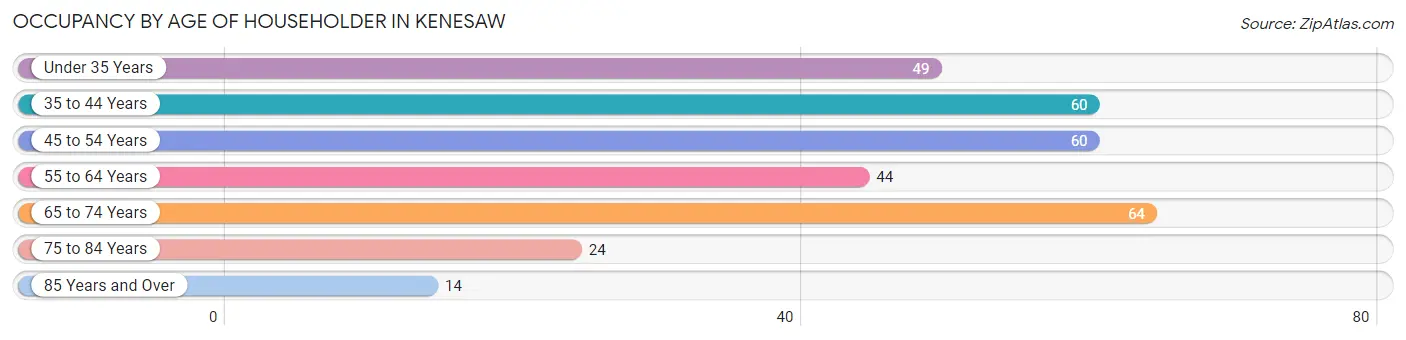
| Age Bracket | # Households | % Households |
| Under 35 Years | 49 | 15.6% |
| 35 to 44 Years | 60 | 19.1% |
| 45 to 54 Years | 60 | 19.1% |
| 55 to 64 Years | 44 | 14.0% |
| 65 to 74 Years | 64 | 20.3% |
| 75 to 84 Years | 24 | 7.6% |
| 85 Years and Over | 14 | 4.4% |
| Total | 315 | 100.0% |
Housing Finances in Kenesaw
Median Income by Occupancy in Kenesaw
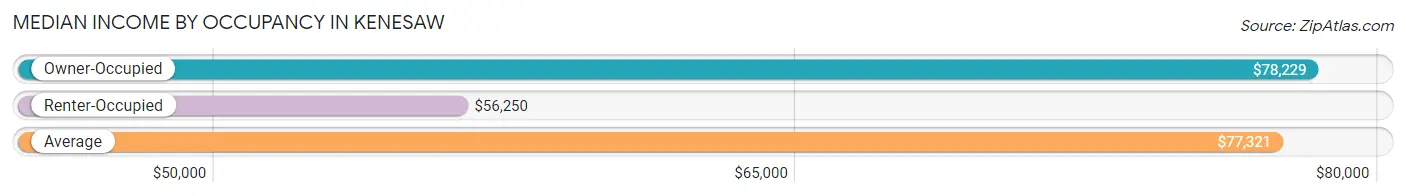
| Occupancy Type | # Households | Median Income |
| Owner-Occupied | 273 (86.7%) | $78,229 |
| Renter-Occupied | 42 (13.3%) | $56,250 |
| Average | 315 (100.0%) | $77,321 |
Occupancy by Householder Income Bracket in Kenesaw
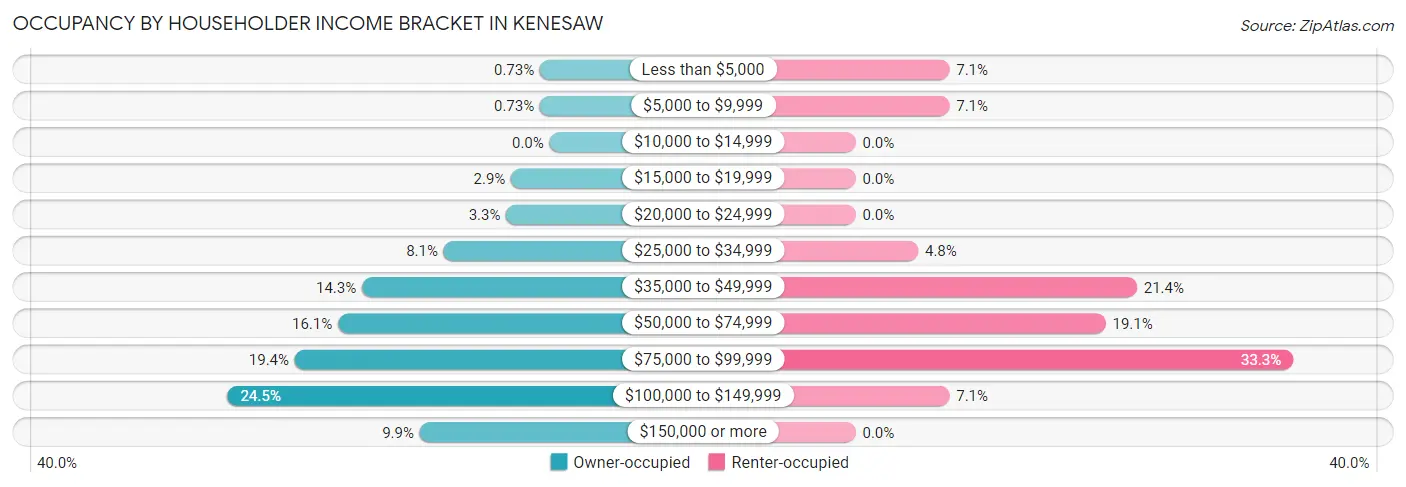
| Income Bracket | Owner-occupied | Renter-occupied |
| Less than $5,000 | 2 (0.7%) | 3 (7.1%) |
| $5,000 to $9,999 | 2 (0.7%) | 3 (7.1%) |
| $10,000 to $14,999 | 0 (0.0%) | 0 (0.0%) |
| $15,000 to $19,999 | 8 (2.9%) | 0 (0.0%) |
| $20,000 to $24,999 | 9 (3.3%) | 0 (0.0%) |
| $25,000 to $34,999 | 22 (8.1%) | 2 (4.8%) |
| $35,000 to $49,999 | 39 (14.3%) | 9 (21.4%) |
| $50,000 to $74,999 | 44 (16.1%) | 8 (19.1%) |
| $75,000 to $99,999 | 53 (19.4%) | 14 (33.3%) |
| $100,000 to $149,999 | 67 (24.5%) | 3 (7.1%) |
| $150,000 or more | 27 (9.9%) | 0 (0.0%) |
| Total | 273 (100.0%) | 42 (100.0%) |
Monthly Housing Cost Tiers in Kenesaw
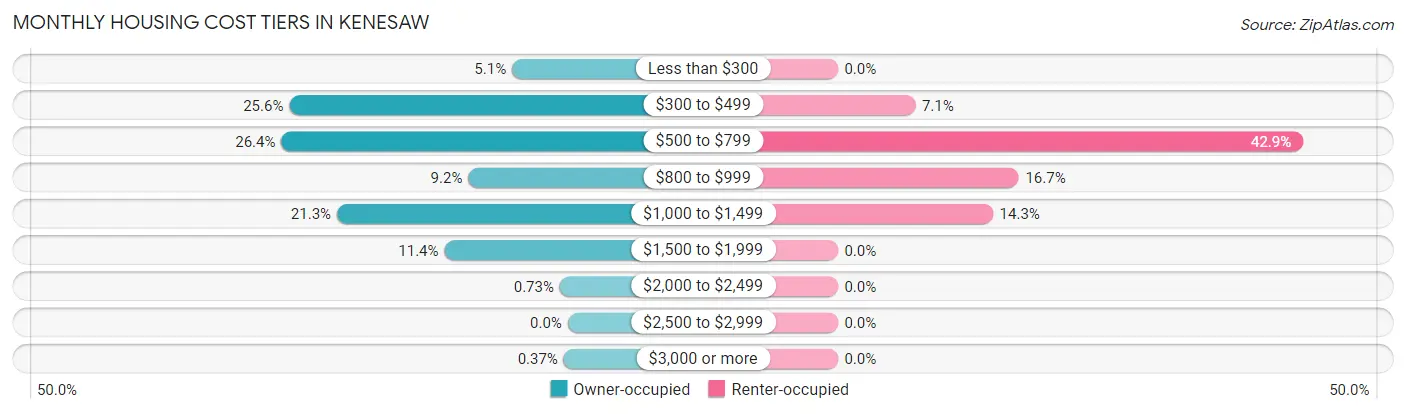
| Monthly Cost | Owner-occupied | Renter-occupied |
| Less than $300 | 14 (5.1%) | 0 (0.0%) |
| $300 to $499 | 70 (25.6%) | 3 (7.1%) |
| $500 to $799 | 72 (26.4%) | 18 (42.9%) |
| $800 to $999 | 25 (9.2%) | 7 (16.7%) |
| $1,000 to $1,499 | 58 (21.2%) | 6 (14.3%) |
| $1,500 to $1,999 | 31 (11.4%) | 0 (0.0%) |
| $2,000 to $2,499 | 2 (0.7%) | 0 (0.0%) |
| $2,500 to $2,999 | 0 (0.0%) | 0 (0.0%) |
| $3,000 or more | 1 (0.4%) | 0 (0.0%) |
| Total | 273 (100.0%) | 42 (100.0%) |
Physical Housing Characteristics in Kenesaw
Housing Structures in Kenesaw
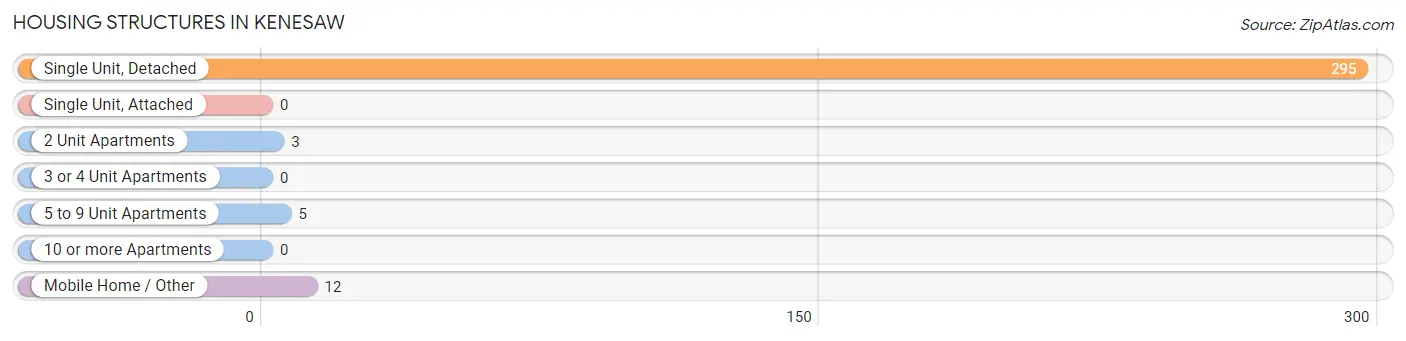
| Structure Type | # Housing Units | % Housing Units |
| Single Unit, Detached | 295 | 93.6% |
| Single Unit, Attached | 0 | 0.0% |
| 2 Unit Apartments | 3 | 0.9% |
| 3 or 4 Unit Apartments | 0 | 0.0% |
| 5 to 9 Unit Apartments | 5 | 1.6% |
| 10 or more Apartments | 0 | 0.0% |
| Mobile Home / Other | 12 | 3.8% |
| Total | 315 | 100.0% |
Housing Structures by Occupancy in Kenesaw
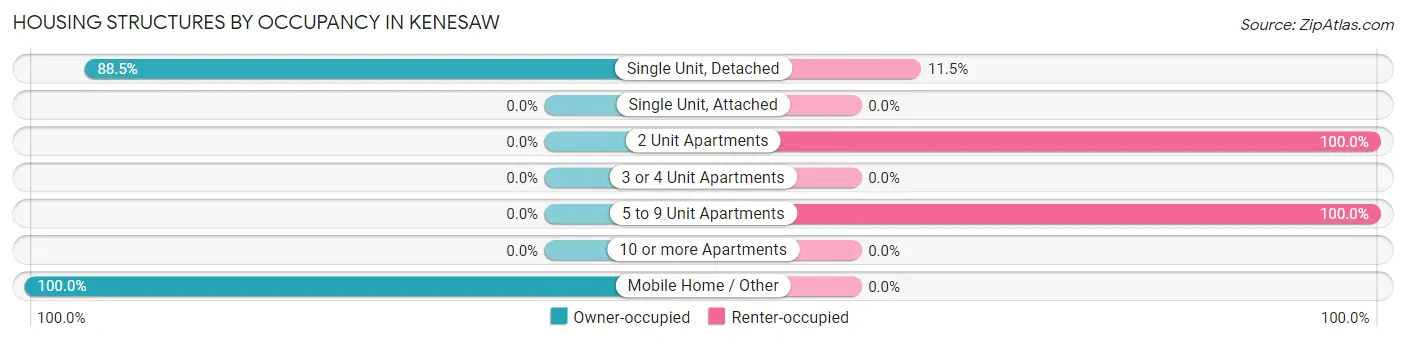
| Structure Type | Owner-occupied | Renter-occupied |
| Single Unit, Detached | 261 (88.5%) | 34 (11.5%) |
| Single Unit, Attached | 0 (0.0%) | 0 (0.0%) |
| 2 Unit Apartments | 0 (0.0%) | 3 (100.0%) |
| 3 or 4 Unit Apartments | 0 (0.0%) | 0 (0.0%) |
| 5 to 9 Unit Apartments | 0 (0.0%) | 5 (100.0%) |
| 10 or more Apartments | 0 (0.0%) | 0 (0.0%) |
| Mobile Home / Other | 12 (100.0%) | 0 (0.0%) |
| Total | 273 (86.7%) | 42 (13.3%) |
Housing Structures by Number of Rooms in Kenesaw
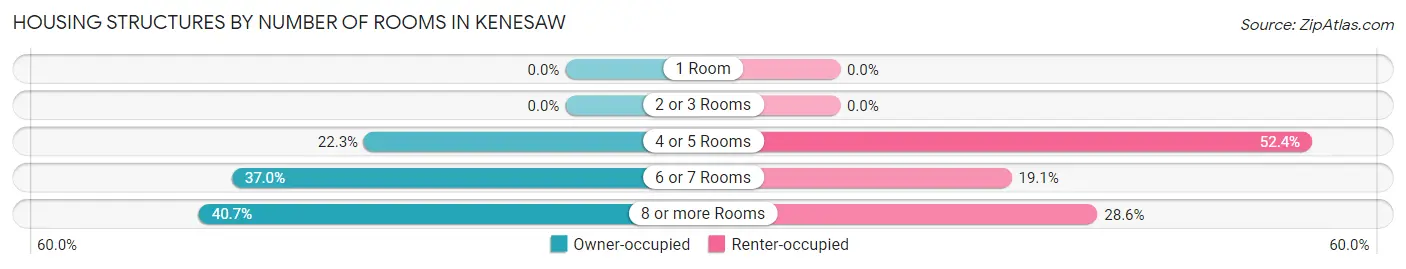
| Number of Rooms | Owner-occupied | Renter-occupied |
| 1 Room | 0 (0.0%) | 0 (0.0%) |
| 2 or 3 Rooms | 0 (0.0%) | 0 (0.0%) |
| 4 or 5 Rooms | 61 (22.3%) | 22 (52.4%) |
| 6 or 7 Rooms | 101 (37.0%) | 8 (19.1%) |
| 8 or more Rooms | 111 (40.7%) | 12 (28.6%) |
| Total | 273 (100.0%) | 42 (100.0%) |
Housing Structure by Heating Type in Kenesaw
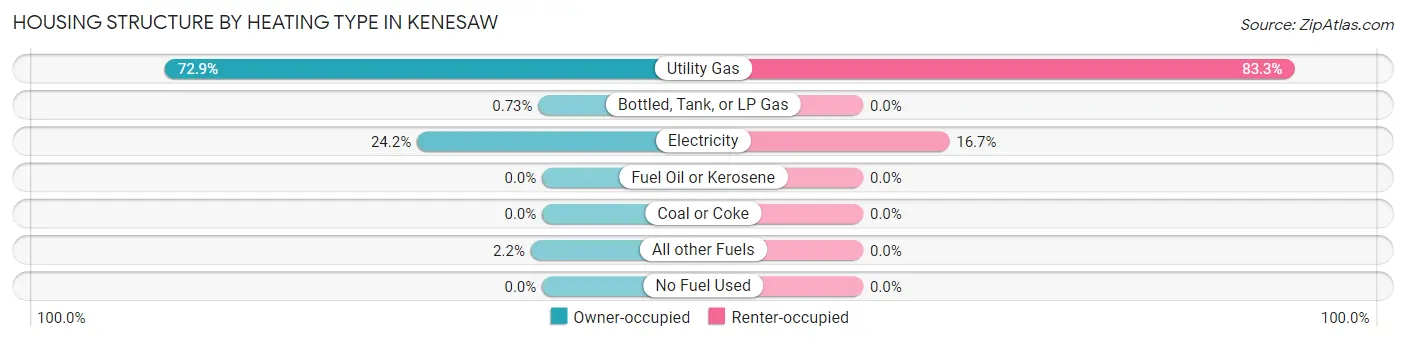
| Heating Type | Owner-occupied | Renter-occupied |
| Utility Gas | 199 (72.9%) | 35 (83.3%) |
| Bottled, Tank, or LP Gas | 2 (0.7%) | 0 (0.0%) |
| Electricity | 66 (24.2%) | 7 (16.7%) |
| Fuel Oil or Kerosene | 0 (0.0%) | 0 (0.0%) |
| Coal or Coke | 0 (0.0%) | 0 (0.0%) |
| All other Fuels | 6 (2.2%) | 0 (0.0%) |
| No Fuel Used | 0 (0.0%) | 0 (0.0%) |
| Total | 273 (100.0%) | 42 (100.0%) |
Household Vehicle Usage in Kenesaw
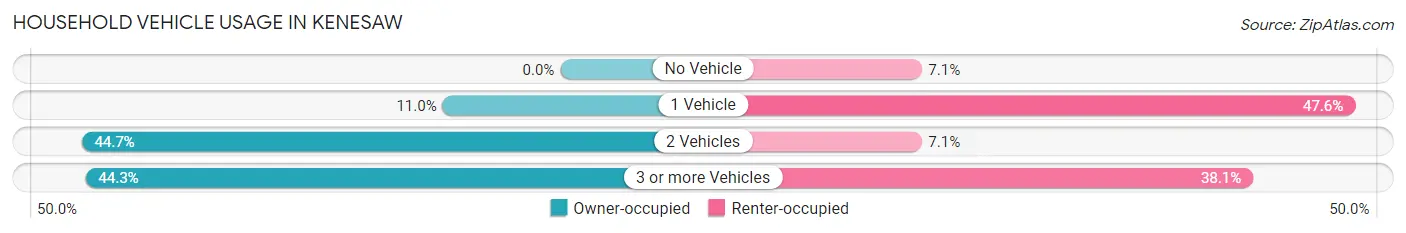
| Vehicles per Household | Owner-occupied | Renter-occupied |
| No Vehicle | 0 (0.0%) | 3 (7.1%) |
| 1 Vehicle | 30 (11.0%) | 20 (47.6%) |
| 2 Vehicles | 122 (44.7%) | 3 (7.1%) |
| 3 or more Vehicles | 121 (44.3%) | 16 (38.1%) |
| Total | 273 (100.0%) | 42 (100.0%) |
Real Estate & Mortgages in Kenesaw
Real Estate and Mortgage Overview in Kenesaw
| Characteristic | Without Mortgage | With Mortgage |
| Housing Units | 163 | 110 |
| Median Property Value | $119,100 | $176,300 |
| Median Household Income | $56,417 | $19 |
| Monthly Housing Costs | $494 | $0 |
| Real Estate Taxes | $1,711 | $6 |
Property Value by Mortgage Status in Kenesaw
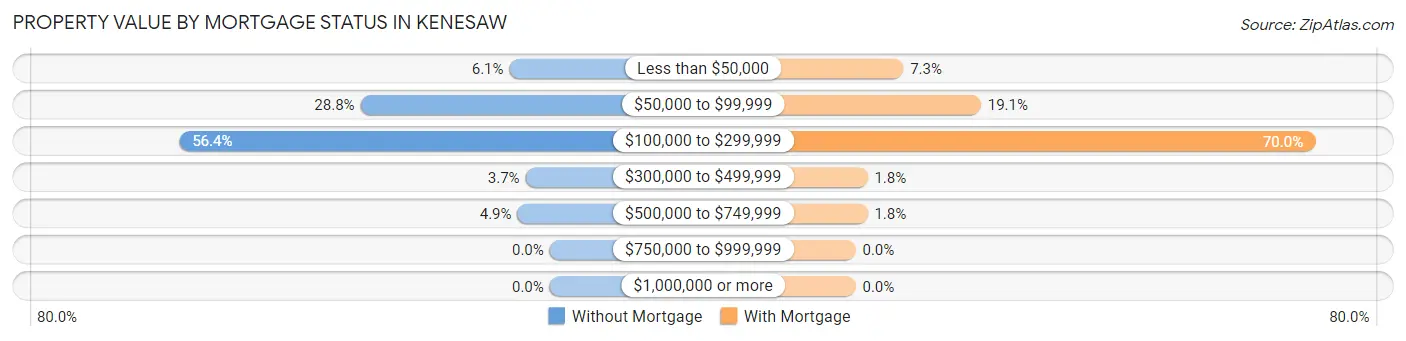
| Property Value | Without Mortgage | With Mortgage |
| Less than $50,000 | 10 (6.1%) | 8 (7.3%) |
| $50,000 to $99,999 | 47 (28.8%) | 21 (19.1%) |
| $100,000 to $299,999 | 92 (56.4%) | 77 (70.0%) |
| $300,000 to $499,999 | 6 (3.7%) | 2 (1.8%) |
| $500,000 to $749,999 | 8 (4.9%) | 2 (1.8%) |
| $750,000 to $999,999 | 0 (0.0%) | 0 (0.0%) |
| $1,000,000 or more | 0 (0.0%) | 0 (0.0%) |
| Total | 163 (100.0%) | 110 (100.0%) |
Household Income by Mortgage Status in Kenesaw
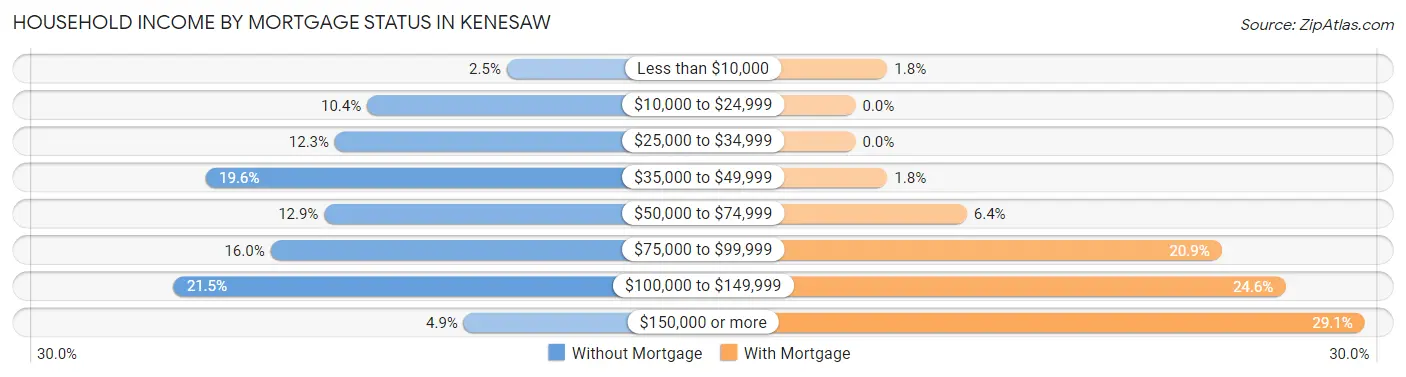
| Household Income | Without Mortgage | With Mortgage |
| Less than $10,000 | 4 (2.5%) | 2 (1.8%) |
| $10,000 to $24,999 | 17 (10.4%) | 0 (0.0%) |
| $25,000 to $34,999 | 20 (12.3%) | 0 (0.0%) |
| $35,000 to $49,999 | 32 (19.6%) | 2 (1.8%) |
| $50,000 to $74,999 | 21 (12.9%) | 7 (6.4%) |
| $75,000 to $99,999 | 26 (16.0%) | 23 (20.9%) |
| $100,000 to $149,999 | 35 (21.5%) | 27 (24.5%) |
| $150,000 or more | 8 (4.9%) | 32 (29.1%) |
| Total | 163 (100.0%) | 110 (100.0%) |
Property Value to Household Income Ratio in Kenesaw
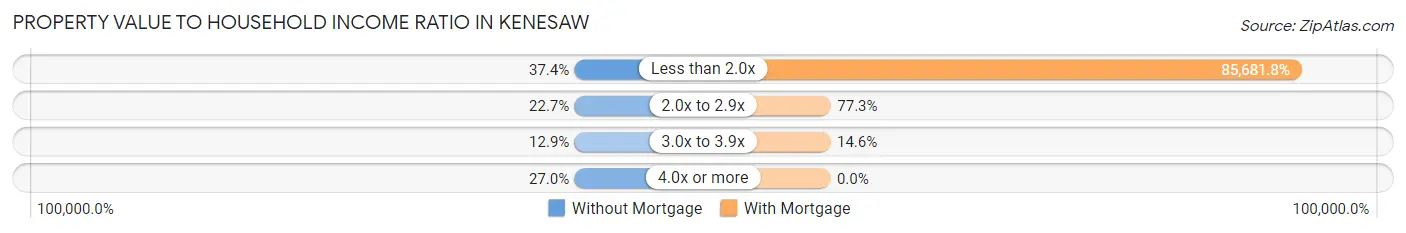
| Value-to-Income Ratio | Without Mortgage | With Mortgage |
| Less than 2.0x | 61 (37.4%) | 94,250 (85,681.8%) |
| 2.0x to 2.9x | 37 (22.7%) | 85 (77.3%) |
| 3.0x to 3.9x | 21 (12.9%) | 16 (14.5%) |
| 4.0x or more | 44 (27.0%) | 0 (0.0%) |
| Total | 163 (100.0%) | 110 (100.0%) |
Real Estate Taxes by Mortgage Status in Kenesaw
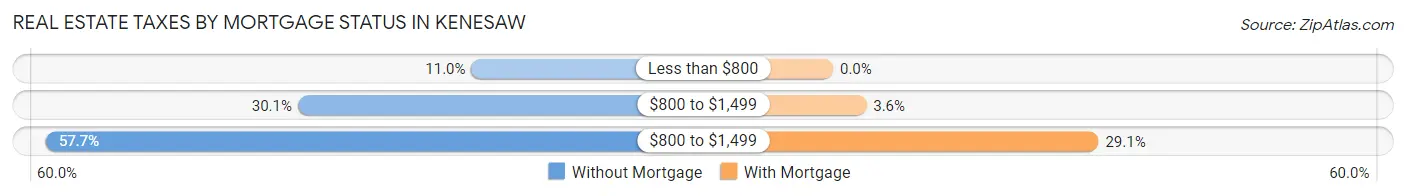
| Property Taxes | Without Mortgage | With Mortgage |
| Less than $800 | 18 (11.0%) | 0 (0.0%) |
| $800 to $1,499 | 49 (30.1%) | 4 (3.6%) |
| $800 to $1,499 | 94 (57.7%) | 32 (29.1%) |
| Total | 163 (100.0%) | 110 (100.0%) |
Health & Disability in Kenesaw
Health Insurance Coverage by Age in Kenesaw
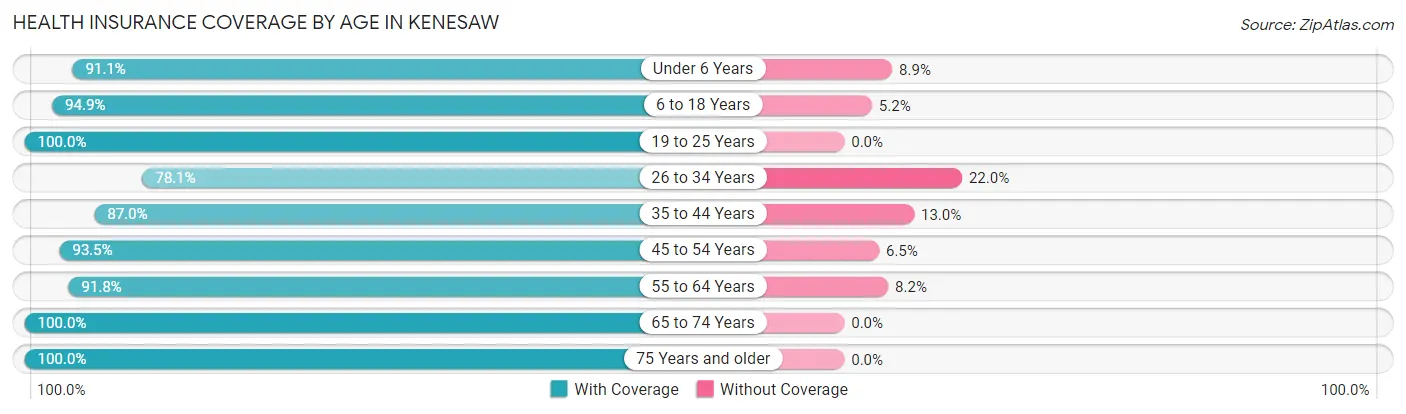
| Age Bracket | With Coverage | Without Coverage |
| Under 6 Years | 51 (91.1%) | 5 (8.9%) |
| 6 to 18 Years | 129 (94.9%) | 7 (5.1%) |
| 19 to 25 Years | 32 (100.0%) | 0 (0.0%) |
| 26 to 34 Years | 64 (78.0%) | 18 (22.0%) |
| 35 to 44 Years | 87 (87.0%) | 13 (13.0%) |
| 45 to 54 Years | 101 (93.5%) | 7 (6.5%) |
| 55 to 64 Years | 101 (91.8%) | 9 (8.2%) |
| 65 to 74 Years | 95 (100.0%) | 0 (0.0%) |
| 75 Years and older | 61 (100.0%) | 0 (0.0%) |
| Total | 721 (92.4%) | 59 (7.6%) |
Health Insurance Coverage by Citizenship Status in Kenesaw
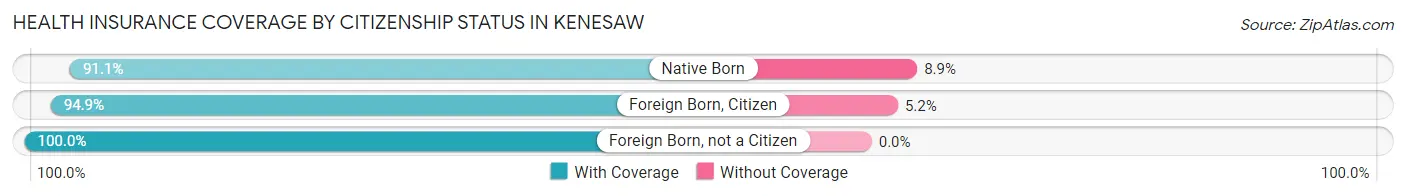
| Citizenship Status | With Coverage | Without Coverage |
| Native Born | 51 (91.1%) | 5 (8.9%) |
| Foreign Born, Citizen | 129 (94.9%) | 7 (5.1%) |
| Foreign Born, not a Citizen | 32 (100.0%) | 0 (0.0%) |
Health Insurance Coverage by Household Income in Kenesaw
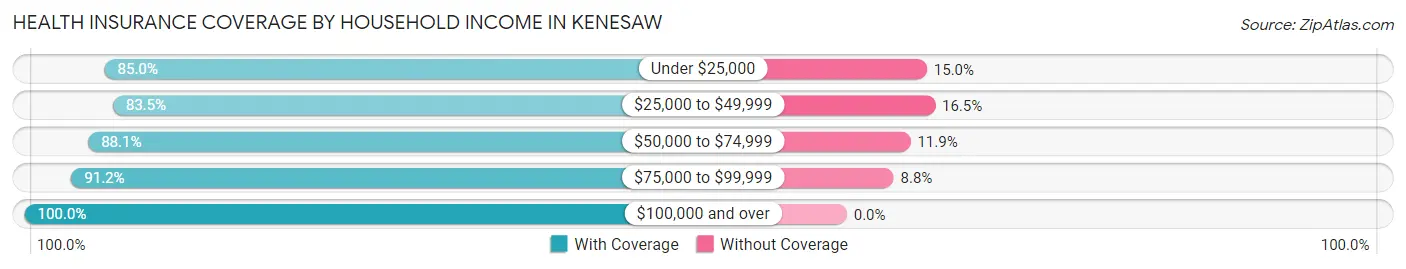
| Household Income | With Coverage | Without Coverage |
| Under $25,000 | 34 (85.0%) | 6 (15.0%) |
| $25,000 to $49,999 | 101 (83.5%) | 20 (16.5%) |
| $50,000 to $74,999 | 96 (88.1%) | 13 (11.9%) |
| $75,000 to $99,999 | 208 (91.2%) | 20 (8.8%) |
| $100,000 and over | 282 (100.0%) | 0 (0.0%) |
Public vs Private Health Insurance Coverage by Age in Kenesaw
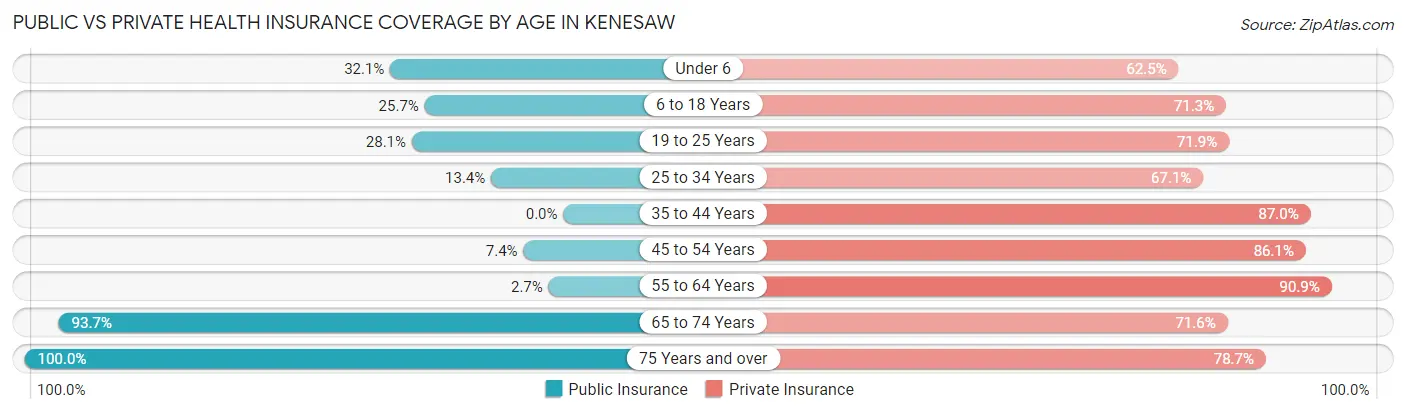
| Age Bracket | Public Insurance | Private Insurance |
| Under 6 | 18 (32.1%) | 35 (62.5%) |
| 6 to 18 Years | 35 (25.7%) | 97 (71.3%) |
| 19 to 25 Years | 9 (28.1%) | 23 (71.9%) |
| 25 to 34 Years | 11 (13.4%) | 55 (67.1%) |
| 35 to 44 Years | 0 (0.0%) | 87 (87.0%) |
| 45 to 54 Years | 8 (7.4%) | 93 (86.1%) |
| 55 to 64 Years | 3 (2.7%) | 100 (90.9%) |
| 65 to 74 Years | 89 (93.7%) | 68 (71.6%) |
| 75 Years and over | 61 (100.0%) | 48 (78.7%) |
| Total | 234 (30.0%) | 606 (77.7%) |
Disability Status by Sex by Age in Kenesaw
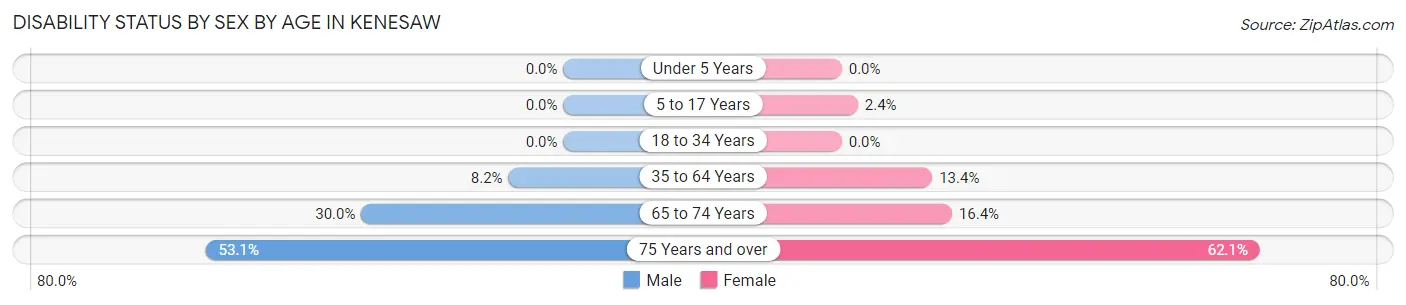
| Age Bracket | Male | Female |
| Under 5 Years | 0 (0.0%) | 0 (0.0%) |
| 5 to 17 Years | 0 (0.0%) | 2 (2.4%) |
| 18 to 34 Years | 0 (0.0%) | 0 (0.0%) |
| 35 to 64 Years | 15 (8.2%) | 18 (13.4%) |
| 65 to 74 Years | 12 (30.0%) | 9 (16.4%) |
| 75 Years and over | 17 (53.1%) | 18 (62.1%) |
Disability Class by Sex by Age in Kenesaw
Disability Class: Hearing Difficulty
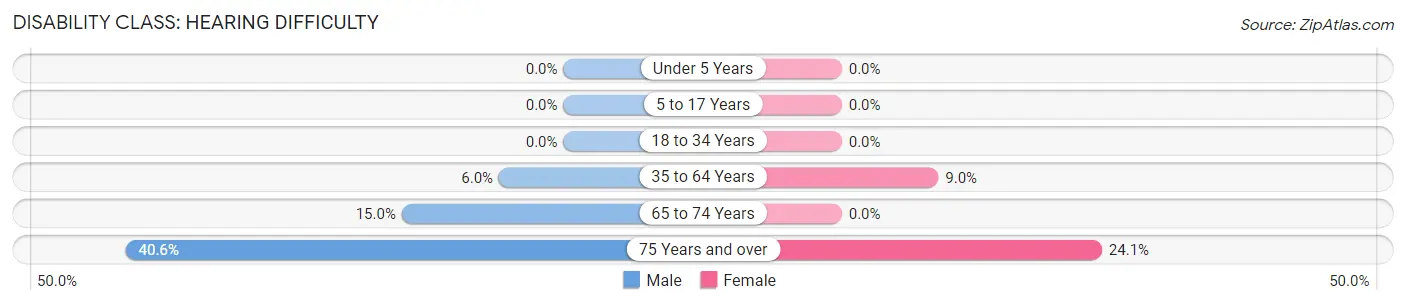
| Age Bracket | Male | Female |
| Under 5 Years | 0 (0.0%) | 0 (0.0%) |
| 5 to 17 Years | 0 (0.0%) | 0 (0.0%) |
| 18 to 34 Years | 0 (0.0%) | 0 (0.0%) |
| 35 to 64 Years | 11 (6.0%) | 12 (9.0%) |
| 65 to 74 Years | 6 (15.0%) | 0 (0.0%) |
| 75 Years and over | 13 (40.6%) | 7 (24.1%) |
Disability Class: Vision Difficulty
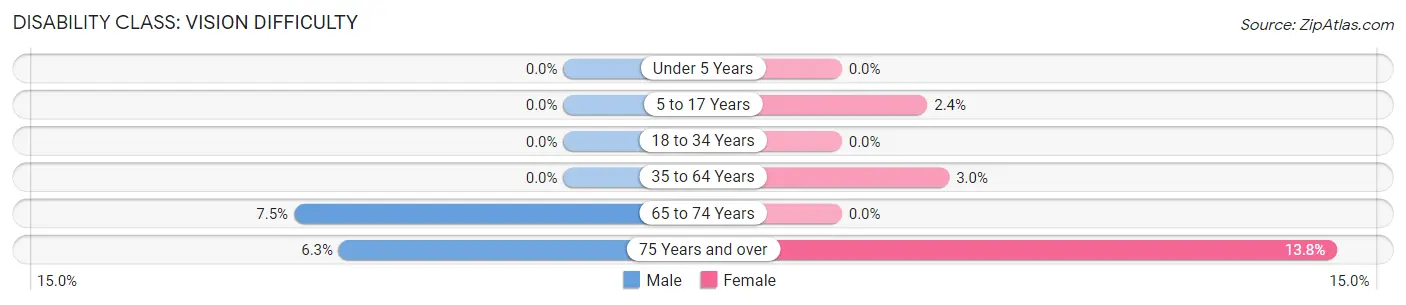
| Age Bracket | Male | Female |
| Under 5 Years | 0 (0.0%) | 0 (0.0%) |
| 5 to 17 Years | 0 (0.0%) | 2 (2.4%) |
| 18 to 34 Years | 0 (0.0%) | 0 (0.0%) |
| 35 to 64 Years | 0 (0.0%) | 4 (3.0%) |
| 65 to 74 Years | 3 (7.5%) | 0 (0.0%) |
| 75 Years and over | 2 (6.2%) | 4 (13.8%) |
Disability Class: Cognitive Difficulty
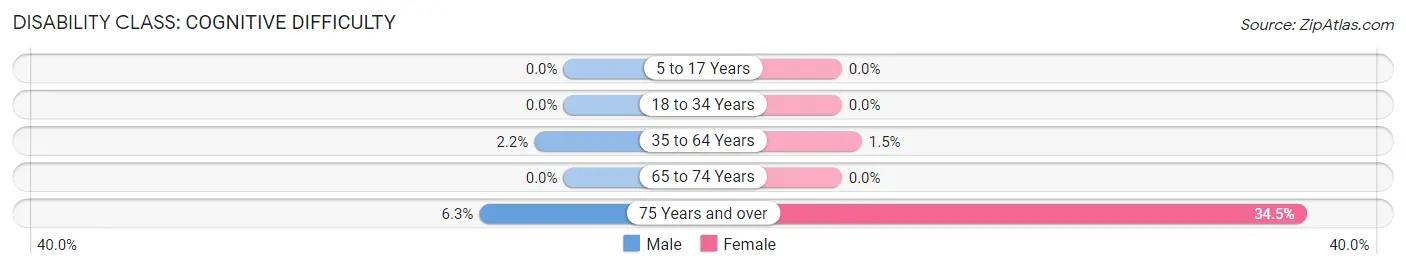
| Age Bracket | Male | Female |
| 5 to 17 Years | 0 (0.0%) | 0 (0.0%) |
| 18 to 34 Years | 0 (0.0%) | 0 (0.0%) |
| 35 to 64 Years | 4 (2.2%) | 2 (1.5%) |
| 65 to 74 Years | 0 (0.0%) | 0 (0.0%) |
| 75 Years and over | 2 (6.2%) | 10 (34.5%) |
Disability Class: Ambulatory Difficulty
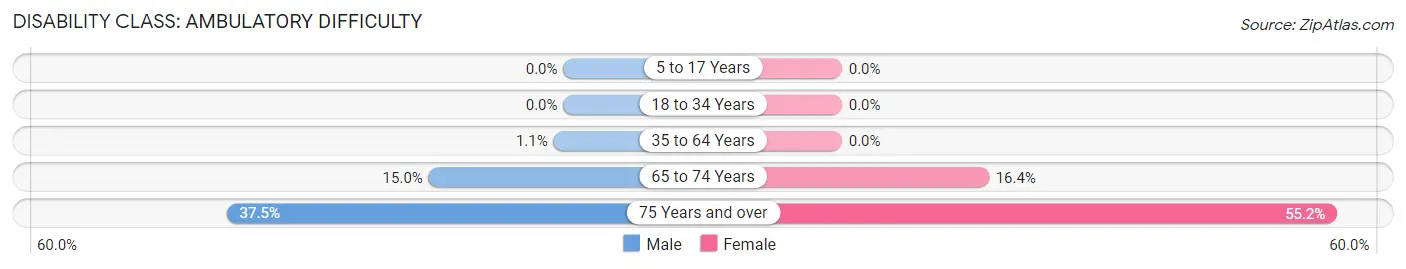
| Age Bracket | Male | Female |
| 5 to 17 Years | 0 (0.0%) | 0 (0.0%) |
| 18 to 34 Years | 0 (0.0%) | 0 (0.0%) |
| 35 to 64 Years | 2 (1.1%) | 0 (0.0%) |
| 65 to 74 Years | 6 (15.0%) | 9 (16.4%) |
| 75 Years and over | 12 (37.5%) | 16 (55.2%) |
Disability Class: Self-Care Difficulty
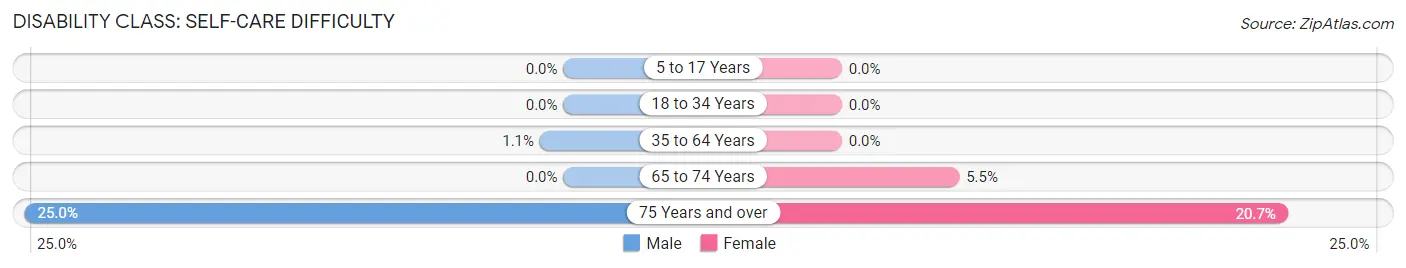
| Age Bracket | Male | Female |
| 5 to 17 Years | 0 (0.0%) | 0 (0.0%) |
| 18 to 34 Years | 0 (0.0%) | 0 (0.0%) |
| 35 to 64 Years | 2 (1.1%) | 0 (0.0%) |
| 65 to 74 Years | 0 (0.0%) | 3 (5.4%) |
| 75 Years and over | 8 (25.0%) | 6 (20.7%) |
Technology Access in Kenesaw
Computing Device Access in Kenesaw
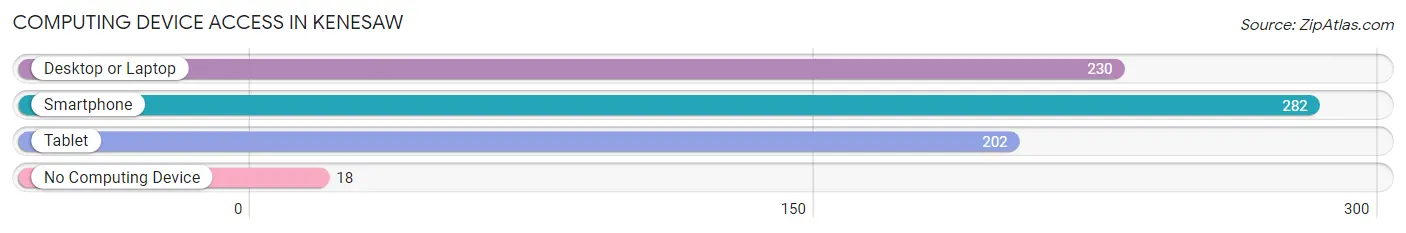
| Device Type | # Households | % Households |
| Desktop or Laptop | 230 | 73.0% |
| Smartphone | 282 | 89.5% |
| Tablet | 202 | 64.1% |
| No Computing Device | 18 | 5.7% |
| Total | 315 | 100.0% |
Internet Access in Kenesaw
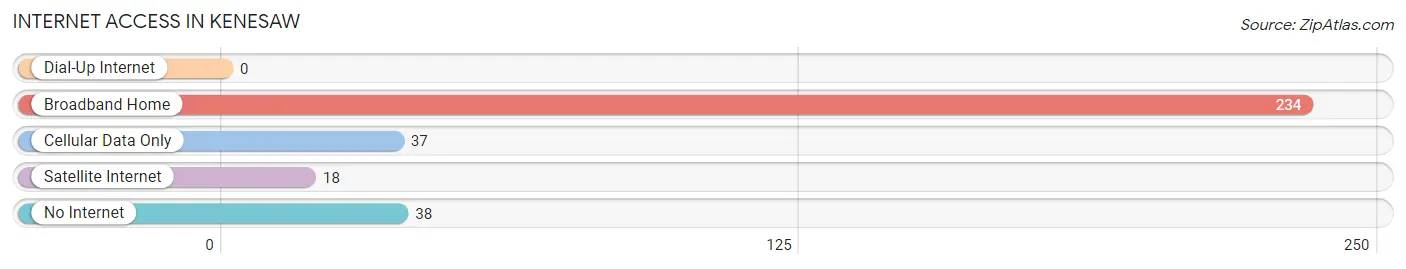
| Internet Type | # Households | % Households |
| Dial-Up Internet | 0 | 0.0% |
| Broadband Home | 234 | 74.3% |
| Cellular Data Only | 37 | 11.7% |
| Satellite Internet | 18 | 5.7% |
| No Internet | 38 | 12.1% |
| Total | 315 | 100.0% |
Kenesaw Summary
Kenesaw is a small town located in the state of Nebraska, in the United States. It is located in Adams County, and is part of the Hastings, Nebraska Metropolitan Statistical Area. The population of the town was 1,093 at the 2010 census.
History
Kenesaw was founded in 1887 by the Union Pacific Railroad. The town was named after the Battle of Kennesaw Mountain, which was fought during the American Civil War. The town was originally a stop on the Union Pacific Railroad, and the railroad was the main source of employment for the town.
In the early 1900s, the town began to grow and prosper. The town was home to a variety of businesses, including a bank, a hotel, a lumberyard, a blacksmith shop, a hardware store, a drug store, a grocery store, and a post office.
In the 1950s, the town began to decline as the railroad industry began to decline. The town was hit hard by the Great Depression, and many of the businesses in the town closed.
In the 1970s, the town began to experience a resurgence. The town was revitalized by the construction of a new highway, which brought new businesses and residents to the town.
Geography
Kenesaw is located at 40°45'17" North, 98°17'45" West (40.754722, -98.295833). The town is located in the Central Plains region of the United States.
The town is located in Adams County, and is part of the Hastings, Nebraska Metropolitan Statistical Area. The town is located on the Union Pacific Railroad line, and is located approximately 25 miles south of Hastings.
The town is located in a rural area, and is surrounded by farmland. The town is located in a flat area, and is located at an elevation of 1,845 feet above sea level.
Economy
The economy of Kenesaw is largely based on agriculture. The town is located in an area that is known for its production of corn, soybeans, and wheat. The town is also home to a variety of small businesses, including a grocery store, a hardware store, a drug store, and a post office.
The town is also home to a variety of manufacturing businesses, including a furniture factory, a metal fabrication plant, and a plastics factory.
Demographics
As of the 2010 census, the population of Kenesaw was 1,093. The racial makeup of the town was 97.3% White, 0.3% African American, 0.2% Native American, 0.2% Asian, 0.1% Pacific Islander, 0.7% from other races, and 1.2% from two or more races. Hispanic or Latino of any race were 1.7% of the population.
The median income for a household in the town was $41,250, and the median income for a family was $45,000. The per capita income for the town was $17,945. About 8.3% of families and 10.2% of the population were below the poverty line, including 11.3% of those under age 18 and 8.3% of those age 65 or over.
Common Questions
What is the Total Population of Kenesaw?
Total Population of Kenesaw is 826.
What is the Total Male Population of Kenesaw?
Total Male Population of Kenesaw is 429.
What is the Total Female Population of Kenesaw?
Total Female Population of Kenesaw is 397.
What is the Ratio of Males per 100 Females in Kenesaw?
There are 108.06 Males per 100 Females in Kenesaw.
What is the Ratio of Females per 100 Males in Kenesaw?
There are 92.54 Females per 100 Males in Kenesaw.
What is the Median Population Age in Kenesaw?
Median Population Age in Kenesaw is 45.5 Years.
What is the Average Family Size in Kenesaw
Average Family Size in Kenesaw is 2.9 People.
What is the Average Household Size in Kenesaw
Average Household Size in Kenesaw is 2.5 People.
What is Per Capita Income in Kenesaw?
Per Capita income in Kenesaw is $34,923.
What is the Median Family Income in Kenesaw?
Median Family Income in Kenesaw is $82,250.
What is the Median Household income in Kenesaw?
Median Household Income in Kenesaw is $77,321.
What is Income or Wage Gap in Kenesaw?
Income or Wage Gap in Kenesaw is 41.2%.
Women in Kenesaw earn 58.8 cents for every dollar earned by a man.
What is Inequality or Gini Index in Kenesaw?
Inequality or Gini Index in Kenesaw is 0.37.
How Large is the Labor Force in Kenesaw?
There are 405 People in the Labor Forcein in Kenesaw.
What is the Percentage of People in the Labor Force in Kenesaw?
60.6% of People are in the Labor Force in Kenesaw.
What is the Unemployment Rate in Kenesaw?
Unemployment Rate in Kenesaw is 3.5%.