York County, NE
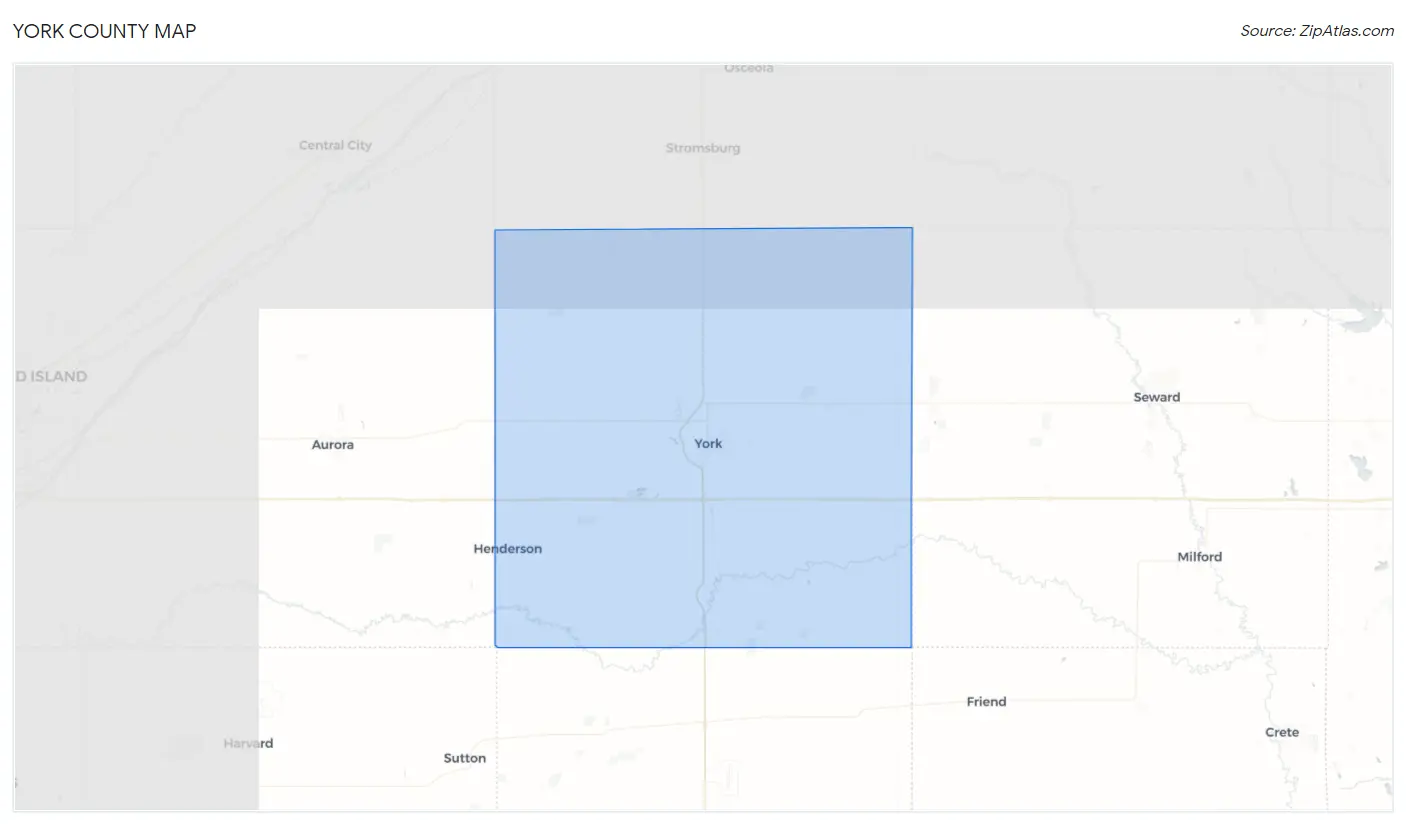
York County Map
York County Overview
14,212
TOTAL POPULATION
7,105
MALE POPULATION
7,107
FEMALE POPULATION
99.97
MALES / 100 FEMALES
100.03
FEMALES / 100 MALES
39.5
MEDIAN AGE
3.0
AVG FAMILY SIZE
2.4
AVG HOUSEHOLD SIZE
$39,507
PER CAPITA INCOME
$85,702
AVG FAMILY INCOME
$72,914
AVG HOUSEHOLD INCOME
48.6%
WAGE / INCOME GAP [ % ]
51.4¢/ $1
WAGE / INCOME GAP [ $ ]
$9,149
FAMILY INCOME DEFICIT
0.47
INEQUALITY / GINI INDEX
7,170
LABOR FORCE [ PEOPLE ]
63.6%
PERCENT IN LABOR FORCE
2.8%
UNEMPLOYMENT RATE
York County Area Codes
Race in York County
The most populous races in York County are White / Caucasian (13,111 | 92.2%), Hispanic or Latino (749 | 5.3%), and Two or more Races (635 | 4.5%).
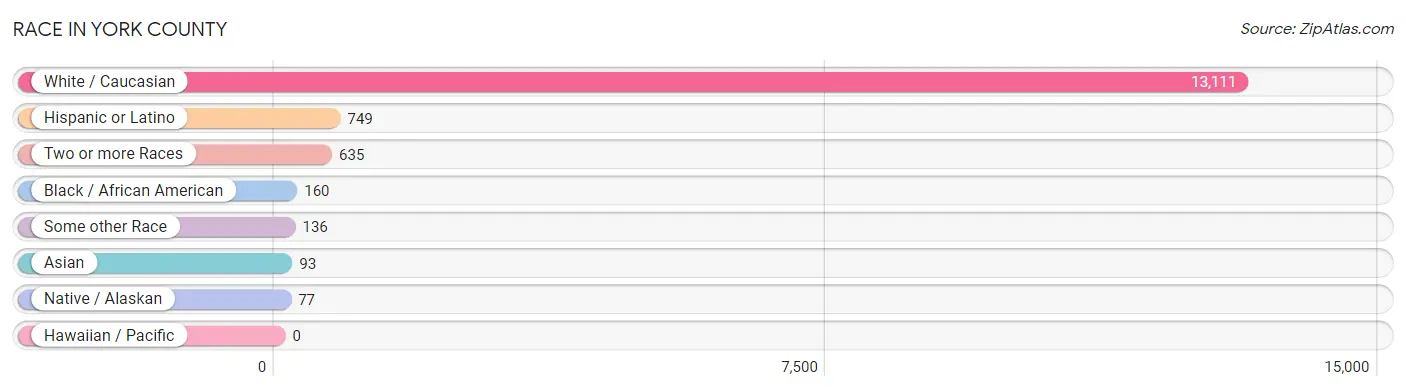
| Race | # Population | % Population |
| Asian | 93 | 0.6% |
| Black / African American | 160 | 1.1% |
| Hawaiian / Pacific | 0 | 0.0% |
| Hispanic or Latino | 749 | 5.3% |
| Native / Alaskan | 77 | 0.5% |
| White / Caucasian | 13,111 | 92.2% |
| Two or more Races | 635 | 4.5% |
| Some other Race | 136 | 1.0% |
| Total | 14,212 | 100.0% |
Ancestry in York County
The most populous ancestries reported in York County are German (5,257 | 37.0%), Irish (1,847 | 13.0%), English (1,473 | 10.4%), Swedish (714 | 5.0%), and American (657 | 4.6%), together accounting for 70.0% of all York County residents.
| Ancestry | # Population | % Population |
| African | 3 | 0.0% |
| Albanian | 4 | 0.0% |
| American | 657 | 4.6% |
| Apache | 9 | 0.1% |
| Arab | 21 | 0.2% |
| Arapaho | 7 | 0.1% |
| Austrian | 4 | 0.0% |
| Belgian | 6 | 0.0% |
| Bhutanese | 135 | 0.9% |
| Blackfeet | 2 | 0.0% |
| Brazilian | 8 | 0.1% |
| British | 60 | 0.4% |
| Burmese | 32 | 0.2% |
| Central American | 20 | 0.1% |
| Central American Indian | 1 | 0.0% |
| Cherokee | 73 | 0.5% |
| Chippewa | 2 | 0.0% |
| Cuban | 31 | 0.2% |
| Czech | 463 | 3.3% |
| Czechoslovakian | 31 | 0.2% |
| Danish | 117 | 0.8% |
| Dutch | 346 | 2.4% |
| Dutch West Indian | 20 | 0.1% |
| Eastern European | 1 | 0.0% |
| English | 1,473 | 10.4% |
| European | 166 | 1.2% |
| Filipino | 3 | 0.0% |
| Finnish | 5 | 0.0% |
| French | 198 | 1.4% |
| French Canadian | 55 | 0.4% |
| German | 5,257 | 37.0% |
| German Russian | 3 | 0.0% |
| Greek | 5 | 0.0% |
| Guatemalan | 2 | 0.0% |
| Icelander | 5 | 0.0% |
| Indian (Asian) | 7 | 0.1% |
| Iraqi | 21 | 0.2% |
| Irish | 1,847 | 13.0% |
| Italian | 97 | 0.7% |
| Jamaican | 9 | 0.1% |
| Korean | 191 | 1.3% |
| Mexican | 339 | 2.4% |
| Mexican American Indian | 9 | 0.1% |
| Native Hawaiian | 135 | 0.9% |
| Northern European | 18 | 0.1% |
| Norwegian | 89 | 0.6% |
| Panamanian | 1 | 0.0% |
| Polish | 134 | 0.9% |
| Portuguese | 3 | 0.0% |
| Potawatomi | 3 | 0.0% |
| Puerto Rican | 152 | 1.1% |
| Russian | 167 | 1.2% |
| Salvadoran | 17 | 0.1% |
| Scandinavian | 37 | 0.3% |
| Scotch-Irish | 104 | 0.7% |
| Scottish | 148 | 1.0% |
| Shoshone | 15 | 0.1% |
| Sioux | 38 | 0.3% |
| Spaniard | 10 | 0.1% |
| Spanish | 1 | 0.0% |
| Sri Lankan | 8 | 0.1% |
| Subsaharan African | 51 | 0.4% |
| Sudanese | 45 | 0.3% |
| Swedish | 714 | 5.0% |
| Thai | 24 | 0.2% |
| Turkish | 6 | 0.0% |
| Ukrainian | 121 | 0.9% |
| Welsh | 57 | 0.4% | View All 68 Rows |
Immigrants in York County
The most numerous immigrant groups reported in York County came from Europe (101 | 0.7%), Asia (96 | 0.7%), Eastern Europe (76 | 0.5%), Latin America (76 | 0.5%), and Ukraine (53 | 0.4%), together accounting for 2.8% of all York County residents.
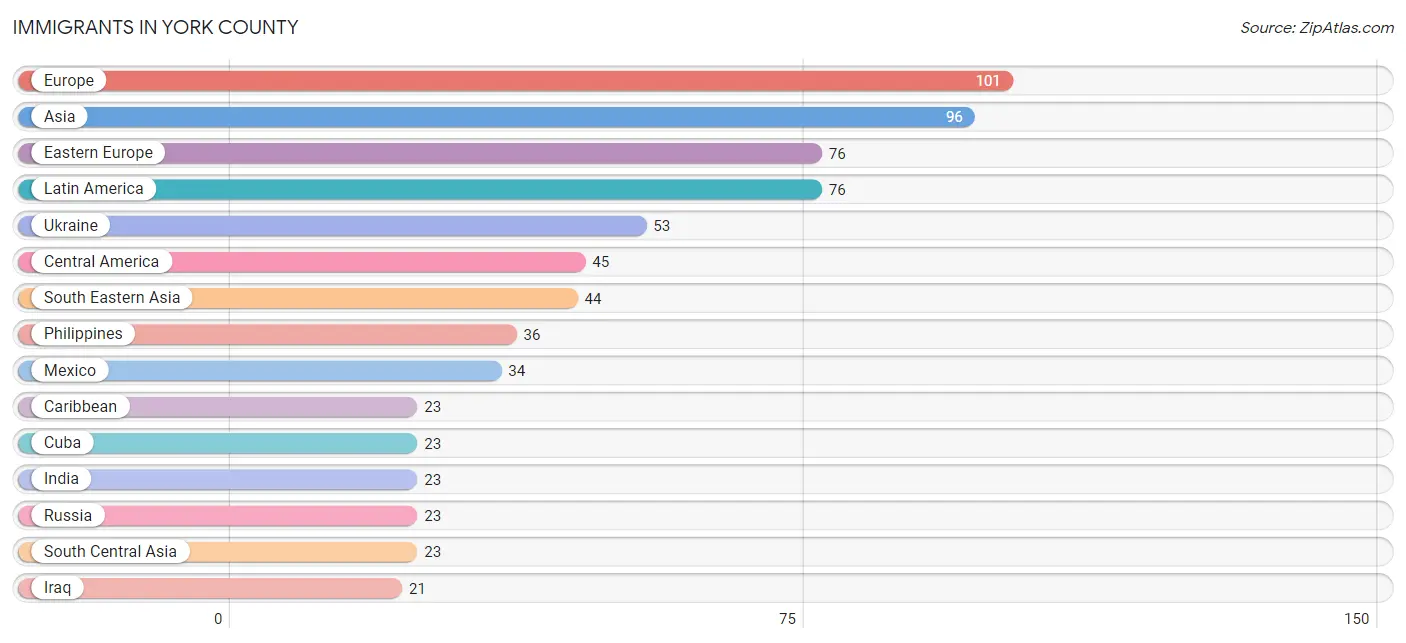
| Immigration Origin | # Population | % Population |
| Africa | 9 | 0.1% |
| Asia | 96 | 0.7% |
| Brazil | 8 | 0.1% |
| Canada | 10 | 0.1% |
| Caribbean | 23 | 0.2% |
| Central America | 45 | 0.3% |
| China | 8 | 0.1% |
| Costa Rica | 10 | 0.1% |
| Cuba | 23 | 0.2% |
| Eastern Africa | 3 | 0.0% |
| Eastern Asia | 8 | 0.1% |
| Eastern Europe | 76 | 0.5% |
| Europe | 101 | 0.7% |
| Germany | 12 | 0.1% |
| India | 23 | 0.2% |
| Iraq | 21 | 0.2% |
| Latin America | 76 | 0.5% |
| Mexico | 34 | 0.2% |
| Northern Africa | 6 | 0.0% |
| Northern Europe | 13 | 0.1% |
| Panama | 1 | 0.0% |
| Philippines | 36 | 0.3% |
| Russia | 23 | 0.2% |
| South America | 8 | 0.1% |
| South Central Asia | 23 | 0.2% |
| South Eastern Asia | 44 | 0.3% |
| Sudan | 6 | 0.0% |
| Taiwan | 3 | 0.0% |
| Ukraine | 53 | 0.4% |
| Vietnam | 8 | 0.1% |
| Western Asia | 21 | 0.2% |
| Western Europe | 12 | 0.1% | View All 32 Rows |
Sex and Age in York County
Sex and Age in York County
The most populous age groups in York County are 5 to 9 Years (555 | 7.8%) for men and 60 to 64 Years (524 | 7.4%) for women.
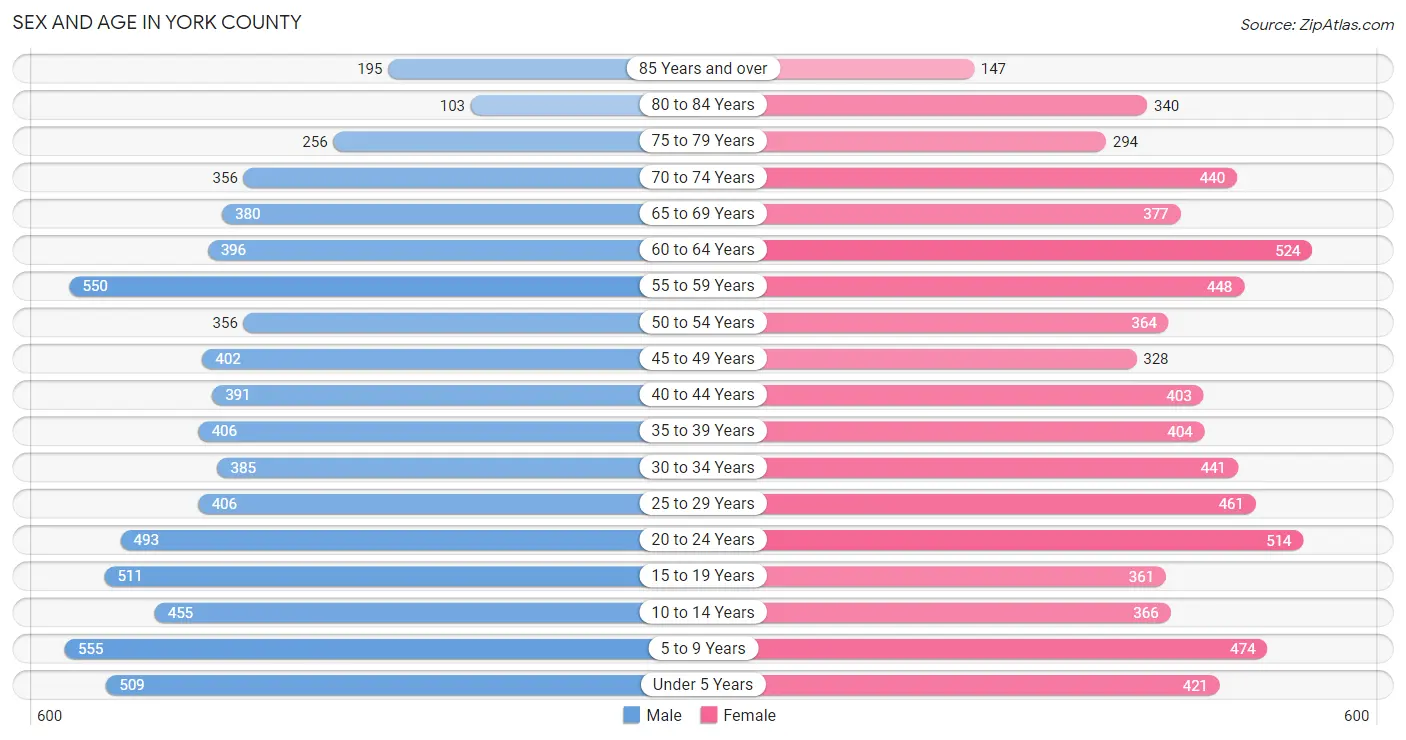
| Age Bracket | Male | Female |
| Under 5 Years | 509 (7.2%) | 421 (5.9%) |
| 5 to 9 Years | 555 (7.8%) | 474 (6.7%) |
| 10 to 14 Years | 455 (6.4%) | 366 (5.1%) |
| 15 to 19 Years | 511 (7.2%) | 361 (5.1%) |
| 20 to 24 Years | 493 (6.9%) | 514 (7.2%) |
| 25 to 29 Years | 406 (5.7%) | 461 (6.5%) |
| 30 to 34 Years | 385 (5.4%) | 441 (6.2%) |
| 35 to 39 Years | 406 (5.7%) | 404 (5.7%) |
| 40 to 44 Years | 391 (5.5%) | 403 (5.7%) |
| 45 to 49 Years | 402 (5.7%) | 328 (4.6%) |
| 50 to 54 Years | 356 (5.0%) | 364 (5.1%) |
| 55 to 59 Years | 550 (7.7%) | 448 (6.3%) |
| 60 to 64 Years | 396 (5.6%) | 524 (7.4%) |
| 65 to 69 Years | 380 (5.3%) | 377 (5.3%) |
| 70 to 74 Years | 356 (5.0%) | 440 (6.2%) |
| 75 to 79 Years | 256 (3.6%) | 294 (4.1%) |
| 80 to 84 Years | 103 (1.5%) | 340 (4.8%) |
| 85 Years and over | 195 (2.7%) | 147 (2.1%) |
| Total | 7,105 (100.0%) | 7,107 (100.0%) |
Families and Households in York County
Median Family Size in York County
The median family size in York County is 2.95 persons per family, with single male/father families (270 | 7.3%) accounting for the largest median family size of 3.06 persons per family. On the other hand, single female/mother families (354 | 9.6%) represent the smallest median family size with 2.48 persons per family.
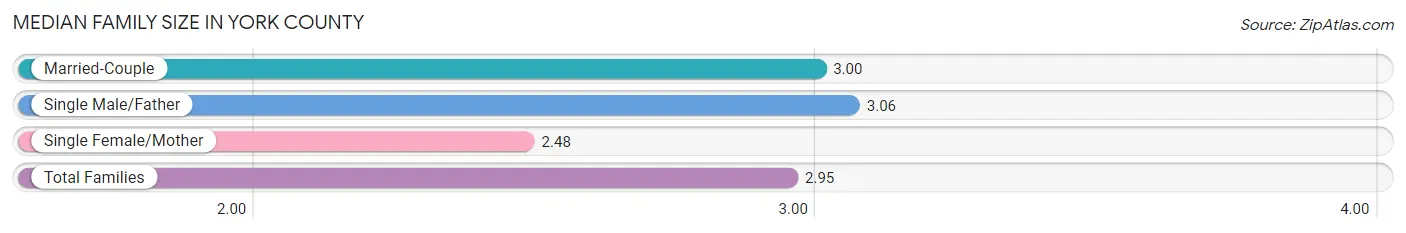
| Family Type | # Families | Family Size |
| Married-Couple | 3,059 (83.1%) | 3.00 |
| Single Male/Father | 270 (7.3%) | 3.06 |
| Single Female/Mother | 354 (9.6%) | 2.48 |
| Total Families | 3,683 (100.0%) | 2.95 |
Median Household Size in York County
The median household size in York County is 2.38 persons per household, with single male/father households (270 | 4.8%) accounting for the largest median household size of 3.3 persons per household. non-family households (1,909 | 34.1%) represent the smallest median household size with 1.20 persons per household.
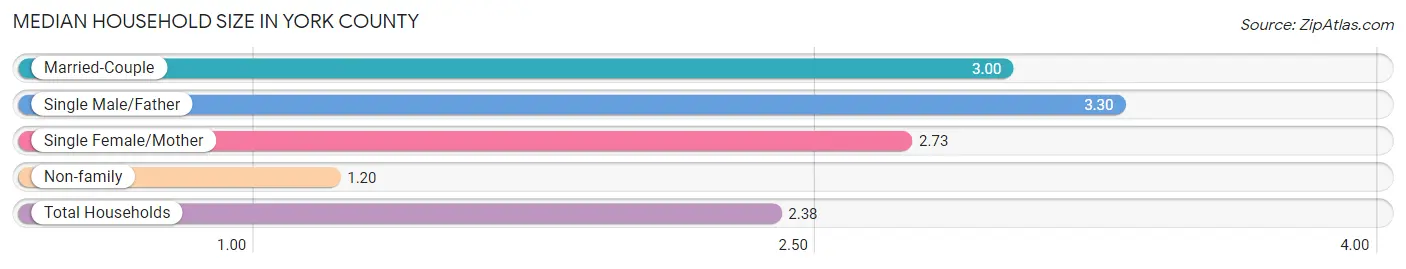
| Household Type | # Households | Household Size |
| Married-Couple | 3,059 (54.7%) | 3.00 |
| Single Male/Father | 270 (4.8%) | 3.30 |
| Single Female/Mother | 354 (6.3%) | 2.73 |
| Non-family | 1,909 (34.1%) | 1.20 |
| Total Households | 5,592 (100.0%) | 2.38 |
Household Size by Marriage Status in York County
Out of a total of 5,592 households in York County, 3,683 (65.9%) are family households, while 1,909 (34.1%) are nonfamily households. The most numerous type of family households are 2-person households, comprising 2,042, and the most common type of nonfamily households are 1-person households, comprising 1,610.
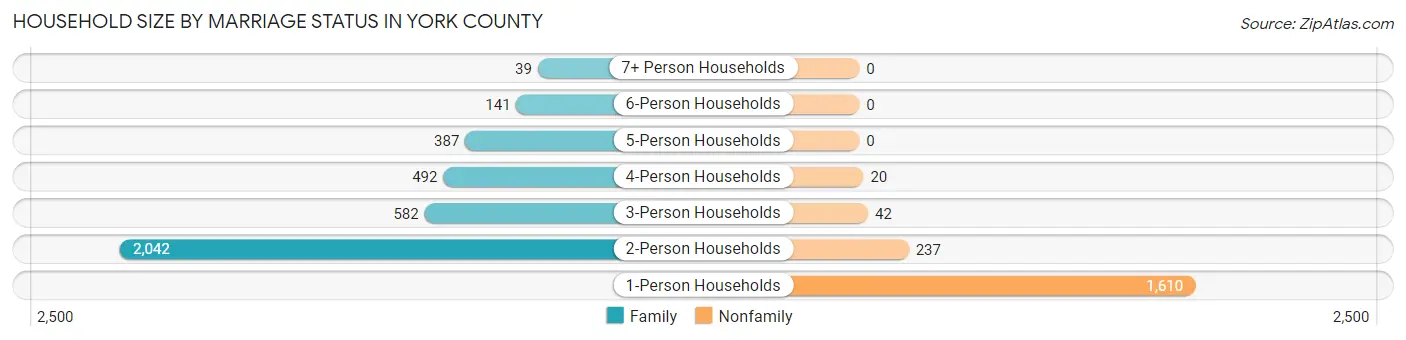
| Household Size | Family Households | Nonfamily Households |
| 1-Person Households | - | 1,610 (28.8%) |
| 2-Person Households | 2,042 (36.5%) | 237 (4.2%) |
| 3-Person Households | 582 (10.4%) | 42 (0.7%) |
| 4-Person Households | 492 (8.8%) | 20 (0.4%) |
| 5-Person Households | 387 (6.9%) | 0 (0.0%) |
| 6-Person Households | 141 (2.5%) | 0 (0.0%) |
| 7+ Person Households | 39 (0.7%) | 0 (0.0%) |
| Total | 3,683 (65.9%) | 1,909 (34.1%) |
Female Fertility in York County
Fertility by Age in York County
Average fertility rate in York County is 41.0 births per 1,000 women. Women in the age bracket of 20 to 34 years have the highest fertility rate with 56.0 births per 1,000 women. Women in the age bracket of 20 to 34 years acount for 66.7% of all women with births.
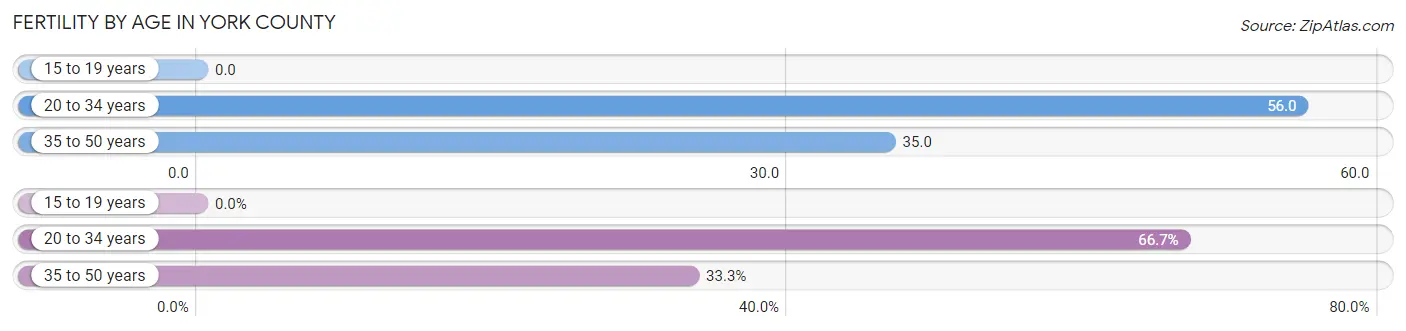
| Age Bracket | Women with Births | Births / 1,000 Women |
| 15 to 19 years | 0 (0.0%) | 0.0 |
| 20 to 34 years | 80 (66.7%) | 56.0 |
| 35 to 50 years | 40 (33.3%) | 35.0 |
| Total | 120 (100.0%) | 41.0 |
Fertility by Age by Marriage Status in York County
89.2% of women with births (120) in York County are married. The highest percentage of unmarried women with births falls into 20 to 34 years age bracket with 16.3% of them unmarried at the time of birth, while the lowest percentage of unmarried women with births belong to 35 to 50 years age bracket with 0.0% of them unmarried.
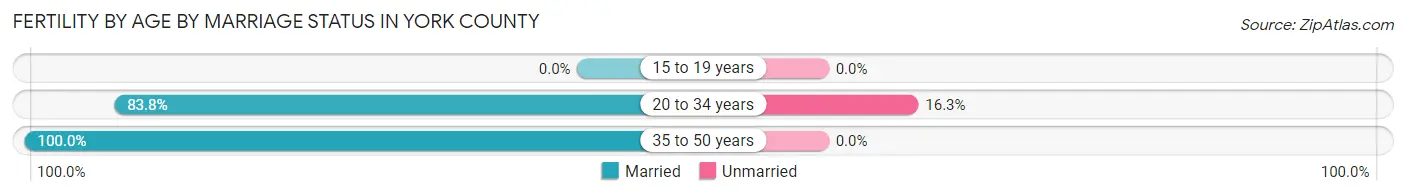
| Age Bracket | Married | Unmarried |
| 15 to 19 years | 0 (0.0%) | 0 (0.0%) |
| 20 to 34 years | 67 (83.8%) | 13 (16.3%) |
| 35 to 50 years | 40 (100.0%) | 0 (0.0%) |
| Total | 107 (89.2%) | 13 (10.8%) |
Fertility by Education in York County
Average fertility rate in York County is 41.0 births per 1,000 women. Women with the education attainment of graduate degree have the highest fertility rate of 93.0 births per 1,000 women, while women with the education attainment of less than high school have the lowest fertility at 18.0 births per 1,000 women. Women with the education attainment of high school diploma represent 32.5% of all women with births.
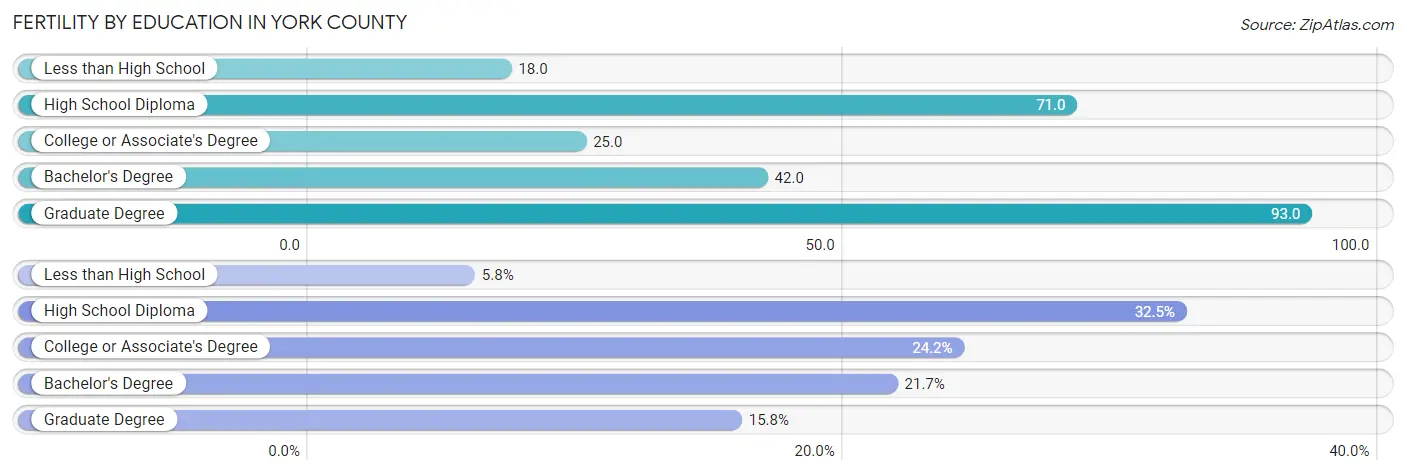
| Educational Attainment | Women with Births | Births / 1,000 Women |
| Less than High School | 7 (5.8%) | 18.0 |
| High School Diploma | 39 (32.5%) | 71.0 |
| College or Associate's Degree | 29 (24.2%) | 25.0 |
| Bachelor's Degree | 26 (21.7%) | 42.0 |
| Graduate Degree | 19 (15.8%) | 93.0 |
| Total | 120 (100.0%) | 41.0 |
Fertility by Education by Marriage Status in York County
10.8% of women with births in York County are unmarried. Women with the educational attainment of college or associate's degree are most likely to be married with 100.0% of them married at childbirth, while women with the educational attainment of less than high school are least likely to be married with 100.0% of them unmarried at childbirth.
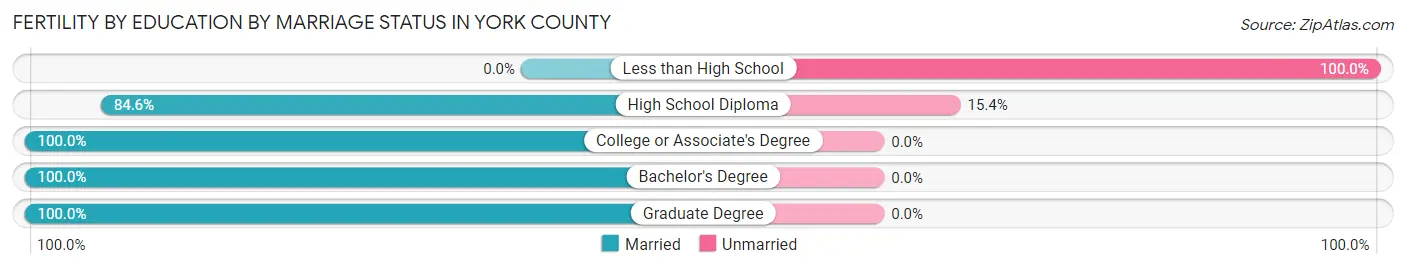
| Educational Attainment | Married | Unmarried |
| Less than High School | 0 (0.0%) | 7 (100.0%) |
| High School Diploma | 33 (84.6%) | 6 (15.4%) |
| College or Associate's Degree | 29 (100.0%) | 0 (0.0%) |
| Bachelor's Degree | 26 (100.0%) | 0 (0.0%) |
| Graduate Degree | 19 (100.0%) | 0 (0.0%) |
| Total | 107 (89.2%) | 13 (10.8%) |
Income in York County
Income Overview in York County
Per Capita Income in York County is $39,507, while median incomes of families and households are $85,702 and $72,914 respectively.
| Characteristic | Number | Measure |
| Per Capita Income | 14,212 | $39,507 |
| Median Family Income | 3,683 | $85,702 |
| Mean Family Income | 3,683 | $111,684 |
| Median Household Income | 5,592 | $72,914 |
| Mean Household Income | 5,592 | $97,837 |
| Income Deficit | 3,683 | $9,149 |
| Wage / Income Gap (%) | 14,212 | 48.62% |
| Wage / Income Gap ($) | 14,212 | 51.38¢ per $1 |
| Gini / Inequality Index | 14,212 | 0.47 |
Earnings by Sex in York County
Average Earnings in York County are $40,639, $52,716 for men and $27,085 for women, a difference of 48.6%.
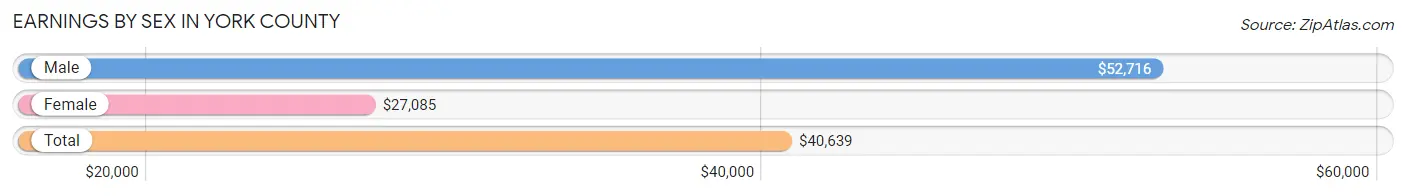
| Sex | Number | Average Earnings |
| Male | 4,279 (53.5%) | $52,716 |
| Female | 3,718 (46.5%) | $27,085 |
| Total | 7,997 (100.0%) | $40,639 |
Earnings by Sex by Income Bracket in York County
The most common earnings brackets in York County are $55,000 to $64,999 for men (756 | 17.7%) and $25,000 to $29,999 for women (420 | 11.3%).
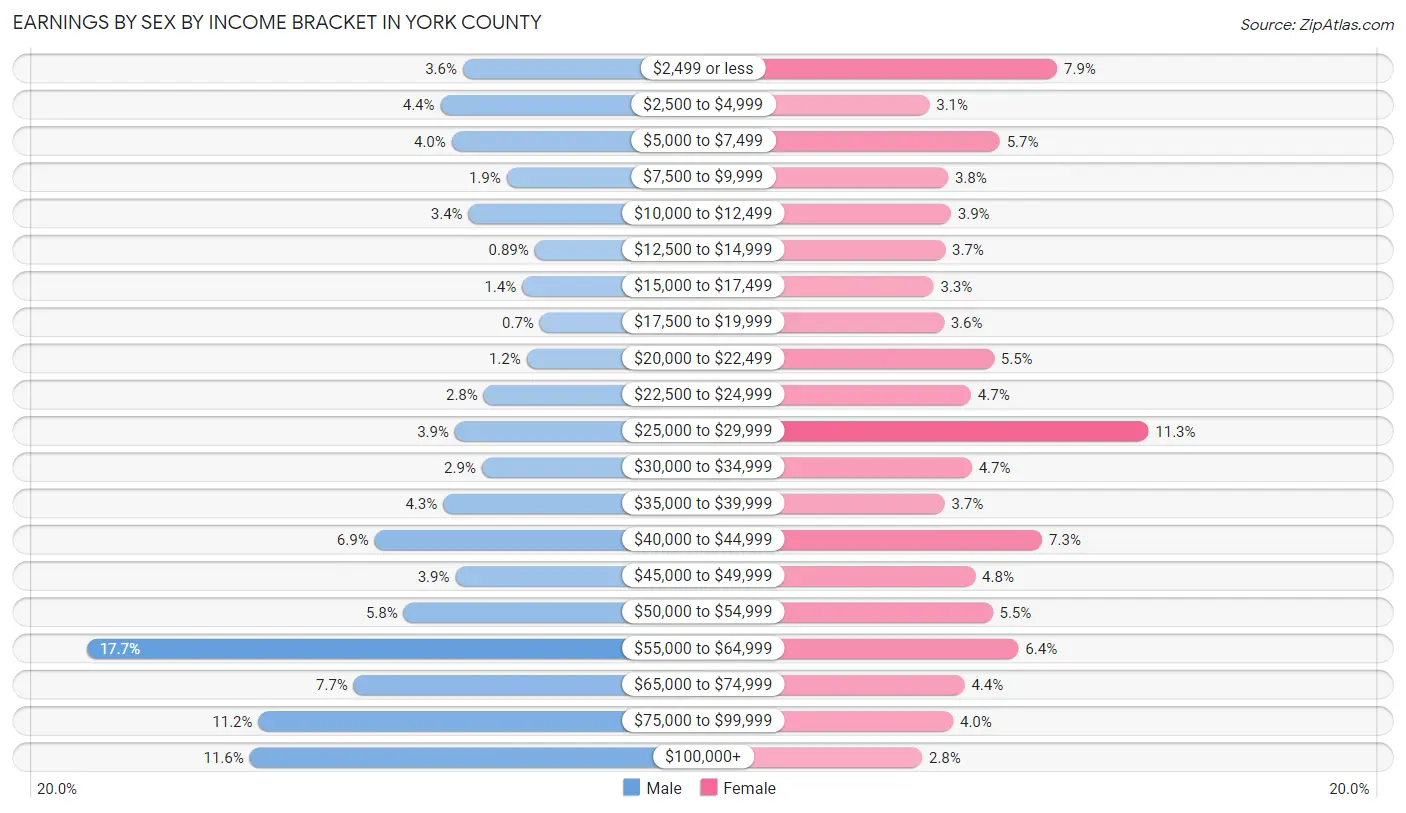
| Income | Male | Female |
| $2,499 or less | 153 (3.6%) | 293 (7.9%) |
| $2,500 to $4,999 | 189 (4.4%) | 115 (3.1%) |
| $5,000 to $7,499 | 171 (4.0%) | 213 (5.7%) |
| $7,500 to $9,999 | 83 (1.9%) | 141 (3.8%) |
| $10,000 to $12,499 | 144 (3.4%) | 145 (3.9%) |
| $12,500 to $14,999 | 38 (0.9%) | 137 (3.7%) |
| $15,000 to $17,499 | 58 (1.4%) | 121 (3.3%) |
| $17,500 to $19,999 | 30 (0.7%) | 135 (3.6%) |
| $20,000 to $22,499 | 51 (1.2%) | 205 (5.5%) |
| $22,500 to $24,999 | 120 (2.8%) | 173 (4.6%) |
| $25,000 to $29,999 | 166 (3.9%) | 420 (11.3%) |
| $30,000 to $34,999 | 123 (2.9%) | 174 (4.7%) |
| $35,000 to $39,999 | 185 (4.3%) | 136 (3.7%) |
| $40,000 to $44,999 | 295 (6.9%) | 272 (7.3%) |
| $45,000 to $49,999 | 165 (3.9%) | 179 (4.8%) |
| $50,000 to $54,999 | 248 (5.8%) | 203 (5.5%) |
| $55,000 to $64,999 | 756 (17.7%) | 239 (6.4%) |
| $65,000 to $74,999 | 328 (7.7%) | 164 (4.4%) |
| $75,000 to $99,999 | 481 (11.2%) | 148 (4.0%) |
| $100,000+ | 495 (11.6%) | 105 (2.8%) |
| Total | 4,279 (100.0%) | 3,718 (100.0%) |
Earnings by Sex by Educational Attainment in York County
Average earnings in York County are $56,726 for men and $31,500 for women, a difference of 44.5%. Men with an educational attainment of graduate degree enjoy the highest average annual earnings of $88,175, while those with less than high school education earn the least with $41,848. Women with an educational attainment of graduate degree earn the most with the average annual earnings of $52,396, while those with high school diploma education have the smallest earnings of $26,488.
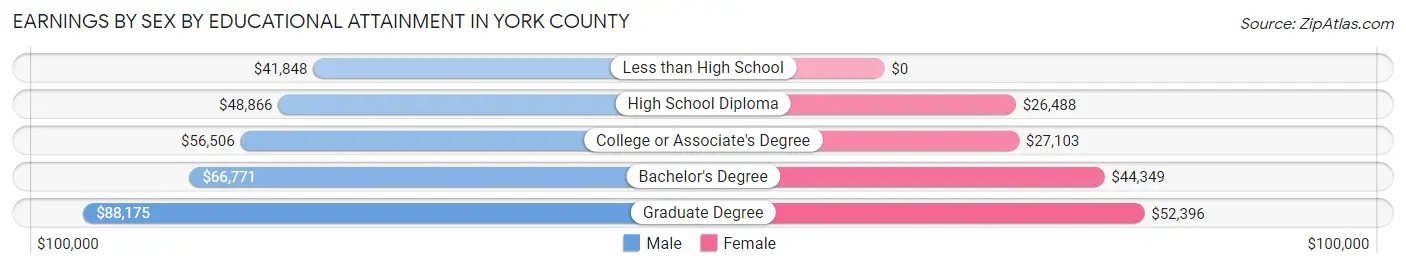
| Educational Attainment | Male Income | Female Income |
| Less than High School | $41,848 | $0 |
| High School Diploma | $48,866 | $26,488 |
| College or Associate's Degree | $56,506 | $27,103 |
| Bachelor's Degree | $66,771 | $44,349 |
| Graduate Degree | $88,175 | $52,396 |
| Total | $56,726 | $31,500 |
Family Income in York County
Family Income Brackets in York County
According to the York County family income data, there are 762 families falling into the $75,000 to $99,999 income range, which is the most common income bracket and makes up 20.7% of all families. Conversely, the $10,000 to $14,999 income bracket is the least frequent group with only 29 families (0.8%) belonging to this category.
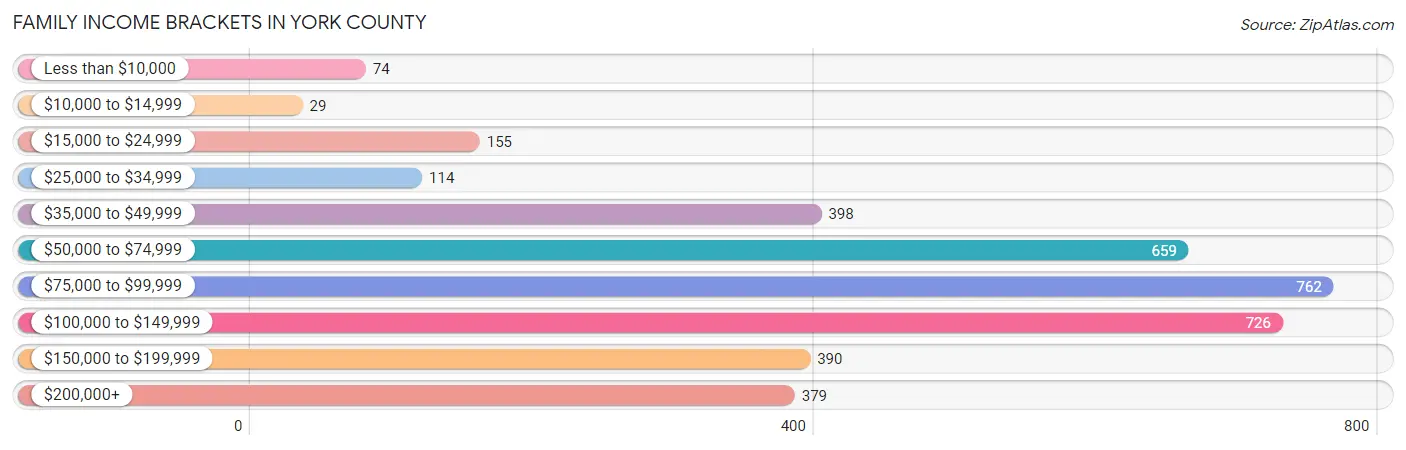
| Income Bracket | # Families | % Families |
| Less than $10,000 | 74 | 2.0% |
| $10,000 to $14,999 | 29 | 0.8% |
| $15,000 to $24,999 | 155 | 4.2% |
| $25,000 to $34,999 | 114 | 3.1% |
| $35,000 to $49,999 | 398 | 10.8% |
| $50,000 to $74,999 | 659 | 17.9% |
| $75,000 to $99,999 | 762 | 20.7% |
| $100,000 to $149,999 | 726 | 19.7% |
| $150,000 to $199,999 | 390 | 10.6% |
| $200,000+ | 379 | 10.3% |
Family Income by Famaliy Size in York County
6-person families (101 | 2.7%) account for the highest median family income in York County with $162,813 per family, while 2-person families (2,088 | 56.7%) have the highest median income of $41,111 per family member.
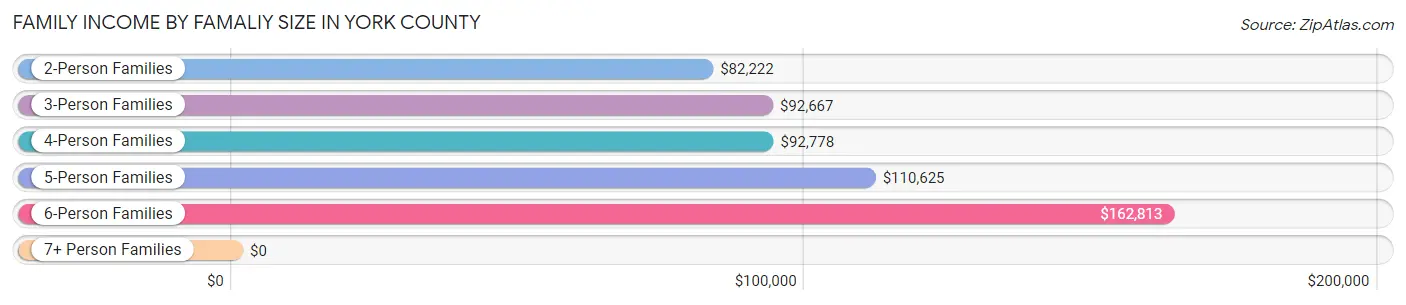
| Income Bracket | # Families | Median Income |
| 2-Person Families | 2,088 (56.7%) | $82,222 |
| 3-Person Families | 628 (17.1%) | $92,667 |
| 4-Person Families | 442 (12.0%) | $92,778 |
| 5-Person Families | 385 (10.4%) | $110,625 |
| 6-Person Families | 101 (2.7%) | $162,813 |
| 7+ Person Families | 39 (1.1%) | $0 |
| Total | 3,683 (100.0%) | $85,702 |
Family Income by Number of Earners in York County
The median family income in York County is $85,702, with families comprising 3+ earners (389) having the highest median family income of $153,958, while families with no earners (465) have the lowest median family income of $59,950, accounting for 10.6% and 12.6% of families, respectively.
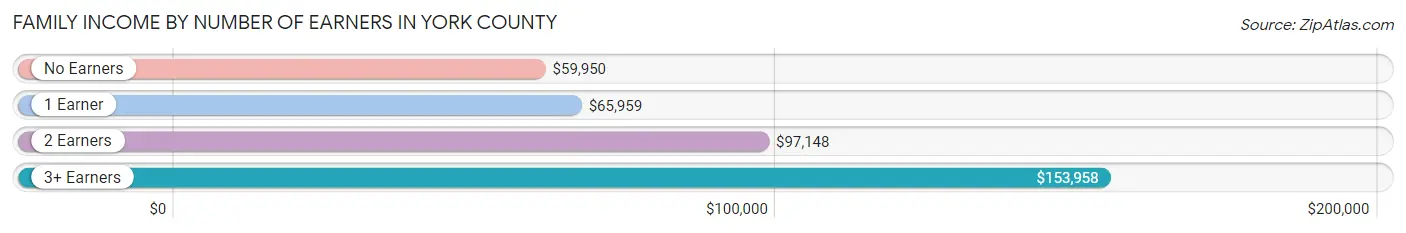
| Number of Earners | # Families | Median Income |
| No Earners | 465 (12.6%) | $59,950 |
| 1 Earner | 1,105 (30.0%) | $65,959 |
| 2 Earners | 1,724 (46.8%) | $97,148 |
| 3+ Earners | 389 (10.6%) | $153,958 |
| Total | 3,683 (100.0%) | $85,702 |
Household Income in York County
Household Income Brackets in York County
With 1,118 households falling in the category, the $50,000 to $74,999 income range is the most frequent in York County, accounting for 20.0% of all households. In contrast, only 196 households (3.5%) fall into the $10,000 to $14,999 income bracket, making it the least populous group.
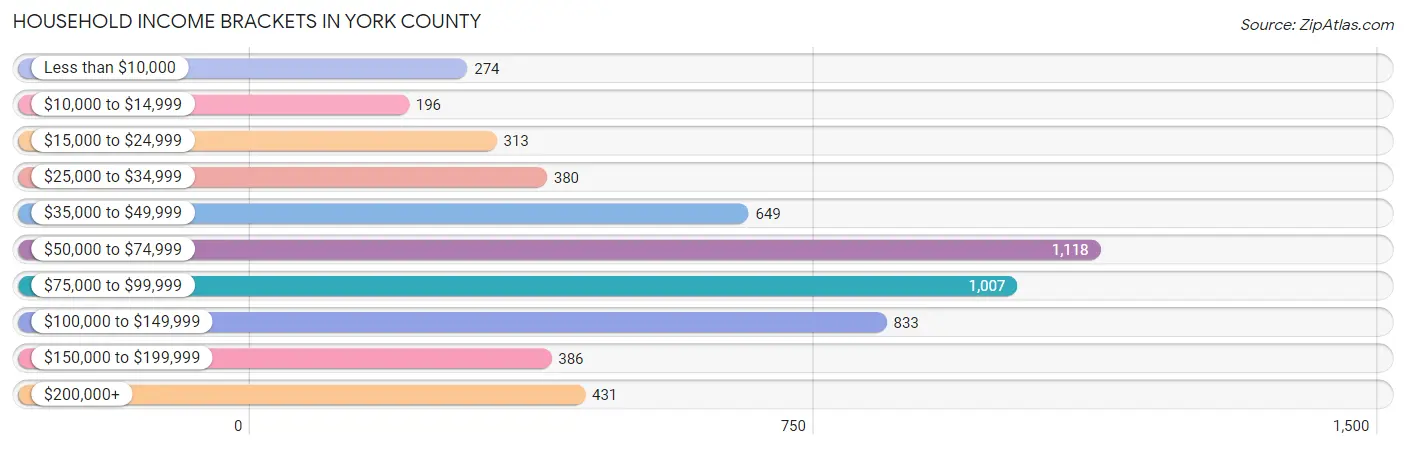
| Income Bracket | # Households | % Households |
| Less than $10,000 | 274 | 4.9% |
| $10,000 to $14,999 | 196 | 3.5% |
| $15,000 to $24,999 | 313 | 5.6% |
| $25,000 to $34,999 | 380 | 6.8% |
| $35,000 to $49,999 | 649 | 11.6% |
| $50,000 to $74,999 | 1,118 | 20.0% |
| $75,000 to $99,999 | 1,007 | 18.0% |
| $100,000 to $149,999 | 833 | 14.9% |
| $150,000 to $199,999 | 386 | 6.9% |
| $200,000+ | 431 | 7.7% |
Household Income by Householder Age in York County
The median household income in York County is $72,914, with the highest median household income of $83,690 found in the 45 to 64 years age bracket for the primary householder. A total of 1,832 households (32.8%) fall into this category. Meanwhile, the 15 to 24 years age bracket for the primary householder has the lowest median household income of $52,917, with 296 households (5.3%) in this group.
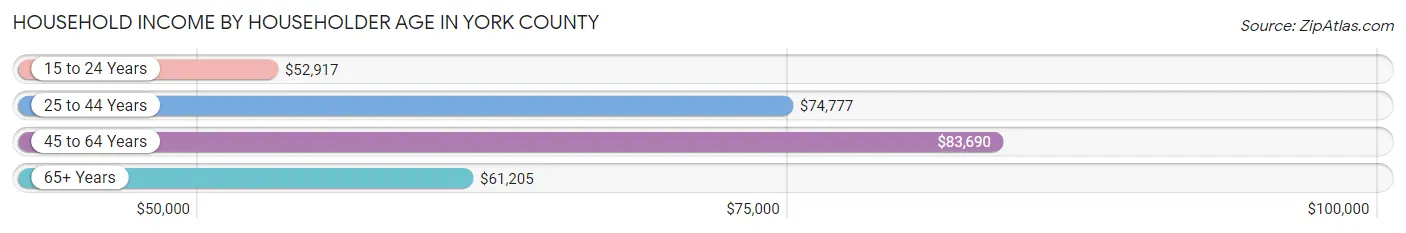
| Income Bracket | # Households | Median Income |
| 15 to 24 Years | 296 (5.3%) | $52,917 |
| 25 to 44 Years | 1,744 (31.2%) | $74,777 |
| 45 to 64 Years | 1,832 (32.8%) | $83,690 |
| 65+ Years | 1,720 (30.8%) | $61,205 |
| Total | 5,592 (100.0%) | $72,914 |
Poverty in York County
Income Below Poverty by Sex and Age in York County
With 7.8% poverty level for males and 10.9% for females among the residents of York County, under 5 year old males and 18 to 24 year old females are the most vulnerable to poverty, with 115 males (22.6%) and 158 females (33.1%) in their respective age groups living below the poverty level.
| Age Bracket | Male | Female |
| Under 5 Years | 115 (22.6%) | 56 (13.4%) |
| 5 Years | 8 (11.9%) | 26 (28.9%) |
| 6 to 11 Years | 32 (4.6%) | 10 (2.1%) |
| 12 to 14 Years | 28 (11.3%) | 13 (4.9%) |
| 15 Years | 7 (7.9%) | 1 (1.6%) |
| 16 and 17 Years | 2 (1.1%) | 49 (26.1%) |
| 18 to 24 Years | 13 (2.4%) | 158 (33.1%) |
| 25 to 34 Years | 35 (4.5%) | 27 (3.6%) |
| 35 to 44 Years | 59 (7.4%) | 81 (11.2%) |
| 45 to 54 Years | 71 (9.4%) | 25 (3.8%) |
| 55 to 64 Years | 93 (9.8%) | 74 (8.2%) |
| 65 to 74 Years | 30 (4.1%) | 60 (7.4%) |
| 75 Years and over | 39 (7.6%) | 130 (19.1%) |
| Total | 532 (7.8%) | 710 (10.9%) |
Income Above Poverty by Sex and Age in York County
According to the poverty statistics in York County, males aged 16 and 17 years and females aged 15 years are the age groups that are most secure financially, with 98.9% of males and 98.4% of females in these age groups living above the poverty line.
| Age Bracket | Male | Female |
| Under 5 Years | 394 (77.4%) | 362 (86.6%) |
| 5 Years | 59 (88.1%) | 64 (71.1%) |
| 6 to 11 Years | 656 (95.4%) | 460 (97.9%) |
| 12 to 14 Years | 219 (88.7%) | 252 (95.1%) |
| 15 Years | 82 (92.1%) | 62 (98.4%) |
| 16 and 17 Years | 183 (98.9%) | 139 (73.9%) |
| 18 to 24 Years | 523 (97.6%) | 320 (66.9%) |
| 25 to 34 Years | 744 (95.5%) | 726 (96.4%) |
| 35 to 44 Years | 735 (92.6%) | 644 (88.8%) |
| 45 to 54 Years | 687 (90.6%) | 626 (96.2%) |
| 55 to 64 Years | 853 (90.2%) | 827 (91.8%) |
| 65 to 74 Years | 703 (95.9%) | 749 (92.6%) |
| 75 Years and over | 475 (92.4%) | 551 (80.9%) |
| Total | 6,313 (92.2%) | 5,782 (89.1%) |
Income Below Poverty Among Married-Couple Families in York County
The poverty statistics for married-couple families in York County show that 2.9% or 89 of the total 3,059 families live below the poverty line. Families with 5 or more children have the highest poverty rate of 54.3%, comprising of 19 families. On the other hand, families with 1 or 2 children have the lowest poverty rate of 1.6%, which includes 11 families.
| Children | Above Poverty | Below Poverty |
| No Children | 1,891 (97.9%) | 40 (2.1%) |
| 1 or 2 Children | 690 (98.4%) | 11 (1.6%) |
| 3 or 4 Children | 373 (95.2%) | 19 (4.9%) |
| 5 or more Children | 16 (45.7%) | 19 (54.3%) |
| Total | 2,970 (97.1%) | 89 (2.9%) |
Income Below Poverty Among Single-Parent Households in York County
According to the poverty data in York County, 3.7% or 10 single-father households and 32.8% or 116 single-mother households are living below the poverty line. Among single-father households, those with 1 or 2 children have the highest poverty rate, with 10 households (16.4%) experiencing poverty. Likewise, among single-mother households, those with 3 or 4 children have the highest poverty rate, with 12 households (54.5%) falling below the poverty line.
| Children | Single Father | Single Mother |
| No Children | 0 (0.0%) | 19 (17.9%) |
| 1 or 2 Children | 10 (16.4%) | 85 (37.6%) |
| 3 or 4 Children | 0 (0.0%) | 12 (54.5%) |
| 5 or more Children | 0 (0.0%) | 0 (0.0%) |
| Total | 10 (3.7%) | 116 (32.8%) |
Income Below Poverty Among Married-Couple vs Single-Parent Households in York County
The poverty data for York County shows that 89 of the married-couple family households (2.9%) and 126 of the single-parent households (20.2%) are living below the poverty level. Within the married-couple family households, those with 5 or more children have the highest poverty rate, with 19 households (54.3%) falling below the poverty line. Among the single-parent households, those with 1 or 2 children have the highest poverty rate, with 95 household (33.1%) living below poverty.
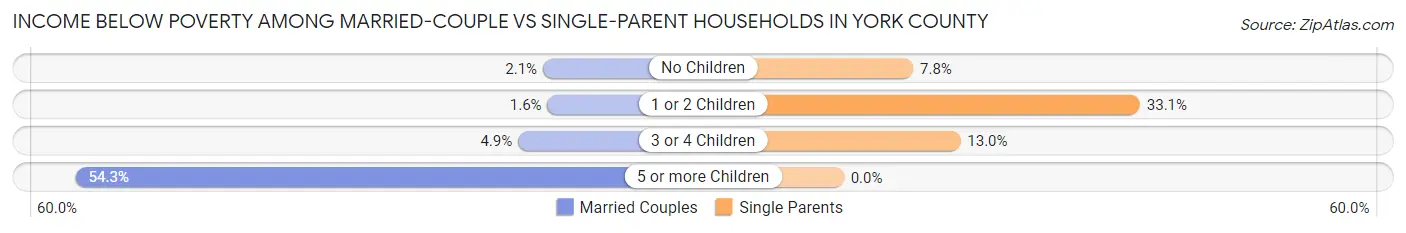
| Children | Married-Couple Families | Single-Parent Households |
| No Children | 40 (2.1%) | 19 (7.8%) |
| 1 or 2 Children | 11 (1.6%) | 95 (33.1%) |
| 3 or 4 Children | 19 (4.9%) | 12 (13.0%) |
| 5 or more Children | 19 (54.3%) | 0 (0.0%) |
| Total | 89 (2.9%) | 126 (20.2%) |
Employment Characteristics in York County
Employment by Class of Employer in York County
Among the 6,866 employed individuals in York County, private company employees (4,423 | 64.4%), local government employees (656 | 9.6%), and not-for-profit organizations (626 | 9.1%) make up the most common classes of employment.
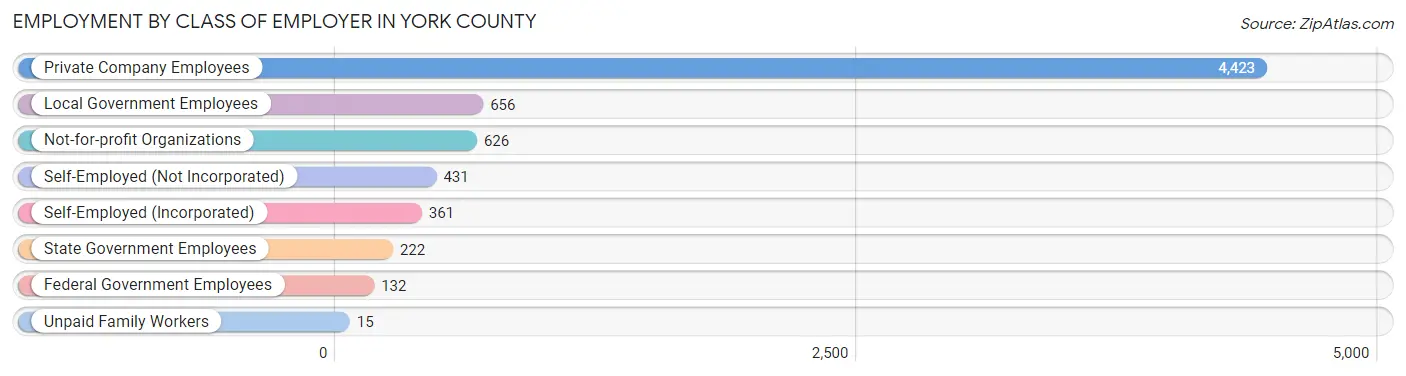
| Employer Class | # Employees | % Employees |
| Private Company Employees | 4,423 | 64.4% |
| Self-Employed (Incorporated) | 361 | 5.3% |
| Self-Employed (Not Incorporated) | 431 | 6.3% |
| Not-for-profit Organizations | 626 | 9.1% |
| Local Government Employees | 656 | 9.6% |
| State Government Employees | 222 | 3.2% |
| Federal Government Employees | 132 | 1.9% |
| Unpaid Family Workers | 15 | 0.2% |
| Total | 6,866 | 100.0% |
Employment Status by Age in York County
According to the labor force statistics for York County, out of the total population over 16 years of age (11,273), 63.6% or 7,170 individuals are in the labor force, with 2.8% or 201 of them unemployed. The age group with the highest labor force participation rate is 45 to 54 years, with 90.4% or 1,311 individuals in the labor force. Within the labor force, the 16 to 19 years age range has the highest percentage of unemployed individuals, with 19.7% or 74 of them being unemployed.
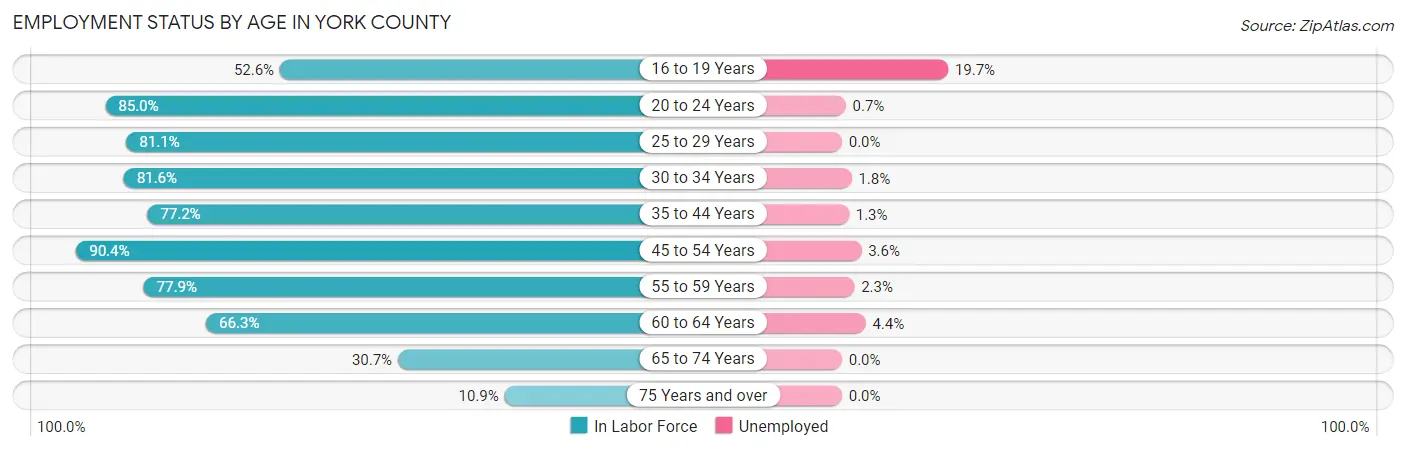
| Age Bracket | In Labor Force | Unemployed |
| 16 to 19 Years | 375 (52.6%) | 74 (19.7%) |
| 20 to 24 Years | 856 (85.0%) | 6 (0.7%) |
| 25 to 29 Years | 703 (81.1%) | 0 (0.0%) |
| 30 to 34 Years | 674 (81.6%) | 12 (1.8%) |
| 35 to 44 Years | 1,238 (77.2%) | 16 (1.3%) |
| 45 to 54 Years | 1,311 (90.4%) | 47 (3.6%) |
| 55 to 59 Years | 777 (77.9%) | 18 (2.3%) |
| 60 to 64 Years | 610 (66.3%) | 27 (4.4%) |
| 65 to 74 Years | 477 (30.7%) | 0 (0.0%) |
| 75 Years and over | 146 (10.9%) | 0 (0.0%) |
| Total | 7,170 (63.6%) | 201 (2.8%) |
Employment Status by Educational Attainment in York County
According to labor force statistics for York County, 79.7% of individuals (5,312) out of the total population between 25 and 64 years of age (6,665) are in the labor force, with 2.3% or 122 of them being unemployed. The group with the highest labor force participation rate are those with the educational attainment of bachelor's degree or higher, with 90.2% or 1,609 individuals in the labor force. Within the labor force, individuals with high school diploma education have the highest percentage of unemployment, with 5.3% or 74 of them being unemployed.
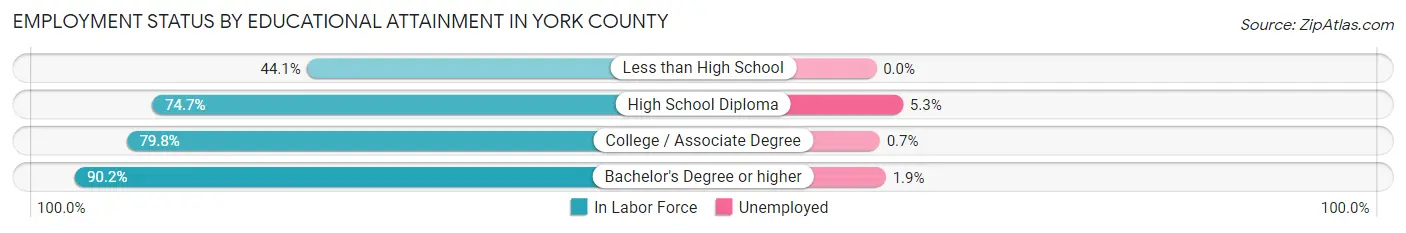
| Educational Attainment | In Labor Force | Unemployed |
| Less than High School | 120 (44.1%) | 0 (0.0%) |
| High School Diploma | 1,389 (74.7%) | 99 (5.3%) |
| College / Associate Degree | 2,194 (79.8%) | 19 (0.7%) |
| Bachelor's Degree or higher | 1,609 (90.2%) | 34 (1.9%) |
| Total | 5,312 (79.7%) | 153 (2.3%) |
Employment Occupations by Sex in York County
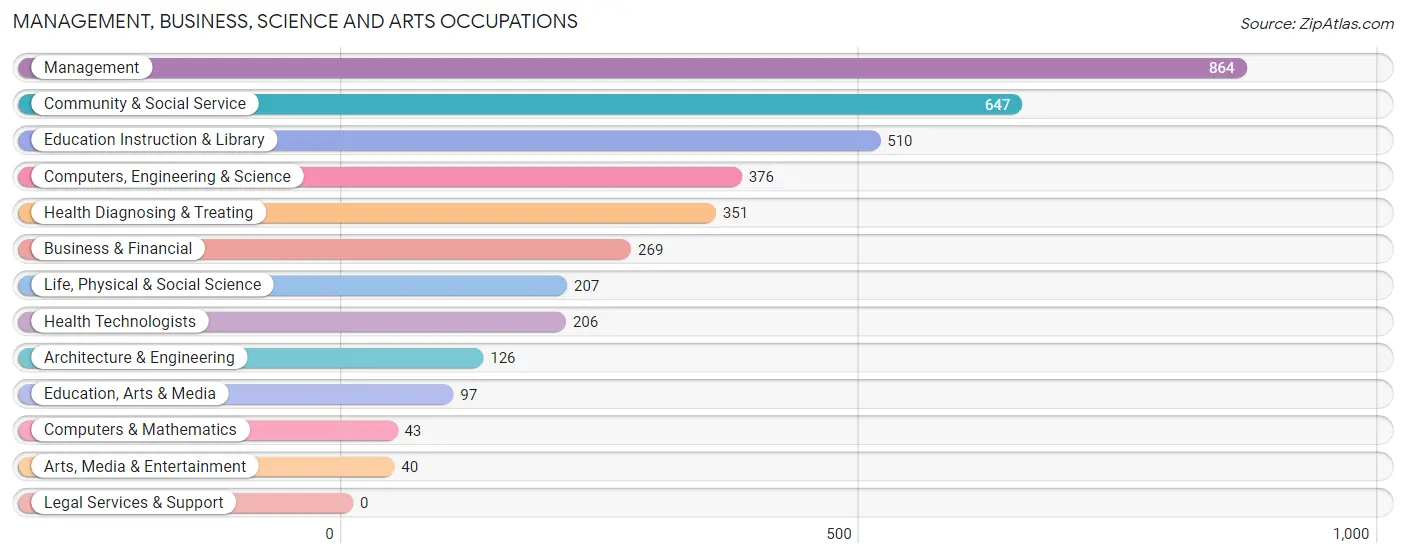
Management, Business, Science and Arts Occupations
The most common Management, Business, Science and Arts occupations in York County are Management (864 | 12.4%), Community & Social Service (647 | 9.3%), Education Instruction & Library (510 | 7.3%), Computers, Engineering & Science (376 | 5.4%), and Health Diagnosing & Treating (351 | 5.1%).
Management, Business, Science and Arts Occupations by Sex
Within the Management, Business, Science and Arts occupations in York County, the most male-oriented occupations are Architecture & Engineering (100.0%), Life, Physical & Social Science (92.7%), and Computers, Engineering & Science (91.2%), while the most female-oriented occupations are Education Instruction & Library (89.2%), Health Diagnosing & Treating (79.2%), and Community & Social Service (77.7%).
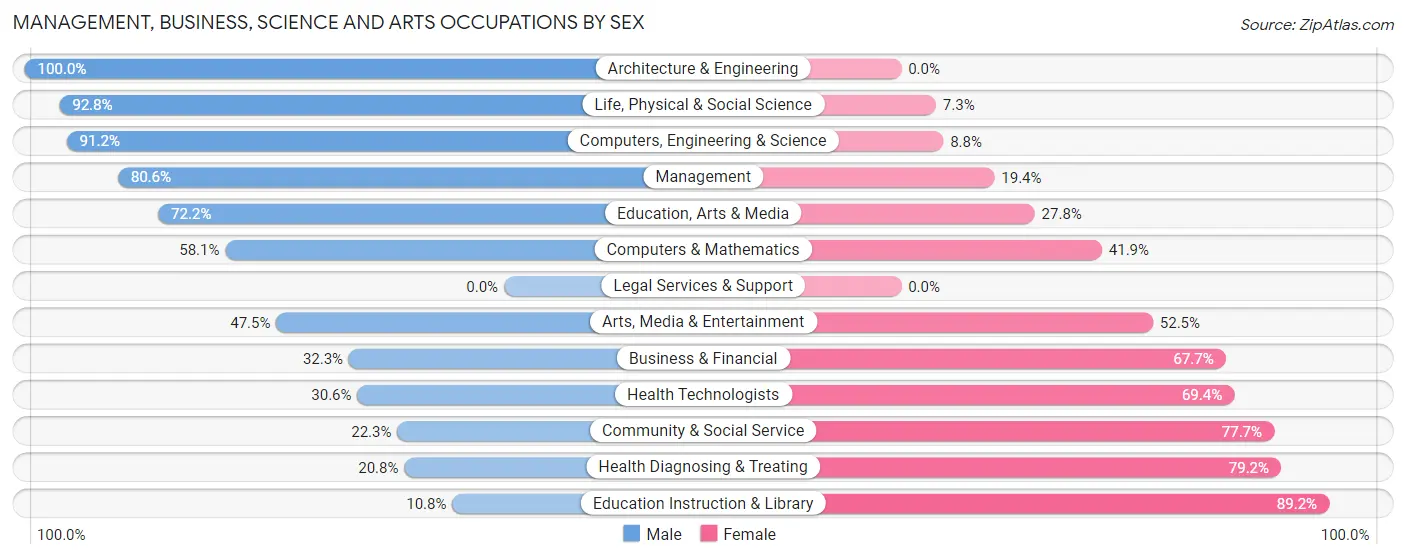
| Occupation | Male | Female |
| Management | 696 (80.6%) | 168 (19.4%) |
| Business & Financial | 87 (32.3%) | 182 (67.7%) |
| Computers, Engineering & Science | 343 (91.2%) | 33 (8.8%) |
| Computers & Mathematics | 25 (58.1%) | 18 (41.9%) |
| Architecture & Engineering | 126 (100.0%) | 0 (0.0%) |
| Life, Physical & Social Science | 192 (92.7%) | 15 (7.2%) |
| Community & Social Service | 144 (22.3%) | 503 (77.7%) |
| Education, Arts & Media | 70 (72.2%) | 27 (27.8%) |
| Legal Services & Support | 0 (0.0%) | 0 (0.0%) |
| Education Instruction & Library | 55 (10.8%) | 455 (89.2%) |
| Arts, Media & Entertainment | 19 (47.5%) | 21 (52.5%) |
| Health Diagnosing & Treating | 73 (20.8%) | 278 (79.2%) |
| Health Technologists | 63 (30.6%) | 143 (69.4%) |
| Total (Category) | 1,343 (53.6%) | 1,164 (46.4%) |
| Total (Overall) | 3,815 (54.9%) | 3,133 (45.1%) |
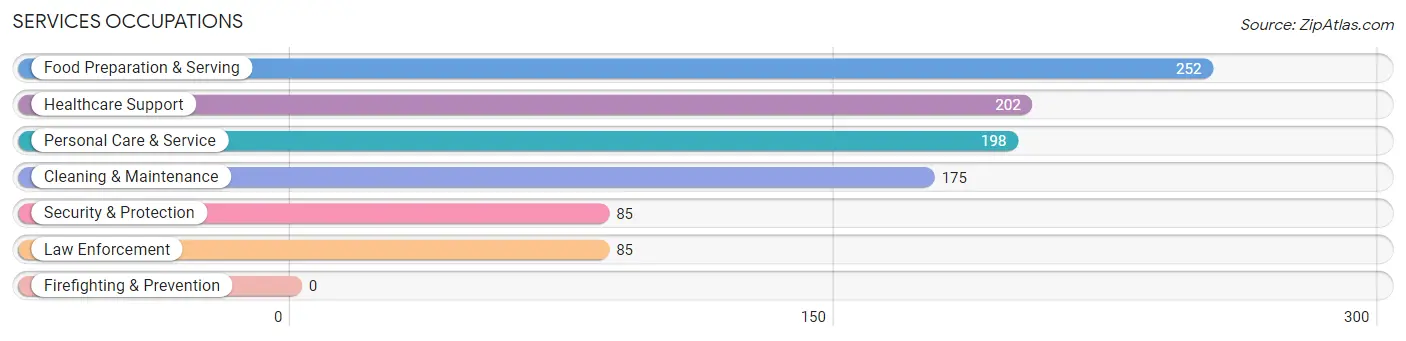
Services Occupations
The most common Services occupations in York County are Food Preparation & Serving (252 | 3.6%), Healthcare Support (202 | 2.9%), Personal Care & Service (198 | 2.9%), Cleaning & Maintenance (175 | 2.5%), and Security & Protection (85 | 1.2%).
Services Occupations by Sex
Within the Services occupations in York County, the most male-oriented occupations are Security & Protection (74.1%), Law Enforcement (74.1%), and Cleaning & Maintenance (72.6%), while the most female-oriented occupations are Healthcare Support (95.1%), Personal Care & Service (91.9%), and Food Preparation & Serving (52.8%).
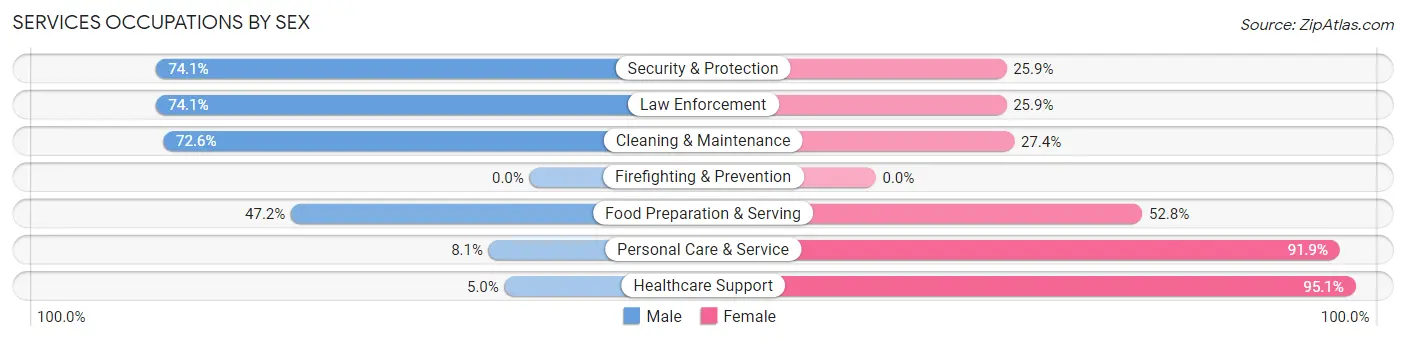
| Occupation | Male | Female |
| Healthcare Support | 10 (5.0%) | 192 (95.1%) |
| Security & Protection | 63 (74.1%) | 22 (25.9%) |
| Firefighting & Prevention | 0 (0.0%) | 0 (0.0%) |
| Law Enforcement | 63 (74.1%) | 22 (25.9%) |
| Food Preparation & Serving | 119 (47.2%) | 133 (52.8%) |
| Cleaning & Maintenance | 127 (72.6%) | 48 (27.4%) |
| Personal Care & Service | 16 (8.1%) | 182 (91.9%) |
| Total (Category) | 335 (36.7%) | 577 (63.3%) |
| Total (Overall) | 3,815 (54.9%) | 3,133 (45.1%) |
Sales and Office Occupations
The most common Sales and Office occupations in York County are Office & Administration (825 | 11.9%), and Sales & Related (764 | 11.0%).

Sales and Office Occupations by Sex

| Occupation | Male | Female |
| Sales & Related | 293 (38.4%) | 471 (61.7%) |
| Office & Administration | 100 (12.1%) | 725 (87.9%) |
| Total (Category) | 393 (24.7%) | 1,196 (75.3%) |
| Total (Overall) | 3,815 (54.9%) | 3,133 (45.1%) |
Natural Resources, Construction and Maintenance Occupations
The most common Natural Resources, Construction and Maintenance occupations in York County are Installation, Maintenance & Repair (376 | 5.4%), Construction & Extraction (359 | 5.2%), and Farming, Fishing & Forestry (152 | 2.2%).
Natural Resources, Construction and Maintenance Occupations by Sex
| Occupation | Male | Female |
| Farming, Fishing & Forestry | 128 (84.2%) | 24 (15.8%) |
| Construction & Extraction | 338 (94.2%) | 21 (5.9%) |
| Installation, Maintenance & Repair | 373 (99.2%) | 3 (0.8%) |
| Total (Category) | 839 (94.6%) | 48 (5.4%) |
| Total (Overall) | 3,815 (54.9%) | 3,133 (45.1%) |
Production, Transportation and Moving Occupations
The most common Production, Transportation and Moving occupations in York County are Production (563 | 8.1%), Material Moving (257 | 3.7%), and Transportation (233 | 3.4%).
Production, Transportation and Moving Occupations by Sex
| Occupation | Male | Female |
| Production | 528 (93.8%) | 35 (6.2%) |
| Transportation | 218 (93.6%) | 15 (6.4%) |
| Material Moving | 159 (61.9%) | 98 (38.1%) |
| Total (Category) | 905 (85.9%) | 148 (14.1%) |
| Total (Overall) | 3,815 (54.9%) | 3,133 (45.1%) |
Employment Industries by Sex in York County
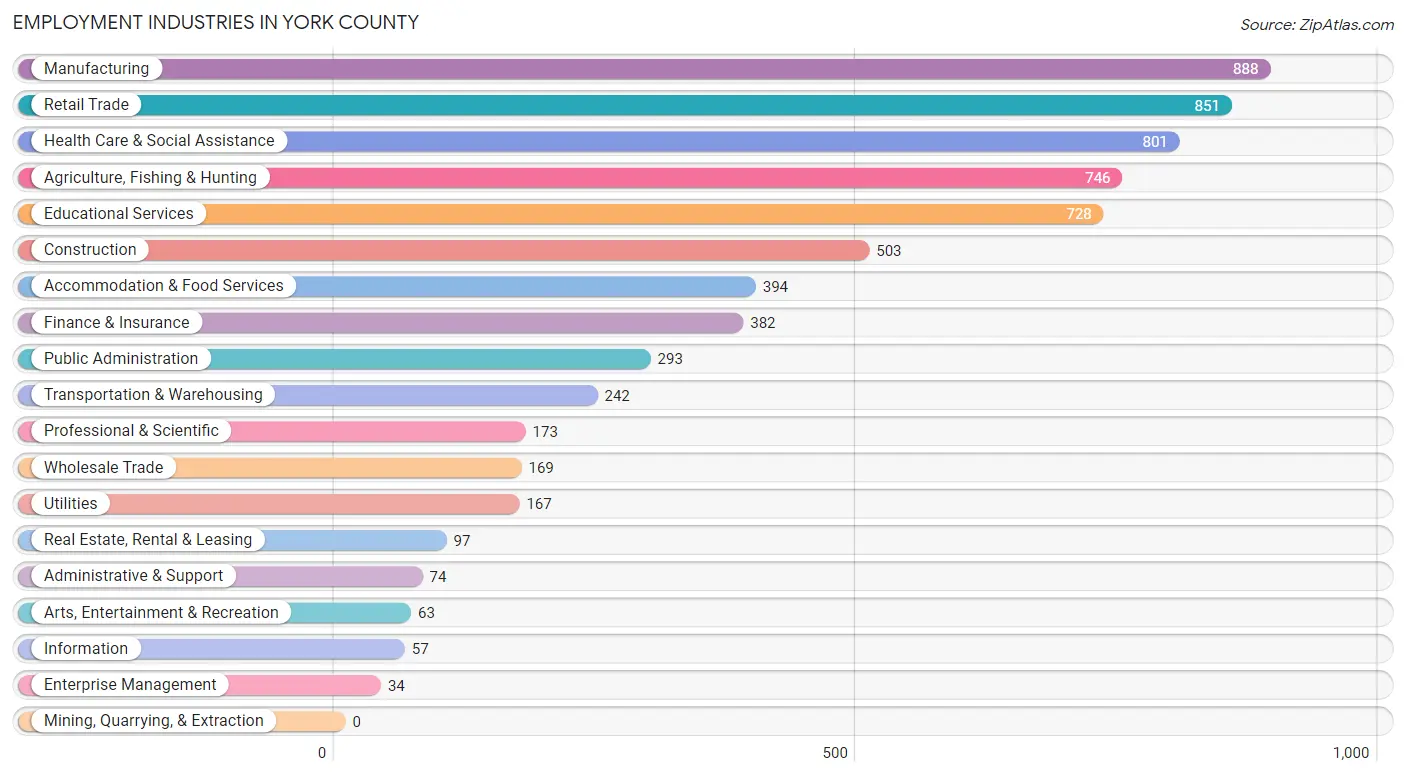
Employment Industries in York County
The major employment industries in York County include Manufacturing (888 | 12.8%), Retail Trade (851 | 12.2%), Health Care & Social Assistance (801 | 11.5%), Agriculture, Fishing & Hunting (746 | 10.7%), and Educational Services (728 | 10.5%).
Employment Industries by Sex in York County
The York County industries that see more men than women are Enterprise Management (100.0%), Utilities (88.6%), and Transportation & Warehousing (87.6%), whereas the industries that tend to have a higher number of women are Health Care & Social Assistance (86.6%), Finance & Insurance (73.0%), and Educational Services (71.0%).
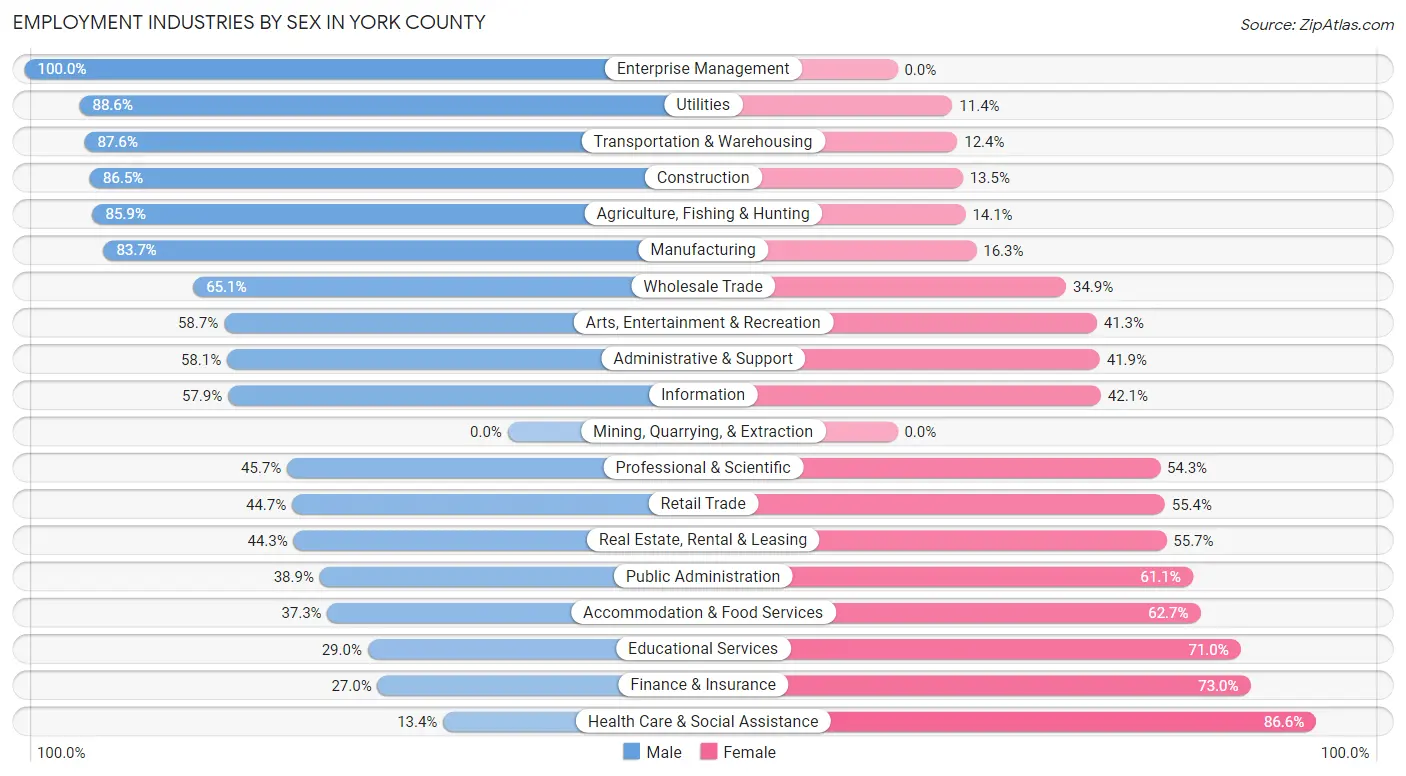
| Industry | Male | Female |
| Agriculture, Fishing & Hunting | 641 (85.9%) | 105 (14.1%) |
| Mining, Quarrying, & Extraction | 0 (0.0%) | 0 (0.0%) |
| Construction | 435 (86.5%) | 68 (13.5%) |
| Manufacturing | 743 (83.7%) | 145 (16.3%) |
| Wholesale Trade | 110 (65.1%) | 59 (34.9%) |
| Retail Trade | 380 (44.7%) | 471 (55.3%) |
| Transportation & Warehousing | 212 (87.6%) | 30 (12.4%) |
| Utilities | 148 (88.6%) | 19 (11.4%) |
| Information | 33 (57.9%) | 24 (42.1%) |
| Finance & Insurance | 103 (27.0%) | 279 (73.0%) |
| Real Estate, Rental & Leasing | 43 (44.3%) | 54 (55.7%) |
| Professional & Scientific | 79 (45.7%) | 94 (54.3%) |
| Enterprise Management | 34 (100.0%) | 0 (0.0%) |
| Administrative & Support | 43 (58.1%) | 31 (41.9%) |
| Educational Services | 211 (29.0%) | 517 (71.0%) |
| Health Care & Social Assistance | 107 (13.4%) | 694 (86.6%) |
| Arts, Entertainment & Recreation | 37 (58.7%) | 26 (41.3%) |
| Accommodation & Food Services | 147 (37.3%) | 247 (62.7%) |
| Public Administration | 114 (38.9%) | 179 (61.1%) |
| Total | 3,815 (54.9%) | 3,133 (45.1%) |
Education in York County
School Enrollment in York County
The most common levels of schooling among the 3,340 students in York County are elementary school (904 | 27.1%), high school (707 | 21.2%), and middle school (575 | 17.2%).
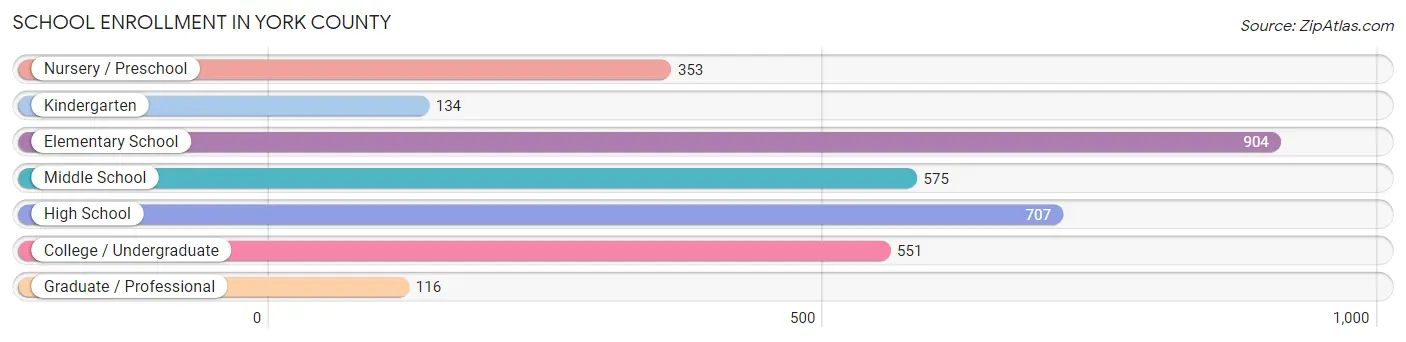
| School Level | # Students | % Students |
| Nursery / Preschool | 353 | 10.6% |
| Kindergarten | 134 | 4.0% |
| Elementary School | 904 | 27.1% |
| Middle School | 575 | 17.2% |
| High School | 707 | 21.2% |
| College / Undergraduate | 551 | 16.5% |
| Graduate / Professional | 116 | 3.5% |
| Total | 3,340 | 100.0% |
School Enrollment by Age by Funding Source in York County
Out of a total of 3,340 students who are enrolled in schools in York County, 929 (27.8%) attend a private institution, while the remaining 2,411 (72.2%) are enrolled in public schools. The age group of 20 to 24 year olds has the highest likelihood of being enrolled in private schools, with 113 (44.1% in the age bracket) enrolled. Conversely, the age group of 15 to 17 year olds has the lowest likelihood of being enrolled in a private school, with 495 (95.4% in the age bracket) attending a public institution.
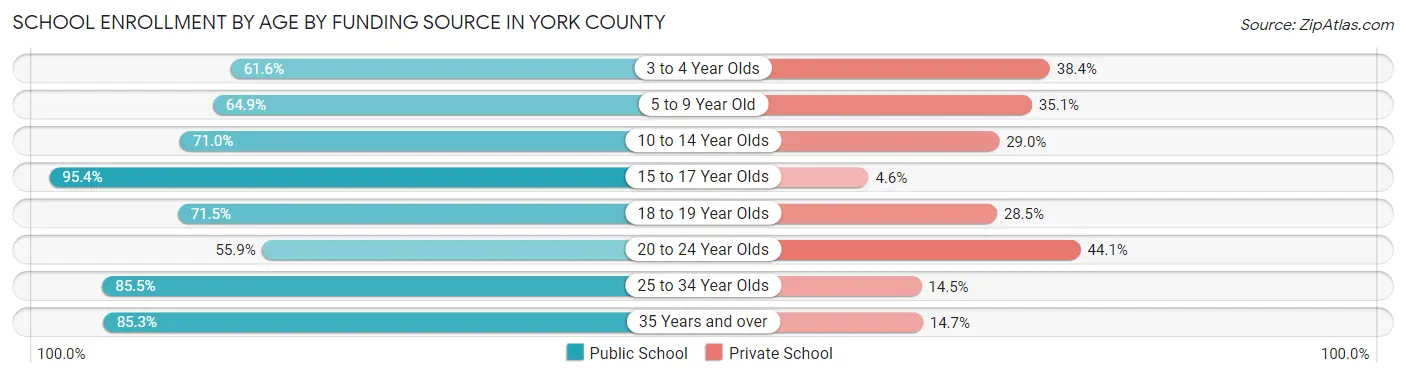
| Age Bracket | Public School | Private School |
| 3 to 4 Year Olds | 154 (61.6%) | 96 (38.4%) |
| 5 to 9 Year Old | 641 (64.9%) | 346 (35.1%) |
| 10 to 14 Year Olds | 581 (71.0%) | 237 (29.0%) |
| 15 to 17 Year Olds | 495 (95.4%) | 24 (4.6%) |
| 18 to 19 Year Olds | 193 (71.5%) | 77 (28.5%) |
| 20 to 24 Year Olds | 143 (55.9%) | 113 (44.1%) |
| 25 to 34 Year Olds | 124 (85.5%) | 21 (14.5%) |
| 35 Years and over | 81 (85.3%) | 14 (14.7%) |
| Total | 2,411 (72.2%) | 929 (27.8%) |
Educational Attainment by Field of Study in York County
Education (525 | 20.5%), business (488 | 19.0%), bio, nature & agricultural (395 | 15.4%), science & technology (264 | 10.3%), and arts & humanities (253 | 9.9%) are the most common fields of study among 2,563 individuals in York County who have obtained a bachelor's degree or higher.
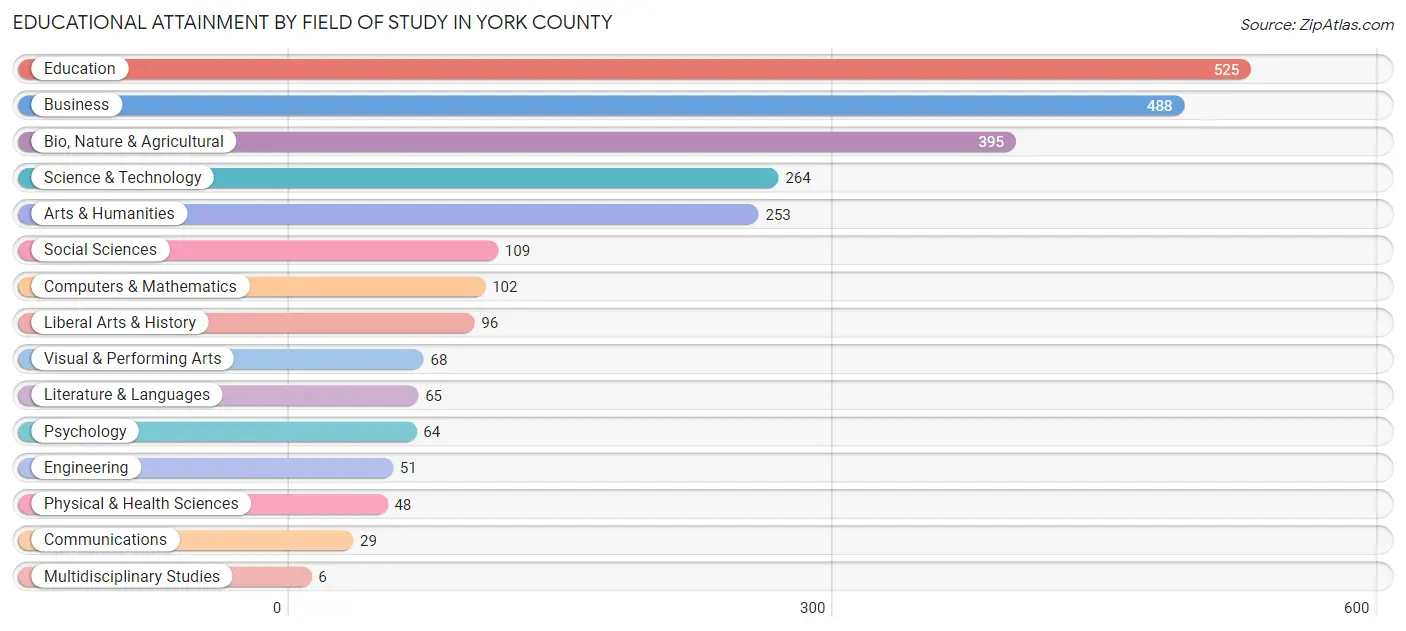
| Field of Study | # Graduates | % Graduates |
| Computers & Mathematics | 102 | 4.0% |
| Bio, Nature & Agricultural | 395 | 15.4% |
| Physical & Health Sciences | 48 | 1.9% |
| Psychology | 64 | 2.5% |
| Social Sciences | 109 | 4.3% |
| Engineering | 51 | 2.0% |
| Multidisciplinary Studies | 6 | 0.2% |
| Science & Technology | 264 | 10.3% |
| Business | 488 | 19.0% |
| Education | 525 | 20.5% |
| Literature & Languages | 65 | 2.5% |
| Liberal Arts & History | 96 | 3.7% |
| Visual & Performing Arts | 68 | 2.6% |
| Communications | 29 | 1.1% |
| Arts & Humanities | 253 | 9.9% |
| Total | 2,563 | 100.0% |
Transportation & Commute in York County
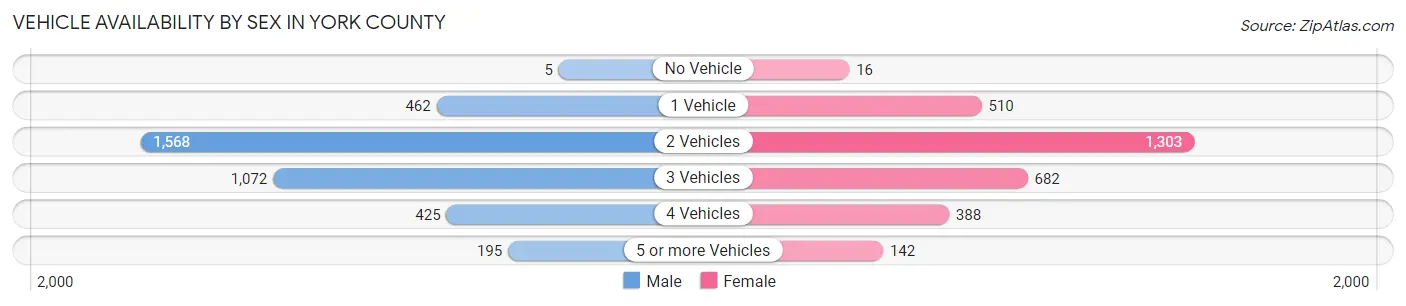
Vehicle Availability by Sex in York County
The most prevalent vehicle ownership categories in York County are males with 2 vehicles (1,568, accounting for 42.1%) and females with 2 vehicles (1,303, making up 51.6%).
| Vehicles Available | Male | Female |
| No Vehicle | 5 (0.1%) | 16 (0.5%) |
| 1 Vehicle | 462 (12.4%) | 510 (16.8%) |
| 2 Vehicles | 1,568 (42.1%) | 1,303 (42.8%) |
| 3 Vehicles | 1,072 (28.8%) | 682 (22.4%) |
| 4 Vehicles | 425 (11.4%) | 388 (12.8%) |
| 5 or more Vehicles | 195 (5.2%) | 142 (4.7%) |
| Total | 3,727 (100.0%) | 3,041 (100.0%) |
Commute Time in York County
The most frequently occuring commute durations in York County are 5 to 9 minutes (1,865 commuters, 29.1%), 10 to 14 minutes (1,165 commuters, 18.2%), and less than 5 minutes (837 commuters, 13.1%).
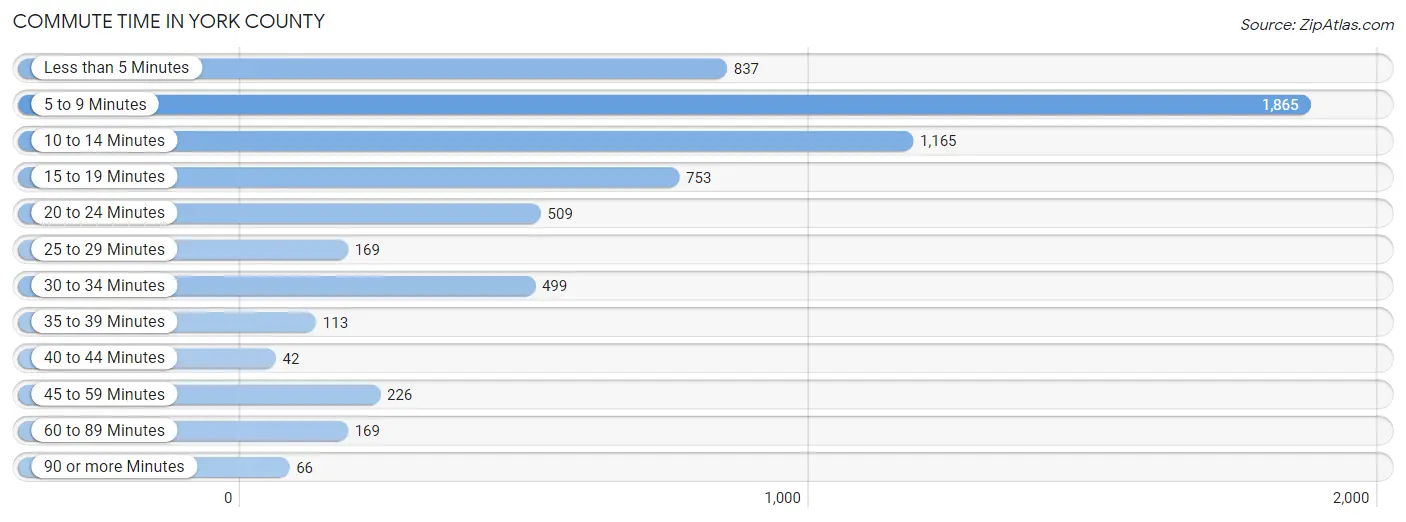
| Commute Time | # Commuters | % Commuters |
| Less than 5 Minutes | 837 | 13.1% |
| 5 to 9 Minutes | 1,865 | 29.1% |
| 10 to 14 Minutes | 1,165 | 18.2% |
| 15 to 19 Minutes | 753 | 11.7% |
| 20 to 24 Minutes | 509 | 7.9% |
| 25 to 29 Minutes | 169 | 2.6% |
| 30 to 34 Minutes | 499 | 7.8% |
| 35 to 39 Minutes | 113 | 1.8% |
| 40 to 44 Minutes | 42 | 0.6% |
| 45 to 59 Minutes | 226 | 3.5% |
| 60 to 89 Minutes | 169 | 2.6% |
| 90 or more Minutes | 66 | 1.0% |
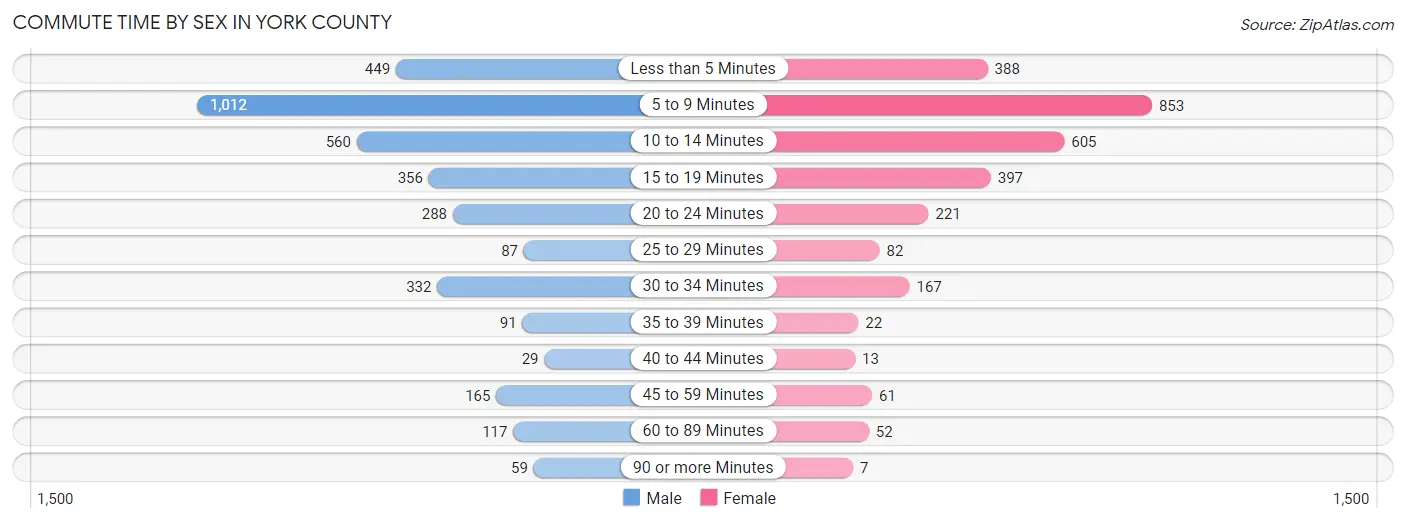
Commute Time by Sex in York County
The most common commute times in York County are 5 to 9 minutes (1,012 commuters, 28.5%) for males and 5 to 9 minutes (853 commuters, 29.7%) for females.
| Commute Time | Male | Female |
| Less than 5 Minutes | 449 (12.7%) | 388 (13.5%) |
| 5 to 9 Minutes | 1,012 (28.5%) | 853 (29.7%) |
| 10 to 14 Minutes | 560 (15.8%) | 605 (21.1%) |
| 15 to 19 Minutes | 356 (10.0%) | 397 (13.8%) |
| 20 to 24 Minutes | 288 (8.1%) | 221 (7.7%) |
| 25 to 29 Minutes | 87 (2.5%) | 82 (2.9%) |
| 30 to 34 Minutes | 332 (9.4%) | 167 (5.8%) |
| 35 to 39 Minutes | 91 (2.6%) | 22 (0.8%) |
| 40 to 44 Minutes | 29 (0.8%) | 13 (0.4%) |
| 45 to 59 Minutes | 165 (4.6%) | 61 (2.1%) |
| 60 to 89 Minutes | 117 (3.3%) | 52 (1.8%) |
| 90 or more Minutes | 59 (1.7%) | 7 (0.2%) |
Time of Departure to Work by Sex in York County
The most frequent times of departure to work in York County are 7:30 AM to 7:59 AM (641, 18.1%) for males and 7:30 AM to 7:59 AM (608, 21.2%) for females.
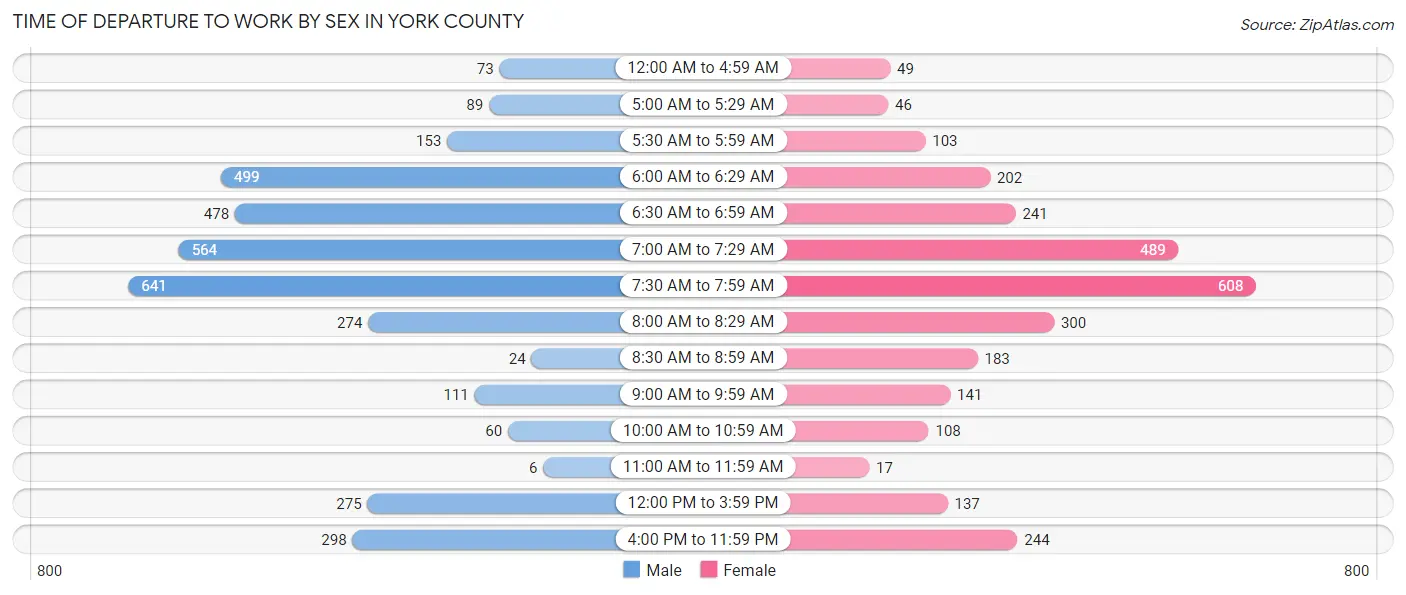
| Time of Departure | Male | Female |
| 12:00 AM to 4:59 AM | 73 (2.1%) | 49 (1.7%) |
| 5:00 AM to 5:29 AM | 89 (2.5%) | 46 (1.6%) |
| 5:30 AM to 5:59 AM | 153 (4.3%) | 103 (3.6%) |
| 6:00 AM to 6:29 AM | 499 (14.1%) | 202 (7.0%) |
| 6:30 AM to 6:59 AM | 478 (13.5%) | 241 (8.4%) |
| 7:00 AM to 7:29 AM | 564 (15.9%) | 489 (17.1%) |
| 7:30 AM to 7:59 AM | 641 (18.1%) | 608 (21.2%) |
| 8:00 AM to 8:29 AM | 274 (7.7%) | 300 (10.5%) |
| 8:30 AM to 8:59 AM | 24 (0.7%) | 183 (6.4%) |
| 9:00 AM to 9:59 AM | 111 (3.1%) | 141 (4.9%) |
| 10:00 AM to 10:59 AM | 60 (1.7%) | 108 (3.8%) |
| 11:00 AM to 11:59 AM | 6 (0.2%) | 17 (0.6%) |
| 12:00 PM to 3:59 PM | 275 (7.8%) | 137 (4.8%) |
| 4:00 PM to 11:59 PM | 298 (8.4%) | 244 (8.5%) |
| Total | 3,545 (100.0%) | 2,868 (100.0%) |
Housing Occupancy in York County
Occupancy by Ownership in York County
Of the total 5,592 dwellings in York County, owner-occupied units account for 4,167 (74.5%), while renter-occupied units make up 1,425 (25.5%).
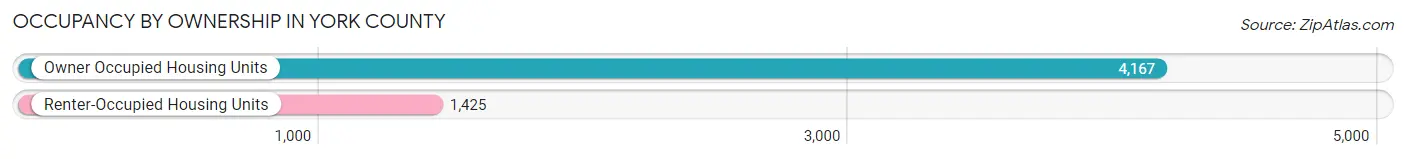
| Occupancy | # Housing Units | % Housing Units |
| Owner Occupied Housing Units | 4,167 | 74.5% |
| Renter-Occupied Housing Units | 1,425 | 25.5% |
| Total Occupied Housing Units | 5,592 | 100.0% |
Occupancy by Household Size in York County
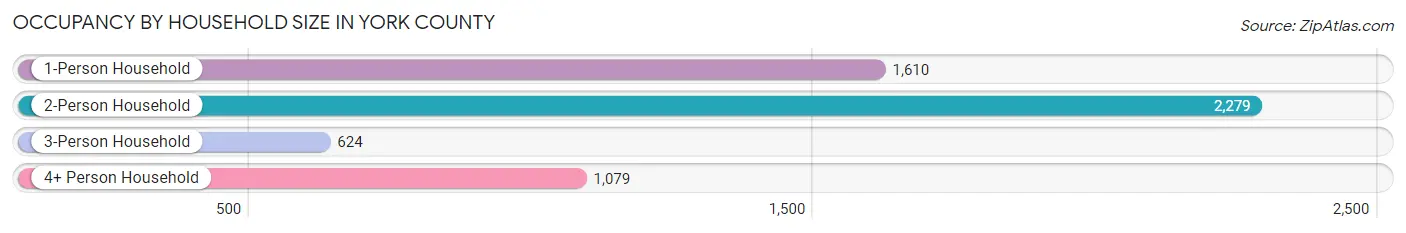
| Household Size | # Housing Units | % Housing Units |
| 1-Person Household | 1,610 | 28.8% |
| 2-Person Household | 2,279 | 40.7% |
| 3-Person Household | 624 | 11.2% |
| 4+ Person Household | 1,079 | 19.3% |
| Total Housing Units | 5,592 | 100.0% |
Occupancy by Ownership by Household Size in York County
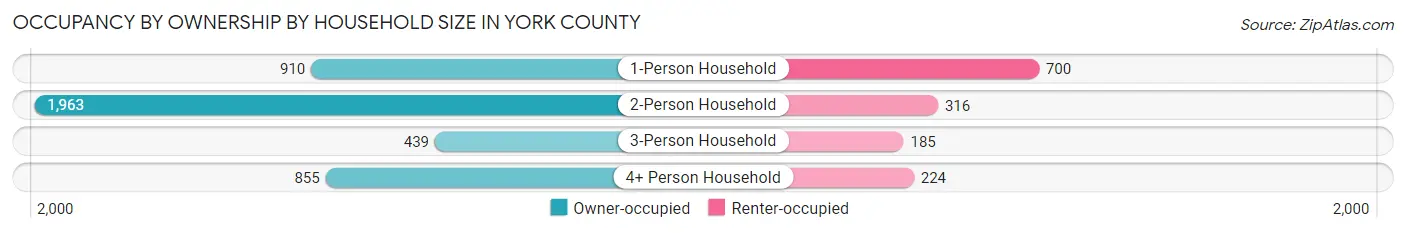
| Household Size | Owner-occupied | Renter-occupied |
| 1-Person Household | 910 (56.5%) | 700 (43.5%) |
| 2-Person Household | 1,963 (86.1%) | 316 (13.9%) |
| 3-Person Household | 439 (70.4%) | 185 (29.6%) |
| 4+ Person Household | 855 (79.2%) | 224 (20.8%) |
| Total Housing Units | 4,167 (74.5%) | 1,425 (25.5%) |
Occupancy by Educational Attainment in York County
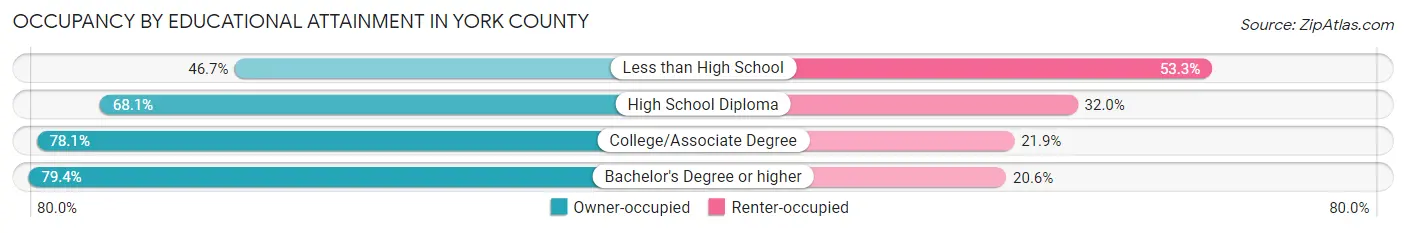
| Household Size | Owner-occupied | Renter-occupied |
| Less than High School | 86 (46.7%) | 98 (53.3%) |
| High School Diploma | 1,095 (68.0%) | 514 (32.0%) |
| College/Associate Degree | 1,838 (78.1%) | 515 (21.9%) |
| Bachelor's Degree or higher | 1,148 (79.4%) | 298 (20.6%) |
Occupancy by Age of Householder in York County
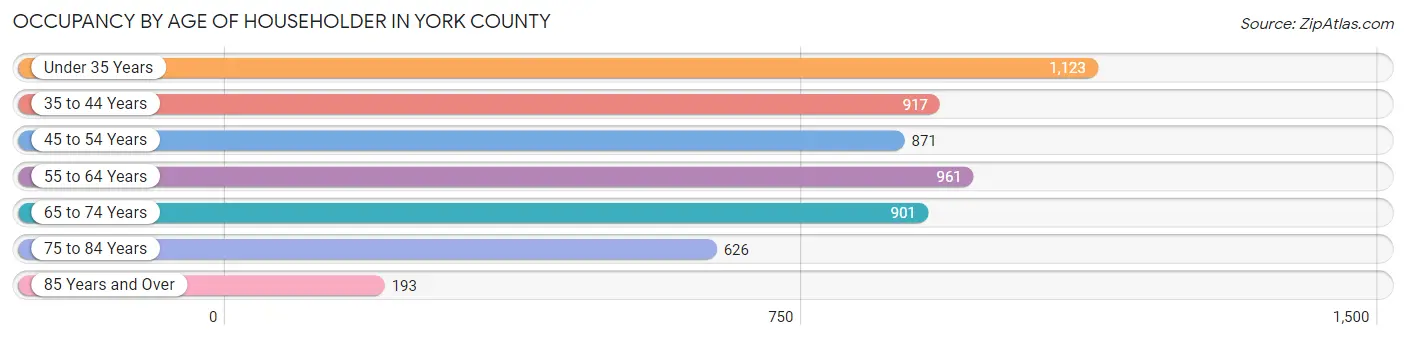
| Age Bracket | # Households | % Households |
| Under 35 Years | 1,123 | 20.1% |
| 35 to 44 Years | 917 | 16.4% |
| 45 to 54 Years | 871 | 15.6% |
| 55 to 64 Years | 961 | 17.2% |
| 65 to 74 Years | 901 | 16.1% |
| 75 to 84 Years | 626 | 11.2% |
| 85 Years and Over | 193 | 3.5% |
| Total | 5,592 | 100.0% |
Housing Finances in York County
Median Income by Occupancy in York County
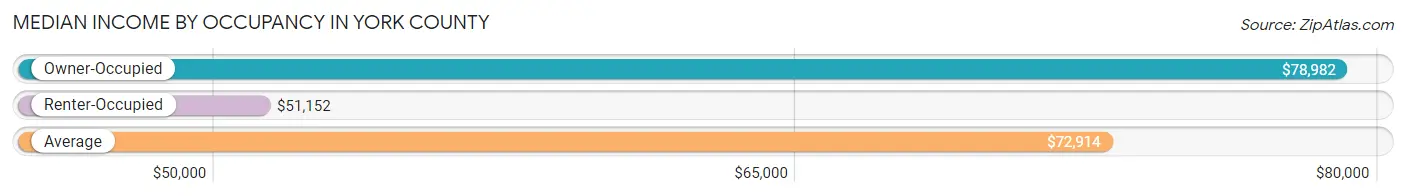
| Occupancy Type | # Households | Median Income |
| Owner-Occupied | 4,167 (74.5%) | $78,982 |
| Renter-Occupied | 1,425 (25.5%) | $51,152 |
| Average | 5,592 (100.0%) | $72,914 |
Occupancy by Householder Income Bracket in York County
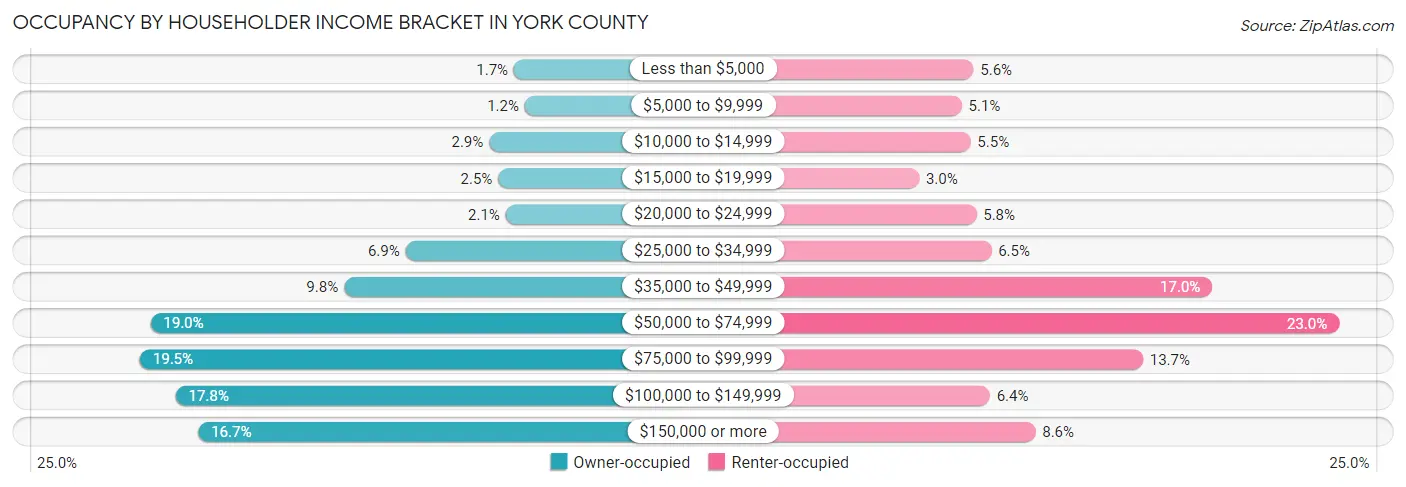
| Income Bracket | Owner-occupied | Renter-occupied |
| Less than $5,000 | 71 (1.7%) | 80 (5.6%) |
| $5,000 to $9,999 | 49 (1.2%) | 72 (5.1%) |
| $10,000 to $14,999 | 120 (2.9%) | 78 (5.5%) |
| $15,000 to $19,999 | 102 (2.5%) | 43 (3.0%) |
| $20,000 to $24,999 | 87 (2.1%) | 82 (5.8%) |
| $25,000 to $34,999 | 286 (6.9%) | 92 (6.5%) |
| $35,000 to $49,999 | 408 (9.8%) | 242 (17.0%) |
| $50,000 to $74,999 | 792 (19.0%) | 328 (23.0%) |
| $75,000 to $99,999 | 813 (19.5%) | 195 (13.7%) |
| $100,000 to $149,999 | 742 (17.8%) | 91 (6.4%) |
| $150,000 or more | 697 (16.7%) | 122 (8.6%) |
| Total | 4,167 (100.0%) | 1,425 (100.0%) |
Monthly Housing Cost Tiers in York County
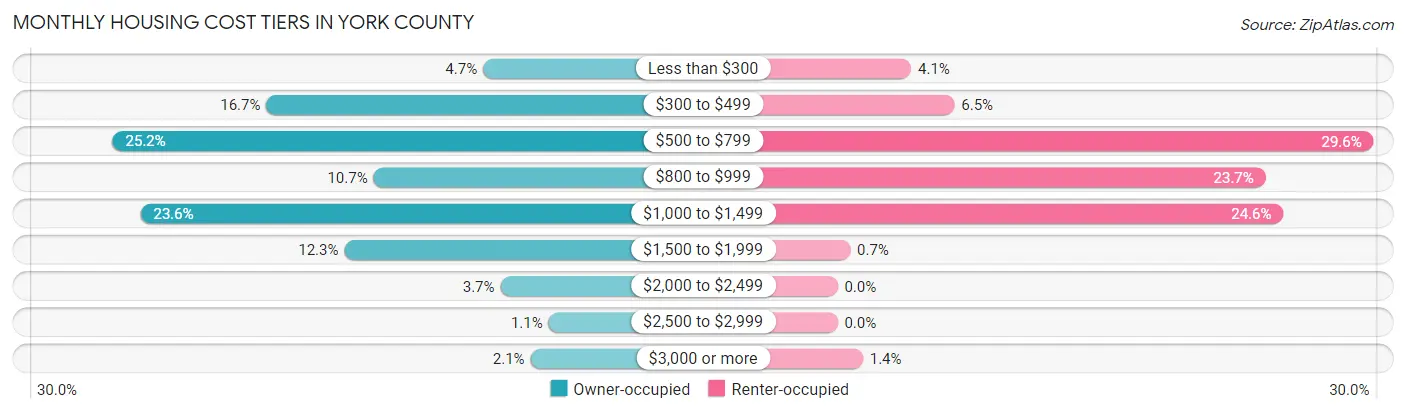
| Monthly Cost | Owner-occupied | Renter-occupied |
| Less than $300 | 195 (4.7%) | 58 (4.1%) |
| $300 to $499 | 694 (16.7%) | 92 (6.5%) |
| $500 to $799 | 1,048 (25.2%) | 422 (29.6%) |
| $800 to $999 | 447 (10.7%) | 337 (23.6%) |
| $1,000 to $1,499 | 984 (23.6%) | 351 (24.6%) |
| $1,500 to $1,999 | 514 (12.3%) | 10 (0.7%) |
| $2,000 to $2,499 | 155 (3.7%) | 0 (0.0%) |
| $2,500 to $2,999 | 44 (1.1%) | 0 (0.0%) |
| $3,000 or more | 86 (2.1%) | 20 (1.4%) |
| Total | 4,167 (100.0%) | 1,425 (100.0%) |
Physical Housing Characteristics in York County
Housing Structures in York County
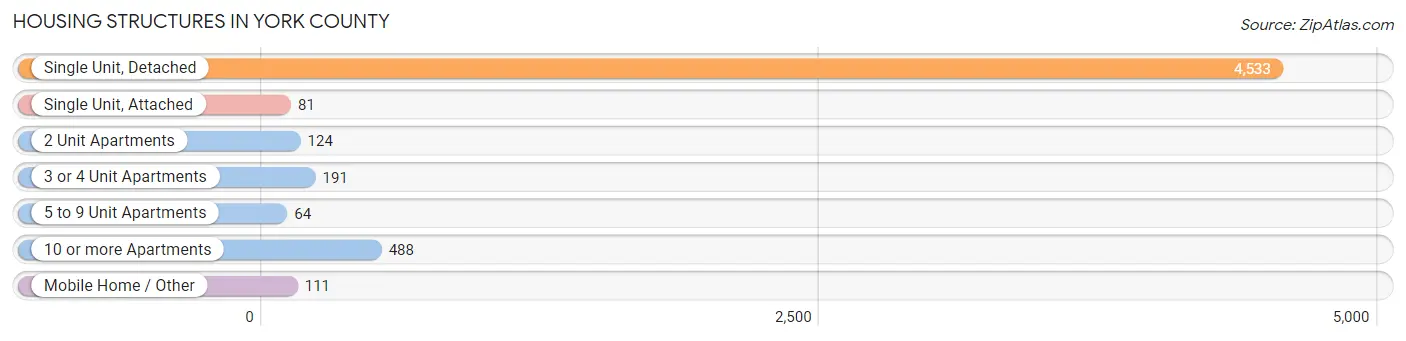
| Structure Type | # Housing Units | % Housing Units |
| Single Unit, Detached | 4,533 | 81.1% |
| Single Unit, Attached | 81 | 1.5% |
| 2 Unit Apartments | 124 | 2.2% |
| 3 or 4 Unit Apartments | 191 | 3.4% |
| 5 to 9 Unit Apartments | 64 | 1.1% |
| 10 or more Apartments | 488 | 8.7% |
| Mobile Home / Other | 111 | 2.0% |
| Total | 5,592 | 100.0% |
Housing Structures by Occupancy in York County
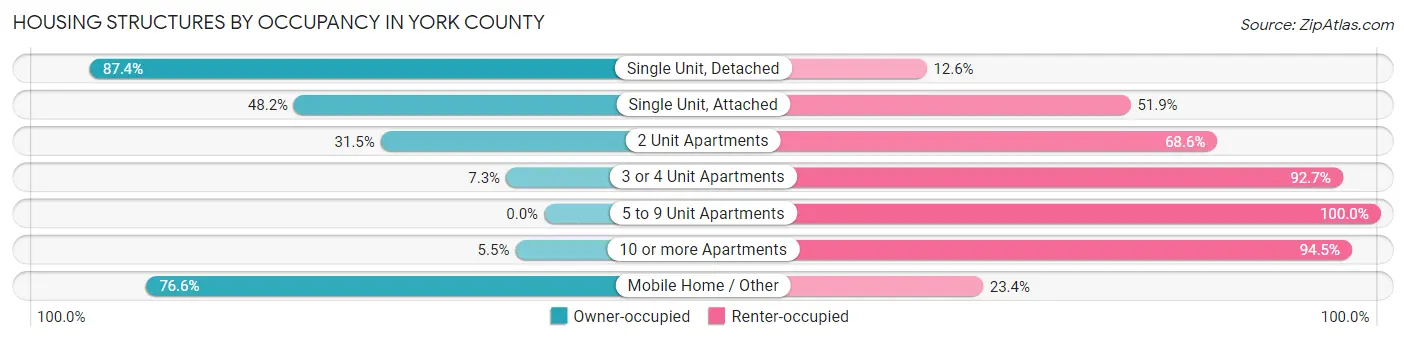
| Structure Type | Owner-occupied | Renter-occupied |
| Single Unit, Detached | 3,963 (87.4%) | 570 (12.6%) |
| Single Unit, Attached | 39 (48.1%) | 42 (51.8%) |
| 2 Unit Apartments | 39 (31.5%) | 85 (68.5%) |
| 3 or 4 Unit Apartments | 14 (7.3%) | 177 (92.7%) |
| 5 to 9 Unit Apartments | 0 (0.0%) | 64 (100.0%) |
| 10 or more Apartments | 27 (5.5%) | 461 (94.5%) |
| Mobile Home / Other | 85 (76.6%) | 26 (23.4%) |
| Total | 4,167 (74.5%) | 1,425 (25.5%) |
Housing Structures by Number of Rooms in York County
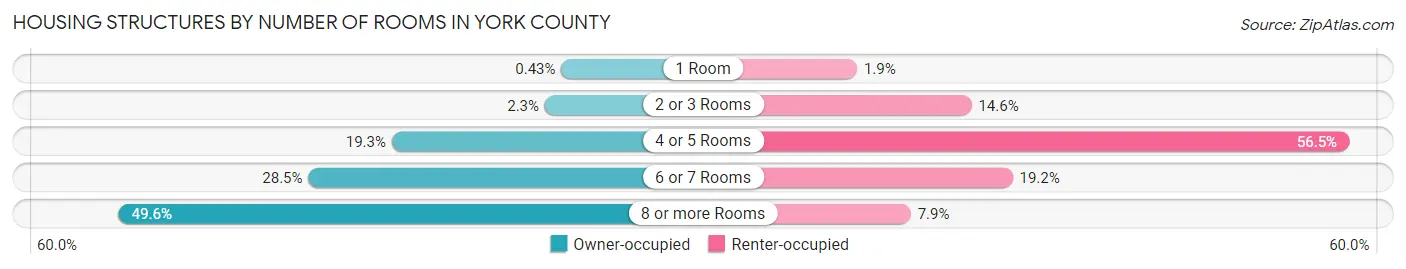
| Number of Rooms | Owner-occupied | Renter-occupied |
| 1 Room | 18 (0.4%) | 27 (1.9%) |
| 2 or 3 Rooms | 94 (2.3%) | 208 (14.6%) |
| 4 or 5 Rooms | 802 (19.3%) | 805 (56.5%) |
| 6 or 7 Rooms | 1,188 (28.5%) | 273 (19.2%) |
| 8 or more Rooms | 2,065 (49.6%) | 112 (7.9%) |
| Total | 4,167 (100.0%) | 1,425 (100.0%) |
Housing Structure by Heating Type in York County
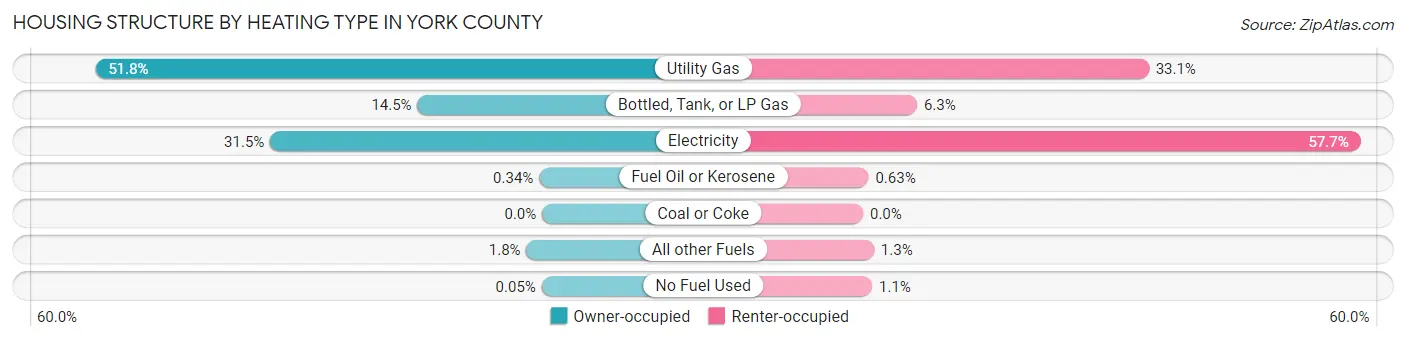
| Heating Type | Owner-occupied | Renter-occupied |
| Utility Gas | 2,159 (51.8%) | 472 (33.1%) |
| Bottled, Tank, or LP Gas | 602 (14.4%) | 89 (6.2%) |
| Electricity | 1,314 (31.5%) | 822 (57.7%) |
| Fuel Oil or Kerosene | 14 (0.3%) | 9 (0.6%) |
| Coal or Coke | 0 (0.0%) | 0 (0.0%) |
| All other Fuels | 76 (1.8%) | 18 (1.3%) |
| No Fuel Used | 2 (0.1%) | 15 (1.1%) |
| Total | 4,167 (100.0%) | 1,425 (100.0%) |
Household Vehicle Usage in York County
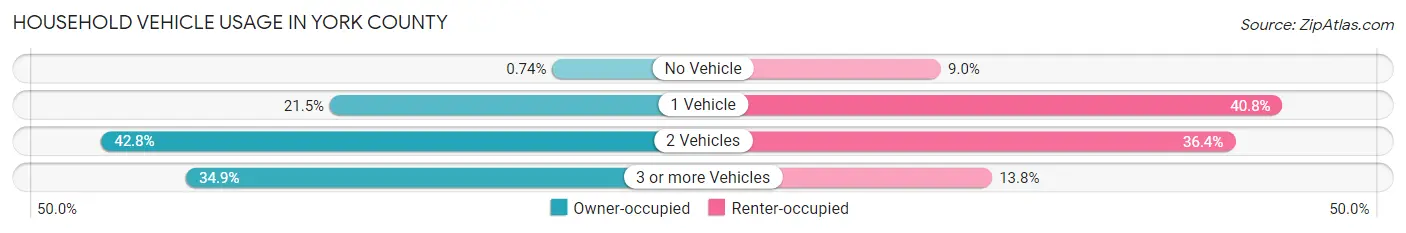
| Vehicles per Household | Owner-occupied | Renter-occupied |
| No Vehicle | 31 (0.7%) | 128 (9.0%) |
| 1 Vehicle | 896 (21.5%) | 582 (40.8%) |
| 2 Vehicles | 1,785 (42.8%) | 519 (36.4%) |
| 3 or more Vehicles | 1,455 (34.9%) | 196 (13.8%) |
| Total | 4,167 (100.0%) | 1,425 (100.0%) |
Real Estate & Mortgages in York County
Real Estate and Mortgage Overview in York County
| Characteristic | Without Mortgage | With Mortgage |
| Housing Units | 1,959 | 2,208 |
| Median Property Value | $154,800 | $163,200 |
| Median Household Income | $71,250 | $411 |
| Monthly Housing Costs | $534 | $86 |
| Real Estate Taxes | $1,802 | $57 |
Property Value by Mortgage Status in York County
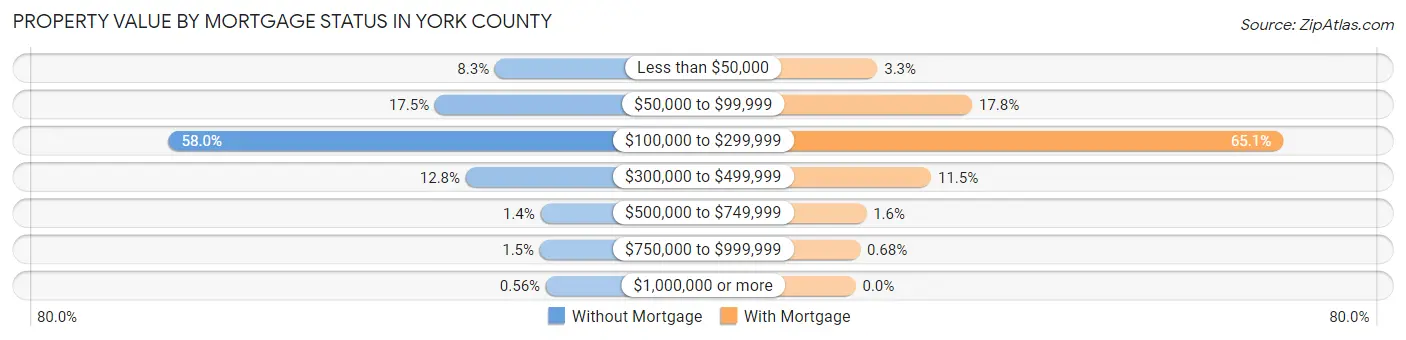
| Property Value | Without Mortgage | With Mortgage |
| Less than $50,000 | 163 (8.3%) | 73 (3.3%) |
| $50,000 to $99,999 | 342 (17.5%) | 392 (17.7%) |
| $100,000 to $299,999 | 1,137 (58.0%) | 1,438 (65.1%) |
| $300,000 to $499,999 | 250 (12.8%) | 254 (11.5%) |
| $500,000 to $749,999 | 27 (1.4%) | 36 (1.6%) |
| $750,000 to $999,999 | 29 (1.5%) | 15 (0.7%) |
| $1,000,000 or more | 11 (0.6%) | 0 (0.0%) |
| Total | 1,959 (100.0%) | 2,208 (100.0%) |
Household Income by Mortgage Status in York County
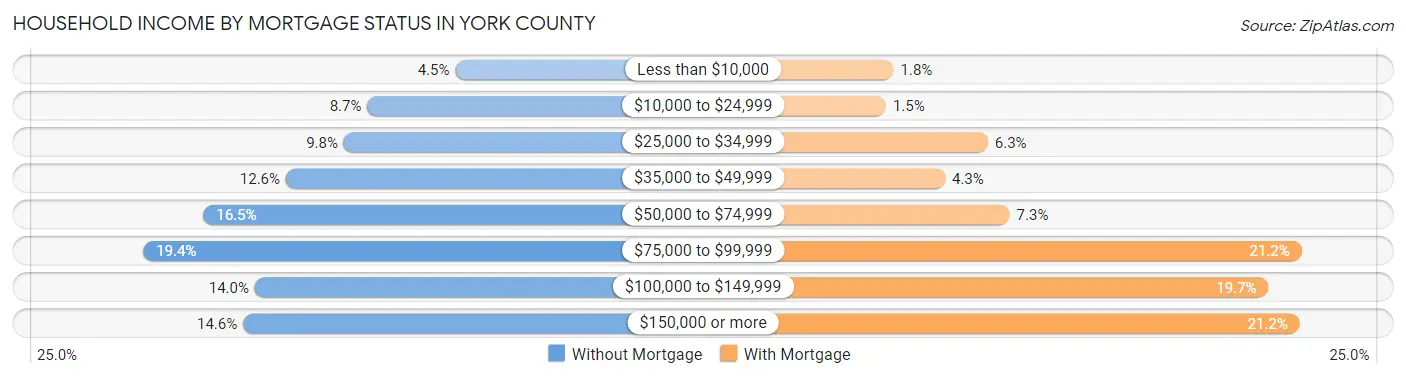
| Household Income | Without Mortgage | With Mortgage |
| Less than $10,000 | 88 (4.5%) | 40 (1.8%) |
| $10,000 to $24,999 | 170 (8.7%) | 32 (1.5%) |
| $25,000 to $34,999 | 192 (9.8%) | 139 (6.3%) |
| $35,000 to $49,999 | 246 (12.6%) | 94 (4.3%) |
| $50,000 to $74,999 | 323 (16.5%) | 162 (7.3%) |
| $75,000 to $99,999 | 379 (19.4%) | 469 (21.2%) |
| $100,000 to $149,999 | 275 (14.0%) | 434 (19.7%) |
| $150,000 or more | 286 (14.6%) | 467 (21.1%) |
| Total | 1,959 (100.0%) | 2,208 (100.0%) |
Property Value to Household Income Ratio in York County
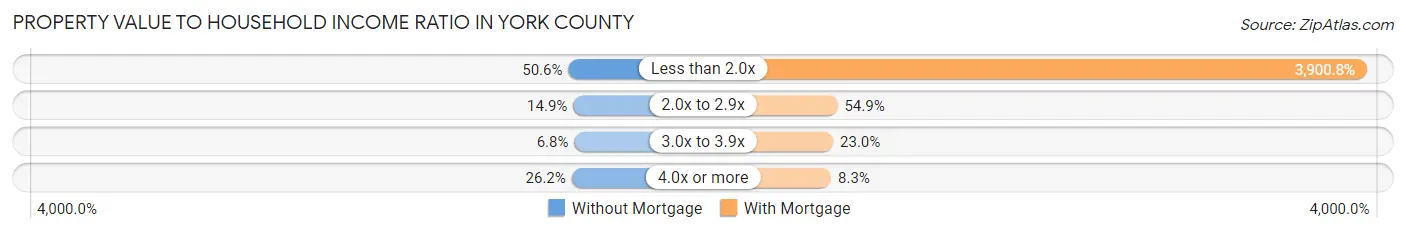
| Value-to-Income Ratio | Without Mortgage | With Mortgage |
| Less than 2.0x | 991 (50.6%) | 86,130 (3,900.8%) |
| 2.0x to 2.9x | 292 (14.9%) | 1,213 (54.9%) |
| 3.0x to 3.9x | 133 (6.8%) | 508 (23.0%) |
| 4.0x or more | 514 (26.2%) | 183 (8.3%) |
| Total | 1,959 (100.0%) | 2,208 (100.0%) |
Real Estate Taxes by Mortgage Status in York County
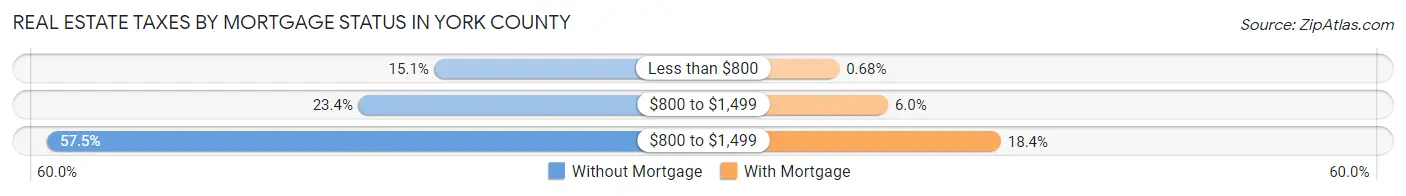
| Property Taxes | Without Mortgage | With Mortgage |
| Less than $800 | 295 (15.1%) | 15 (0.7%) |
| $800 to $1,499 | 458 (23.4%) | 133 (6.0%) |
| $800 to $1,499 | 1,127 (57.5%) | 406 (18.4%) |
| Total | 1,959 (100.0%) | 2,208 (100.0%) |
Health & Disability in York County
Health Insurance Coverage by Age in York County
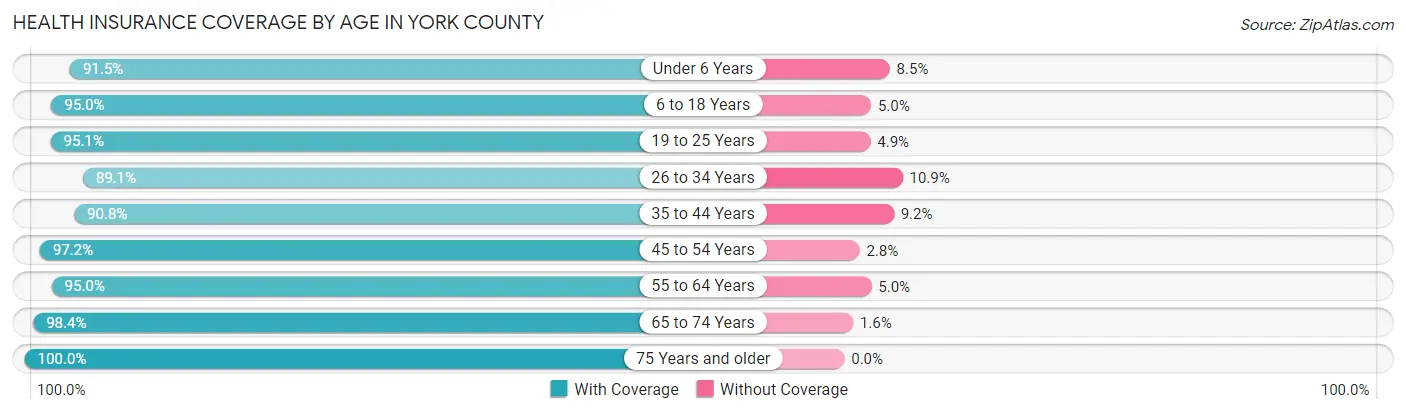
| Age Bracket | With Coverage | Without Coverage |
| Under 6 Years | 995 (91.5%) | 92 (8.5%) |
| 6 to 18 Years | 2,269 (95.0%) | 119 (5.0%) |
| 19 to 25 Years | 1,232 (95.1%) | 63 (4.9%) |
| 26 to 34 Years | 1,198 (89.1%) | 146 (10.9%) |
| 35 to 44 Years | 1,379 (90.8%) | 140 (9.2%) |
| 45 to 54 Years | 1,369 (97.2%) | 40 (2.8%) |
| 55 to 64 Years | 1,754 (95.0%) | 93 (5.0%) |
| 65 to 74 Years | 1,517 (98.4%) | 25 (1.6%) |
| 75 Years and older | 1,195 (100.0%) | 0 (0.0%) |
| Total | 12,908 (94.7%) | 718 (5.3%) |
Health Insurance Coverage by Citizenship Status in York County
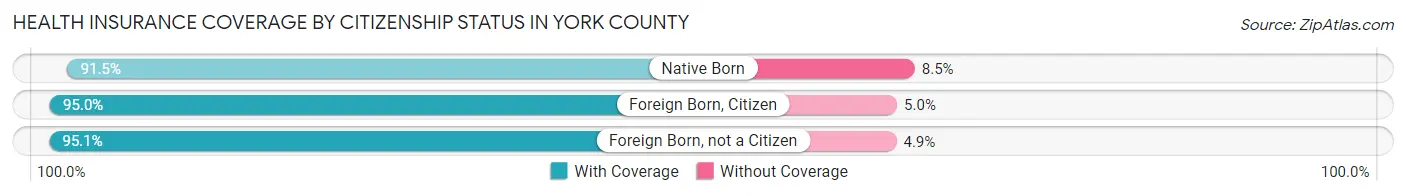
| Citizenship Status | With Coverage | Without Coverage |
| Native Born | 995 (91.5%) | 92 (8.5%) |
| Foreign Born, Citizen | 2,269 (95.0%) | 119 (5.0%) |
| Foreign Born, not a Citizen | 1,232 (95.1%) | 63 (4.9%) |
Health Insurance Coverage by Household Income in York County
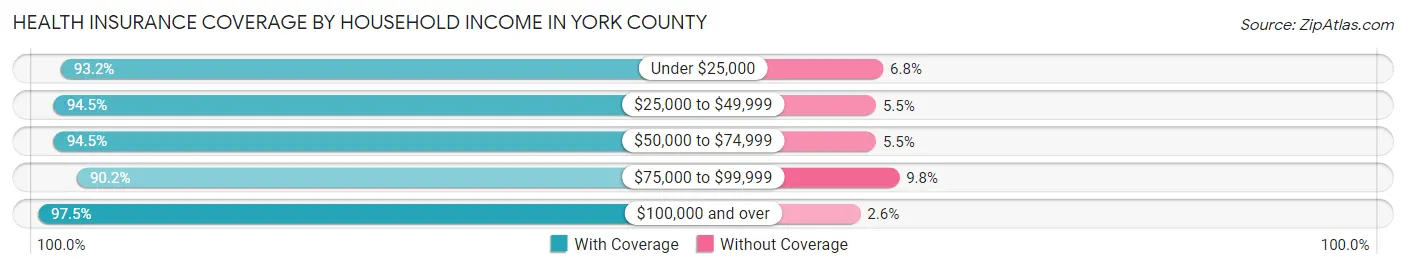
| Household Income | With Coverage | Without Coverage |
| Under $25,000 | 986 (93.2%) | 72 (6.8%) |
| $25,000 to $49,999 | 2,147 (94.5%) | 124 (5.5%) |
| $50,000 to $74,999 | 2,283 (94.5%) | 132 (5.5%) |
| $75,000 to $99,999 | 2,361 (90.2%) | 257 (9.8%) |
| $100,000 and over | 4,823 (97.5%) | 126 (2.5%) |
Public vs Private Health Insurance Coverage by Age in York County
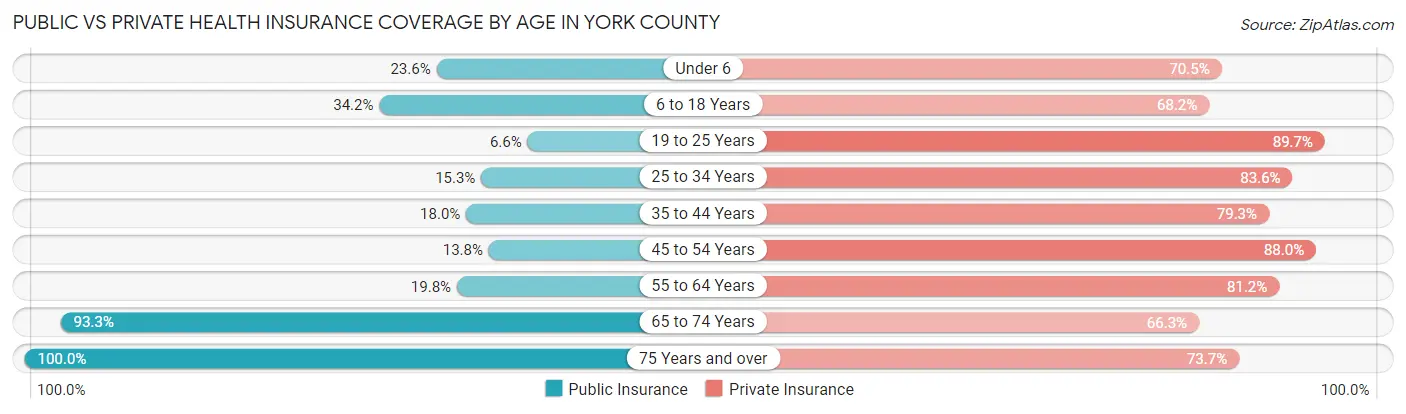
| Age Bracket | Public Insurance | Private Insurance |
| Under 6 | 256 (23.5%) | 766 (70.5%) |
| 6 to 18 Years | 816 (34.2%) | 1,628 (68.2%) |
| 19 to 25 Years | 86 (6.6%) | 1,161 (89.6%) |
| 25 to 34 Years | 205 (15.2%) | 1,124 (83.6%) |
| 35 to 44 Years | 274 (18.0%) | 1,204 (79.3%) |
| 45 to 54 Years | 195 (13.8%) | 1,240 (88.0%) |
| 55 to 64 Years | 365 (19.8%) | 1,499 (81.2%) |
| 65 to 74 Years | 1,439 (93.3%) | 1,022 (66.3%) |
| 75 Years and over | 1,195 (100.0%) | 881 (73.7%) |
| Total | 4,831 (35.4%) | 10,525 (77.2%) |
Disability Status by Sex by Age in York County
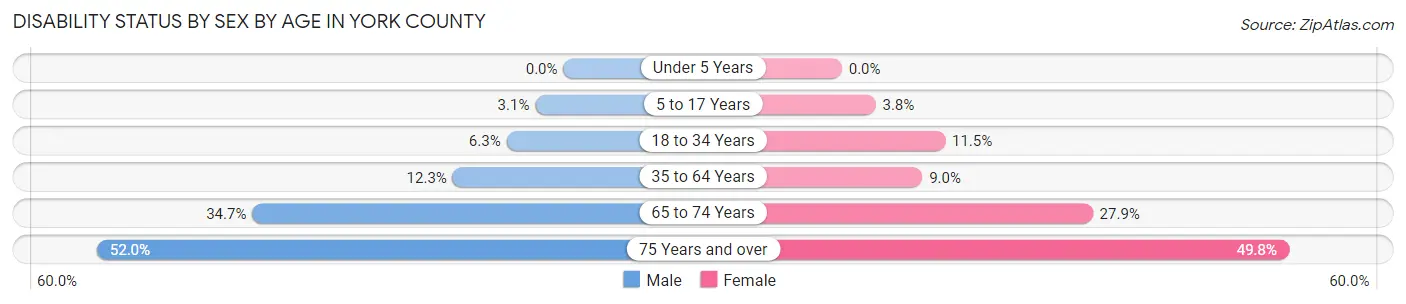
| Age Bracket | Male | Female |
| Under 5 Years | 0 (0.0%) | 0 (0.0%) |
| 5 to 17 Years | 40 (3.1%) | 41 (3.8%) |
| 18 to 34 Years | 94 (6.3%) | 153 (11.5%) |
| 35 to 64 Years | 308 (12.3%) | 204 (9.0%) |
| 65 to 74 Years | 254 (34.6%) | 226 (27.9%) |
| 75 Years and over | 267 (51.9%) | 339 (49.8%) |
Disability Class by Sex by Age in York County
Disability Class: Hearing Difficulty
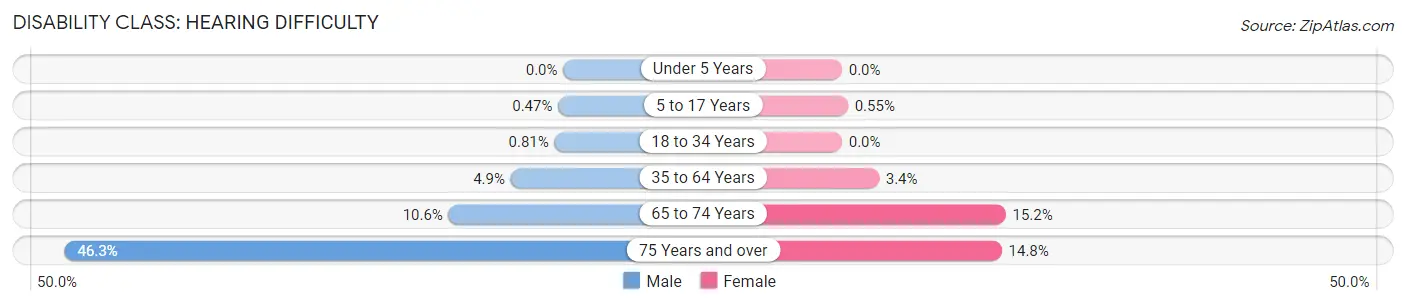
| Age Bracket | Male | Female |
| Under 5 Years | 0 (0.0%) | 0 (0.0%) |
| 5 to 17 Years | 6 (0.5%) | 6 (0.5%) |
| 18 to 34 Years | 12 (0.8%) | 0 (0.0%) |
| 35 to 64 Years | 122 (4.9%) | 78 (3.4%) |
| 65 to 74 Years | 78 (10.6%) | 123 (15.2%) |
| 75 Years and over | 238 (46.3%) | 101 (14.8%) |
Disability Class: Vision Difficulty
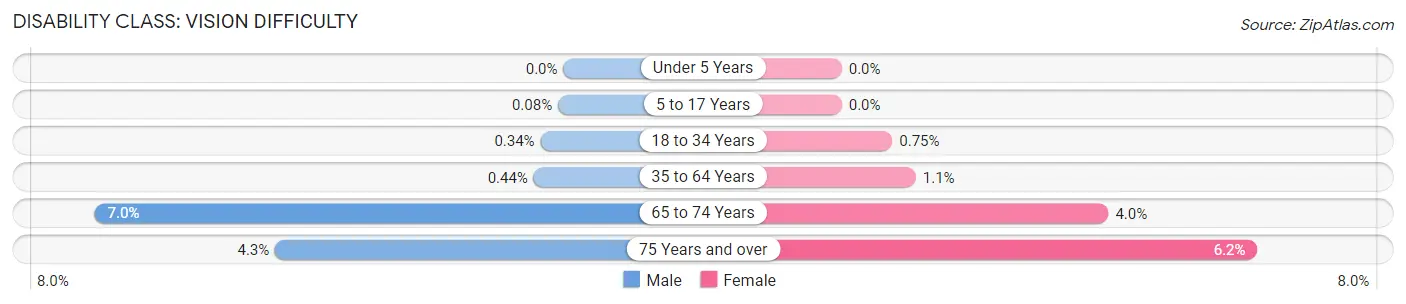
| Age Bracket | Male | Female |
| Under 5 Years | 0 (0.0%) | 0 (0.0%) |
| 5 to 17 Years | 1 (0.1%) | 0 (0.0%) |
| 18 to 34 Years | 5 (0.3%) | 10 (0.7%) |
| 35 to 64 Years | 11 (0.4%) | 25 (1.1%) |
| 65 to 74 Years | 51 (7.0%) | 32 (4.0%) |
| 75 Years and over | 22 (4.3%) | 42 (6.2%) |
Disability Class: Cognitive Difficulty
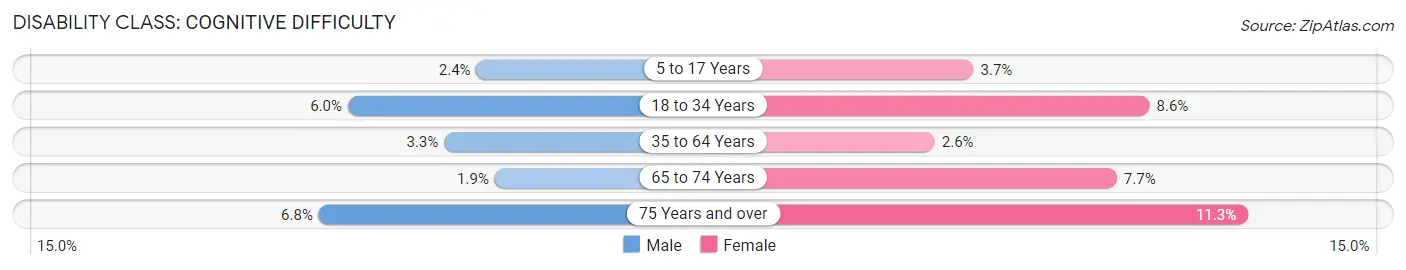
| Age Bracket | Male | Female |
| 5 to 17 Years | 31 (2.4%) | 40 (3.7%) |
| 18 to 34 Years | 89 (6.0%) | 114 (8.6%) |
| 35 to 64 Years | 83 (3.3%) | 59 (2.6%) |
| 65 to 74 Years | 14 (1.9%) | 62 (7.7%) |
| 75 Years and over | 35 (6.8%) | 77 (11.3%) |
Disability Class: Ambulatory Difficulty
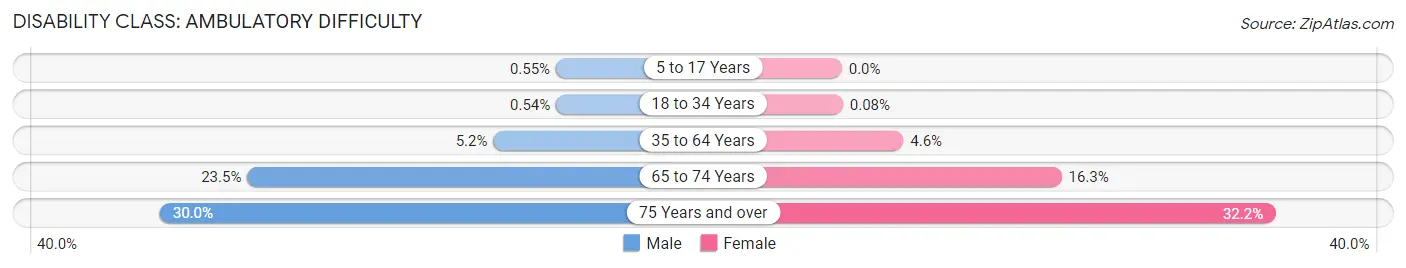
| Age Bracket | Male | Female |
| 5 to 17 Years | 7 (0.5%) | 0 (0.0%) |
| 18 to 34 Years | 8 (0.5%) | 1 (0.1%) |
| 35 to 64 Years | 130 (5.2%) | 104 (4.6%) |
| 65 to 74 Years | 172 (23.5%) | 132 (16.3%) |
| 75 Years and over | 154 (30.0%) | 219 (32.2%) |
Disability Class: Self-Care Difficulty
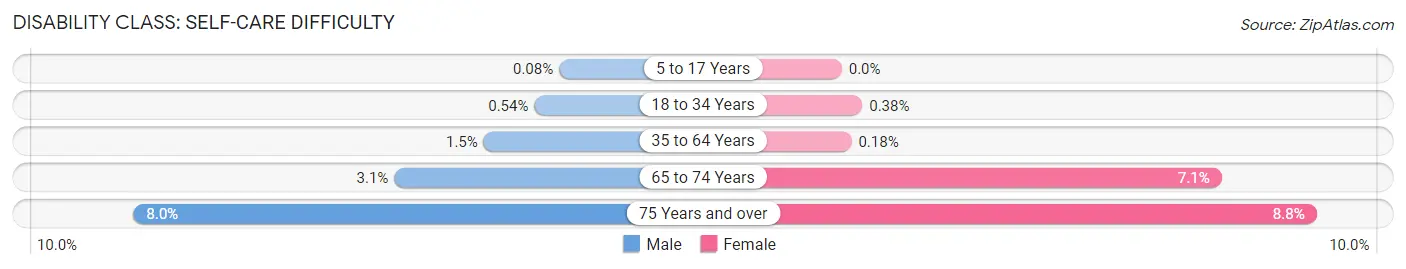
| Age Bracket | Male | Female |
| 5 to 17 Years | 1 (0.1%) | 0 (0.0%) |
| 18 to 34 Years | 8 (0.5%) | 5 (0.4%) |
| 35 to 64 Years | 37 (1.5%) | 4 (0.2%) |
| 65 to 74 Years | 23 (3.1%) | 57 (7.0%) |
| 75 Years and over | 41 (8.0%) | 60 (8.8%) |
Technology Access in York County
Computing Device Access in York County
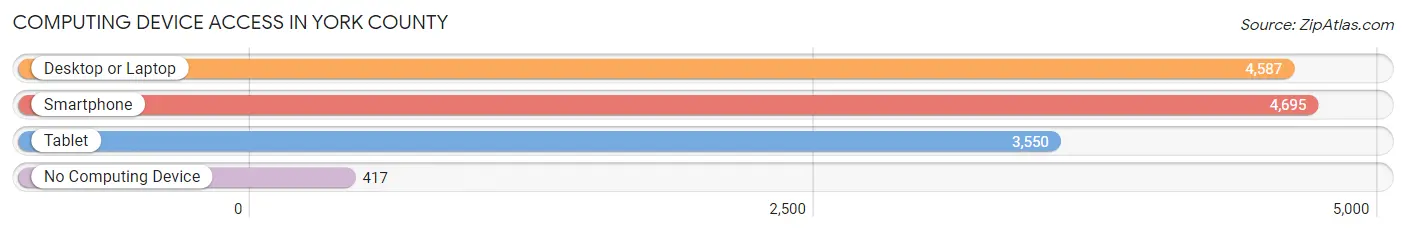
| Device Type | # Households | % Households |
| Desktop or Laptop | 4,587 | 82.0% |
| Smartphone | 4,695 | 84.0% |
| Tablet | 3,550 | 63.5% |
| No Computing Device | 417 | 7.5% |
| Total | 5,592 | 100.0% |
Internet Access in York County
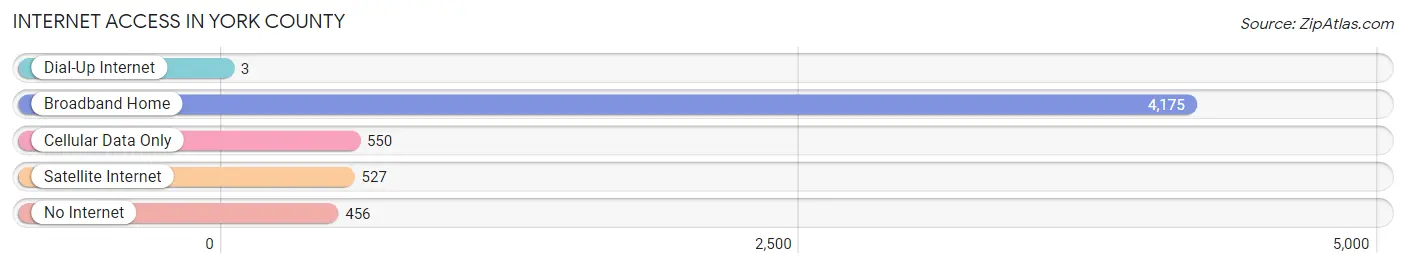
| Internet Type | # Households | % Households |
| Dial-Up Internet | 3 | 0.1% |
| Broadband Home | 4,175 | 74.7% |
| Cellular Data Only | 550 | 9.8% |
| Satellite Internet | 527 | 9.4% |
| No Internet | 456 | 8.2% |
| Total | 5,592 | 100.0% |
York County Summary
York County is located in the state of Nebraska in the Midwestern United States. It is bordered by Seward County to the north, Polk County to the east, Hamilton County to the south, and Fillmore County to the west. The county seat is York, and the largest city is York. As of the 2010 census, the population was 13,665.
History
York County was established in 1855 and was named after York, England. The county was originally part of the Nebraska Territory, and was one of the original nine counties established in the territory. The county was organized in 1867.
The first settlers in the county were mostly of German and Scandinavian descent. The first permanent settlement was established in 1867, and the county was officially organized in 1871.
Geography
York County is located in the eastern part of Nebraska, and is bordered by Seward County to the north, Polk County to the east, Hamilton County to the south, and Fillmore County to the west. The county has a total area of 576 square miles, of which 575 square miles is land and 1 square mile is water.
The county is mostly flat, with some rolling hills in the western part of the county. The county is drained by the Big Blue River, which flows through the county from north to south.
Economy
The economy of York County is largely based on agriculture. The county is home to a variety of crops, including corn, soybeans, wheat, and hay. Livestock production is also important to the county's economy, with beef cattle, dairy cattle, and hogs being the most common.
The county is also home to several manufacturing companies, including a furniture manufacturer, a plastics manufacturer, and a metal fabrication company.
Demographics
As of the 2010 census, there were 13,665 people, 5,093 households, and 3,541 families living in the county. The population density was 24 people per square mile. There were 5,541 housing units at an average density of 10 per square mile.
The racial makeup of the county was 97.2% White, 0.4% Black or African American, 0.3% Native American, 0.3% Asian, 0.1% Pacific Islander, 0.7% from other races, and 0.9% from two or more races. Hispanic or Latino of any race were 2.2% of the population.
There were 5,093 households, out of which 33.2% had children under the age of 18 living with them, 57.2% were married couples living together, 8.2% had a female householder with no husband present, and 30.3% were non-families. 25.7% of all households were made up of individuals, and 11.7% had someone living alone who was 65 years of age or older. The average household size was 2.56 and the average family size was 3.09.
In the county, the population was spread out, with 26.2% under the age of 18, 6.7% from 18 to 24, 25.7% from 25 to 44, 24.3% from 45 to 64, and 17.1% who were 65 years of age or older. The median age was 39 years. For every 100 females, there were 97.2 males. For every 100 females age 18 and over, there were 94.2 males.
The median income for a household in the county was $45,845, and the median income for a family was $54,845. Males had a median income of $37,917 versus $25,917 for females. The per capita income for the county was $21,845. About 5.2% of families and 7.2% of the population were below the poverty line, including 8.2% of those under age 18 and 8.2% of those age 65 or over.
Common Questions
What is the Total Population of York County?
Total Population of York County is 14,212.
What is the Total Male Population of York County?
Total Male Population of York County is 7,105.
What is the Total Female Population of York County?
Total Female Population of York County is 7,107.
What is the Ratio of Males per 100 Females in York County?
There are 99.97 Males per 100 Females in York County.
What is the Ratio of Females per 100 Males in York County?
There are 100.03 Females per 100 Males in York County.
What is the Median Population Age in York County?
Median Population Age in York County is 39.5 Years.
What is the Average Family Size in York County
Average Family Size in York County is 3.0 People.
What is the Average Household Size in York County
Average Household Size in York County is 2.4 People.
What is Per Capita Income in York County?
Per Capita income in York County is $39,507.
What is the Median Family Income in York County?
Median Family Income in York County is $85,702.
What is the Median Household income in York County?
Median Household Income in York County is $72,914.
What is Income or Wage Gap in York County?
Income or Wage Gap in York County is 48.6%.
Women in York County earn 51.4 cents for every dollar earned by a man.
What is Family Income Deficit in York County?
Family Income Deficit in York County is $9,149.
Families that are below poverty line in York County earn $9,149 less on average than the poverty threshold level.
What is Inequality or Gini Index in York County?
Inequality or Gini Index in York County is 0.47.
How Large is the Labor Force in York County?
There are 7,170 People in the Labor Forcein in York County.
What is the Percentage of People in the Labor Force in York County?
63.6% of People are in the Labor Force in York County.
What is the Unemployment Rate in York County?
Unemployment Rate in York County is 2.8%.