Washington County, NE
Washington County Map
Washington County Overview
20,884
TOTAL POPULATION
10,389
MALE POPULATION
10,495
FEMALE POPULATION
98.99
MALES / 100 FEMALES
101.02
FEMALES / 100 MALES
41.6
MEDIAN AGE
3.0
AVG FAMILY SIZE
2.5
AVG HOUSEHOLD SIZE
$44,206
PER CAPITA INCOME
$115,919
AVG FAMILY INCOME
$89,671
AVG HOUSEHOLD INCOME
39.8%
WAGE / INCOME GAP [ % ]
60.2¢/ $1
WAGE / INCOME GAP [ $ ]
0.41
INEQUALITY / GINI INDEX
11,294
LABOR FORCE [ PEOPLE ]
68.1%
PERCENT IN LABOR FORCE
2.0%
UNEMPLOYMENT RATE
Washington County Area Codes
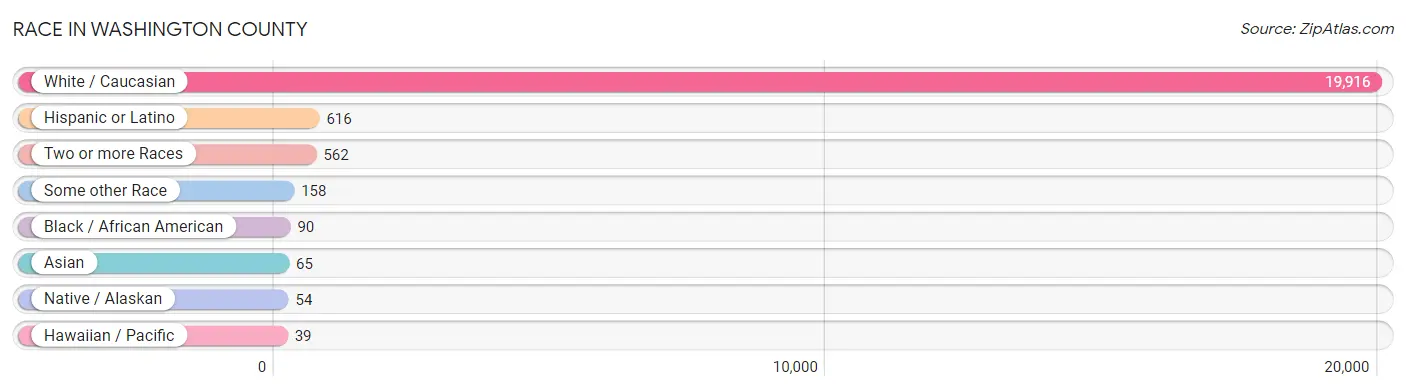
Race in Washington County
The most populous races in Washington County are White / Caucasian (19,916 | 95.4%), Hispanic or Latino (616 | 2.9%), and Two or more Races (562 | 2.7%).
| Race | # Population | % Population |
| Asian | 65 | 0.3% |
| Black / African American | 90 | 0.4% |
| Hawaiian / Pacific | 39 | 0.2% |
| Hispanic or Latino | 616 | 2.9% |
| Native / Alaskan | 54 | 0.3% |
| White / Caucasian | 19,916 | 95.4% |
| Two or more Races | 562 | 2.7% |
| Some other Race | 158 | 0.8% |
| Total | 20,884 | 100.0% |
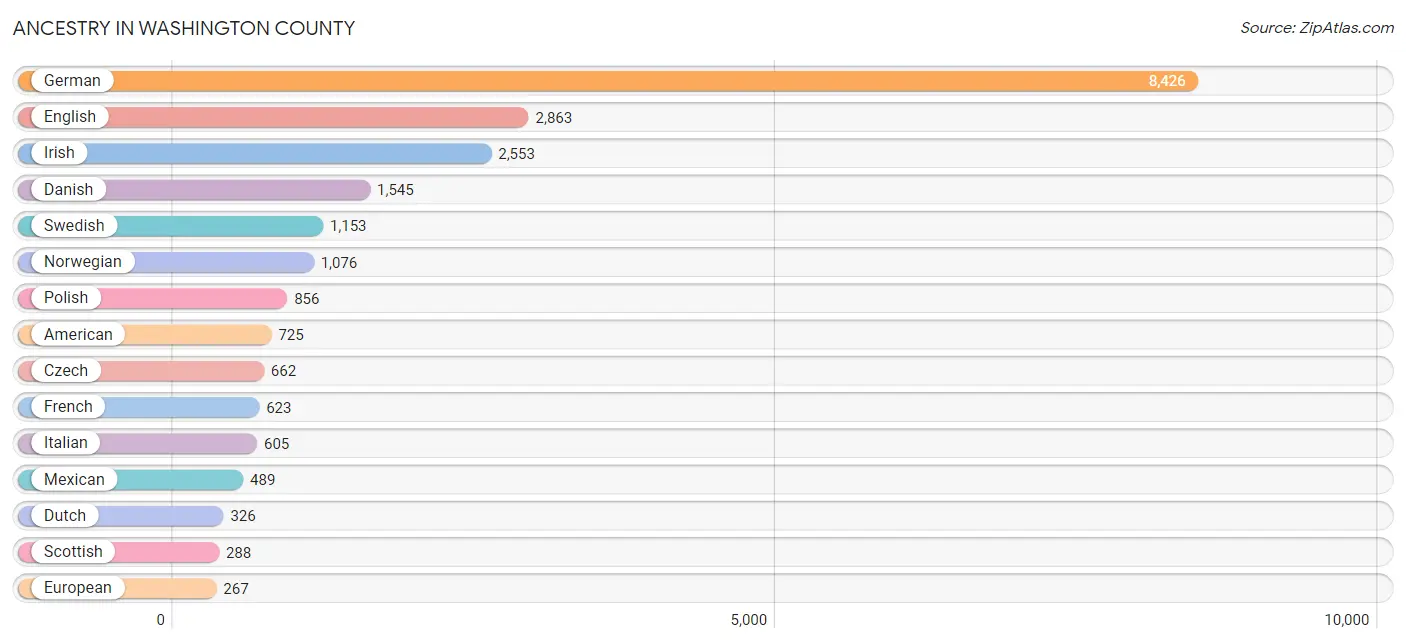
Ancestry in Washington County
The most populous ancestries reported in Washington County are German (8,426 | 40.4%), English (2,863 | 13.7%), Irish (2,553 | 12.2%), Danish (1,545 | 7.4%), and Swedish (1,153 | 5.5%), together accounting for 79.2% of all Washington County residents.
| Ancestry | # Population | % Population |
| American | 725 | 3.5% |
| Arab | 27 | 0.1% |
| Australian | 3 | 0.0% |
| Austrian | 36 | 0.2% |
| Basque | 9 | 0.0% |
| Belgian | 23 | 0.1% |
| Bhutanese | 7 | 0.0% |
| Blackfeet | 22 | 0.1% |
| Brazilian | 12 | 0.1% |
| British | 80 | 0.4% |
| Burmese | 50 | 0.2% |
| Central American | 103 | 0.5% |
| Central American Indian | 7 | 0.0% |
| Cherokee | 30 | 0.1% |
| Choctaw | 7 | 0.0% |
| Costa Rican | 85 | 0.4% |
| Creek | 5 | 0.0% |
| Croatian | 20 | 0.1% |
| Czech | 662 | 3.2% |
| Czechoslovakian | 51 | 0.2% |
| Danish | 1,545 | 7.4% |
| Dutch | 326 | 1.6% |
| Eastern European | 33 | 0.2% |
| English | 2,863 | 13.7% |
| European | 267 | 1.3% |
| Finnish | 10 | 0.1% |
| French | 623 | 3.0% |
| French Canadian | 35 | 0.2% |
| German | 8,426 | 40.4% |
| Greek | 166 | 0.8% |
| Guatemalan | 11 | 0.1% |
| Hungarian | 15 | 0.1% |
| Indian (Asian) | 21 | 0.1% |
| Irish | 2,553 | 12.2% |
| Italian | 605 | 2.9% |
| Laotian | 14 | 0.1% |
| Latvian | 14 | 0.1% |
| Lebanese | 27 | 0.1% |
| Lithuanian | 40 | 0.2% |
| Malaysian | 17 | 0.1% |
| Mexican | 489 | 2.3% |
| Mexican American Indian | 7 | 0.0% |
| Native Hawaiian | 39 | 0.2% |
| Northern European | 83 | 0.4% |
| Norwegian | 1,076 | 5.1% |
| Panamanian | 1 | 0.0% |
| Pennsylvania German | 22 | 0.1% |
| Polish | 856 | 4.1% |
| Romanian | 28 | 0.1% |
| Russian | 66 | 0.3% |
| Salvadoran | 6 | 0.0% |
| Scandinavian | 77 | 0.4% |
| Scotch-Irish | 157 | 0.7% |
| Scottish | 288 | 1.4% |
| Serbian | 168 | 0.8% |
| Sioux | 23 | 0.1% |
| Slovak | 69 | 0.3% |
| Slovene | 20 | 0.1% |
| Sri Lankan | 14 | 0.1% |
| Swedish | 1,153 | 5.5% |
| Swiss | 64 | 0.3% |
| Ukrainian | 28 | 0.1% |
| Welsh | 111 | 0.5% | View All 63 Rows |
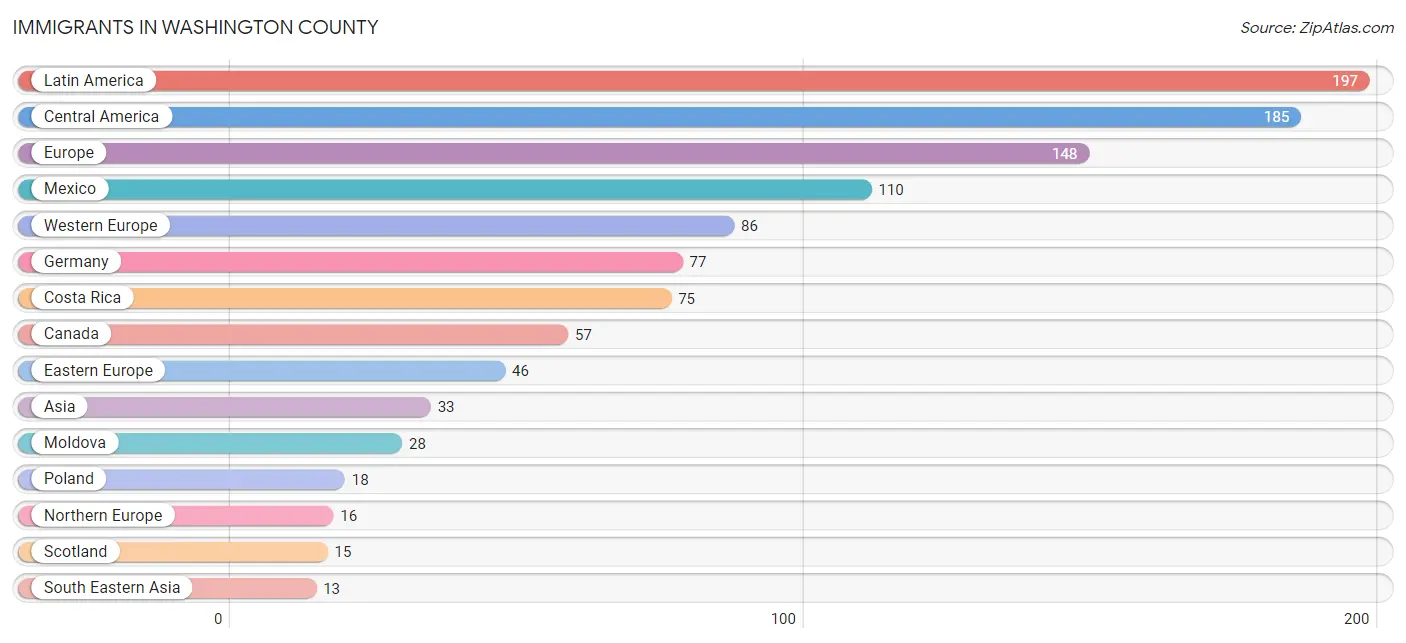
Immigrants in Washington County
The most numerous immigrant groups reported in Washington County came from Latin America (197 | 0.9%), Central America (185 | 0.9%), Europe (148 | 0.7%), Mexico (110 | 0.5%), and Western Europe (86 | 0.4%), together accounting for 3.5% of all Washington County residents.
| Immigration Origin | # Population | % Population |
| Africa | 4 | 0.0% |
| Asia | 33 | 0.2% |
| Brazil | 12 | 0.1% |
| Canada | 57 | 0.3% |
| Central America | 185 | 0.9% |
| Costa Rica | 75 | 0.4% |
| Eastern Asia | 7 | 0.0% |
| Eastern Europe | 46 | 0.2% |
| England | 1 | 0.0% |
| Europe | 148 | 0.7% |
| Germany | 77 | 0.4% |
| Indonesia | 5 | 0.0% |
| Japan | 7 | 0.0% |
| Kazakhstan | 10 | 0.1% |
| Laos | 8 | 0.0% |
| Latin America | 197 | 0.9% |
| Lebanon | 3 | 0.0% |
| Mexico | 110 | 0.5% |
| Moldova | 28 | 0.1% |
| Netherlands | 9 | 0.0% |
| Northern Europe | 16 | 0.1% |
| Poland | 18 | 0.1% |
| Scotland | 15 | 0.1% |
| South Africa | 4 | 0.0% |
| South America | 12 | 0.1% |
| South Central Asia | 10 | 0.1% |
| South Eastern Asia | 13 | 0.1% |
| Western Asia | 3 | 0.0% |
| Western Europe | 86 | 0.4% | View All 29 Rows |
Sex and Age in Washington County
Sex and Age in Washington County
The most populous age groups in Washington County are 55 to 59 Years (924 | 8.9%) for men and 10 to 14 Years (822 | 7.8%) for women.
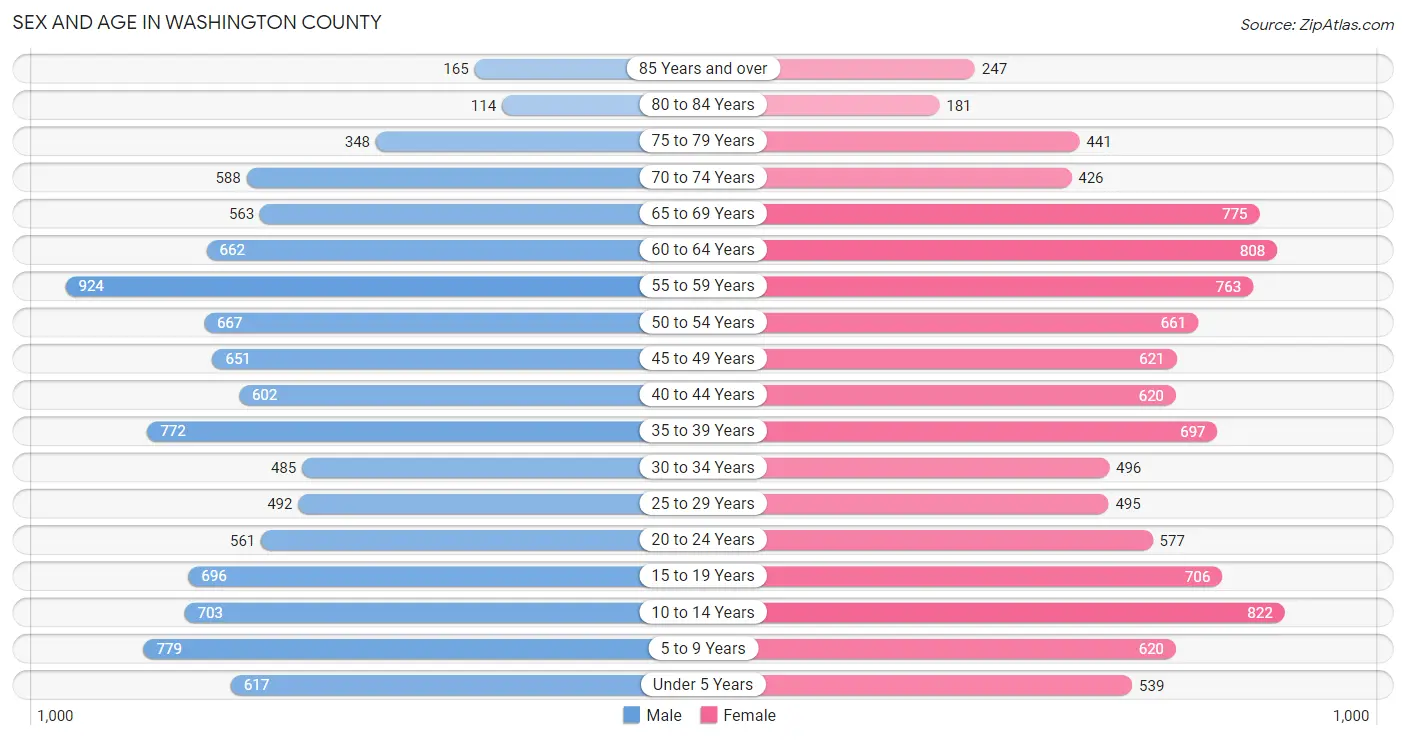
| Age Bracket | Male | Female |
| Under 5 Years | 617 (5.9%) | 539 (5.1%) |
| 5 to 9 Years | 779 (7.5%) | 620 (5.9%) |
| 10 to 14 Years | 703 (6.8%) | 822 (7.8%) |
| 15 to 19 Years | 696 (6.7%) | 706 (6.7%) |
| 20 to 24 Years | 561 (5.4%) | 577 (5.5%) |
| 25 to 29 Years | 492 (4.7%) | 495 (4.7%) |
| 30 to 34 Years | 485 (4.7%) | 496 (4.7%) |
| 35 to 39 Years | 772 (7.4%) | 697 (6.6%) |
| 40 to 44 Years | 602 (5.8%) | 620 (5.9%) |
| 45 to 49 Years | 651 (6.3%) | 621 (5.9%) |
| 50 to 54 Years | 667 (6.4%) | 661 (6.3%) |
| 55 to 59 Years | 924 (8.9%) | 763 (7.3%) |
| 60 to 64 Years | 662 (6.4%) | 808 (7.7%) |
| 65 to 69 Years | 563 (5.4%) | 775 (7.4%) |
| 70 to 74 Years | 588 (5.7%) | 426 (4.1%) |
| 75 to 79 Years | 348 (3.4%) | 441 (4.2%) |
| 80 to 84 Years | 114 (1.1%) | 181 (1.7%) |
| 85 Years and over | 165 (1.6%) | 247 (2.4%) |
| Total | 10,389 (100.0%) | 10,495 (100.0%) |
Families and Households in Washington County
Median Family Size in Washington County
The median family size in Washington County is 3.05 persons per family, with married-couple families (4,851 | 86.1%) accounting for the largest median family size of 3.14 persons per family. On the other hand, single male/father families (217 | 3.8%) represent the smallest median family size with 2.00 persons per family.
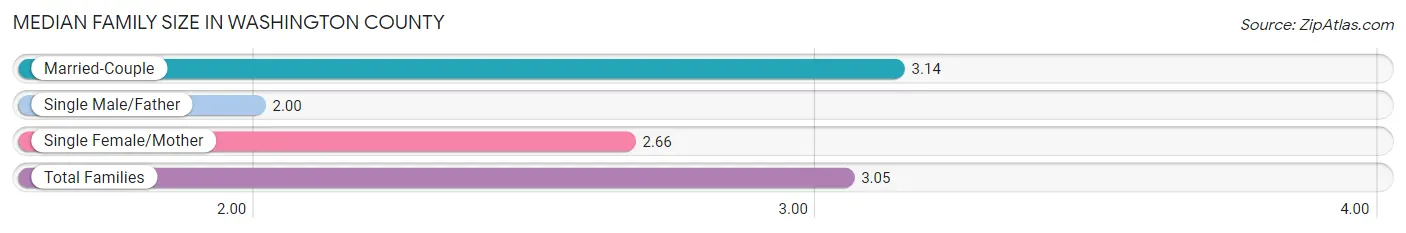
| Family Type | # Families | Family Size |
| Married-Couple | 4,851 (86.1%) | 3.14 |
| Single Male/Father | 217 (3.8%) | 2.00 |
| Single Female/Mother | 566 (10.1%) | 2.66 |
| Total Families | 5,634 (100.0%) | 3.05 |
Median Household Size in Washington County
The median household size in Washington County is 2.51 persons per household, with married-couple households (4,851 | 58.9%) accounting for the largest median household size of 3.15 persons per household. non-family households (2,600 | 31.6%) represent the smallest median household size with 1.27 persons per household.
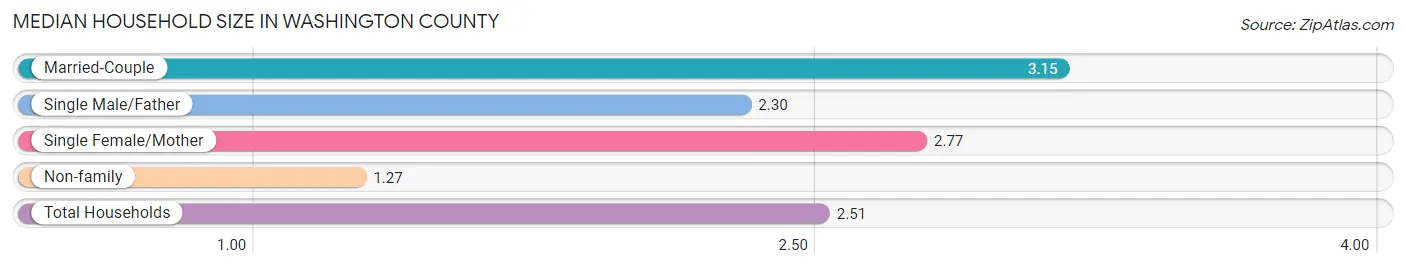
| Household Type | # Households | Household Size |
| Married-Couple | 4,851 (58.9%) | 3.15 |
| Single Male/Father | 217 (2.6%) | 2.30 |
| Single Female/Mother | 566 (6.9%) | 2.77 |
| Non-family | 2,600 (31.6%) | 1.27 |
| Total Households | 8,234 (100.0%) | 2.51 |
Household Size by Marriage Status in Washington County
Out of a total of 8,234 households in Washington County, 5,634 (68.4%) are family households, while 2,600 (31.6%) are nonfamily households. The most numerous type of family households are 2-person households, comprising 2,928, and the most common type of nonfamily households are 1-person households, comprising 2,078.
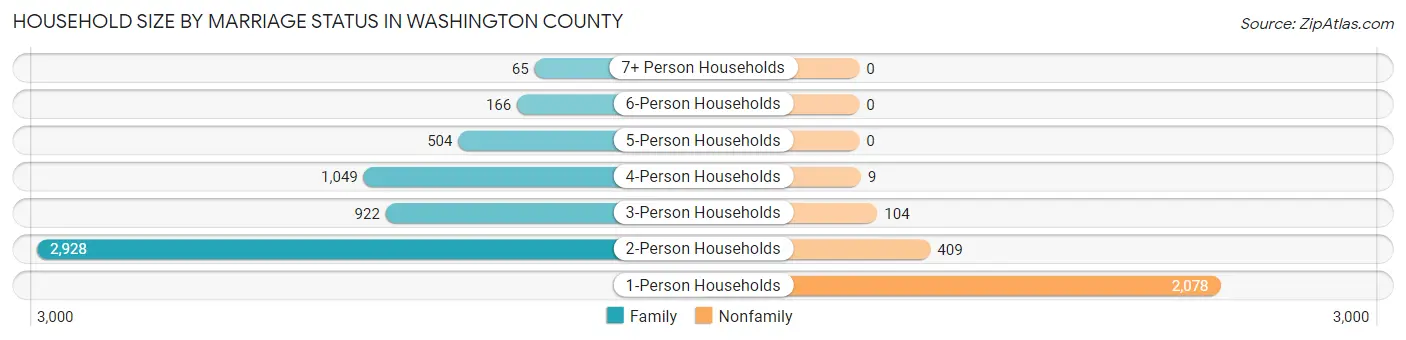
| Household Size | Family Households | Nonfamily Households |
| 1-Person Households | - | 2,078 (25.2%) |
| 2-Person Households | 2,928 (35.6%) | 409 (5.0%) |
| 3-Person Households | 922 (11.2%) | 104 (1.3%) |
| 4-Person Households | 1,049 (12.7%) | 9 (0.1%) |
| 5-Person Households | 504 (6.1%) | 0 (0.0%) |
| 6-Person Households | 166 (2.0%) | 0 (0.0%) |
| 7+ Person Households | 65 (0.8%) | 0 (0.0%) |
| Total | 5,634 (68.4%) | 2,600 (31.6%) |
Female Fertility in Washington County
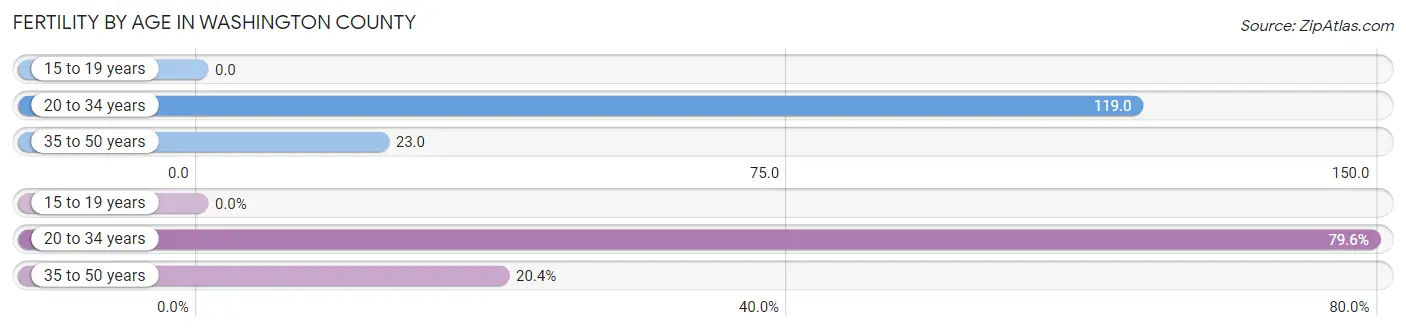
Fertility by Age in Washington County
Average fertility rate in Washington County is 54.0 births per 1,000 women. Women in the age bracket of 20 to 34 years have the highest fertility rate with 119.0 births per 1,000 women. Women in the age bracket of 20 to 34 years acount for 79.6% of all women with births.
| Age Bracket | Women with Births | Births / 1,000 Women |
| 15 to 19 years | 0 (0.0%) | 0.0 |
| 20 to 34 years | 187 (79.6%) | 119.0 |
| 35 to 50 years | 48 (20.4%) | 23.0 |
| Total | 235 (100.0%) | 54.0 |
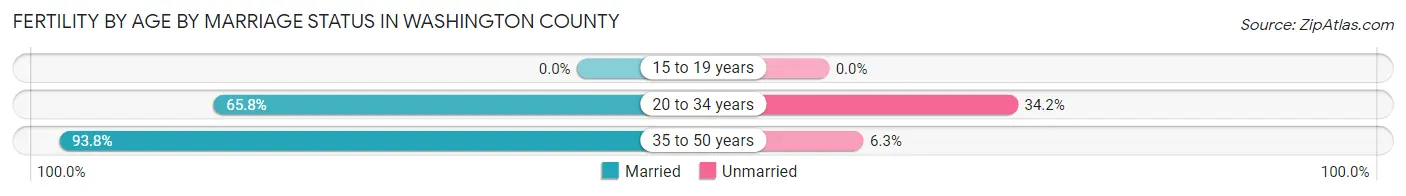
Fertility by Age by Marriage Status in Washington County
71.5% of women with births (235) in Washington County are married. The highest percentage of unmarried women with births falls into 20 to 34 years age bracket with 34.2% of them unmarried at the time of birth, while the lowest percentage of unmarried women with births belong to 35 to 50 years age bracket with 6.2% of them unmarried.
| Age Bracket | Married | Unmarried |
| 15 to 19 years | 0 (0.0%) | 0 (0.0%) |
| 20 to 34 years | 123 (65.8%) | 64 (34.2%) |
| 35 to 50 years | 45 (93.8%) | 3 (6.2%) |
| Total | 168 (71.5%) | 67 (28.5%) |
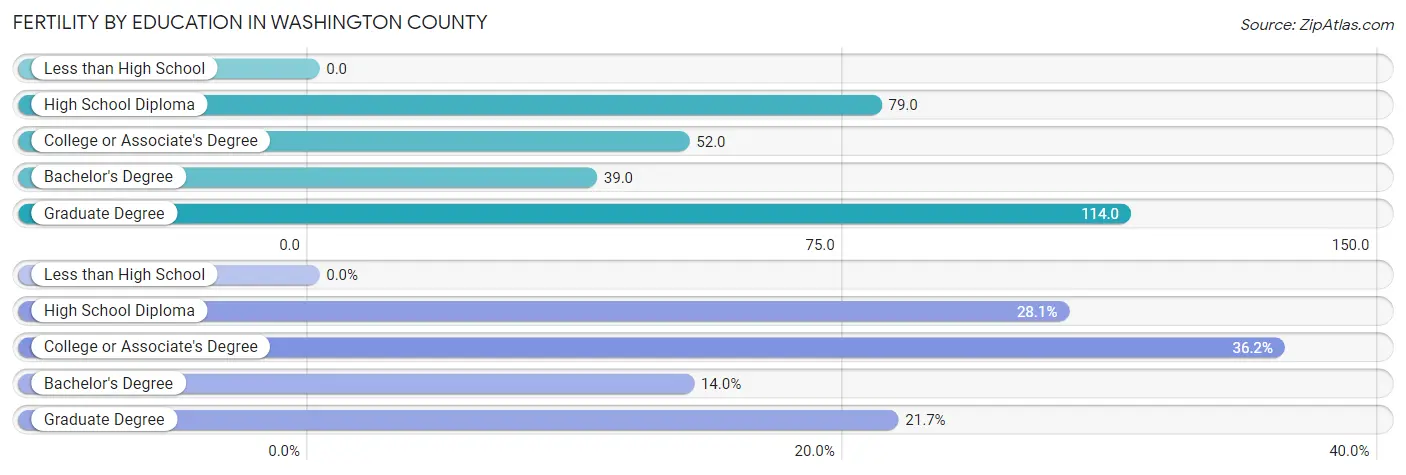
Fertility by Education in Washington County
| Educational Attainment | Women with Births | Births / 1,000 Women |
| Less than High School | 0 (0.0%) | 0.0 |
| High School Diploma | 66 (28.1%) | 79.0 |
| College or Associate's Degree | 85 (36.2%) | 52.0 |
| Bachelor's Degree | 33 (14.0%) | 39.0 |
| Graduate Degree | 51 (21.7%) | 114.0 |
| Total | 235 (100.0%) | 54.0 |
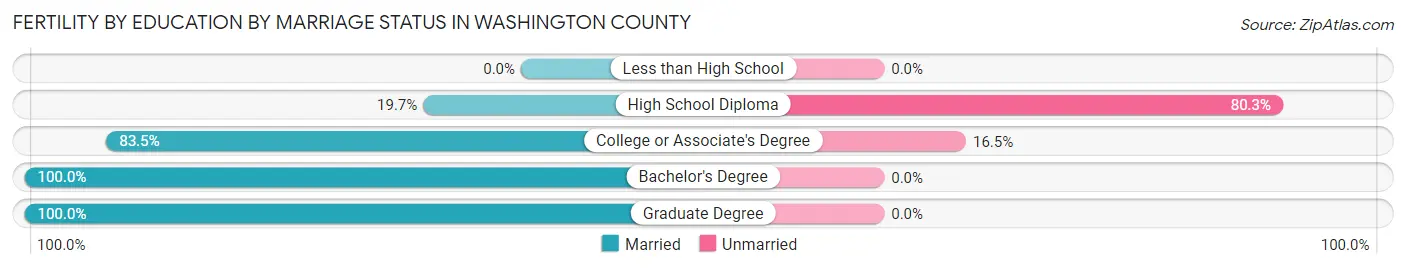
Fertility by Education by Marriage Status in Washington County
28.5% of women with births in Washington County are unmarried. Women with the educational attainment of bachelor's degree are most likely to be married with 100.0% of them married at childbirth, while women with the educational attainment of high school diploma are least likely to be married with 80.3% of them unmarried at childbirth.
| Educational Attainment | Married | Unmarried |
| Less than High School | 0 (0.0%) | 0 (0.0%) |
| High School Diploma | 13 (19.7%) | 53 (80.3%) |
| College or Associate's Degree | 71 (83.5%) | 14 (16.5%) |
| Bachelor's Degree | 33 (100.0%) | 0 (0.0%) |
| Graduate Degree | 51 (100.0%) | 0 (0.0%) |
| Total | 168 (71.5%) | 67 (28.5%) |
Income in Washington County
Income Overview in Washington County
Per Capita Income in Washington County is $44,206, while median incomes of families and households are $115,919 and $89,671 respectively.
| Characteristic | Number | Measure |
| Per Capita Income | 20,884 | $44,206 |
| Median Family Income | 5,634 | $115,919 |
| Mean Family Income | 5,634 | $128,691 |
| Median Household Income | 8,234 | $89,671 |
| Mean Household Income | 8,234 | $109,024 |
| Income Deficit | 5,634 | $0 |
| Wage / Income Gap (%) | 20,884 | 39.84% |
| Wage / Income Gap ($) | 20,884 | 60.16¢ per $1 |
| Gini / Inequality Index | 20,884 | 0.41 |
Earnings by Sex in Washington County
Average Earnings in Washington County are $51,137, $64,704 for men and $38,923 for women, a difference of 39.8%.
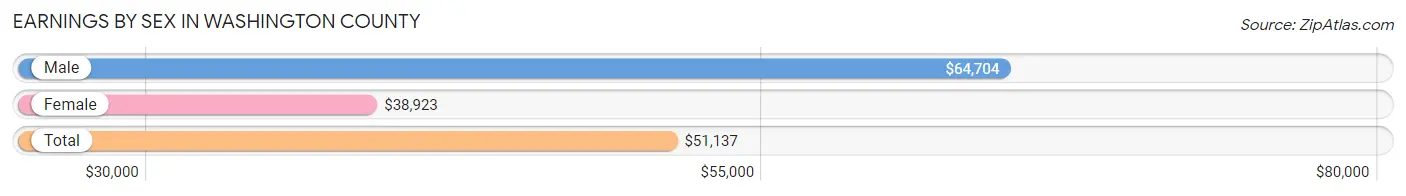
| Sex | Number | Average Earnings |
| Male | 6,332 (52.5%) | $64,704 |
| Female | 5,730 (47.5%) | $38,923 |
| Total | 12,062 (100.0%) | $51,137 |
Earnings by Sex by Income Bracket in Washington County
The most common earnings brackets in Washington County are $100,000+ for men (1,497 | 23.6%) and $55,000 to $64,999 for women (599 | 10.4%).
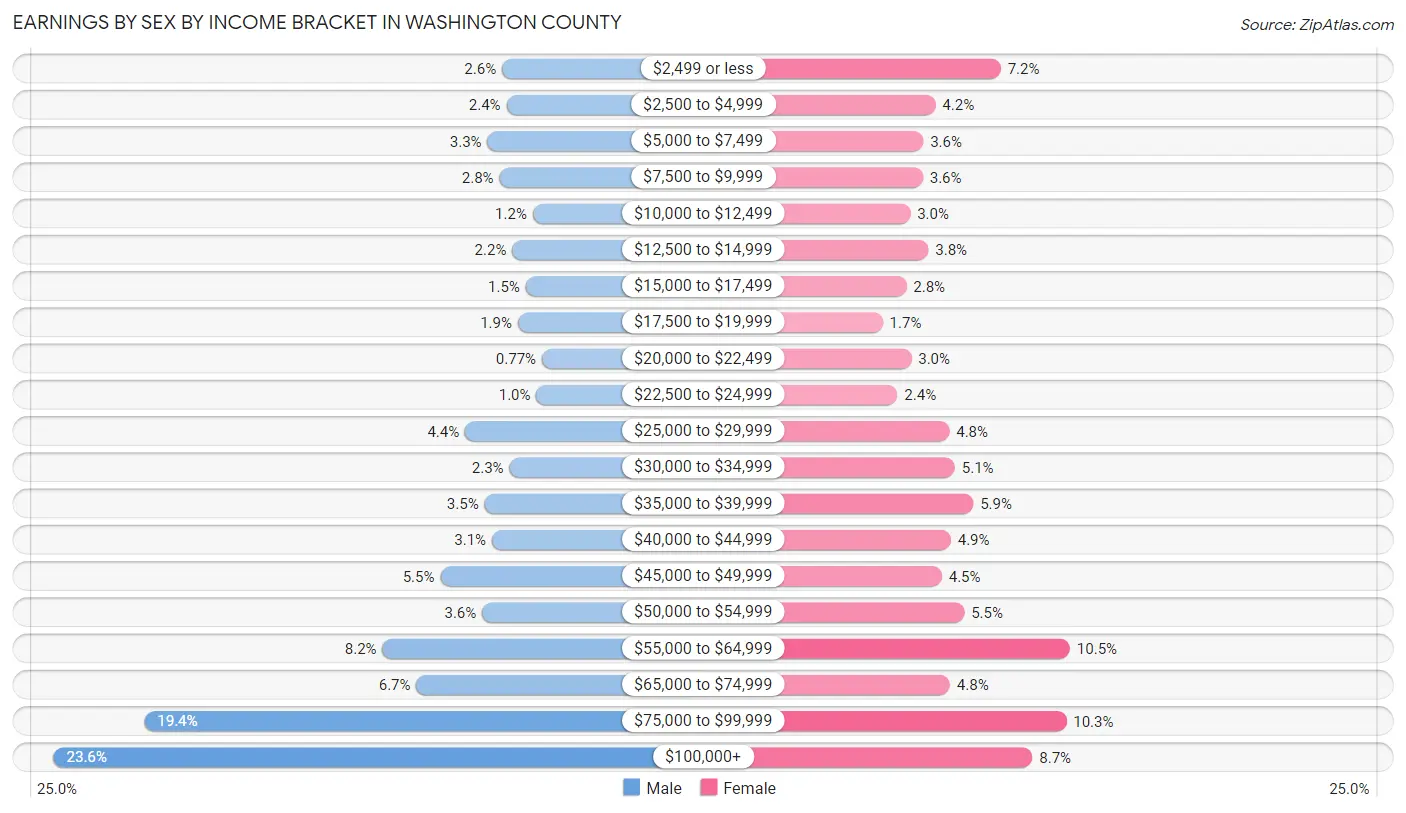
| Income | Male | Female |
| $2,499 or less | 167 (2.6%) | 413 (7.2%) |
| $2,500 to $4,999 | 154 (2.4%) | 238 (4.2%) |
| $5,000 to $7,499 | 210 (3.3%) | 205 (3.6%) |
| $7,500 to $9,999 | 175 (2.8%) | 204 (3.6%) |
| $10,000 to $12,499 | 76 (1.2%) | 170 (3.0%) |
| $12,500 to $14,999 | 137 (2.2%) | 219 (3.8%) |
| $15,000 to $17,499 | 97 (1.5%) | 160 (2.8%) |
| $17,500 to $19,999 | 120 (1.9%) | 96 (1.7%) |
| $20,000 to $22,499 | 49 (0.8%) | 173 (3.0%) |
| $22,500 to $24,999 | 65 (1.0%) | 136 (2.4%) |
| $25,000 to $29,999 | 277 (4.4%) | 275 (4.8%) |
| $30,000 to $34,999 | 145 (2.3%) | 290 (5.1%) |
| $35,000 to $39,999 | 219 (3.5%) | 339 (5.9%) |
| $40,000 to $44,999 | 197 (3.1%) | 279 (4.9%) |
| $45,000 to $49,999 | 350 (5.5%) | 255 (4.4%) |
| $50,000 to $54,999 | 226 (3.6%) | 315 (5.5%) |
| $55,000 to $64,999 | 522 (8.2%) | 599 (10.4%) |
| $65,000 to $74,999 | 421 (6.7%) | 277 (4.8%) |
| $75,000 to $99,999 | 1,228 (19.4%) | 589 (10.3%) |
| $100,000+ | 1,497 (23.6%) | 498 (8.7%) |
| Total | 6,332 (100.0%) | 5,730 (100.0%) |
Earnings by Sex by Educational Attainment in Washington County
Average earnings in Washington County are $75,420 for men and $46,914 for women, a difference of 37.8%. Men with an educational attainment of bachelor's degree enjoy the highest average annual earnings of $102,386, while those with college or associate's degree education earn the least with $63,769. Women with an educational attainment of graduate degree earn the most with the average annual earnings of $85,456, while those with less than high school education have the smallest earnings of $26,875.
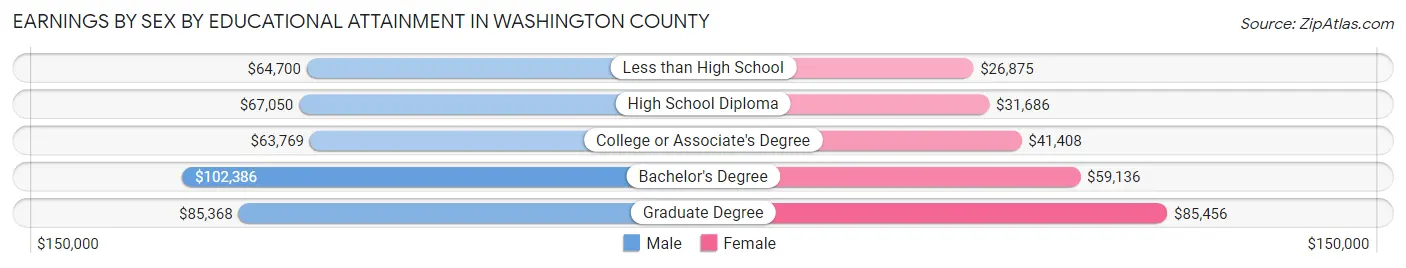
| Educational Attainment | Male Income | Female Income |
| Less than High School | $64,700 | $26,875 |
| High School Diploma | $67,050 | $31,686 |
| College or Associate's Degree | $63,769 | $41,408 |
| Bachelor's Degree | $102,386 | $59,136 |
| Graduate Degree | $85,368 | $85,456 |
| Total | $75,420 | $46,914 |
Family Income in Washington County
Family Income Brackets in Washington County
According to the Washington County family income data, there are 1,561 families falling into the $100,000 to $149,999 income range, which is the most common income bracket and makes up 27.7% of all families. Conversely, the $10,000 to $14,999 income bracket is the least frequent group with only 85 families (1.5%) belonging to this category.
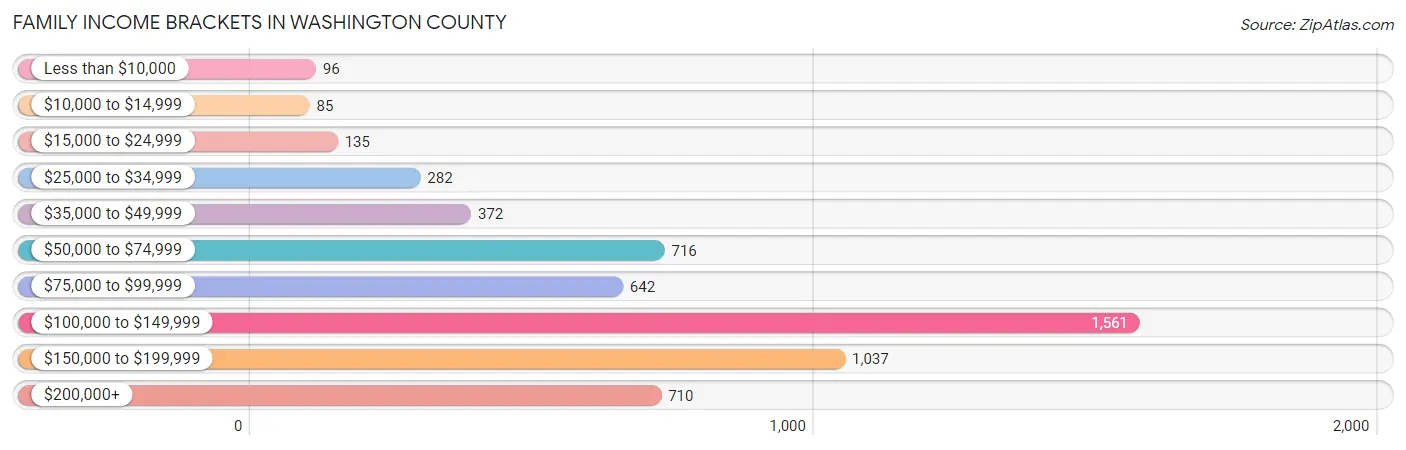
| Income Bracket | # Families | % Families |
| Less than $10,000 | 96 | 1.7% |
| $10,000 to $14,999 | 85 | 1.5% |
| $15,000 to $24,999 | 135 | 2.4% |
| $25,000 to $34,999 | 282 | 5.0% |
| $35,000 to $49,999 | 372 | 6.6% |
| $50,000 to $74,999 | 716 | 12.7% |
| $75,000 to $99,999 | 642 | 11.4% |
| $100,000 to $149,999 | 1,561 | 27.7% |
| $150,000 to $199,999 | 1,037 | 18.4% |
| $200,000+ | 710 | 12.6% |
Family Income by Famaliy Size in Washington County
5-person families (507 | 9.0%) account for the highest median family income in Washington County with $145,195 per family, while 2-person families (3,073 | 54.5%) have the highest median income of $46,538 per family member.
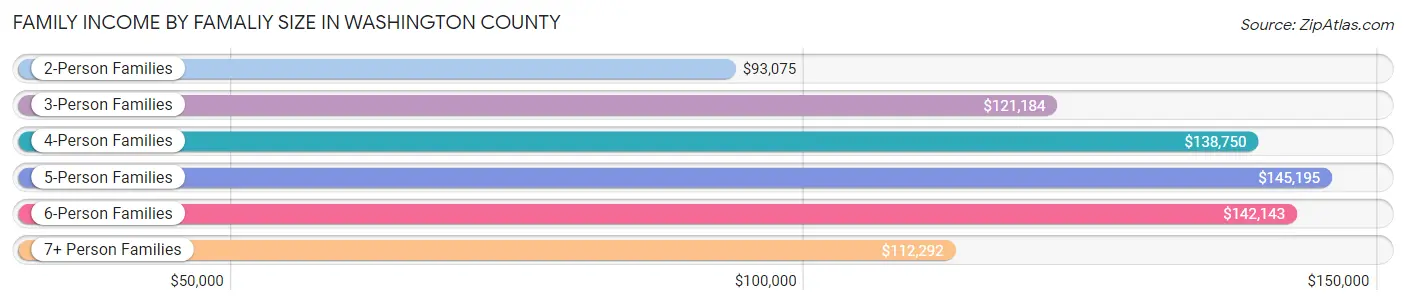
| Income Bracket | # Families | Median Income |
| 2-Person Families | 3,073 (54.5%) | $93,075 |
| 3-Person Families | 860 (15.3%) | $121,184 |
| 4-Person Families | 969 (17.2%) | $138,750 |
| 5-Person Families | 507 (9.0%) | $145,195 |
| 6-Person Families | 160 (2.8%) | $142,143 |
| 7+ Person Families | 65 (1.1%) | $112,292 |
| Total | 5,634 (100.0%) | $115,919 |
Family Income by Number of Earners in Washington County
The median family income in Washington County is $115,919, with families comprising 3+ earners (691) having the highest median family income of $150,439, while families with no earners (721) have the lowest median family income of $52,875, accounting for 12.3% and 12.8% of families, respectively.
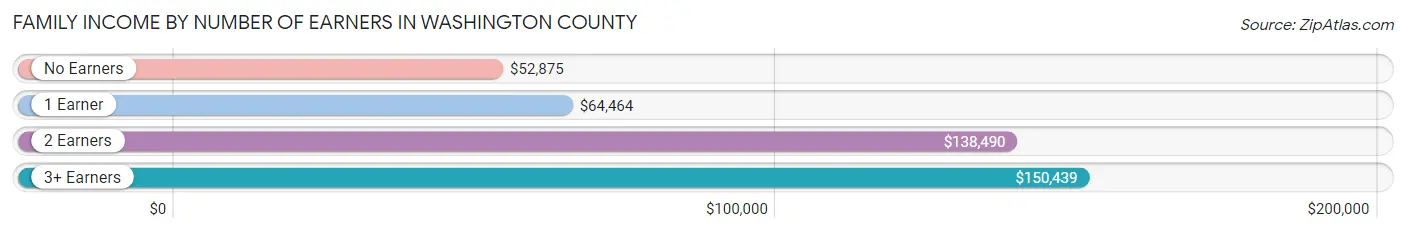
| Number of Earners | # Families | Median Income |
| No Earners | 721 (12.8%) | $52,875 |
| 1 Earner | 1,573 (27.9%) | $64,464 |
| 2 Earners | 2,649 (47.0%) | $138,490 |
| 3+ Earners | 691 (12.3%) | $150,439 |
| Total | 5,634 (100.0%) | $115,919 |
Household Income in Washington County
Household Income Brackets in Washington County
With 1,927 households falling in the category, the $100,000 to $149,999 income range is the most frequent in Washington County, accounting for 23.4% of all households. In contrast, only 189 households (2.3%) fall into the less than $10,000 income bracket, making it the least populous group.
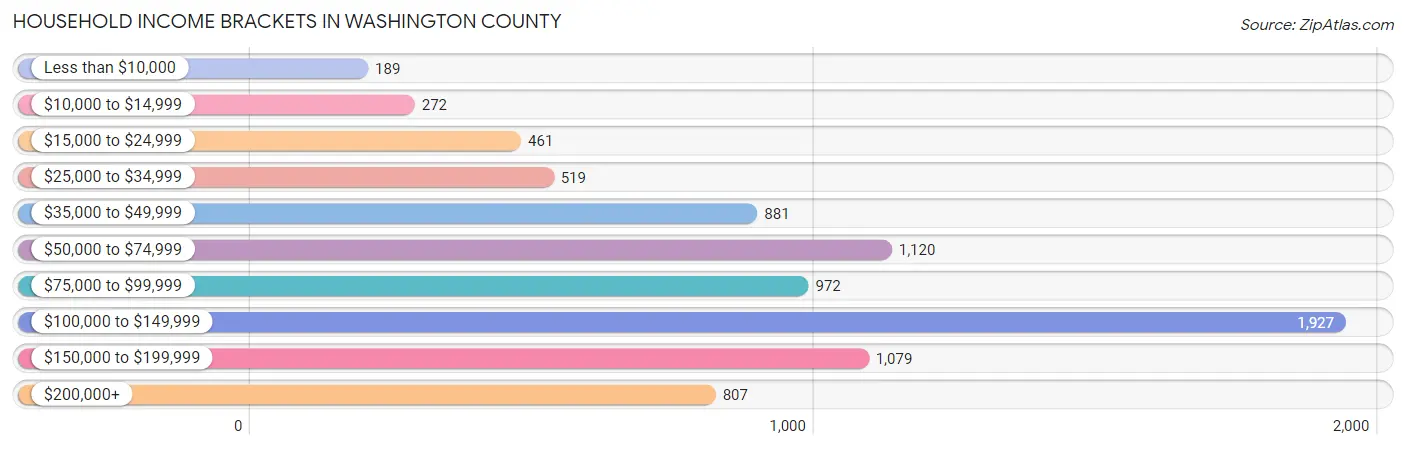
| Income Bracket | # Households | % Households |
| Less than $10,000 | 189 | 2.3% |
| $10,000 to $14,999 | 272 | 3.3% |
| $15,000 to $24,999 | 461 | 5.6% |
| $25,000 to $34,999 | 519 | 6.3% |
| $35,000 to $49,999 | 881 | 10.7% |
| $50,000 to $74,999 | 1,120 | 13.6% |
| $75,000 to $99,999 | 972 | 11.8% |
| $100,000 to $149,999 | 1,927 | 23.4% |
| $150,000 to $199,999 | 1,079 | 13.1% |
| $200,000+ | 807 | 9.8% |
Household Income by Householder Age in Washington County
The median household income in Washington County is $89,671, with the highest median household income of $116,563 found in the 25 to 44 years age bracket for the primary householder. A total of 2,309 households (28.0%) fall into this category. Meanwhile, the 65+ years age bracket for the primary householder has the lowest median household income of $47,216, with 2,289 households (27.8%) in this group.
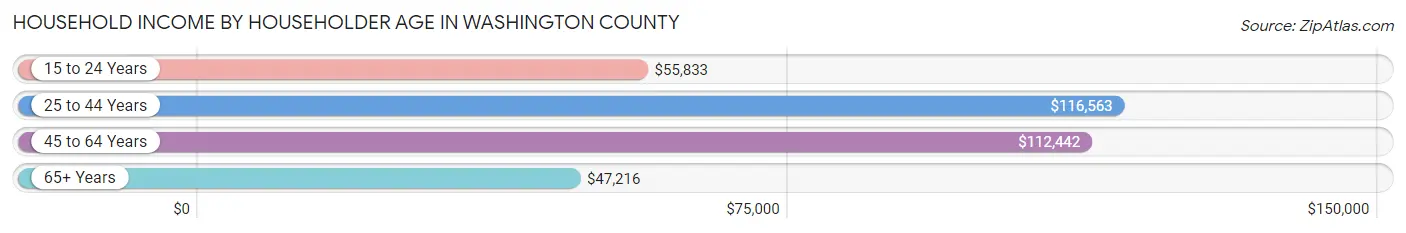
| Income Bracket | # Households | Median Income |
| 15 to 24 Years | 312 (3.8%) | $55,833 |
| 25 to 44 Years | 2,309 (28.0%) | $116,563 |
| 45 to 64 Years | 3,324 (40.4%) | $112,442 |
| 65+ Years | 2,289 (27.8%) | $47,216 |
| Total | 8,234 (100.0%) | $89,671 |
Poverty in Washington County
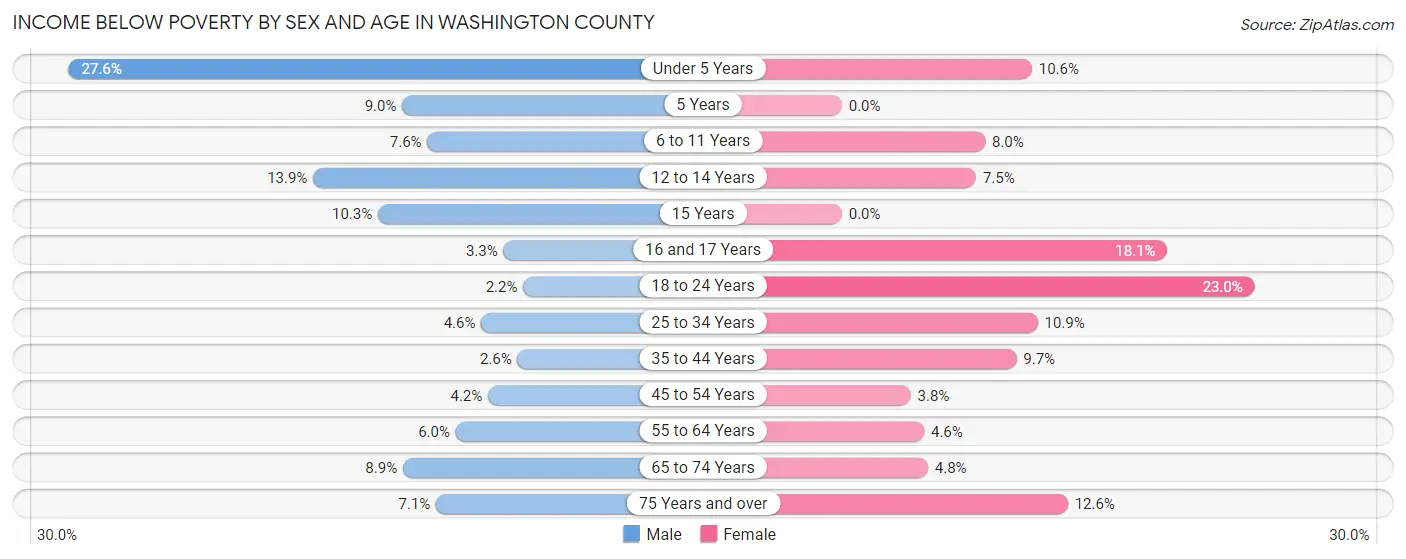
Income Below Poverty by Sex and Age in Washington County
With 7.0% poverty level for males and 8.9% for females among the residents of Washington County, under 5 year old males and 18 to 24 year old females are the most vulnerable to poverty, with 170 males (27.6%) and 177 females (23.0%) in their respective age groups living below the poverty level.
| Age Bracket | Male | Female |
| Under 5 Years | 170 (27.6%) | 57 (10.6%) |
| 5 Years | 13 (9.0%) | 0 (0.0%) |
| 6 to 11 Years | 73 (7.6%) | 73 (8.0%) |
| 12 to 14 Years | 50 (13.9%) | 34 (7.5%) |
| 15 Years | 13 (10.3%) | 0 (0.0%) |
| 16 and 17 Years | 11 (3.3%) | 68 (18.1%) |
| 18 to 24 Years | 17 (2.2%) | 177 (23.0%) |
| 25 to 34 Years | 44 (4.6%) | 108 (10.9%) |
| 35 to 44 Years | 35 (2.5%) | 128 (9.7%) |
| 45 to 54 Years | 55 (4.2%) | 49 (3.8%) |
| 55 to 64 Years | 95 (6.0%) | 72 (4.6%) |
| 65 to 74 Years | 102 (8.9%) | 56 (4.8%) |
| 75 Years and over | 43 (7.1%) | 101 (12.6%) |
| Total | 721 (7.0%) | 923 (8.9%) |
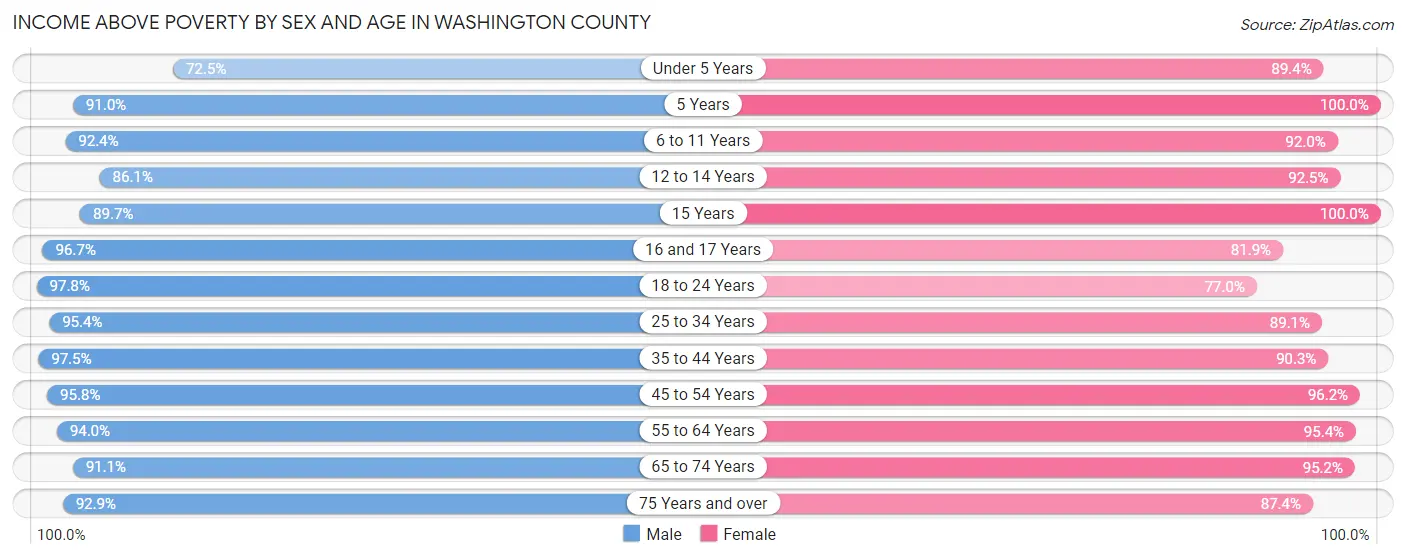
Income Above Poverty by Sex and Age in Washington County
According to the poverty statistics in Washington County, males aged 18 to 24 years and females aged 5 years are the age groups that are most secure financially, with 97.8% of males and 100.0% of females in these age groups living above the poverty line.
| Age Bracket | Male | Female |
| Under 5 Years | 447 (72.5%) | 482 (89.4%) |
| 5 Years | 132 (91.0%) | 67 (100.0%) |
| 6 to 11 Years | 891 (92.4%) | 843 (92.0%) |
| 12 to 14 Years | 309 (86.1%) | 421 (92.5%) |
| 15 Years | 113 (89.7%) | 94 (100.0%) |
| 16 and 17 Years | 319 (96.7%) | 307 (81.9%) |
| 18 to 24 Years | 744 (97.8%) | 593 (77.0%) |
| 25 to 34 Years | 919 (95.4%) | 883 (89.1%) |
| 35 to 44 Years | 1,339 (97.5%) | 1,189 (90.3%) |
| 45 to 54 Years | 1,258 (95.8%) | 1,229 (96.2%) |
| 55 to 64 Years | 1,491 (94.0%) | 1,499 (95.4%) |
| 65 to 74 Years | 1,040 (91.1%) | 1,112 (95.2%) |
| 75 Years and over | 564 (92.9%) | 702 (87.4%) |
| Total | 9,566 (93.0%) | 9,421 (91.1%) |
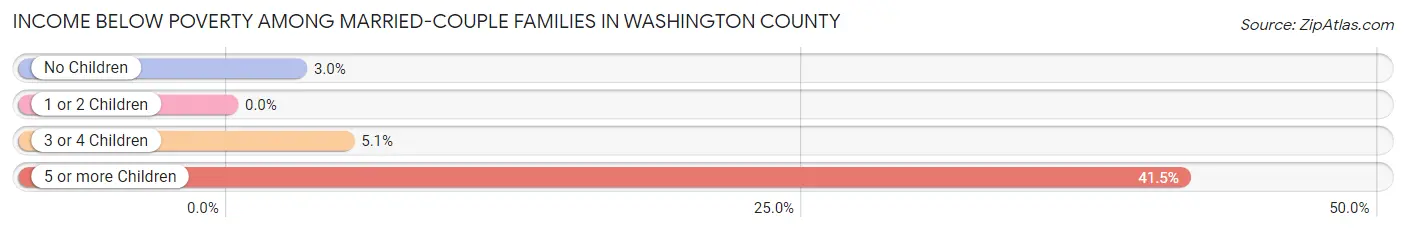
Income Below Poverty Among Married-Couple Families in Washington County
The poverty statistics for married-couple families in Washington County show that 2.7% or 129 of the total 4,851 families live below the poverty line. Families with 5 or more children have the highest poverty rate of 41.5%, comprising of 17 families. On the other hand, families with 1 or 2 children have the lowest poverty rate of 0.0%, which includes 0 families.
| Children | Above Poverty | Below Poverty |
| No Children | 2,713 (97.0%) | 84 (3.0%) |
| 1 or 2 Children | 1,460 (100.0%) | 0 (0.0%) |
| 3 or 4 Children | 525 (94.9%) | 28 (5.1%) |
| 5 or more Children | 24 (58.5%) | 17 (41.5%) |
| Total | 4,722 (97.3%) | 129 (2.7%) |
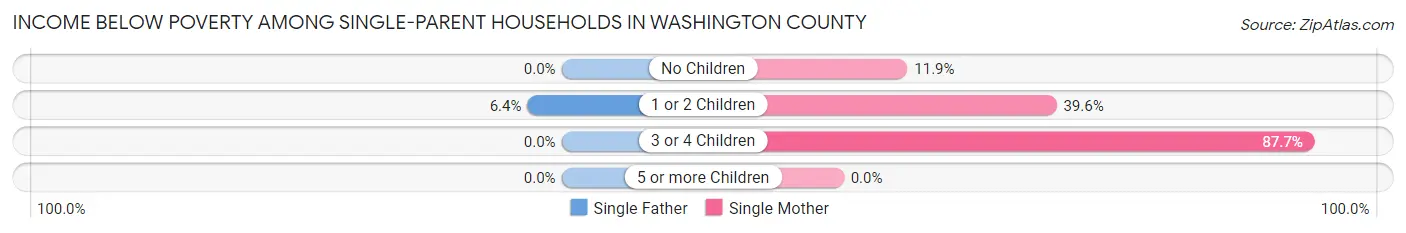
Income Below Poverty Among Single-Parent Households in Washington County
According to the poverty data in Washington County, 6.0% or 13 single-father households and 38.7% or 219 single-mother households are living below the poverty line. Among single-father households, those with 1 or 2 children have the highest poverty rate, with 13 households (6.4%) experiencing poverty. Likewise, among single-mother households, those with 3 or 4 children have the highest poverty rate, with 50 households (87.7%) falling below the poverty line.
| Children | Single Father | Single Mother |
| No Children | 0 (0.0%) | 14 (11.9%) |
| 1 or 2 Children | 13 (6.4%) | 155 (39.6%) |
| 3 or 4 Children | 0 (0.0%) | 50 (87.7%) |
| 5 or more Children | 0 (0.0%) | 0 (0.0%) |
| Total | 13 (6.0%) | 219 (38.7%) |
Income Below Poverty Among Married-Couple vs Single-Parent Households in Washington County
The poverty data for Washington County shows that 129 of the married-couple family households (2.7%) and 232 of the single-parent households (29.6%) are living below the poverty level. Within the married-couple family households, those with 5 or more children have the highest poverty rate, with 17 households (41.5%) falling below the poverty line. Among the single-parent households, those with 3 or 4 children have the highest poverty rate, with 50 household (87.7%) living below poverty.
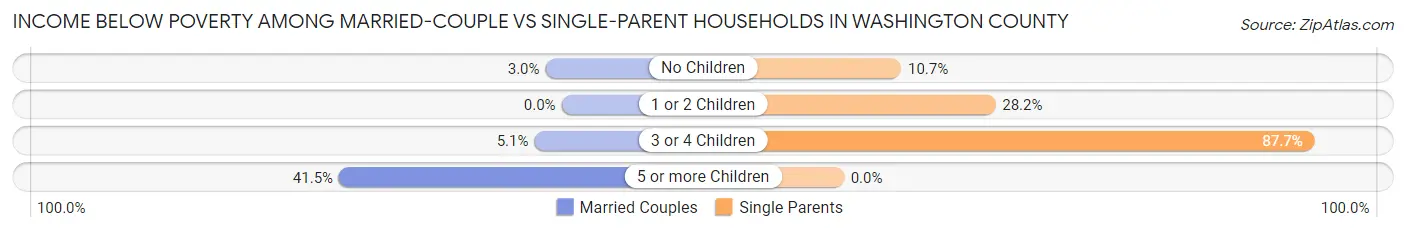
| Children | Married-Couple Families | Single-Parent Households |
| No Children | 84 (3.0%) | 14 (10.7%) |
| 1 or 2 Children | 0 (0.0%) | 168 (28.2%) |
| 3 or 4 Children | 28 (5.1%) | 50 (87.7%) |
| 5 or more Children | 17 (41.5%) | 0 (0.0%) |
| Total | 129 (2.7%) | 232 (29.6%) |
Employment Characteristics in Washington County
Employment by Class of Employer in Washington County
Among the 10,853 employed individuals in Washington County, private company employees (7,141 | 65.8%), local government employees (1,178 | 10.8%), and not-for-profit organizations (892 | 8.2%) make up the most common classes of employment.
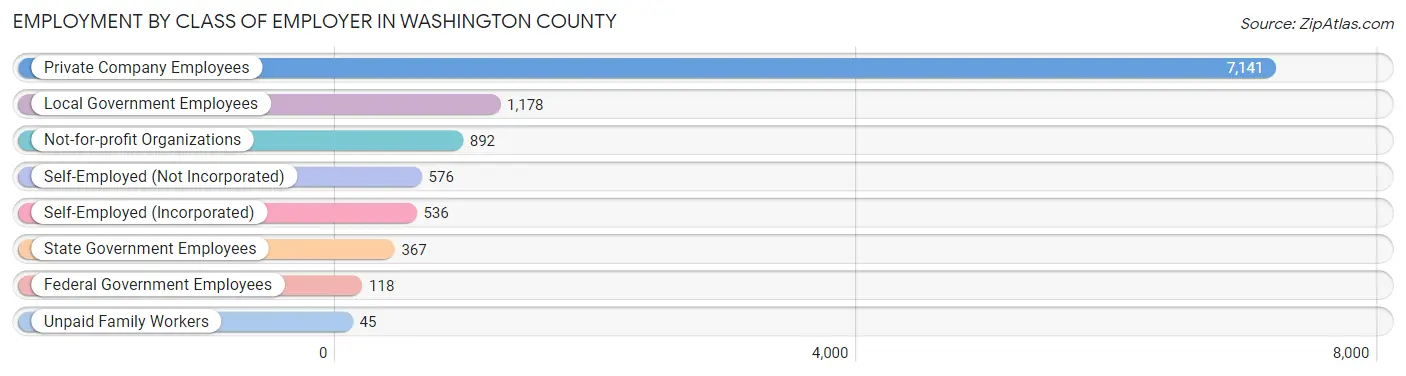
| Employer Class | # Employees | % Employees |
| Private Company Employees | 7,141 | 65.8% |
| Self-Employed (Incorporated) | 536 | 4.9% |
| Self-Employed (Not Incorporated) | 576 | 5.3% |
| Not-for-profit Organizations | 892 | 8.2% |
| Local Government Employees | 1,178 | 10.8% |
| State Government Employees | 367 | 3.4% |
| Federal Government Employees | 118 | 1.1% |
| Unpaid Family Workers | 45 | 0.4% |
| Total | 10,853 | 100.0% |
Employment Status by Age in Washington County
According to the labor force statistics for Washington County, out of the total population over 16 years of age (16,584), 68.1% or 11,294 individuals are in the labor force, with 2.0% or 226 of them unemployed. The age group with the highest labor force participation rate is 20 to 24 years, with 94.0% or 1,070 individuals in the labor force. Within the labor force, the 16 to 19 years age range has the highest percentage of unemployed individuals, with 5.3% or 31 of them being unemployed.
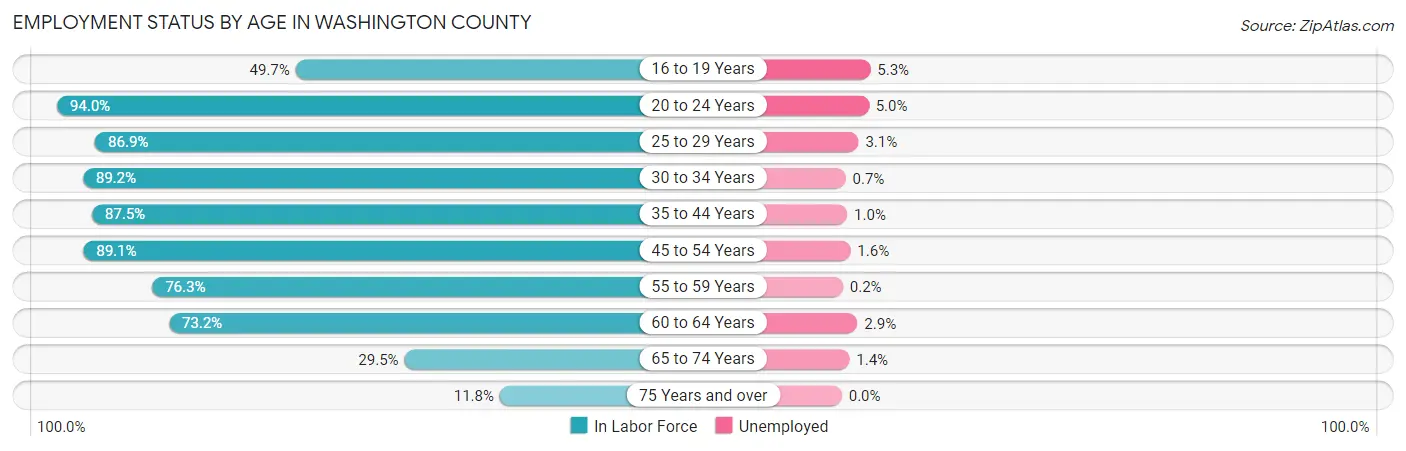
| Age Bracket | In Labor Force | Unemployed |
| 16 to 19 Years | 587 (49.7%) | 31 (5.3%) |
| 20 to 24 Years | 1,070 (94.0%) | 54 (5.0%) |
| 25 to 29 Years | 858 (86.9%) | 27 (3.1%) |
| 30 to 34 Years | 875 (89.2%) | 6 (0.7%) |
| 35 to 44 Years | 2,355 (87.5%) | 24 (1.0%) |
| 45 to 54 Years | 2,317 (89.1%) | 37 (1.6%) |
| 55 to 59 Years | 1,287 (76.3%) | 3 (0.2%) |
| 60 to 64 Years | 1,076 (73.2%) | 31 (2.9%) |
| 65 to 74 Years | 694 (29.5%) | 10 (1.4%) |
| 75 Years and over | 177 (11.8%) | 0 (0.0%) |
| Total | 11,294 (68.1%) | 226 (2.0%) |
Employment Status by Educational Attainment in Washington County
According to labor force statistics for Washington County, 84.2% of individuals (8,770) out of the total population between 25 and 64 years of age (10,416) are in the labor force, with 1.4% or 123 of them being unemployed. The group with the highest labor force participation rate are those with the educational attainment of bachelor's degree or higher, with 90.2% or 3,510 individuals in the labor force. Within the labor force, individuals with less than high school education have the highest percentage of unemployment, with 11.0% or 33 of them being unemployed.
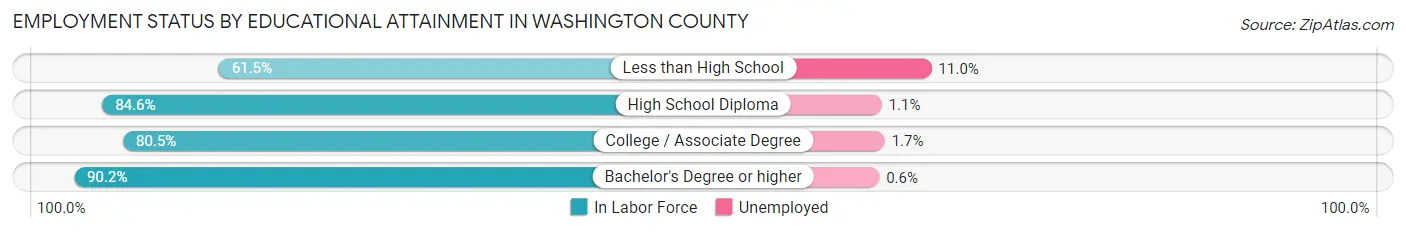
| Educational Attainment | In Labor Force | Unemployed |
| Less than High School | 299 (61.5%) | 53 (11.0%) |
| High School Diploma | 1,956 (84.6%) | 25 (1.1%) |
| College / Associate Degree | 3,000 (80.5%) | 63 (1.7%) |
| Bachelor's Degree or higher | 3,510 (90.2%) | 23 (0.6%) |
| Total | 8,770 (84.2%) | 146 (1.4%) |
Employment Occupations by Sex in Washington County
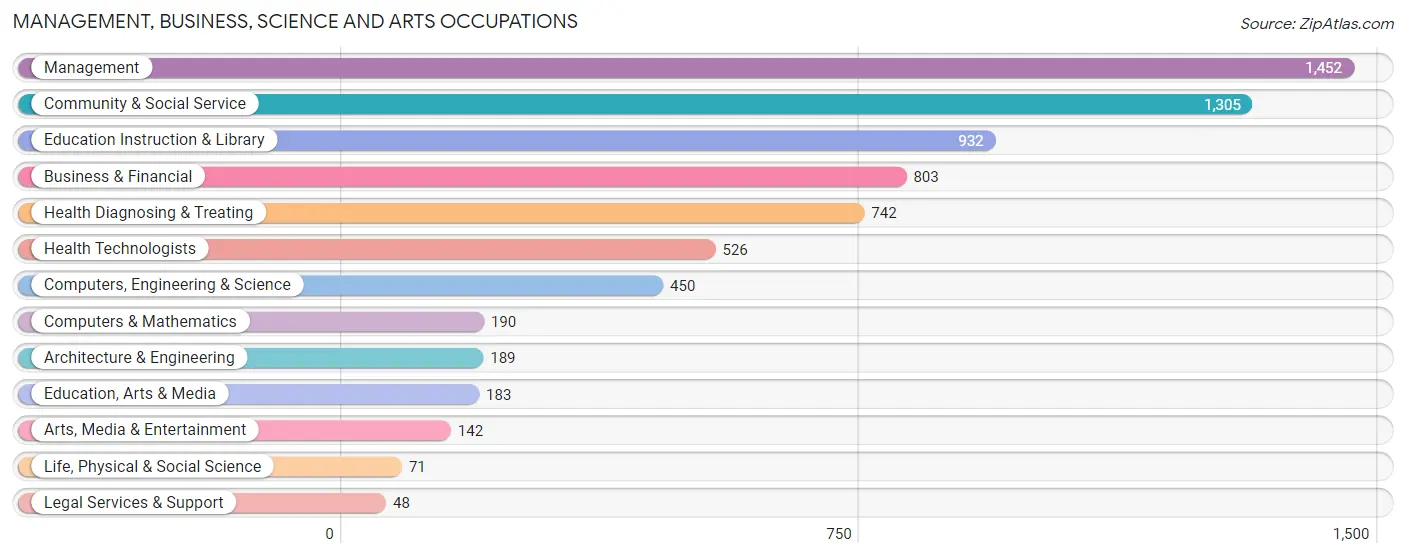
Management, Business, Science and Arts Occupations
The most common Management, Business, Science and Arts occupations in Washington County are Management (1,452 | 13.1%), Community & Social Service (1,305 | 11.8%), Education Instruction & Library (932 | 8.4%), Business & Financial (803 | 7.3%), and Health Diagnosing & Treating (742 | 6.7%).
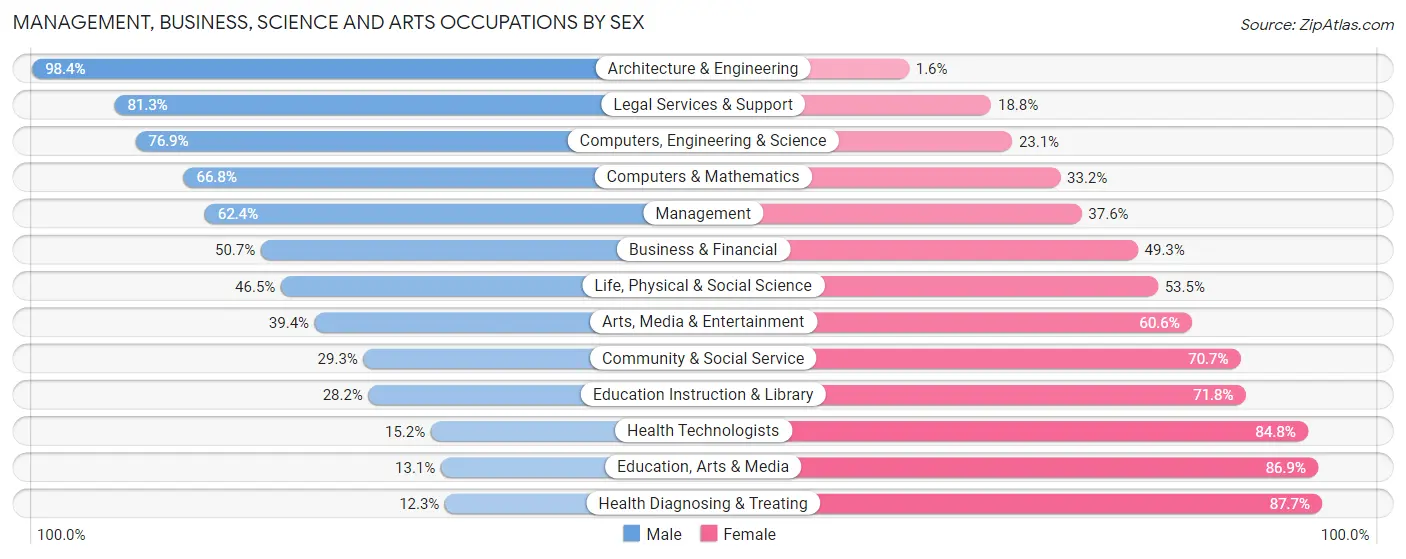
Management, Business, Science and Arts Occupations by Sex
Within the Management, Business, Science and Arts occupations in Washington County, the most male-oriented occupations are Architecture & Engineering (98.4%), Legal Services & Support (81.2%), and Computers, Engineering & Science (76.9%), while the most female-oriented occupations are Health Diagnosing & Treating (87.7%), Education, Arts & Media (86.9%), and Health Technologists (84.8%).
| Occupation | Male | Female |
| Management | 906 (62.4%) | 546 (37.6%) |
| Business & Financial | 407 (50.7%) | 396 (49.3%) |
| Computers, Engineering & Science | 346 (76.9%) | 104 (23.1%) |
| Computers & Mathematics | 127 (66.8%) | 63 (33.2%) |
| Architecture & Engineering | 186 (98.4%) | 3 (1.6%) |
| Life, Physical & Social Science | 33 (46.5%) | 38 (53.5%) |
| Community & Social Service | 382 (29.3%) | 923 (70.7%) |
| Education, Arts & Media | 24 (13.1%) | 159 (86.9%) |
| Legal Services & Support | 39 (81.2%) | 9 (18.8%) |
| Education Instruction & Library | 263 (28.2%) | 669 (71.8%) |
| Arts, Media & Entertainment | 56 (39.4%) | 86 (60.6%) |
| Health Diagnosing & Treating | 91 (12.3%) | 651 (87.7%) |
| Health Technologists | 80 (15.2%) | 446 (84.8%) |
| Total (Category) | 2,132 (44.9%) | 2,620 (55.1%) |
| Total (Overall) | 5,754 (52.0%) | 5,306 (48.0%) |
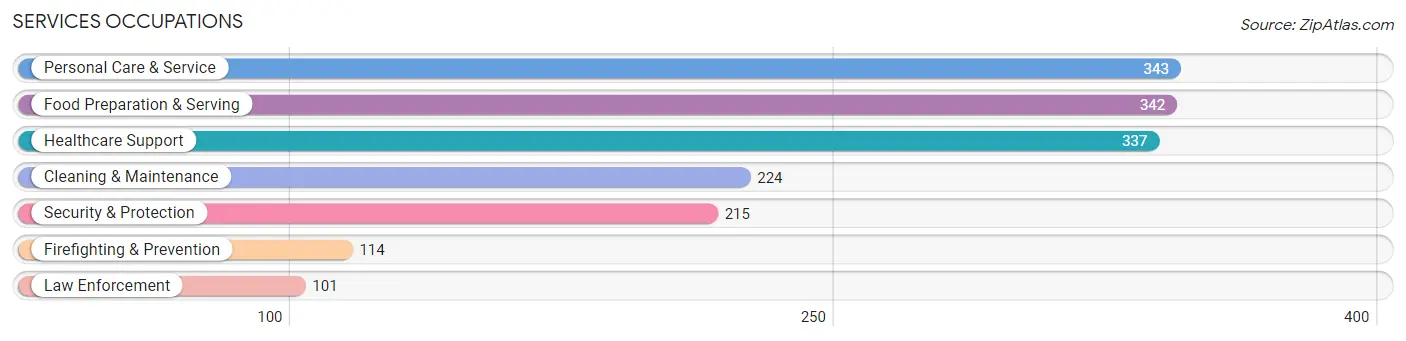
Services Occupations
The most common Services occupations in Washington County are Personal Care & Service (343 | 3.1%), Food Preparation & Serving (342 | 3.1%), Healthcare Support (337 | 3.0%), Cleaning & Maintenance (224 | 2.0%), and Security & Protection (215 | 1.9%).
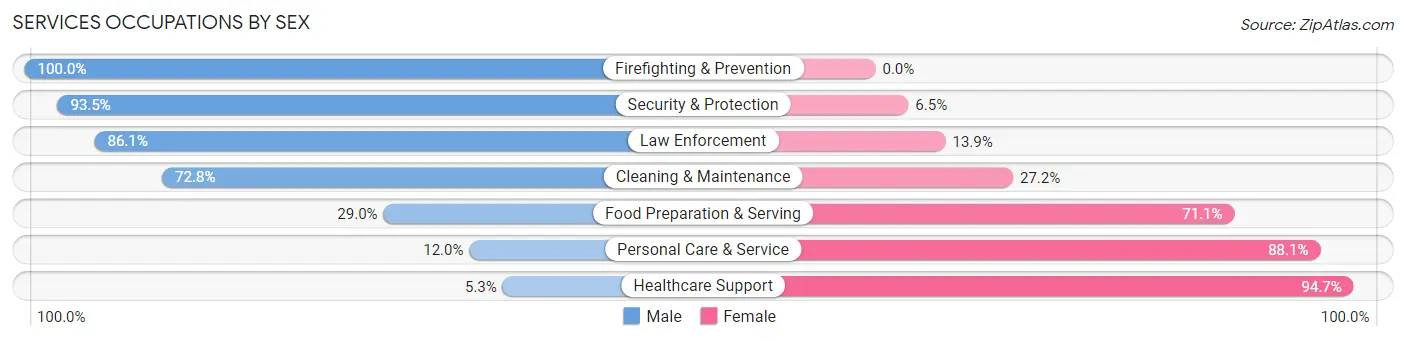
Services Occupations by Sex
Within the Services occupations in Washington County, the most male-oriented occupations are Firefighting & Prevention (100.0%), Security & Protection (93.5%), and Law Enforcement (86.1%), while the most female-oriented occupations are Healthcare Support (94.7%), Personal Care & Service (88.0%), and Food Preparation & Serving (71.1%).
| Occupation | Male | Female |
| Healthcare Support | 18 (5.3%) | 319 (94.7%) |
| Security & Protection | 201 (93.5%) | 14 (6.5%) |
| Firefighting & Prevention | 114 (100.0%) | 0 (0.0%) |
| Law Enforcement | 87 (86.1%) | 14 (13.9%) |
| Food Preparation & Serving | 99 (28.9%) | 243 (71.1%) |
| Cleaning & Maintenance | 163 (72.8%) | 61 (27.2%) |
| Personal Care & Service | 41 (11.9%) | 302 (88.0%) |
| Total (Category) | 522 (35.7%) | 939 (64.3%) |
| Total (Overall) | 5,754 (52.0%) | 5,306 (48.0%) |
Sales and Office Occupations
The most common Sales and Office occupations in Washington County are Office & Administration (1,325 | 12.0%), and Sales & Related (906 | 8.2%).
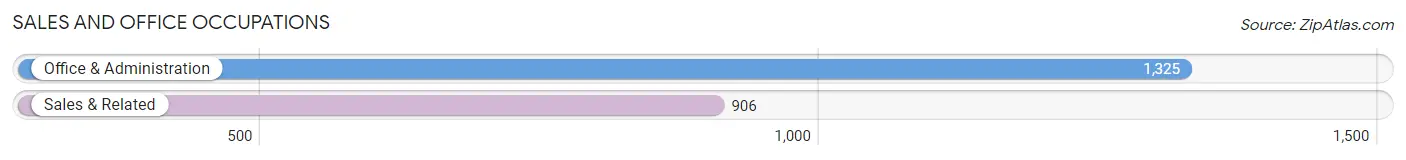
Sales and Office Occupations by Sex
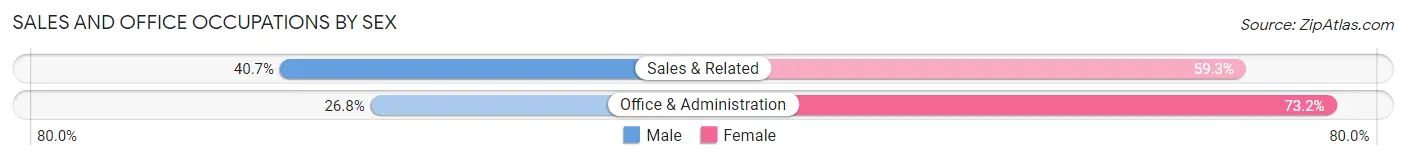
| Occupation | Male | Female |
| Sales & Related | 369 (40.7%) | 537 (59.3%) |
| Office & Administration | 355 (26.8%) | 970 (73.2%) |
| Total (Category) | 724 (32.5%) | 1,507 (67.5%) |
| Total (Overall) | 5,754 (52.0%) | 5,306 (48.0%) |
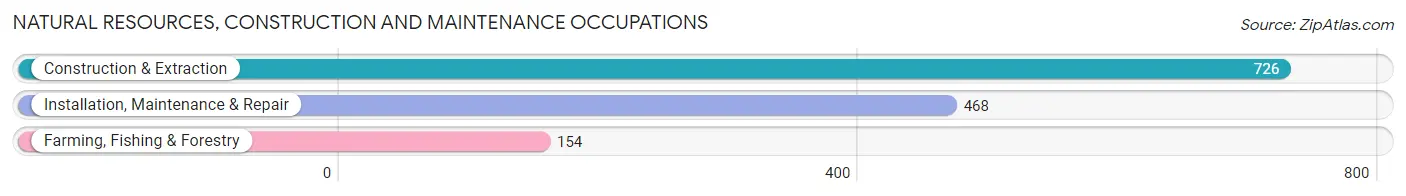
Natural Resources, Construction and Maintenance Occupations
The most common Natural Resources, Construction and Maintenance occupations in Washington County are Construction & Extraction (726 | 6.6%), Installation, Maintenance & Repair (468 | 4.2%), and Farming, Fishing & Forestry (154 | 1.4%).
Natural Resources, Construction and Maintenance Occupations by Sex
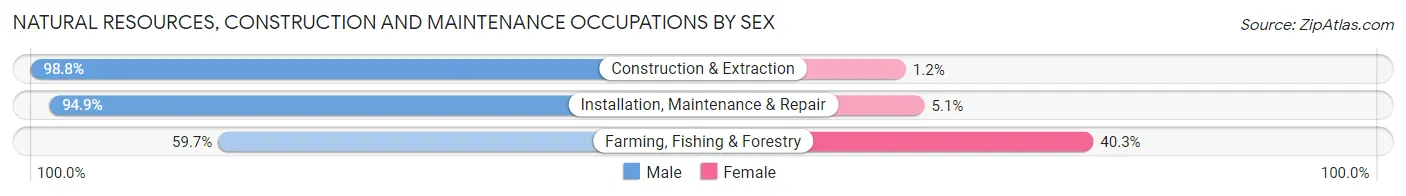
| Occupation | Male | Female |
| Farming, Fishing & Forestry | 92 (59.7%) | 62 (40.3%) |
| Construction & Extraction | 717 (98.8%) | 9 (1.2%) |
| Installation, Maintenance & Repair | 444 (94.9%) | 24 (5.1%) |
| Total (Category) | 1,253 (92.9%) | 95 (7.0%) |
| Total (Overall) | 5,754 (52.0%) | 5,306 (48.0%) |
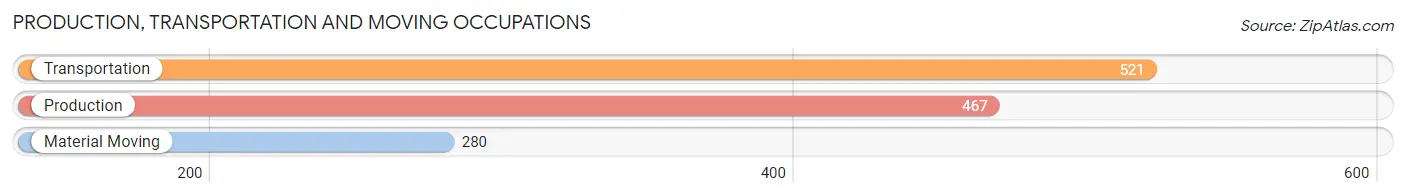
Production, Transportation and Moving Occupations
The most common Production, Transportation and Moving occupations in Washington County are Transportation (521 | 4.7%), Production (467 | 4.2%), and Material Moving (280 | 2.5%).
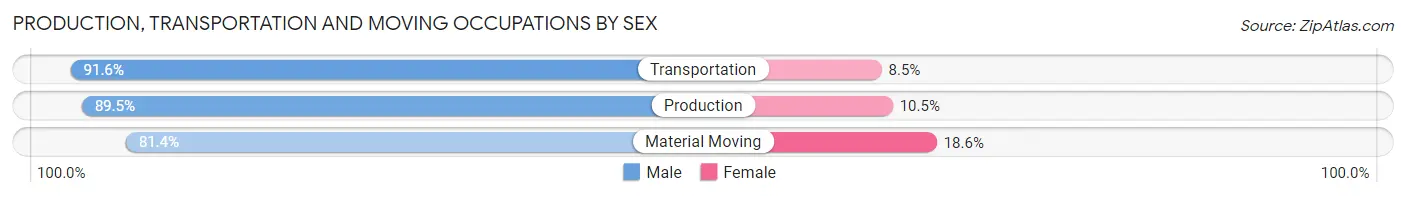
Production, Transportation and Moving Occupations by Sex
| Occupation | Male | Female |
| Production | 418 (89.5%) | 49 (10.5%) |
| Transportation | 477 (91.5%) | 44 (8.5%) |
| Material Moving | 228 (81.4%) | 52 (18.6%) |
| Total (Category) | 1,123 (88.6%) | 145 (11.4%) |
| Total (Overall) | 5,754 (52.0%) | 5,306 (48.0%) |
Employment Industries by Sex in Washington County
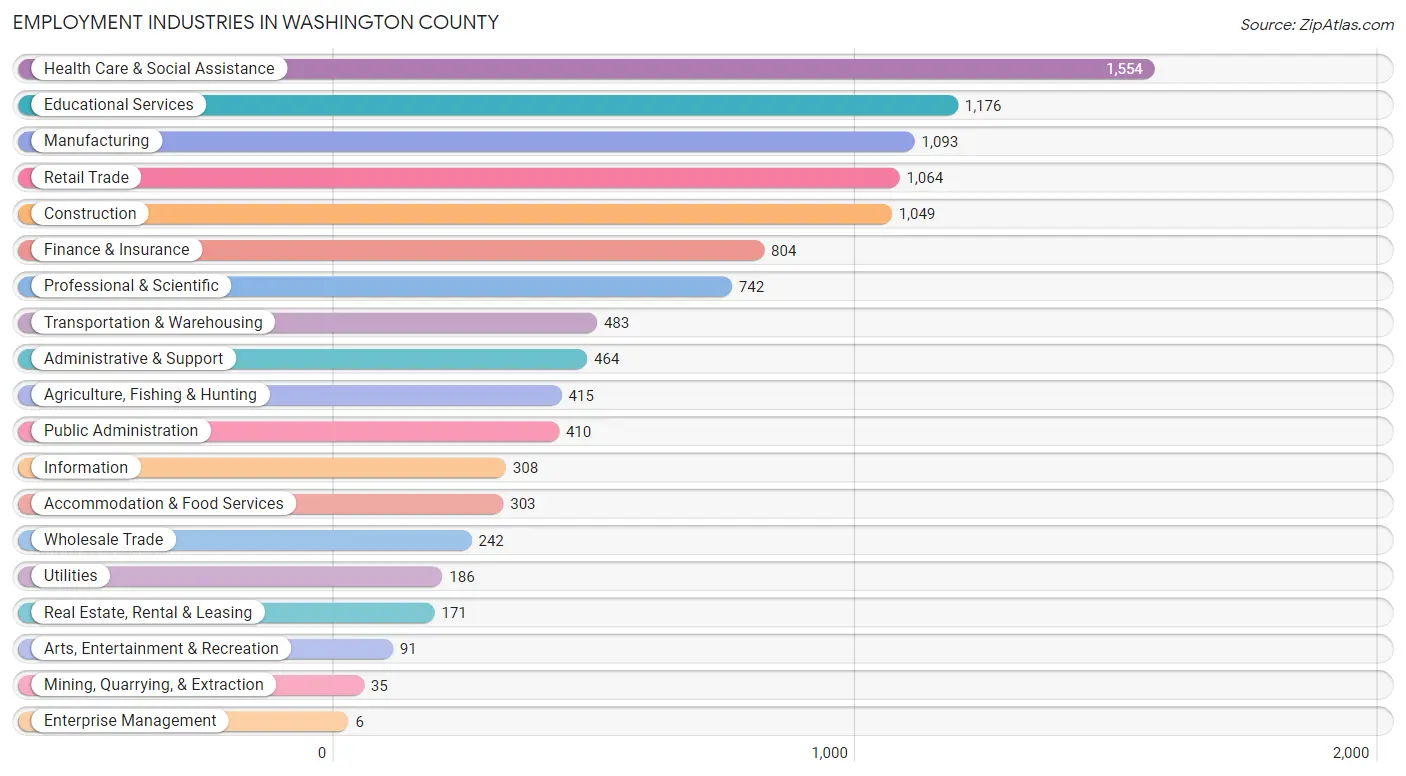
Employment Industries in Washington County
The major employment industries in Washington County include Health Care & Social Assistance (1,554 | 14.1%), Educational Services (1,176 | 10.6%), Manufacturing (1,093 | 9.9%), Retail Trade (1,064 | 9.6%), and Construction (1,049 | 9.5%).
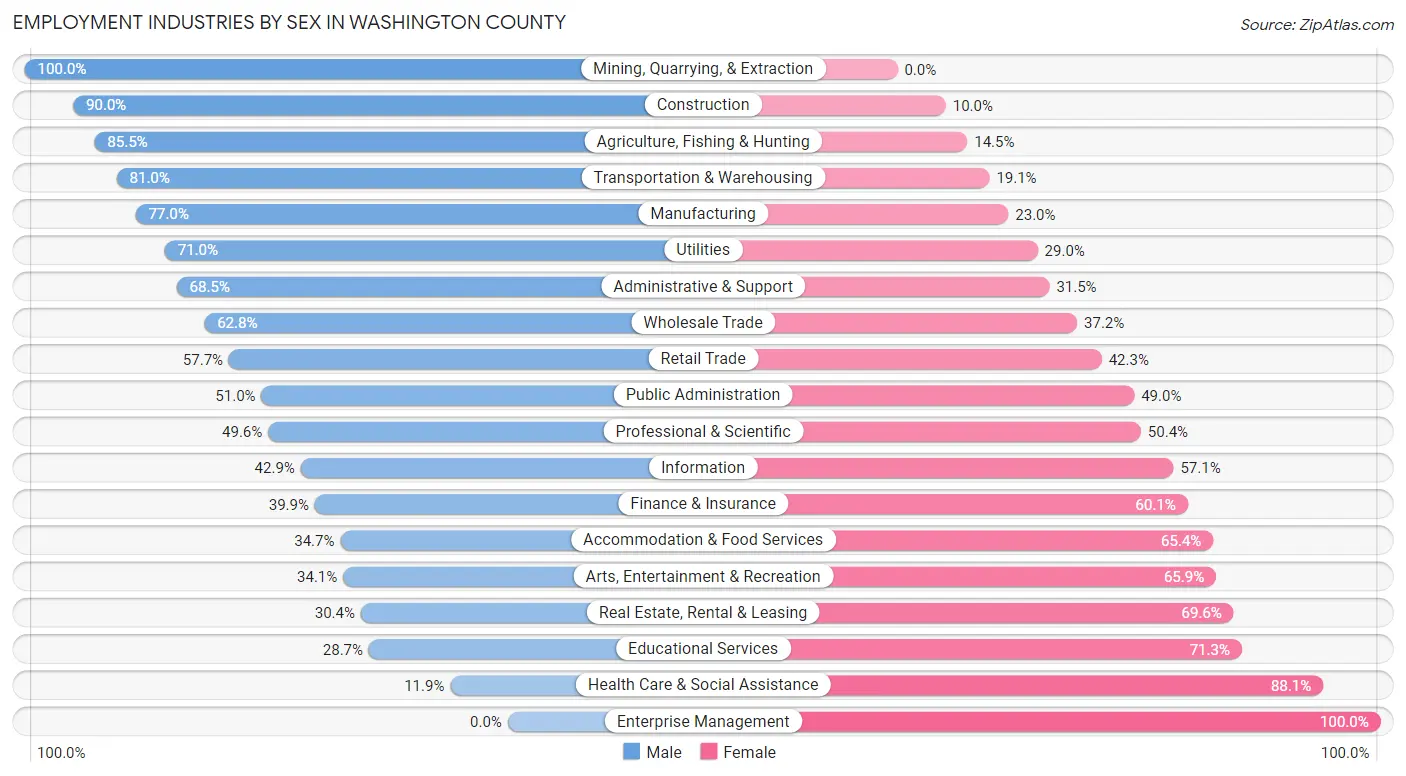
Employment Industries by Sex in Washington County
The Washington County industries that see more men than women are Mining, Quarrying, & Extraction (100.0%), Construction (90.0%), and Agriculture, Fishing & Hunting (85.5%), whereas the industries that tend to have a higher number of women are Enterprise Management (100.0%), Health Care & Social Assistance (88.1%), and Educational Services (71.3%).
| Industry | Male | Female |
| Agriculture, Fishing & Hunting | 355 (85.5%) | 60 (14.5%) |
| Mining, Quarrying, & Extraction | 35 (100.0%) | 0 (0.0%) |
| Construction | 944 (90.0%) | 105 (10.0%) |
| Manufacturing | 842 (77.0%) | 251 (23.0%) |
| Wholesale Trade | 152 (62.8%) | 90 (37.2%) |
| Retail Trade | 614 (57.7%) | 450 (42.3%) |
| Transportation & Warehousing | 391 (80.9%) | 92 (19.1%) |
| Utilities | 132 (71.0%) | 54 (29.0%) |
| Information | 132 (42.9%) | 176 (57.1%) |
| Finance & Insurance | 321 (39.9%) | 483 (60.1%) |
| Real Estate, Rental & Leasing | 52 (30.4%) | 119 (69.6%) |
| Professional & Scientific | 368 (49.6%) | 374 (50.4%) |
| Enterprise Management | 0 (0.0%) | 6 (100.0%) |
| Administrative & Support | 318 (68.5%) | 146 (31.5%) |
| Educational Services | 338 (28.7%) | 838 (71.3%) |
| Health Care & Social Assistance | 185 (11.9%) | 1,369 (88.1%) |
| Arts, Entertainment & Recreation | 31 (34.1%) | 60 (65.9%) |
| Accommodation & Food Services | 105 (34.6%) | 198 (65.3%) |
| Public Administration | 209 (51.0%) | 201 (49.0%) |
| Total | 5,754 (52.0%) | 5,306 (48.0%) |
Education in Washington County
School Enrollment in Washington County
The most common levels of schooling among the 5,077 students in Washington County are middle school (1,195 | 23.5%), high school (1,154 | 22.7%), and elementary school (1,134 | 22.3%).
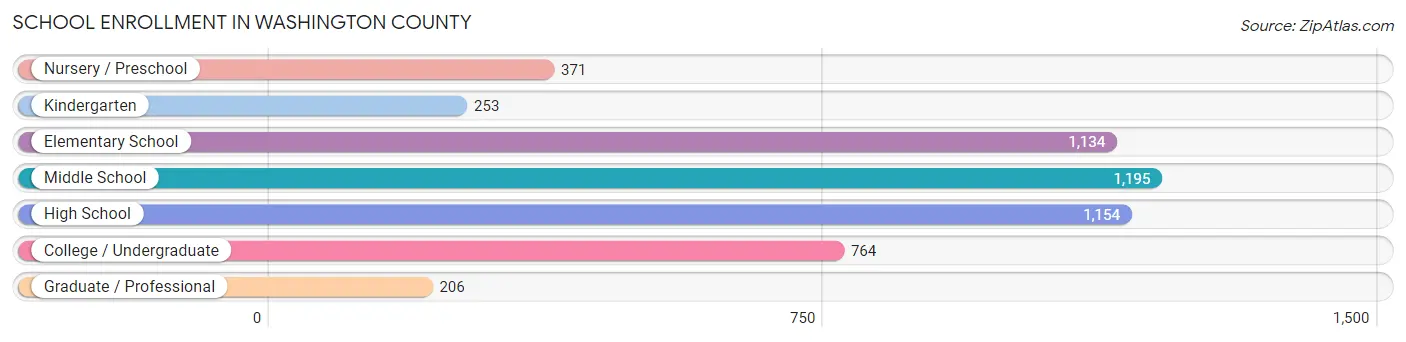
| School Level | # Students | % Students |
| Nursery / Preschool | 371 | 7.3% |
| Kindergarten | 253 | 5.0% |
| Elementary School | 1,134 | 22.3% |
| Middle School | 1,195 | 23.5% |
| High School | 1,154 | 22.7% |
| College / Undergraduate | 764 | 15.0% |
| Graduate / Professional | 206 | 4.1% |
| Total | 5,077 | 100.0% |
School Enrollment by Age by Funding Source in Washington County
Out of a total of 5,077 students who are enrolled in schools in Washington County, 792 (15.6%) attend a private institution, while the remaining 4,285 (84.4%) are enrolled in public schools. The age group of 20 to 24 year olds has the highest likelihood of being enrolled in private schools, with 131 (31.4% in the age bracket) enrolled. Conversely, the age group of 15 to 17 year olds has the lowest likelihood of being enrolled in a private school, with 867 (97.0% in the age bracket) attending a public institution.
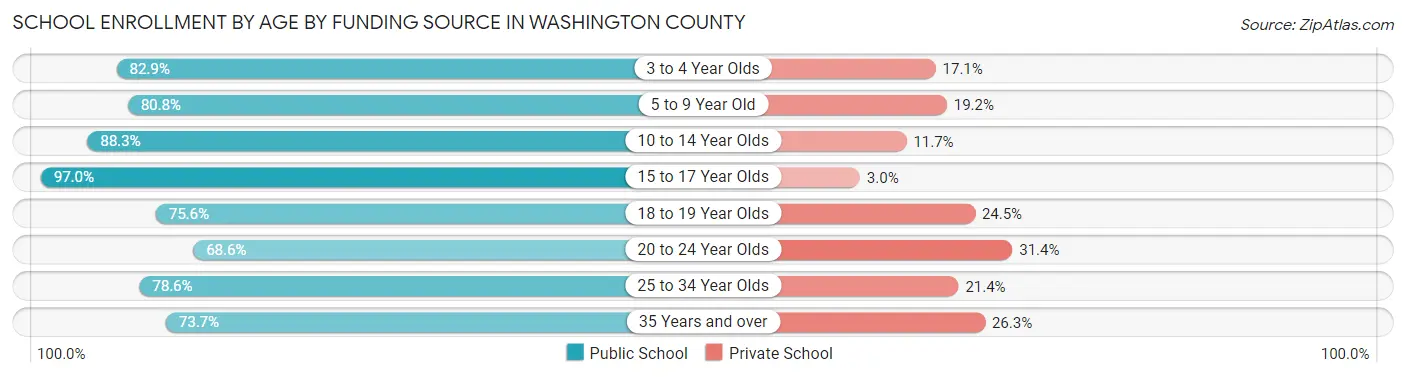
| Age Bracket | Public School | Private School |
| 3 to 4 Year Olds | 208 (82.9%) | 43 (17.1%) |
| 5 to 9 Year Old | 1,098 (80.8%) | 261 (19.2%) |
| 10 to 14 Year Olds | 1,337 (88.3%) | 177 (11.7%) |
| 15 to 17 Year Olds | 867 (97.0%) | 27 (3.0%) |
| 18 to 19 Year Olds | 275 (75.5%) | 89 (24.4%) |
| 20 to 24 Year Olds | 286 (68.6%) | 131 (31.4%) |
| 25 to 34 Year Olds | 114 (78.6%) | 31 (21.4%) |
| 35 Years and over | 98 (73.7%) | 35 (26.3%) |
| Total | 4,285 (84.4%) | 792 (15.6%) |
Educational Attainment by Field of Study in Washington County
Business (1,033 | 19.6%), education (1,004 | 19.0%), science & technology (694 | 13.1%), computers & mathematics (538 | 10.2%), and bio, nature & agricultural (414 | 7.8%) are the most common fields of study among 5,280 individuals in Washington County who have obtained a bachelor's degree or higher.
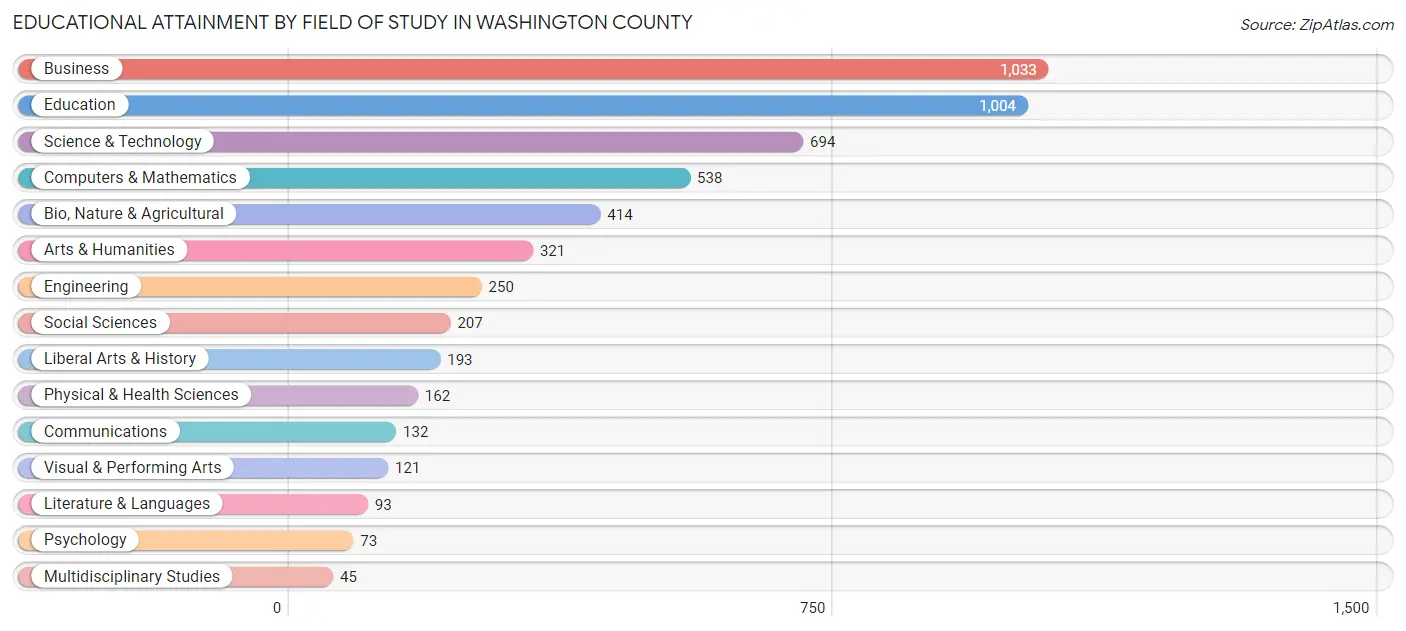
| Field of Study | # Graduates | % Graduates |
| Computers & Mathematics | 538 | 10.2% |
| Bio, Nature & Agricultural | 414 | 7.8% |
| Physical & Health Sciences | 162 | 3.1% |
| Psychology | 73 | 1.4% |
| Social Sciences | 207 | 3.9% |
| Engineering | 250 | 4.7% |
| Multidisciplinary Studies | 45 | 0.9% |
| Science & Technology | 694 | 13.1% |
| Business | 1,033 | 19.6% |
| Education | 1,004 | 19.0% |
| Literature & Languages | 93 | 1.8% |
| Liberal Arts & History | 193 | 3.7% |
| Visual & Performing Arts | 121 | 2.3% |
| Communications | 132 | 2.5% |
| Arts & Humanities | 321 | 6.1% |
| Total | 5,280 | 100.0% |
Transportation & Commute in Washington County
Vehicle Availability by Sex in Washington County
The most prevalent vehicle ownership categories in Washington County are males with 2 vehicles (1,956, accounting for 34.7%) and females with 2 vehicles (1,960, making up 37.9%).
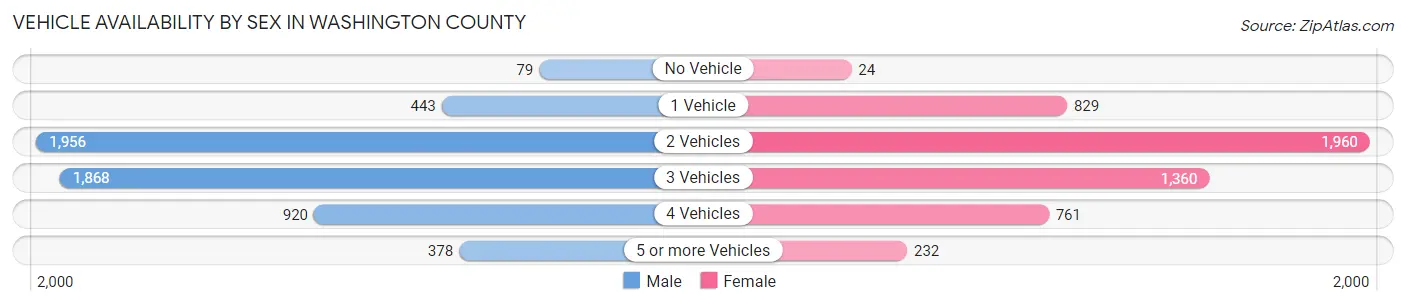
| Vehicles Available | Male | Female |
| No Vehicle | 79 (1.4%) | 24 (0.5%) |
| 1 Vehicle | 443 (7.9%) | 829 (16.1%) |
| 2 Vehicles | 1,956 (34.7%) | 1,960 (37.9%) |
| 3 Vehicles | 1,868 (33.1%) | 1,360 (26.3%) |
| 4 Vehicles | 920 (16.3%) | 761 (14.7%) |
| 5 or more Vehicles | 378 (6.7%) | 232 (4.5%) |
| Total | 5,644 (100.0%) | 5,166 (100.0%) |
Commute Time in Washington County
The most frequently occuring commute durations in Washington County are 30 to 34 minutes (1,491 commuters, 15.2%), 5 to 9 minutes (1,336 commuters, 13.7%), and 20 to 24 minutes (1,265 commuters, 12.9%).
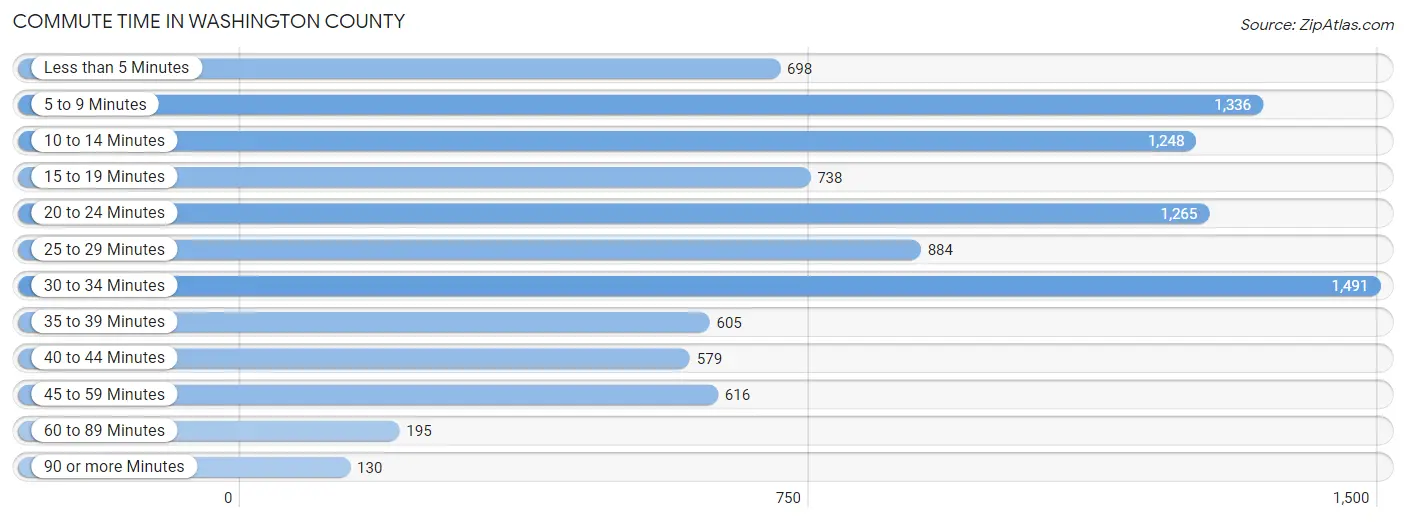
| Commute Time | # Commuters | % Commuters |
| Less than 5 Minutes | 698 | 7.1% |
| 5 to 9 Minutes | 1,336 | 13.7% |
| 10 to 14 Minutes | 1,248 | 12.8% |
| 15 to 19 Minutes | 738 | 7.5% |
| 20 to 24 Minutes | 1,265 | 12.9% |
| 25 to 29 Minutes | 884 | 9.0% |
| 30 to 34 Minutes | 1,491 | 15.2% |
| 35 to 39 Minutes | 605 | 6.2% |
| 40 to 44 Minutes | 579 | 5.9% |
| 45 to 59 Minutes | 616 | 6.3% |
| 60 to 89 Minutes | 195 | 2.0% |
| 90 or more Minutes | 130 | 1.3% |
Commute Time by Sex in Washington County
The most common commute times in Washington County are 20 to 24 minutes (774 commuters, 15.3%) for males and 5 to 9 minutes (757 commuters, 16.0%) for females.
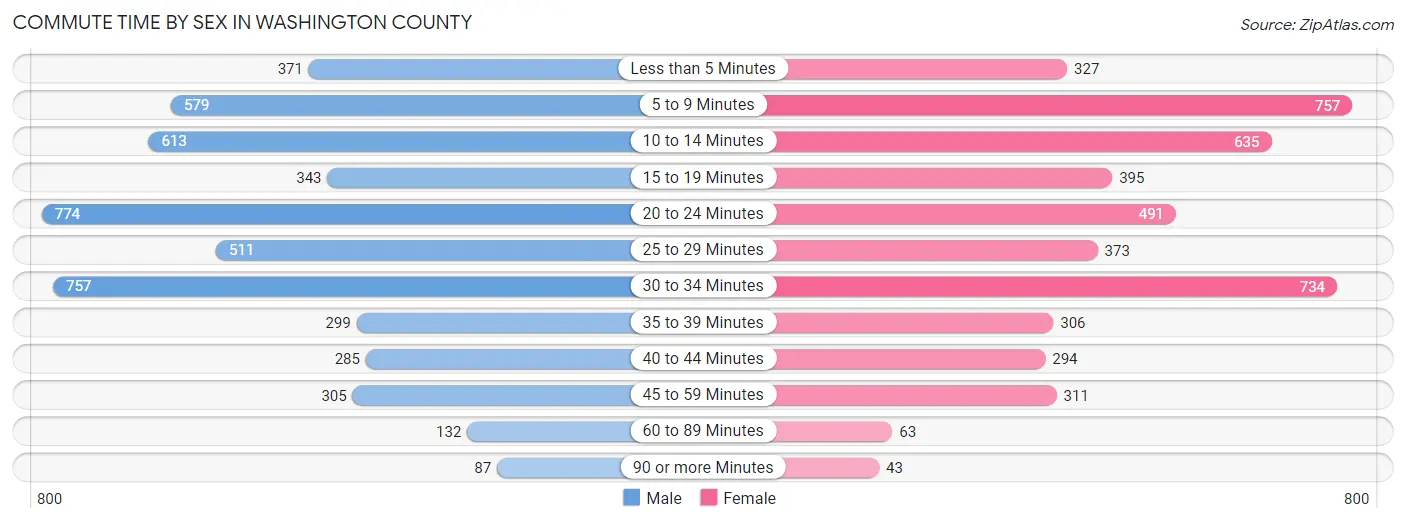
| Commute Time | Male | Female |
| Less than 5 Minutes | 371 (7.3%) | 327 (6.9%) |
| 5 to 9 Minutes | 579 (11.5%) | 757 (16.0%) |
| 10 to 14 Minutes | 613 (12.1%) | 635 (13.4%) |
| 15 to 19 Minutes | 343 (6.8%) | 395 (8.4%) |
| 20 to 24 Minutes | 774 (15.3%) | 491 (10.4%) |
| 25 to 29 Minutes | 511 (10.1%) | 373 (7.9%) |
| 30 to 34 Minutes | 757 (15.0%) | 734 (15.5%) |
| 35 to 39 Minutes | 299 (5.9%) | 306 (6.5%) |
| 40 to 44 Minutes | 285 (5.6%) | 294 (6.2%) |
| 45 to 59 Minutes | 305 (6.0%) | 311 (6.6%) |
| 60 to 89 Minutes | 132 (2.6%) | 63 (1.3%) |
| 90 or more Minutes | 87 (1.7%) | 43 (0.9%) |
Time of Departure to Work by Sex in Washington County
The most frequent times of departure to work in Washington County are 7:00 AM to 7:29 AM (961, 19.0%) for males and 7:30 AM to 7:59 AM (929, 19.6%) for females.
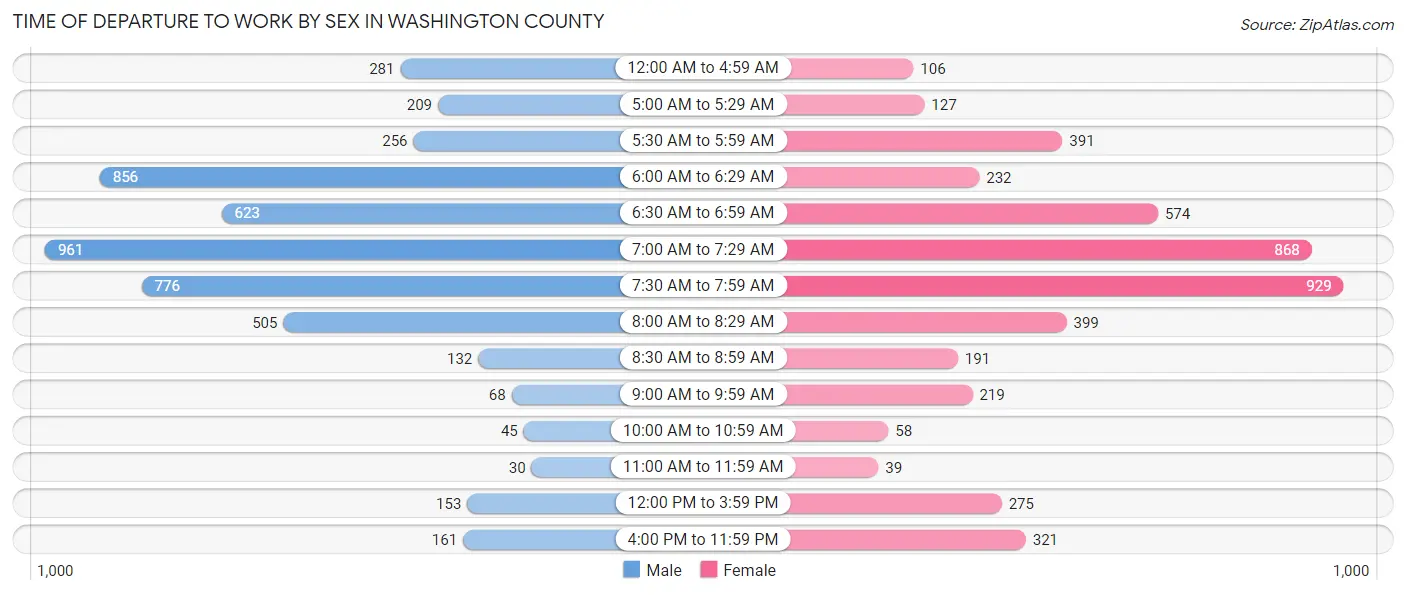
| Time of Departure | Male | Female |
| 12:00 AM to 4:59 AM | 281 (5.6%) | 106 (2.2%) |
| 5:00 AM to 5:29 AM | 209 (4.1%) | 127 (2.7%) |
| 5:30 AM to 5:59 AM | 256 (5.1%) | 391 (8.3%) |
| 6:00 AM to 6:29 AM | 856 (16.9%) | 232 (4.9%) |
| 6:30 AM to 6:59 AM | 623 (12.3%) | 574 (12.1%) |
| 7:00 AM to 7:29 AM | 961 (19.0%) | 868 (18.3%) |
| 7:30 AM to 7:59 AM | 776 (15.3%) | 929 (19.6%) |
| 8:00 AM to 8:29 AM | 505 (10.0%) | 399 (8.4%) |
| 8:30 AM to 8:59 AM | 132 (2.6%) | 191 (4.0%) |
| 9:00 AM to 9:59 AM | 68 (1.3%) | 219 (4.6%) |
| 10:00 AM to 10:59 AM | 45 (0.9%) | 58 (1.2%) |
| 11:00 AM to 11:59 AM | 30 (0.6%) | 39 (0.8%) |
| 12:00 PM to 3:59 PM | 153 (3.0%) | 275 (5.8%) |
| 4:00 PM to 11:59 PM | 161 (3.2%) | 321 (6.8%) |
| Total | 5,056 (100.0%) | 4,729 (100.0%) |
Housing Occupancy in Washington County
Occupancy by Ownership in Washington County
Of the total 8,234 dwellings in Washington County, owner-occupied units account for 6,666 (81.0%), while renter-occupied units make up 1,568 (19.0%).
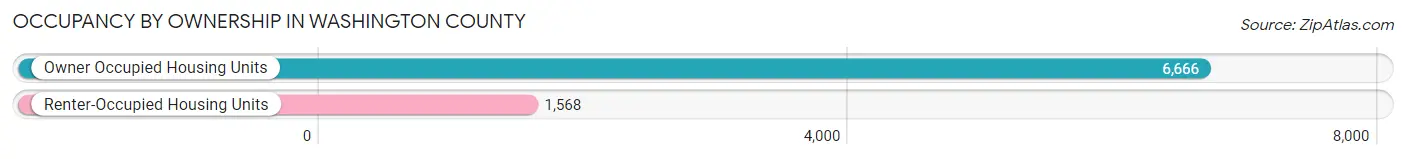
| Occupancy | # Housing Units | % Housing Units |
| Owner Occupied Housing Units | 6,666 | 81.0% |
| Renter-Occupied Housing Units | 1,568 | 19.0% |
| Total Occupied Housing Units | 8,234 | 100.0% |
Occupancy by Household Size in Washington County
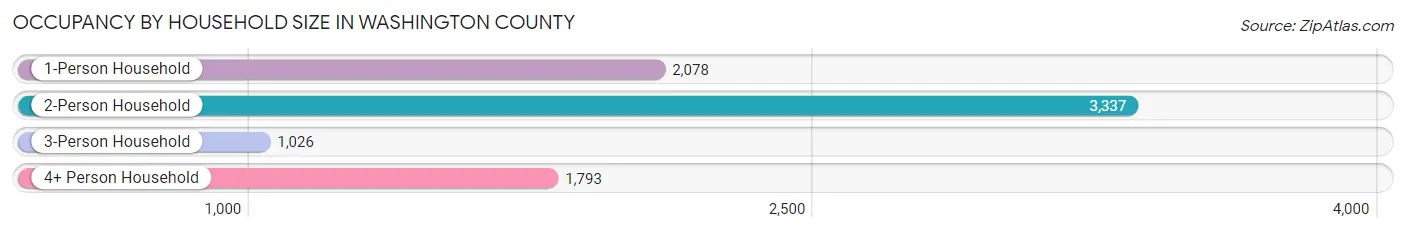
| Household Size | # Housing Units | % Housing Units |
| 1-Person Household | 2,078 | 25.2% |
| 2-Person Household | 3,337 | 40.5% |
| 3-Person Household | 1,026 | 12.5% |
| 4+ Person Household | 1,793 | 21.8% |
| Total Housing Units | 8,234 | 100.0% |
Occupancy by Ownership by Household Size in Washington County
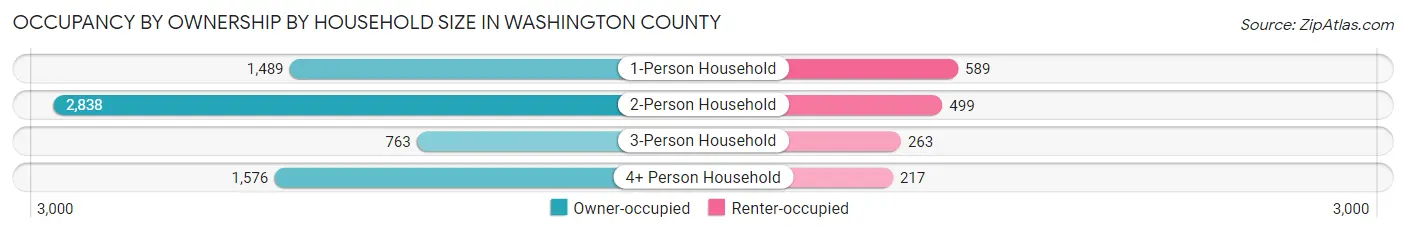
| Household Size | Owner-occupied | Renter-occupied |
| 1-Person Household | 1,489 (71.7%) | 589 (28.3%) |
| 2-Person Household | 2,838 (85.1%) | 499 (14.9%) |
| 3-Person Household | 763 (74.4%) | 263 (25.6%) |
| 4+ Person Household | 1,576 (87.9%) | 217 (12.1%) |
| Total Housing Units | 6,666 (81.0%) | 1,568 (19.0%) |
Occupancy by Educational Attainment in Washington County
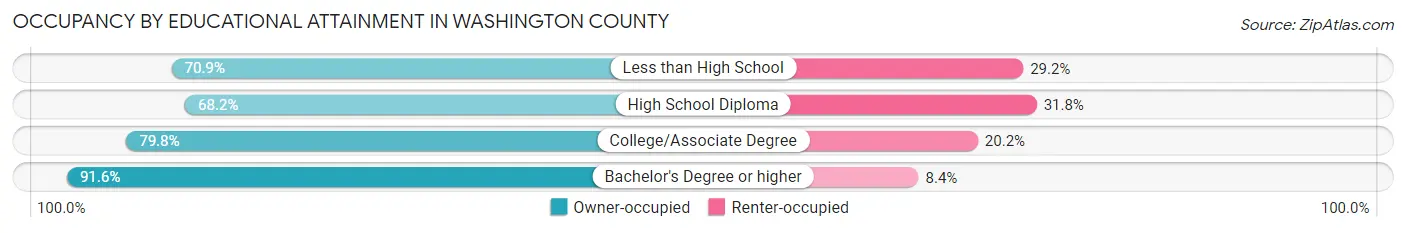
| Household Size | Owner-occupied | Renter-occupied |
| Less than High School | 282 (70.9%) | 116 (29.1%) |
| High School Diploma | 1,326 (68.2%) | 619 (31.8%) |
| College/Associate Degree | 2,292 (79.8%) | 579 (20.2%) |
| Bachelor's Degree or higher | 2,766 (91.6%) | 254 (8.4%) |
Occupancy by Age of Householder in Washington County
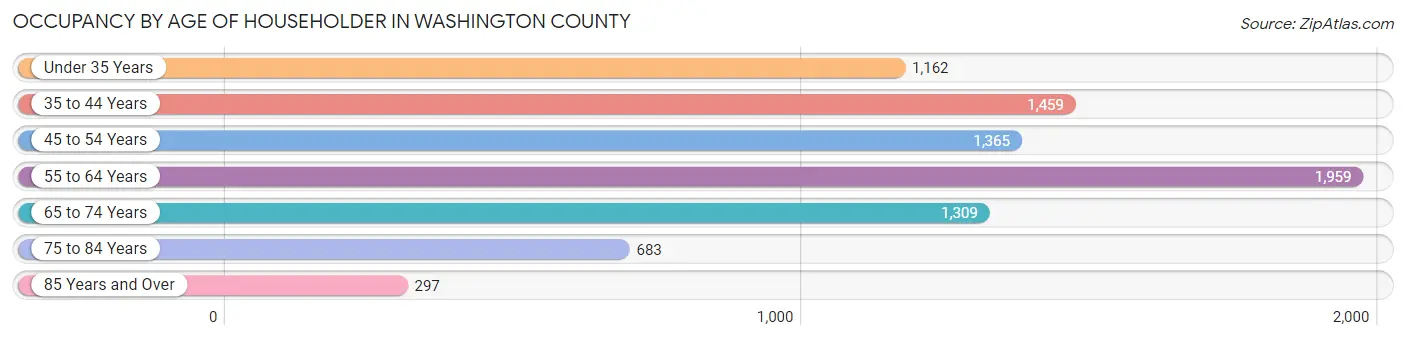
| Age Bracket | # Households | % Households |
| Under 35 Years | 1,162 | 14.1% |
| 35 to 44 Years | 1,459 | 17.7% |
| 45 to 54 Years | 1,365 | 16.6% |
| 55 to 64 Years | 1,959 | 23.8% |
| 65 to 74 Years | 1,309 | 15.9% |
| 75 to 84 Years | 683 | 8.3% |
| 85 Years and Over | 297 | 3.6% |
| Total | 8,234 | 100.0% |
Housing Finances in Washington County
Median Income by Occupancy in Washington County
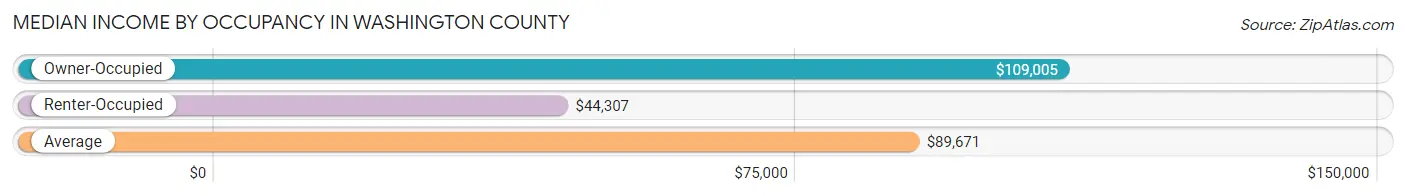
| Occupancy Type | # Households | Median Income |
| Owner-Occupied | 6,666 (81.0%) | $109,005 |
| Renter-Occupied | 1,568 (19.0%) | $44,307 |
| Average | 8,234 (100.0%) | $89,671 |
Occupancy by Householder Income Bracket in Washington County
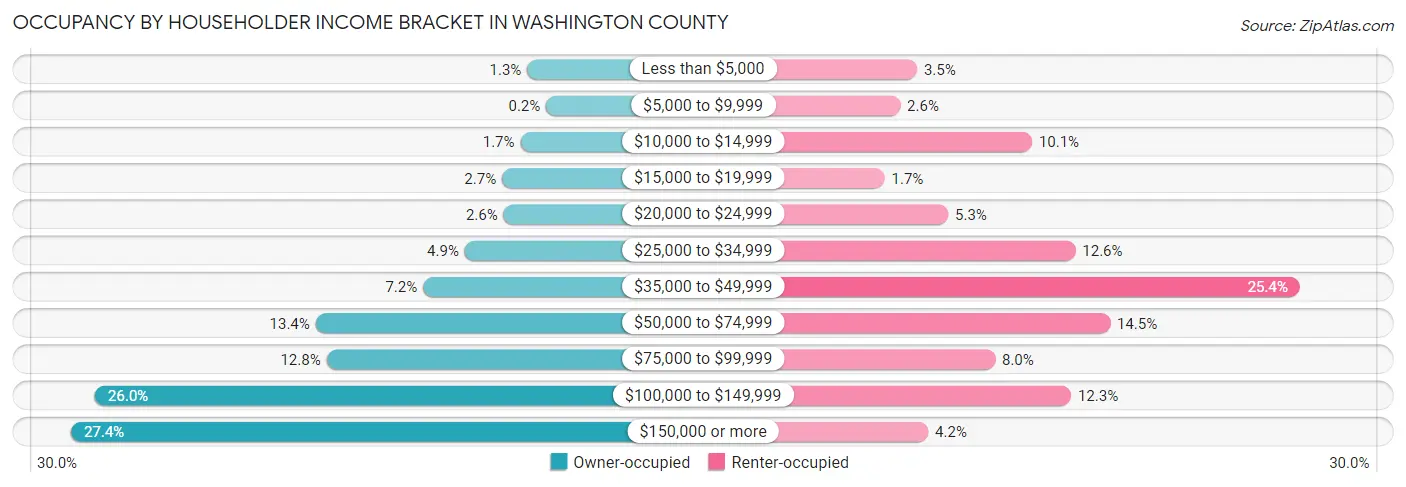
| Income Bracket | Owner-occupied | Renter-occupied |
| Less than $5,000 | 85 (1.3%) | 55 (3.5%) |
| $5,000 to $9,999 | 13 (0.2%) | 40 (2.5%) |
| $10,000 to $14,999 | 111 (1.7%) | 158 (10.1%) |
| $15,000 to $19,999 | 181 (2.7%) | 26 (1.7%) |
| $20,000 to $24,999 | 175 (2.6%) | 83 (5.3%) |
| $25,000 to $34,999 | 323 (4.9%) | 197 (12.6%) |
| $35,000 to $49,999 | 482 (7.2%) | 398 (25.4%) |
| $50,000 to $74,999 | 891 (13.4%) | 228 (14.5%) |
| $75,000 to $99,999 | 850 (12.8%) | 125 (8.0%) |
| $100,000 to $149,999 | 1,732 (26.0%) | 193 (12.3%) |
| $150,000 or more | 1,823 (27.4%) | 65 (4.2%) |
| Total | 6,666 (100.0%) | 1,568 (100.0%) |
Monthly Housing Cost Tiers in Washington County
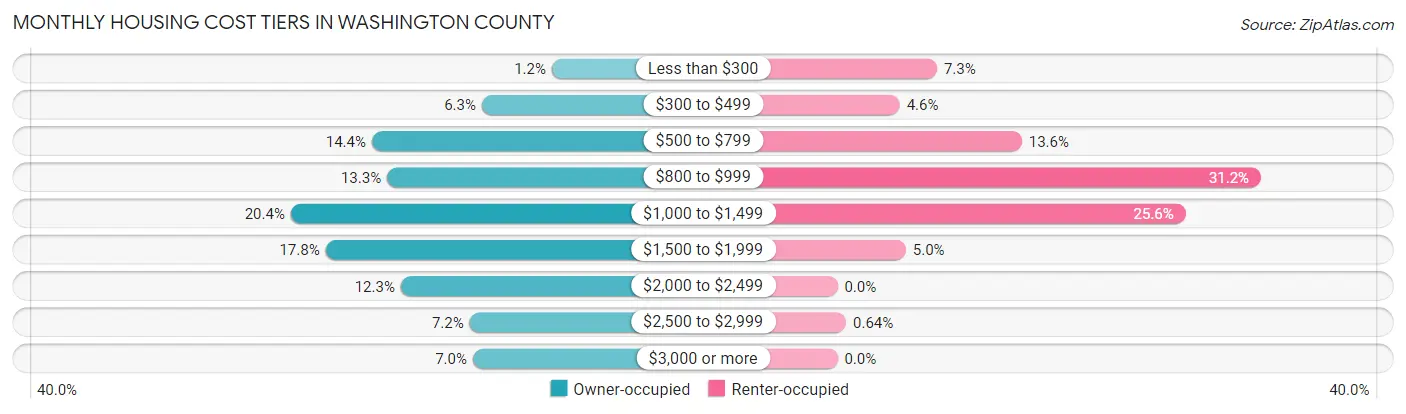
| Monthly Cost | Owner-occupied | Renter-occupied |
| Less than $300 | 78 (1.2%) | 115 (7.3%) |
| $300 to $499 | 422 (6.3%) | 72 (4.6%) |
| $500 to $799 | 962 (14.4%) | 213 (13.6%) |
| $800 to $999 | 887 (13.3%) | 489 (31.2%) |
| $1,000 to $1,499 | 1,360 (20.4%) | 402 (25.6%) |
| $1,500 to $1,999 | 1,189 (17.8%) | 79 (5.0%) |
| $2,000 to $2,499 | 820 (12.3%) | 0 (0.0%) |
| $2,500 to $2,999 | 482 (7.2%) | 10 (0.6%) |
| $3,000 or more | 466 (7.0%) | 0 (0.0%) |
| Total | 6,666 (100.0%) | 1,568 (100.0%) |
Physical Housing Characteristics in Washington County
Housing Structures in Washington County
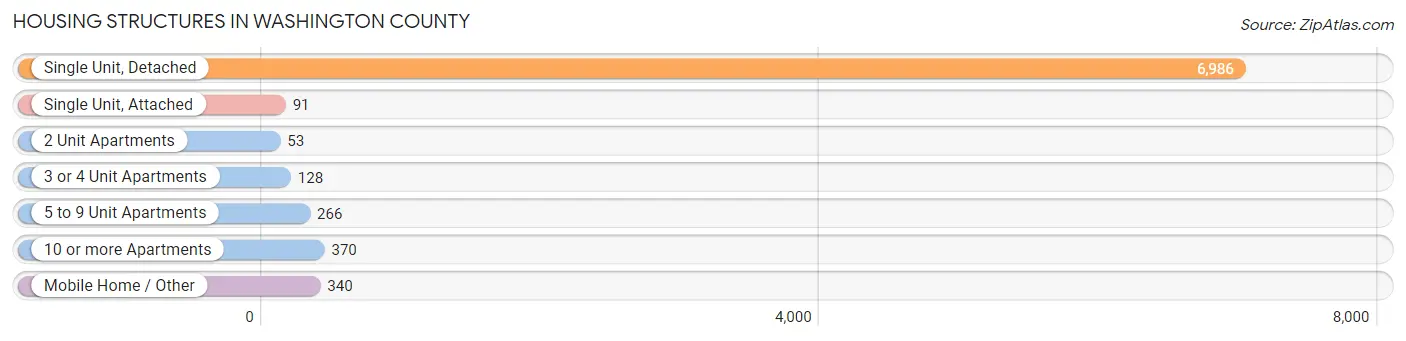
| Structure Type | # Housing Units | % Housing Units |
| Single Unit, Detached | 6,986 | 84.8% |
| Single Unit, Attached | 91 | 1.1% |
| 2 Unit Apartments | 53 | 0.6% |
| 3 or 4 Unit Apartments | 128 | 1.5% |
| 5 to 9 Unit Apartments | 266 | 3.2% |
| 10 or more Apartments | 370 | 4.5% |
| Mobile Home / Other | 340 | 4.1% |
| Total | 8,234 | 100.0% |
Housing Structures by Occupancy in Washington County
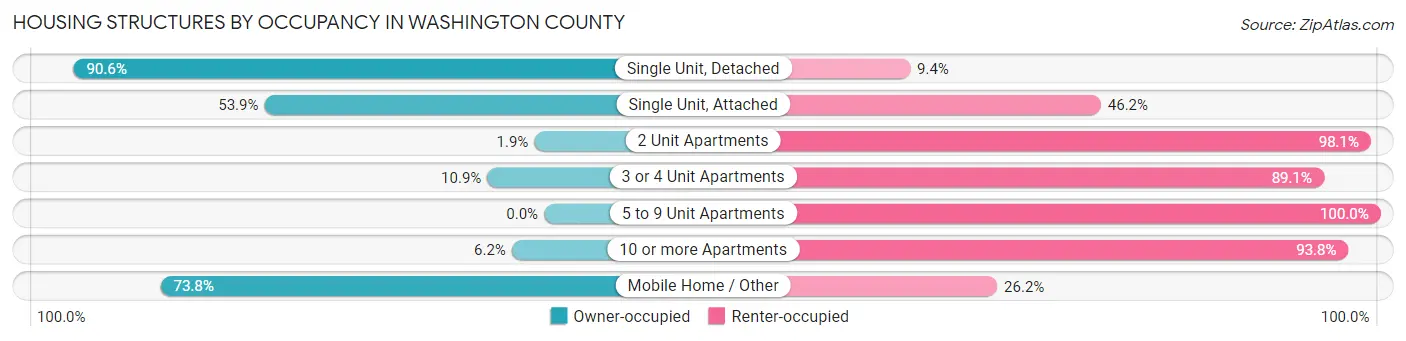
| Structure Type | Owner-occupied | Renter-occupied |
| Single Unit, Detached | 6,328 (90.6%) | 658 (9.4%) |
| Single Unit, Attached | 49 (53.8%) | 42 (46.2%) |
| 2 Unit Apartments | 1 (1.9%) | 52 (98.1%) |
| 3 or 4 Unit Apartments | 14 (10.9%) | 114 (89.1%) |
| 5 to 9 Unit Apartments | 0 (0.0%) | 266 (100.0%) |
| 10 or more Apartments | 23 (6.2%) | 347 (93.8%) |
| Mobile Home / Other | 251 (73.8%) | 89 (26.2%) |
| Total | 6,666 (81.0%) | 1,568 (19.0%) |
Housing Structures by Number of Rooms in Washington County
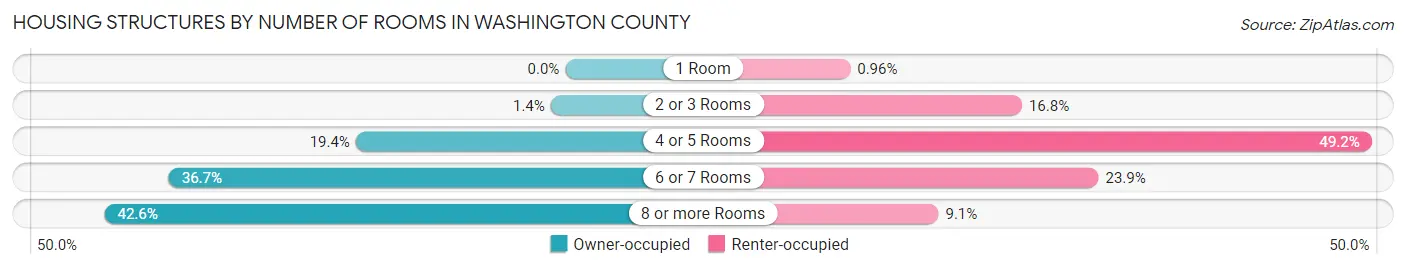
| Number of Rooms | Owner-occupied | Renter-occupied |
| 1 Room | 0 (0.0%) | 15 (1.0%) |
| 2 or 3 Rooms | 90 (1.3%) | 264 (16.8%) |
| 4 or 5 Rooms | 1,292 (19.4%) | 771 (49.2%) |
| 6 or 7 Rooms | 2,444 (36.7%) | 375 (23.9%) |
| 8 or more Rooms | 2,840 (42.6%) | 143 (9.1%) |
| Total | 6,666 (100.0%) | 1,568 (100.0%) |
Housing Structure by Heating Type in Washington County
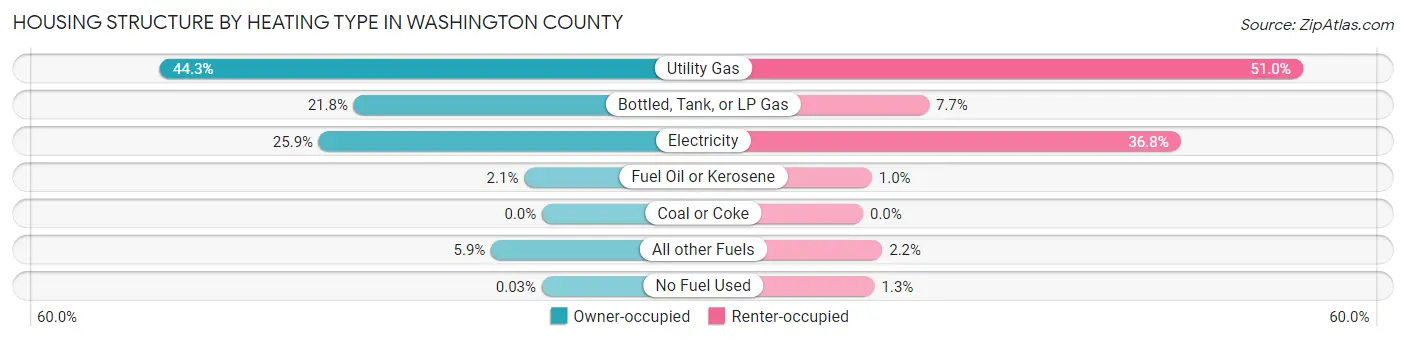
| Heating Type | Owner-occupied | Renter-occupied |
| Utility Gas | 2,952 (44.3%) | 799 (51.0%) |
| Bottled, Tank, or LP Gas | 1,456 (21.8%) | 120 (7.6%) |
| Electricity | 1,725 (25.9%) | 577 (36.8%) |
| Fuel Oil or Kerosene | 138 (2.1%) | 16 (1.0%) |
| Coal or Coke | 0 (0.0%) | 0 (0.0%) |
| All other Fuels | 393 (5.9%) | 35 (2.2%) |
| No Fuel Used | 2 (0.0%) | 21 (1.3%) |
| Total | 6,666 (100.0%) | 1,568 (100.0%) |
Household Vehicle Usage in Washington County
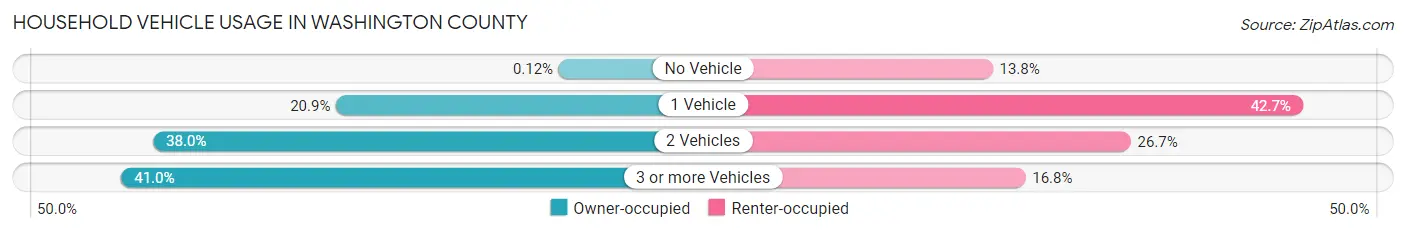
| Vehicles per Household | Owner-occupied | Renter-occupied |
| No Vehicle | 8 (0.1%) | 216 (13.8%) |
| 1 Vehicle | 1,394 (20.9%) | 670 (42.7%) |
| 2 Vehicles | 2,533 (38.0%) | 418 (26.7%) |
| 3 or more Vehicles | 2,731 (41.0%) | 264 (16.8%) |
| Total | 6,666 (100.0%) | 1,568 (100.0%) |
Real Estate & Mortgages in Washington County
Real Estate and Mortgage Overview in Washington County
| Characteristic | Without Mortgage | With Mortgage |
| Housing Units | 2,347 | 4,319 |
| Median Property Value | $231,000 | $285,300 |
| Median Household Income | $76,226 | $1,384 |
| Monthly Housing Costs | $708 | $455 |
| Real Estate Taxes | $3,506 | $41 |
Property Value by Mortgage Status in Washington County
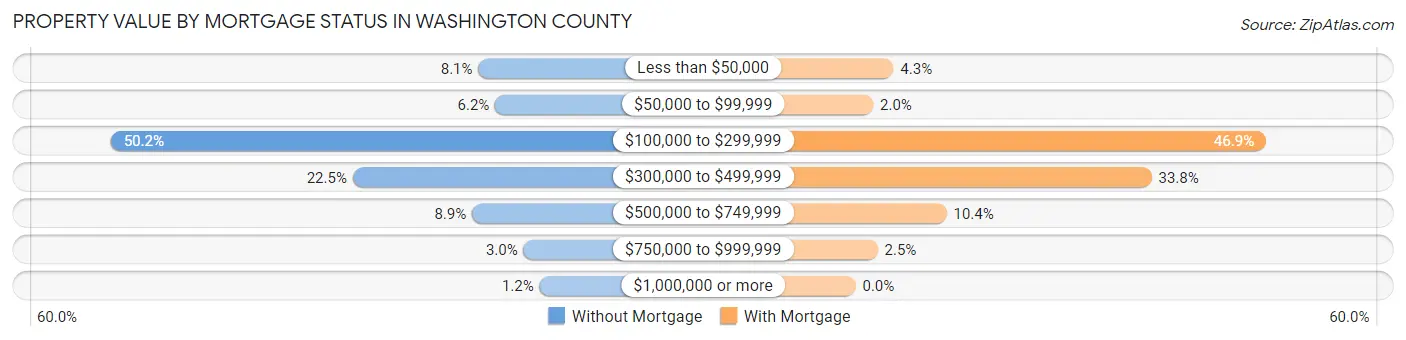
| Property Value | Without Mortgage | With Mortgage |
| Less than $50,000 | 191 (8.1%) | 187 (4.3%) |
| $50,000 to $99,999 | 146 (6.2%) | 87 (2.0%) |
| $100,000 to $299,999 | 1,177 (50.1%) | 2,026 (46.9%) |
| $300,000 to $499,999 | 528 (22.5%) | 1,461 (33.8%) |
| $500,000 to $749,999 | 208 (8.9%) | 449 (10.4%) |
| $750,000 to $999,999 | 70 (3.0%) | 109 (2.5%) |
| $1,000,000 or more | 27 (1.1%) | 0 (0.0%) |
| Total | 2,347 (100.0%) | 4,319 (100.0%) |
Household Income by Mortgage Status in Washington County
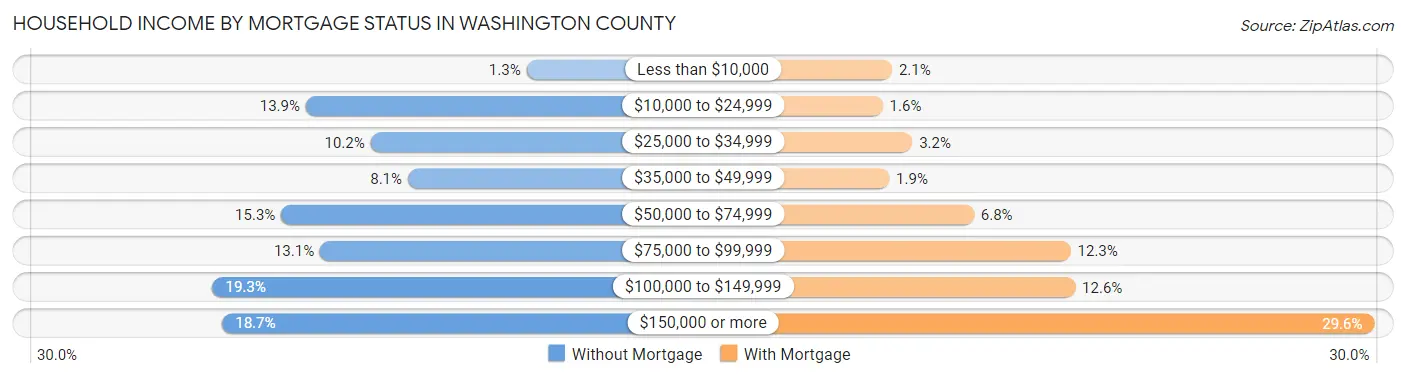
| Household Income | Without Mortgage | With Mortgage |
| Less than $10,000 | 31 (1.3%) | 90 (2.1%) |
| $10,000 to $24,999 | 327 (13.9%) | 67 (1.5%) |
| $25,000 to $34,999 | 240 (10.2%) | 140 (3.2%) |
| $35,000 to $49,999 | 190 (8.1%) | 83 (1.9%) |
| $50,000 to $74,999 | 360 (15.3%) | 292 (6.8%) |
| $75,000 to $99,999 | 308 (13.1%) | 531 (12.3%) |
| $100,000 to $149,999 | 452 (19.3%) | 542 (12.6%) |
| $150,000 or more | 439 (18.7%) | 1,280 (29.6%) |
| Total | 2,347 (100.0%) | 4,319 (100.0%) |
Property Value to Household Income Ratio in Washington County
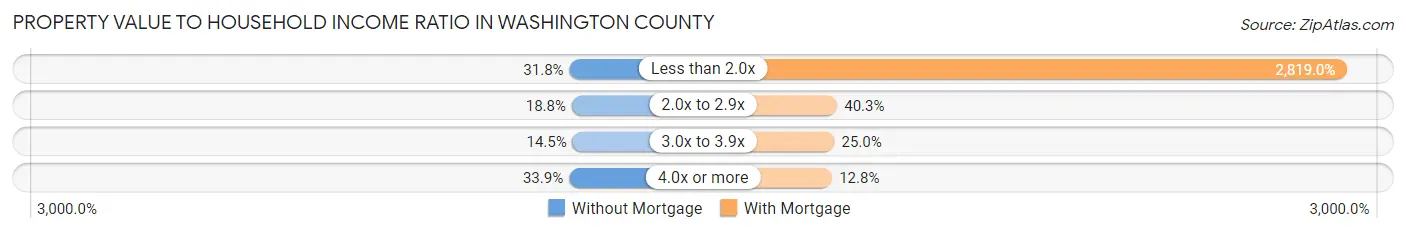
| Value-to-Income Ratio | Without Mortgage | With Mortgage |
| Less than 2.0x | 746 (31.8%) | 121,754 (2,819.0%) |
| 2.0x to 2.9x | 442 (18.8%) | 1,742 (40.3%) |
| 3.0x to 3.9x | 341 (14.5%) | 1,081 (25.0%) |
| 4.0x or more | 795 (33.9%) | 551 (12.8%) |
| Total | 2,347 (100.0%) | 4,319 (100.0%) |
Real Estate Taxes by Mortgage Status in Washington County
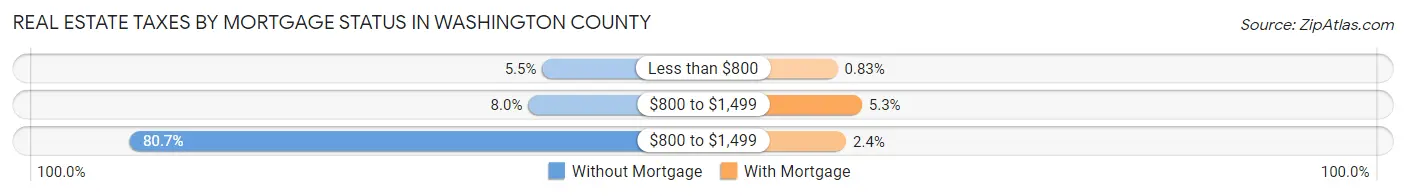
| Property Taxes | Without Mortgage | With Mortgage |
| Less than $800 | 128 (5.4%) | 36 (0.8%) |
| $800 to $1,499 | 188 (8.0%) | 227 (5.3%) |
| $800 to $1,499 | 1,895 (80.7%) | 103 (2.4%) |
| Total | 2,347 (100.0%) | 4,319 (100.0%) |
Health & Disability in Washington County
Health Insurance Coverage by Age in Washington County
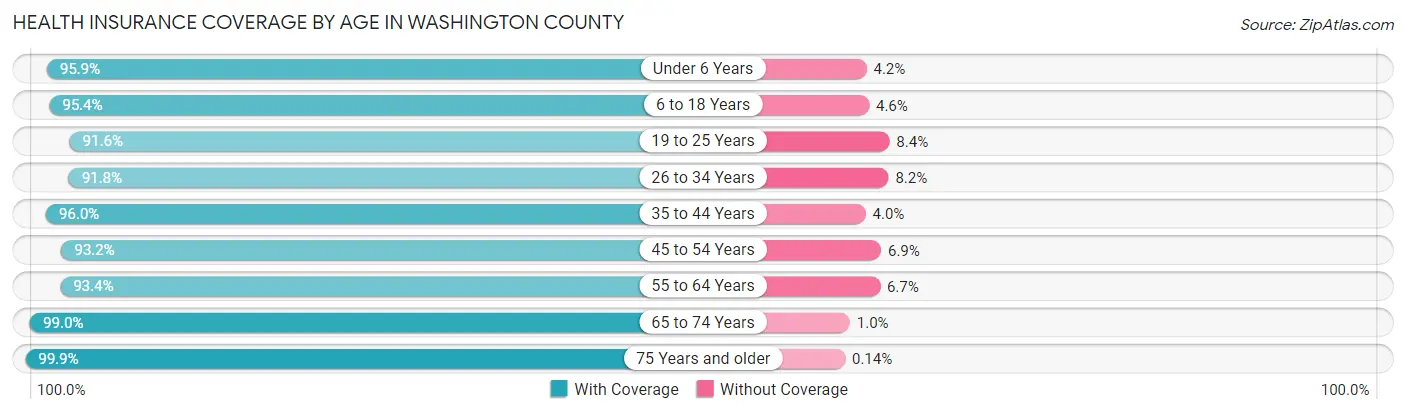
| Age Bracket | With Coverage | Without Coverage |
| Under 6 Years | 1,315 (95.9%) | 57 (4.2%) |
| 6 to 18 Years | 3,580 (95.4%) | 173 (4.6%) |
| 19 to 25 Years | 1,601 (91.6%) | 147 (8.4%) |
| 26 to 34 Years | 1,547 (91.8%) | 139 (8.2%) |
| 35 to 44 Years | 2,584 (96.0%) | 107 (4.0%) |
| 45 to 54 Years | 2,408 (93.1%) | 177 (6.9%) |
| 55 to 64 Years | 2,947 (93.3%) | 210 (6.7%) |
| 65 to 74 Years | 2,286 (99.0%) | 24 (1.0%) |
| 75 Years and older | 1,408 (99.9%) | 2 (0.1%) |
| Total | 19,676 (95.0%) | 1,036 (5.0%) |
Health Insurance Coverage by Citizenship Status in Washington County
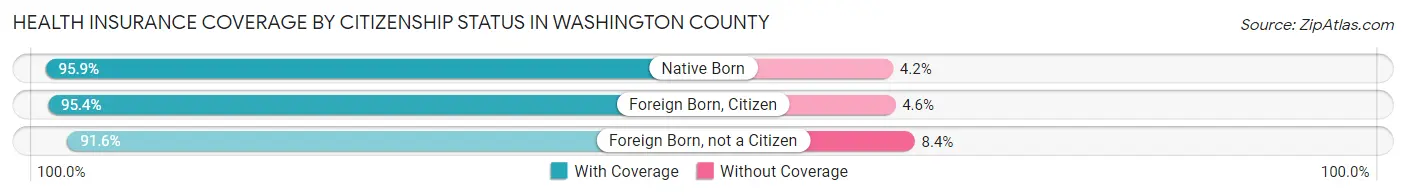
| Citizenship Status | With Coverage | Without Coverage |
| Native Born | 1,315 (95.9%) | 57 (4.2%) |
| Foreign Born, Citizen | 3,580 (95.4%) | 173 (4.6%) |
| Foreign Born, not a Citizen | 1,601 (91.6%) | 147 (8.4%) |
Health Insurance Coverage by Household Income in Washington County
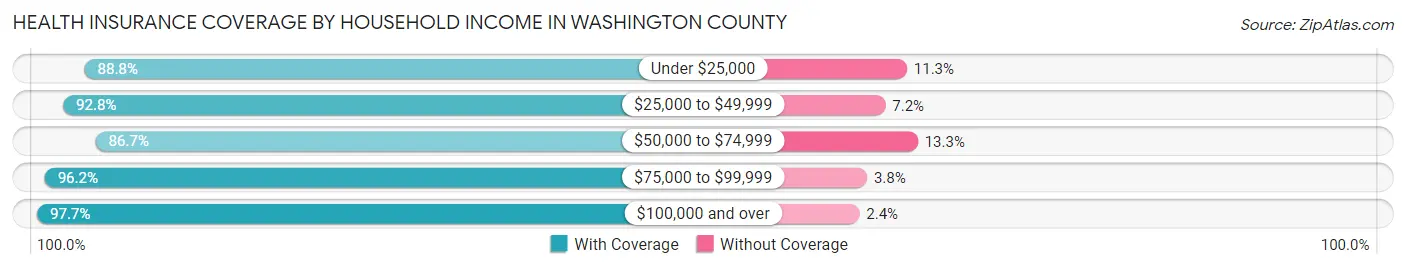
| Household Income | With Coverage | Without Coverage |
| Under $25,000 | 1,294 (88.7%) | 164 (11.3%) |
| $25,000 to $49,999 | 2,247 (92.8%) | 175 (7.2%) |
| $50,000 to $74,999 | 2,088 (86.7%) | 320 (13.3%) |
| $75,000 to $99,999 | 2,319 (96.2%) | 91 (3.8%) |
| $100,000 and over | 11,657 (97.7%) | 280 (2.4%) |
Public vs Private Health Insurance Coverage by Age in Washington County
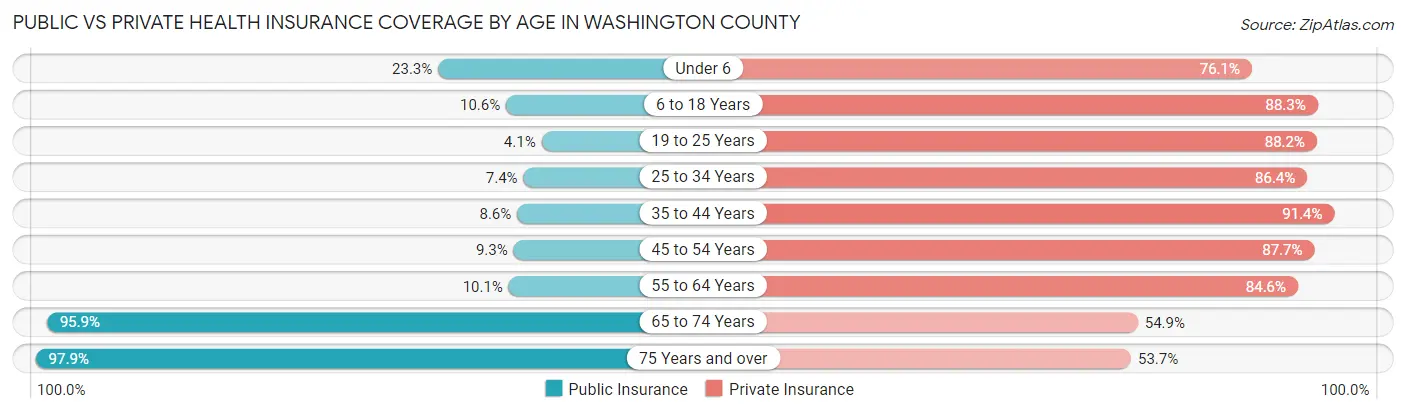
| Age Bracket | Public Insurance | Private Insurance |
| Under 6 | 319 (23.3%) | 1,044 (76.1%) |
| 6 to 18 Years | 399 (10.6%) | 3,314 (88.3%) |
| 19 to 25 Years | 71 (4.1%) | 1,541 (88.2%) |
| 25 to 34 Years | 125 (7.4%) | 1,456 (86.4%) |
| 35 to 44 Years | 231 (8.6%) | 2,460 (91.4%) |
| 45 to 54 Years | 239 (9.2%) | 2,267 (87.7%) |
| 55 to 64 Years | 320 (10.1%) | 2,672 (84.6%) |
| 65 to 74 Years | 2,215 (95.9%) | 1,269 (54.9%) |
| 75 Years and over | 1,381 (97.9%) | 757 (53.7%) |
| Total | 5,300 (25.6%) | 16,780 (81.0%) |
Disability Status by Sex by Age in Washington County
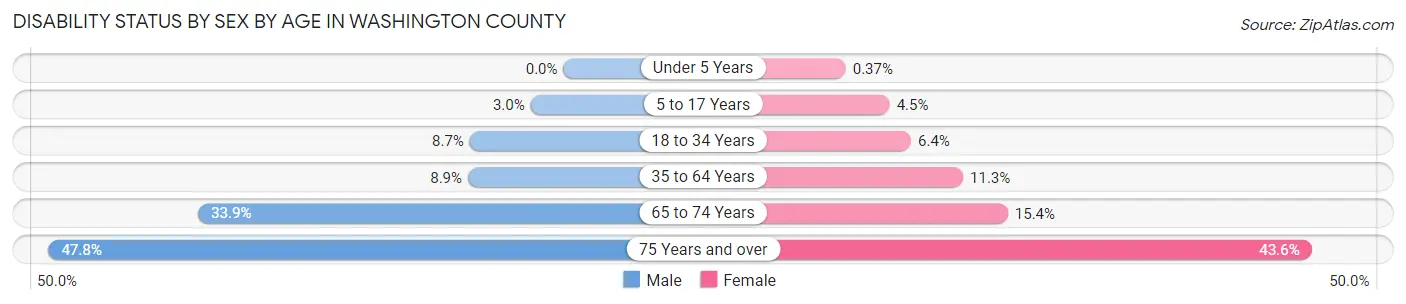
| Age Bracket | Male | Female |
| Under 5 Years | 0 (0.0%) | 2 (0.4%) |
| 5 to 17 Years | 59 (3.0%) | 85 (4.4%) |
| 18 to 34 Years | 152 (8.7%) | 116 (6.4%) |
| 35 to 64 Years | 378 (8.9%) | 469 (11.3%) |
| 65 to 74 Years | 387 (33.9%) | 180 (15.4%) |
| 75 Years and over | 290 (47.8%) | 350 (43.6%) |
Disability Class by Sex by Age in Washington County
Disability Class: Hearing Difficulty
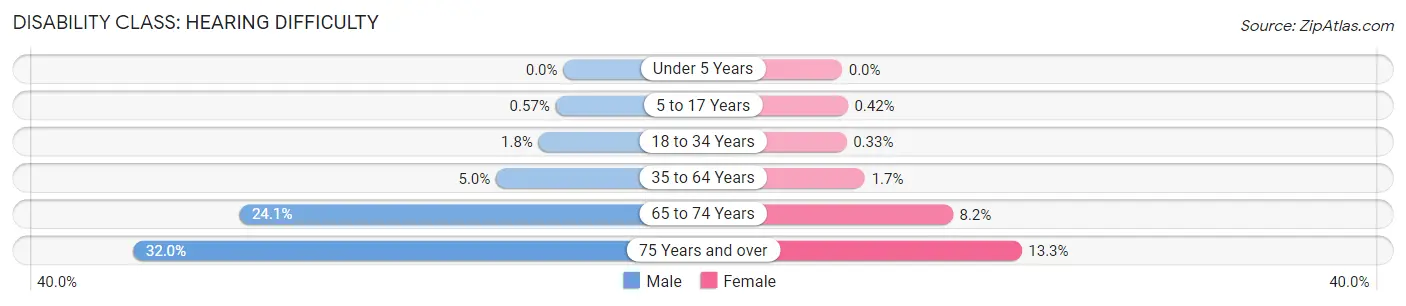
| Age Bracket | Male | Female |
| Under 5 Years | 0 (0.0%) | 0 (0.0%) |
| 5 to 17 Years | 11 (0.6%) | 8 (0.4%) |
| 18 to 34 Years | 32 (1.8%) | 6 (0.3%) |
| 35 to 64 Years | 213 (5.0%) | 71 (1.7%) |
| 65 to 74 Years | 275 (24.1%) | 96 (8.2%) |
| 75 Years and over | 194 (32.0%) | 107 (13.3%) |
Disability Class: Vision Difficulty
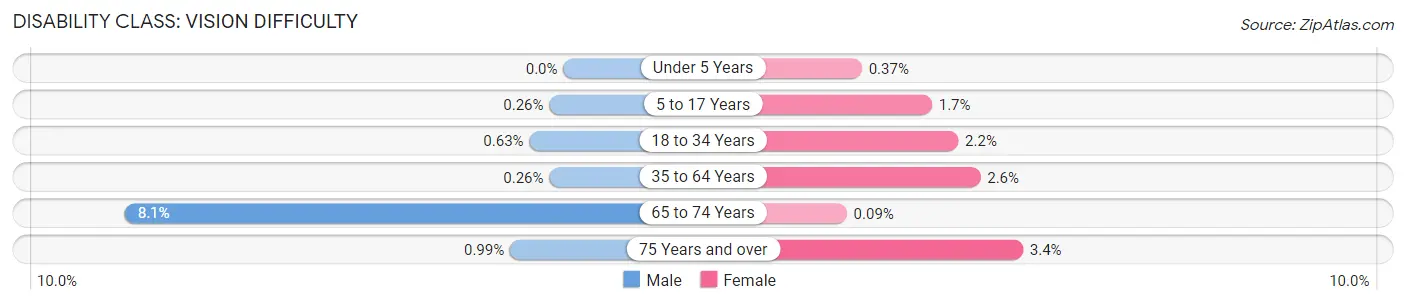
| Age Bracket | Male | Female |
| Under 5 Years | 0 (0.0%) | 2 (0.4%) |
| 5 to 17 Years | 5 (0.3%) | 32 (1.7%) |
| 18 to 34 Years | 11 (0.6%) | 39 (2.2%) |
| 35 to 64 Years | 11 (0.3%) | 107 (2.6%) |
| 65 to 74 Years | 93 (8.1%) | 1 (0.1%) |
| 75 Years and over | 6 (1.0%) | 27 (3.4%) |
Disability Class: Cognitive Difficulty
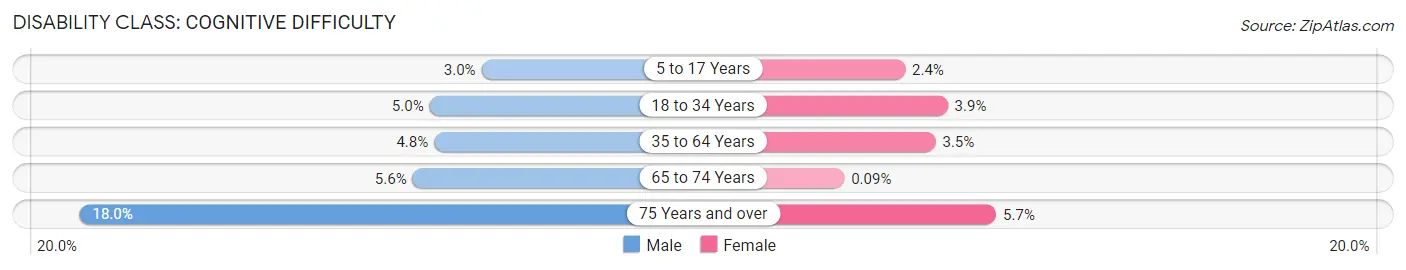
| Age Bracket | Male | Female |
| 5 to 17 Years | 59 (3.0%) | 45 (2.4%) |
| 18 to 34 Years | 87 (5.0%) | 71 (3.9%) |
| 35 to 64 Years | 205 (4.8%) | 145 (3.5%) |
| 65 to 74 Years | 64 (5.6%) | 1 (0.1%) |
| 75 Years and over | 109 (18.0%) | 46 (5.7%) |
Disability Class: Ambulatory Difficulty
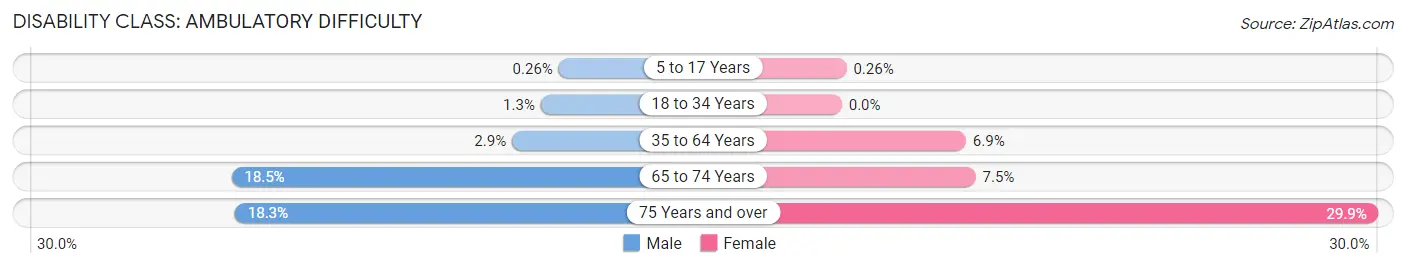
| Age Bracket | Male | Female |
| 5 to 17 Years | 5 (0.3%) | 5 (0.3%) |
| 18 to 34 Years | 22 (1.3%) | 0 (0.0%) |
| 35 to 64 Years | 122 (2.9%) | 288 (6.9%) |
| 65 to 74 Years | 211 (18.5%) | 87 (7.4%) |
| 75 Years and over | 111 (18.3%) | 240 (29.9%) |
Disability Class: Self-Care Difficulty
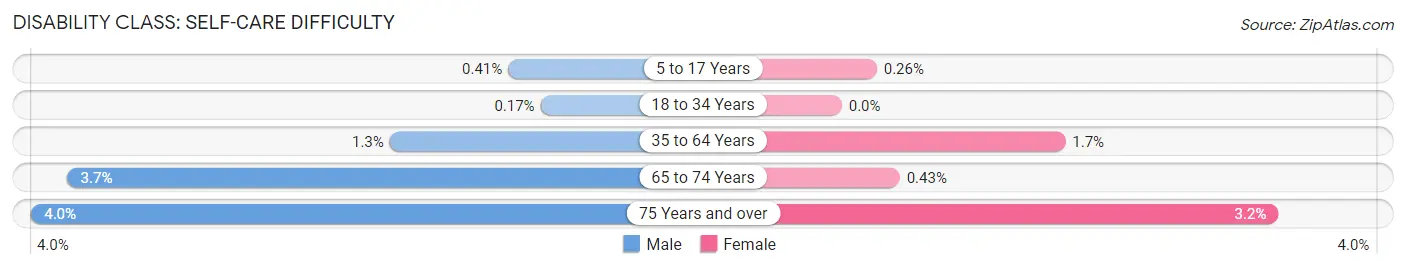
| Age Bracket | Male | Female |
| 5 to 17 Years | 8 (0.4%) | 5 (0.3%) |
| 18 to 34 Years | 3 (0.2%) | 0 (0.0%) |
| 35 to 64 Years | 55 (1.3%) | 69 (1.7%) |
| 65 to 74 Years | 42 (3.7%) | 5 (0.4%) |
| 75 Years and over | 24 (4.0%) | 26 (3.2%) |
Technology Access in Washington County
Computing Device Access in Washington County
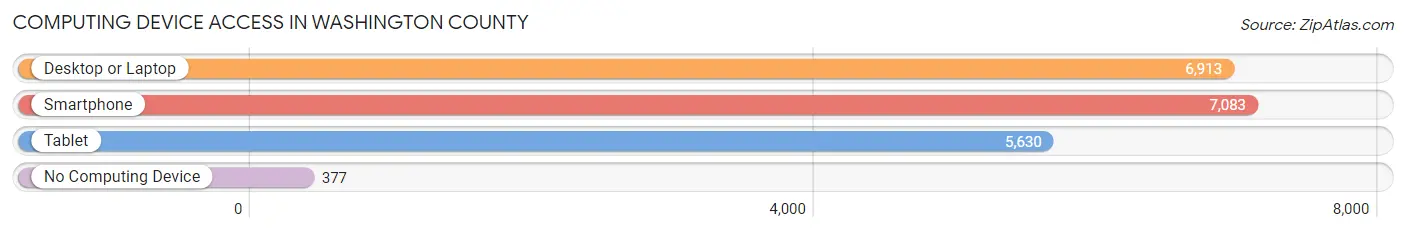
| Device Type | # Households | % Households |
| Desktop or Laptop | 6,913 | 84.0% |
| Smartphone | 7,083 | 86.0% |
| Tablet | 5,630 | 68.4% |
| No Computing Device | 377 | 4.6% |
| Total | 8,234 | 100.0% |
Internet Access in Washington County
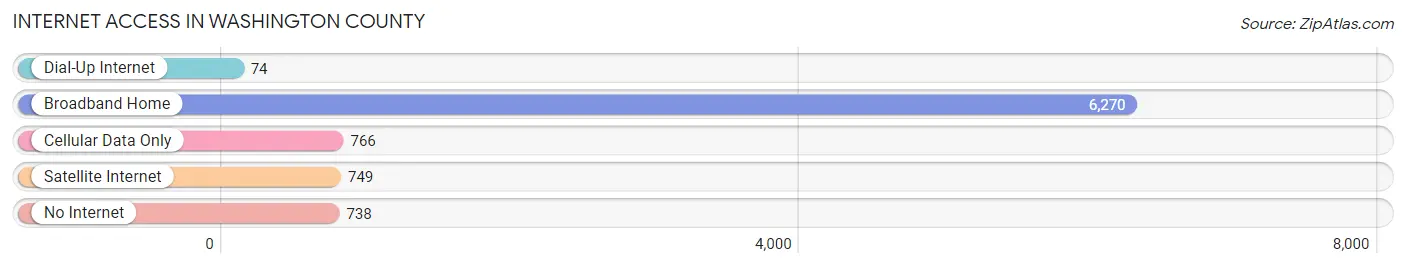
| Internet Type | # Households | % Households |
| Dial-Up Internet | 74 | 0.9% |
| Broadband Home | 6,270 | 76.1% |
| Cellular Data Only | 766 | 9.3% |
| Satellite Internet | 749 | 9.1% |
| No Internet | 738 | 9.0% |
| Total | 8,234 | 100.0% |
Washington County Summary
Introduction
Washington County is located in the eastern part of Nebraska, and is the second smallest county in the state. It is bordered by Burt County to the north, Dodge County to the east, Saunders County to the south, and Dodge and Saunders Counties to the west. The county seat is Blair, and the largest city is Fort Calhoun. The county was named after George Washington, the first president of the United States.
History
Washington County was established in 1854, and was originally part of Burt County. It was named after George Washington, the first president of the United States. The county was originally inhabited by Native Americans, including the Omaha, Otoe, and Pawnee tribes. The first settlers arrived in the area in the early 1800s, and the county was officially organized in 1854.
The county was primarily an agricultural area, with the main crops being corn, wheat, and hay. The county also had a thriving livestock industry, with cattle, hogs, and sheep being raised in the area. The county also had a number of small businesses, including a flour mill, a sawmill, and a brickyard.
In the late 1800s, the county began to experience a population boom, as more settlers moved to the area. This population growth was due in part to the construction of the Union Pacific Railroad, which ran through the county. The railroad brought new jobs and economic opportunities to the area, and the population continued to grow.
Geography
Washington County is located in the eastern part of Nebraska, and is the second smallest county in the state. It is bordered by Burt County to the north, Dodge County to the east, Saunders County to the south, and Dodge and Saunders Counties to the west. The county has a total area of 441 square miles, of which 439 square miles is land and 2 square miles is water.
The county is mostly flat, with some rolling hills in the northern part of the county. The county is drained by the Elkhorn River, which flows through the county from north to south. The county also has several small lakes and ponds, including Lake Wanahoo, which is located in the northern part of the county.
Economy
Washington County has a diverse economy, with a mix of agriculture, manufacturing, and services. The county is home to several large employers, including the Fort Calhoun Nuclear Power Plant, which is the largest employer in the county. Other major employers include the Blair Community Schools, the Washington County Hospital, and the Washington County Courthouse.
Agriculture is the main economic driver in the county, with corn, soybeans, and wheat being the main crops. The county also has a thriving livestock industry, with cattle, hogs, and sheep being raised in the area.
Demographics
As of the 2010 census, the population of Washington County was 20,234, making it the second smallest county in Nebraska. The population density was 46 people per square mile. The racial makeup of the county was 95.3% White, 0.7% African American, 0.4% Native American, 0.5% Asian, 0.1% Pacific Islander, 1.7% from other races, and 1.3% from two or more races. Hispanic or Latino of any race were 3.3% of the population.
The median income for a household in the county was $50,945, and the median income for a family was $60,945. The per capita income for the county was $24,945. About 6.3% of families and 8.3% of the population were below the poverty line, including 10.3% of those under age 18 and 6.3% of those age 65 or over.
Conclusion
Washington County is a small county located in the eastern part of Nebraska. It has a diverse economy, with a mix of agriculture, manufacturing, and services. The county has a population of 20,234, and the median income for a household is $50,945. The county is mostly flat, with some rolling hills in the northern part of the county. The county is drained by the Elkhorn River, and is home to several large employers, including the Fort Calhoun Nuclear Power Plant.
Common Questions
What is the Total Population of Washington County?
Total Population of Washington County is 20,884.
What is the Total Male Population of Washington County?
Total Male Population of Washington County is 10,389.
What is the Total Female Population of Washington County?
Total Female Population of Washington County is 10,495.
What is the Ratio of Males per 100 Females in Washington County?
There are 98.99 Males per 100 Females in Washington County.
What is the Ratio of Females per 100 Males in Washington County?
There are 101.02 Females per 100 Males in Washington County.
What is the Median Population Age in Washington County?
Median Population Age in Washington County is 41.6 Years.
What is the Average Family Size in Washington County
Average Family Size in Washington County is 3.0 People.
What is the Average Household Size in Washington County
Average Household Size in Washington County is 2.5 People.
What is Per Capita Income in Washington County?
Per Capita income in Washington County is $44,206.
What is the Median Family Income in Washington County?
Median Family Income in Washington County is $115,919.
What is the Median Household income in Washington County?
Median Household Income in Washington County is $89,671.
What is Income or Wage Gap in Washington County?
Income or Wage Gap in Washington County is 39.8%.
Women in Washington County earn 60.2 cents for every dollar earned by a man.
What is Inequality or Gini Index in Washington County?
Inequality or Gini Index in Washington County is 0.41.
How Large is the Labor Force in Washington County?
There are 11,294 People in the Labor Forcein in Washington County.
What is the Percentage of People in the Labor Force in Washington County?
68.1% of People are in the Labor Force in Washington County.
What is the Unemployment Rate in Washington County?
Unemployment Rate in Washington County is 2.0%.