Saunders County, NE
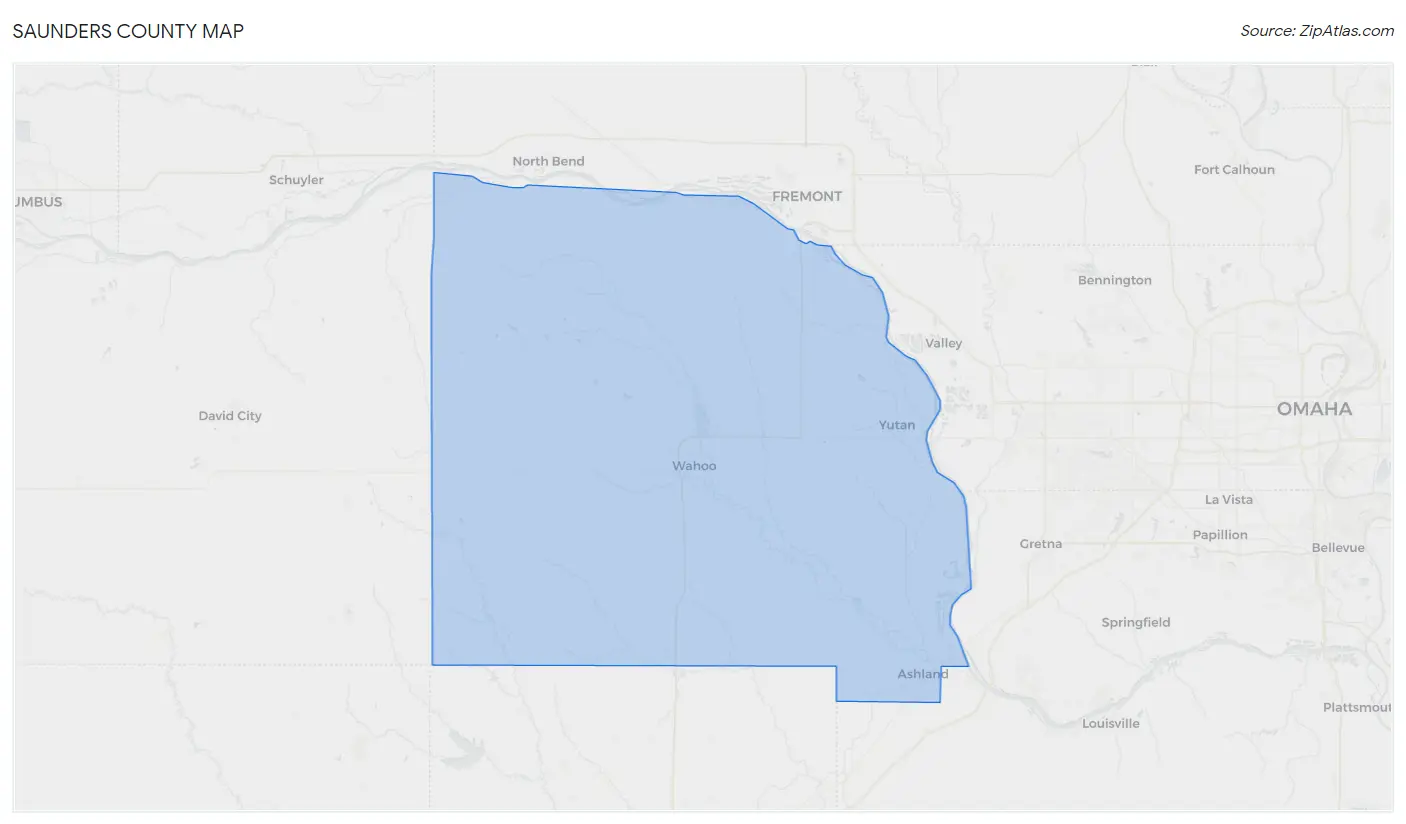
Saunders County Map
Saunders County Overview
22,374
TOTAL POPULATION
11,495
MALE POPULATION
10,879
FEMALE POPULATION
105.66
MALES / 100 FEMALES
94.64
FEMALES / 100 MALES
40.4
MEDIAN AGE
3.0
AVG FAMILY SIZE
2.5
AVG HOUSEHOLD SIZE
$41,364
PER CAPITA INCOME
$102,668
AVG FAMILY INCOME
$84,474
AVG HOUSEHOLD INCOME
34.0%
WAGE / INCOME GAP [ % ]
66.0¢/ $1
WAGE / INCOME GAP [ $ ]
$11,194
FAMILY INCOME DEFICIT
0.41
INEQUALITY / GINI INDEX
12,199
LABOR FORCE [ PEOPLE ]
69.2%
PERCENT IN LABOR FORCE
2.4%
UNEMPLOYMENT RATE
Saunders County Area Codes
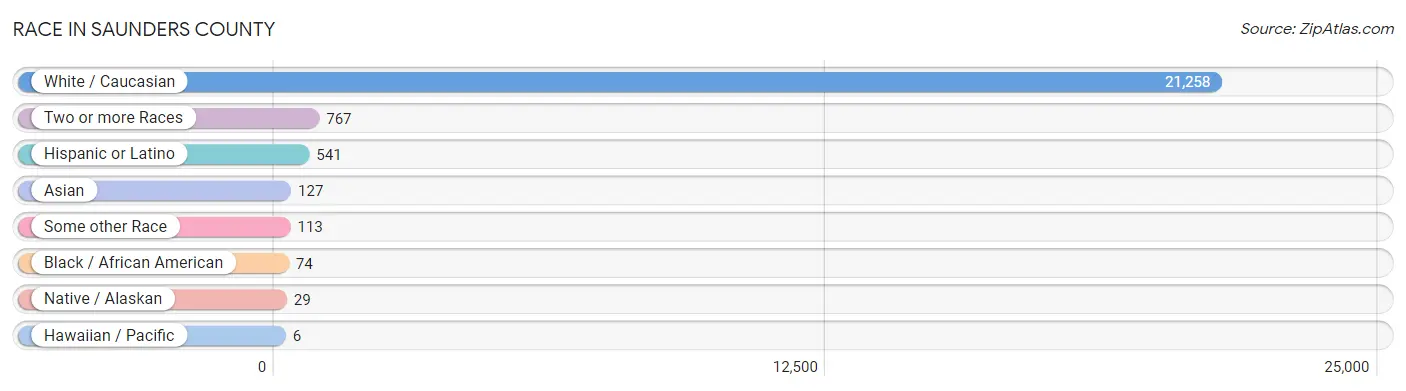
Race in Saunders County
The most populous races in Saunders County are White / Caucasian (21,258 | 95.0%), Two or more Races (767 | 3.4%), and Hispanic or Latino (541 | 2.4%).
| Race | # Population | % Population |
| Asian | 127 | 0.6% |
| Black / African American | 74 | 0.3% |
| Hawaiian / Pacific | 6 | 0.0% |
| Hispanic or Latino | 541 | 2.4% |
| Native / Alaskan | 29 | 0.1% |
| White / Caucasian | 21,258 | 95.0% |
| Two or more Races | 767 | 3.4% |
| Some other Race | 113 | 0.5% |
| Total | 22,374 | 100.0% |
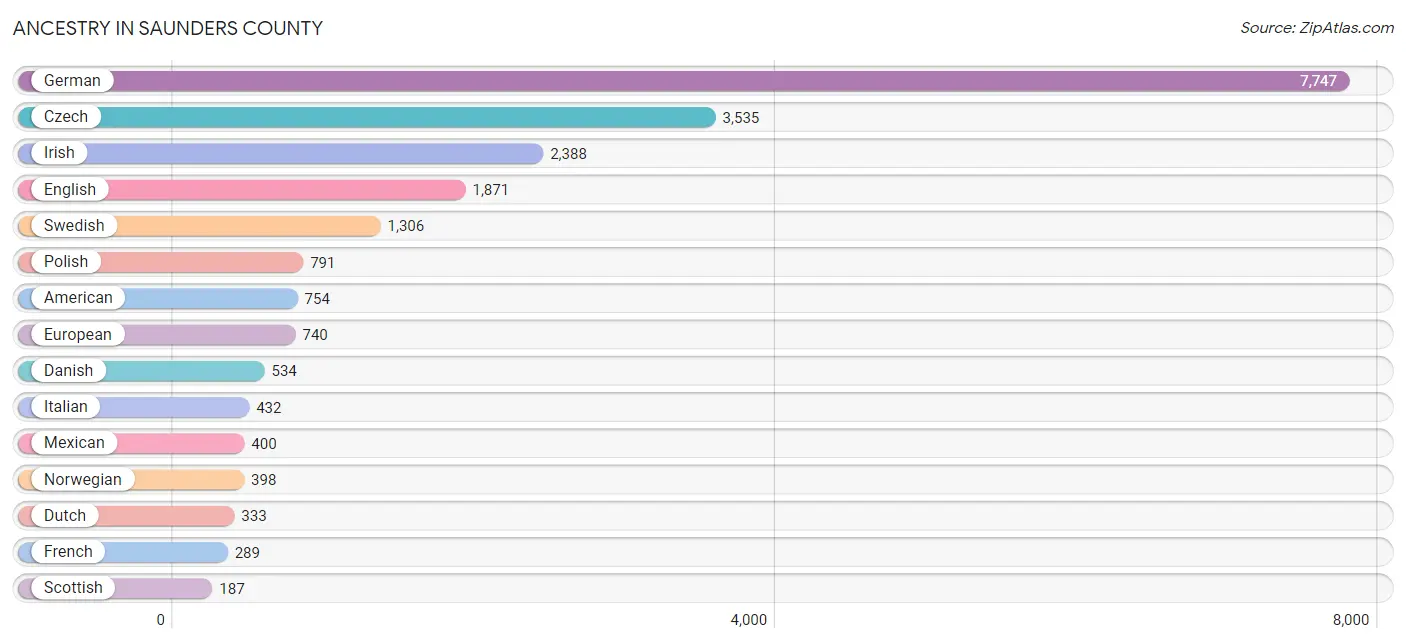
Ancestry in Saunders County
The most populous ancestries reported in Saunders County are German (7,747 | 34.6%), Czech (3,535 | 15.8%), Irish (2,388 | 10.7%), English (1,871 | 8.4%), and Swedish (1,306 | 5.8%), together accounting for 75.3% of all Saunders County residents.
| Ancestry | # Population | % Population |
| African | 21 | 0.1% |
| American | 754 | 3.4% |
| Apache | 4 | 0.0% |
| Arab | 64 | 0.3% |
| Argentinean | 6 | 0.0% |
| Austrian | 23 | 0.1% |
| British | 56 | 0.3% |
| Burmese | 20 | 0.1% |
| Celtic | 4 | 0.0% |
| Central American | 73 | 0.3% |
| Cherokee | 26 | 0.1% |
| Chickasaw | 1 | 0.0% |
| Choctaw | 13 | 0.1% |
| Croatian | 14 | 0.1% |
| Cuban | 13 | 0.1% |
| Czech | 3,535 | 15.8% |
| Czechoslovakian | 185 | 0.8% |
| Danish | 534 | 2.4% |
| Dominican | 3 | 0.0% |
| Dutch | 333 | 1.5% |
| Eastern European | 70 | 0.3% |
| Egyptian | 14 | 0.1% |
| English | 1,871 | 8.4% |
| European | 740 | 3.3% |
| Finnish | 28 | 0.1% |
| French | 289 | 1.3% |
| French Canadian | 111 | 0.5% |
| German | 7,747 | 34.6% |
| Greek | 78 | 0.4% |
| Guatemalan | 66 | 0.3% |
| Honduran | 5 | 0.0% |
| Hungarian | 43 | 0.2% |
| Indian (Asian) | 39 | 0.2% |
| Iranian | 58 | 0.3% |
| Irish | 2,388 | 10.7% |
| Israeli | 33 | 0.2% |
| Italian | 432 | 1.9% |
| Korean | 22 | 0.1% |
| Latvian | 3 | 0.0% |
| Lebanese | 20 | 0.1% |
| Lithuanian | 7 | 0.0% |
| Luxembourger | 12 | 0.1% |
| Mexican | 400 | 1.8% |
| Mexican American Indian | 32 | 0.1% |
| Native Hawaiian | 5 | 0.0% |
| Northern European | 37 | 0.2% |
| Norwegian | 398 | 1.8% |
| Panamanian | 2 | 0.0% |
| Pennsylvania German | 19 | 0.1% |
| Polish | 791 | 3.5% |
| Portuguese | 1 | 0.0% |
| Puerto Rican | 3 | 0.0% |
| Romanian | 56 | 0.3% |
| Russian | 27 | 0.1% |
| Samoan | 6 | 0.0% |
| Scandinavian | 119 | 0.5% |
| Scotch-Irish | 161 | 0.7% |
| Scottish | 187 | 0.8% |
| Serbian | 6 | 0.0% |
| Shoshone | 2 | 0.0% |
| Sioux | 32 | 0.1% |
| South African | 3 | 0.0% |
| South American | 6 | 0.0% |
| Spaniard | 17 | 0.1% |
| Spanish | 7 | 0.0% |
| Sri Lankan | 94 | 0.4% |
| Subsaharan African | 44 | 0.2% |
| Sudanese | 3 | 0.0% |
| Swedish | 1,306 | 5.8% |
| Swiss | 19 | 0.1% |
| Syrian | 30 | 0.1% |
| Thai | 33 | 0.2% |
| Ukrainian | 28 | 0.1% |
| Welsh | 121 | 0.5% | View All 74 Rows |
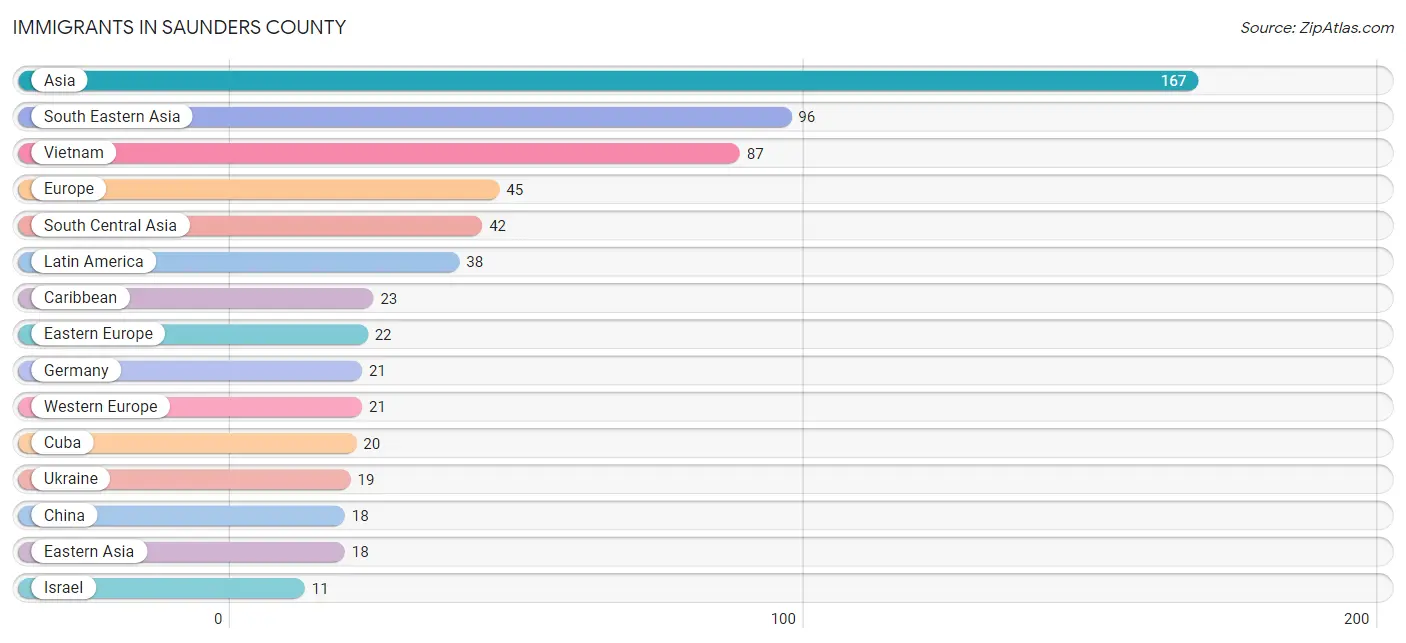
Immigrants in Saunders County
The most numerous immigrant groups reported in Saunders County came from Asia (167 | 0.7%), South Eastern Asia (96 | 0.4%), Vietnam (87 | 0.4%), Europe (45 | 0.2%), and South Central Asia (42 | 0.2%), together accounting for 2.0% of all Saunders County residents.
| Immigration Origin | # Population | % Population |
| Africa | 3 | 0.0% |
| Argentina | 6 | 0.0% |
| Asia | 167 | 0.7% |
| Canada | 9 | 0.0% |
| Caribbean | 23 | 0.1% |
| Central America | 9 | 0.0% |
| China | 18 | 0.1% |
| Cuba | 20 | 0.1% |
| Dominican Republic | 3 | 0.0% |
| Eastern Asia | 18 | 0.1% |
| Eastern Europe | 22 | 0.1% |
| Europe | 45 | 0.2% |
| Germany | 21 | 0.1% |
| India | 7 | 0.0% |
| Israel | 11 | 0.1% |
| Latin America | 38 | 0.2% |
| Latvia | 3 | 0.0% |
| Mexico | 9 | 0.0% |
| Northern Europe | 2 | 0.0% |
| Oceania | 6 | 0.0% |
| South America | 6 | 0.0% |
| South Central Asia | 42 | 0.2% |
| South Eastern Asia | 96 | 0.4% |
| Sweden | 2 | 0.0% |
| Thailand | 9 | 0.0% |
| Ukraine | 19 | 0.1% |
| Vietnam | 87 | 0.4% |
| Western Asia | 11 | 0.1% |
| Western Europe | 21 | 0.1% | View All 29 Rows |
Sex and Age in Saunders County
Sex and Age in Saunders County
The most populous age groups in Saunders County are 55 to 59 Years (995 | 8.7%) for men and 55 to 59 Years (882 | 8.1%) for women.
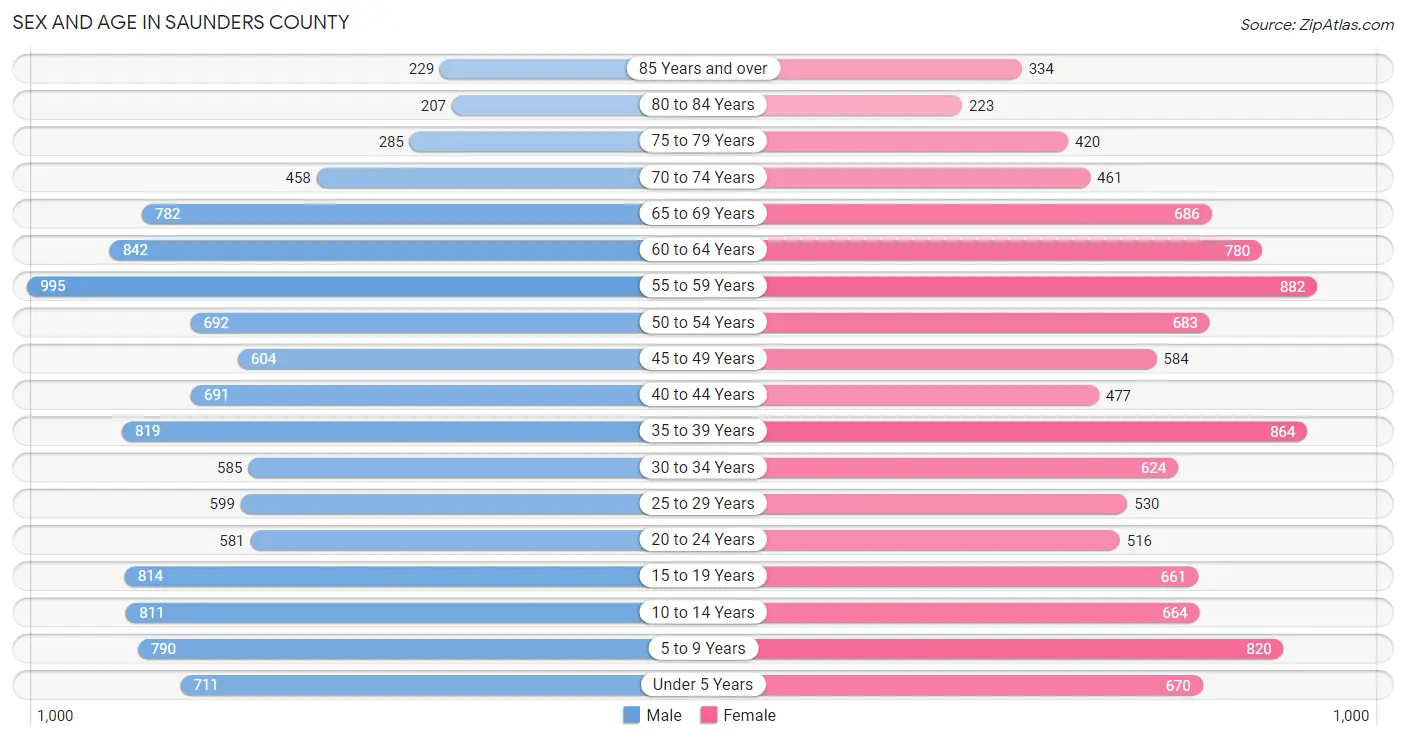
| Age Bracket | Male | Female |
| Under 5 Years | 711 (6.2%) | 670 (6.2%) |
| 5 to 9 Years | 790 (6.9%) | 820 (7.5%) |
| 10 to 14 Years | 811 (7.1%) | 664 (6.1%) |
| 15 to 19 Years | 814 (7.1%) | 661 (6.1%) |
| 20 to 24 Years | 581 (5.1%) | 516 (4.7%) |
| 25 to 29 Years | 599 (5.2%) | 530 (4.9%) |
| 30 to 34 Years | 585 (5.1%) | 624 (5.7%) |
| 35 to 39 Years | 819 (7.1%) | 864 (7.9%) |
| 40 to 44 Years | 691 (6.0%) | 477 (4.4%) |
| 45 to 49 Years | 604 (5.2%) | 584 (5.4%) |
| 50 to 54 Years | 692 (6.0%) | 683 (6.3%) |
| 55 to 59 Years | 995 (8.7%) | 882 (8.1%) |
| 60 to 64 Years | 842 (7.3%) | 780 (7.2%) |
| 65 to 69 Years | 782 (6.8%) | 686 (6.3%) |
| 70 to 74 Years | 458 (4.0%) | 461 (4.2%) |
| 75 to 79 Years | 285 (2.5%) | 420 (3.9%) |
| 80 to 84 Years | 207 (1.8%) | 223 (2.1%) |
| 85 Years and over | 229 (2.0%) | 334 (3.1%) |
| Total | 11,495 (100.0%) | 10,879 (100.0%) |
Families and Households in Saunders County
Median Family Size in Saunders County
The median family size in Saunders County is 3.02 persons per family, with single female/mother families (543 | 8.8%) accounting for the largest median family size of 3.13 persons per family. On the other hand, single male/father families (362 | 5.9%) represent the smallest median family size with 2.25 persons per family.
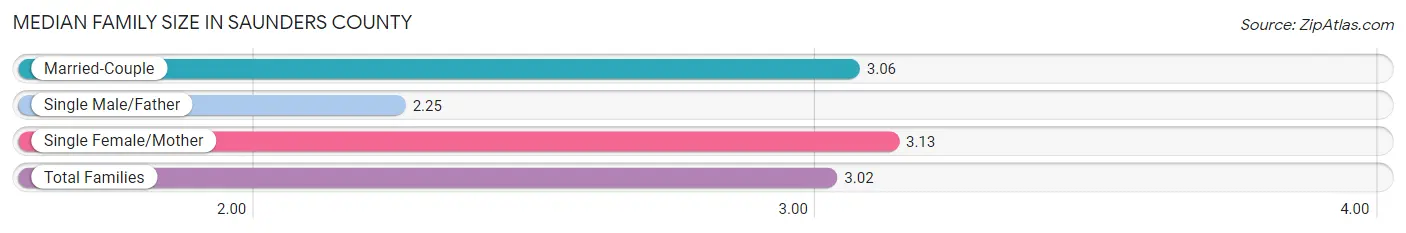
| Family Type | # Families | Family Size |
| Married-Couple | 5,263 (85.3%) | 3.06 |
| Single Male/Father | 362 (5.9%) | 2.25 |
| Single Female/Mother | 543 (8.8%) | 3.13 |
| Total Families | 6,168 (100.0%) | 3.02 |
Median Household Size in Saunders County
The median household size in Saunders County is 2.51 persons per household, with single female/mother households (543 | 6.2%) accounting for the largest median household size of 3.48 persons per household. non-family households (2,621 | 29.8%) represent the smallest median household size with 1.17 persons per household.
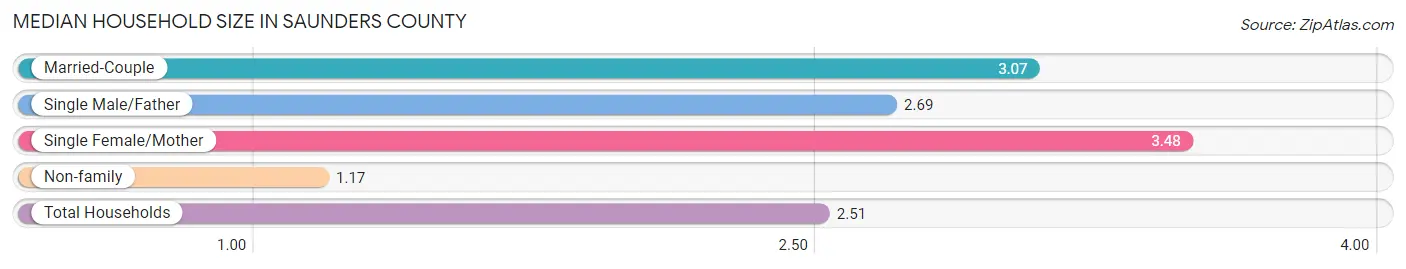
| Household Type | # Households | Household Size |
| Married-Couple | 5,263 (59.9%) | 3.07 |
| Single Male/Father | 362 (4.1%) | 2.69 |
| Single Female/Mother | 543 (6.2%) | 3.48 |
| Non-family | 2,621 (29.8%) | 1.17 |
| Total Households | 8,789 (100.0%) | 2.51 |
Household Size by Marriage Status in Saunders County
Out of a total of 8,789 households in Saunders County, 6,168 (70.2%) are family households, while 2,621 (29.8%) are nonfamily households. The most numerous type of family households are 2-person households, comprising 2,966, and the most common type of nonfamily households are 1-person households, comprising 2,275.
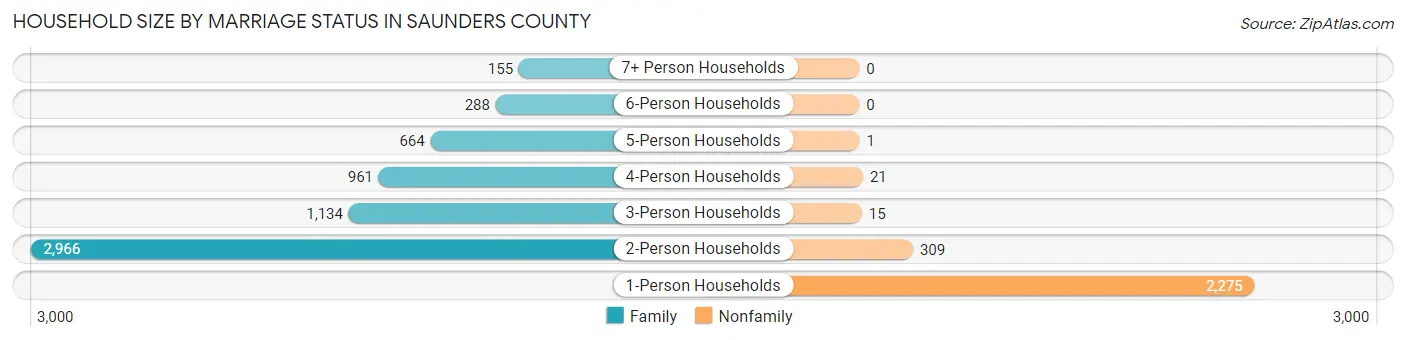
| Household Size | Family Households | Nonfamily Households |
| 1-Person Households | - | 2,275 (25.9%) |
| 2-Person Households | 2,966 (33.8%) | 309 (3.5%) |
| 3-Person Households | 1,134 (12.9%) | 15 (0.2%) |
| 4-Person Households | 961 (10.9%) | 21 (0.2%) |
| 5-Person Households | 664 (7.5%) | 1 (0.0%) |
| 6-Person Households | 288 (3.3%) | 0 (0.0%) |
| 7+ Person Households | 155 (1.8%) | 0 (0.0%) |
| Total | 6,168 (70.2%) | 2,621 (29.8%) |
Female Fertility in Saunders County
Fertility by Age in Saunders County
Average fertility rate in Saunders County is 60.0 births per 1,000 women. Women in the age bracket of 20 to 34 years have the highest fertility rate with 127.0 births per 1,000 women. Women in the age bracket of 20 to 34 years acount for 81.9% of all women with births.
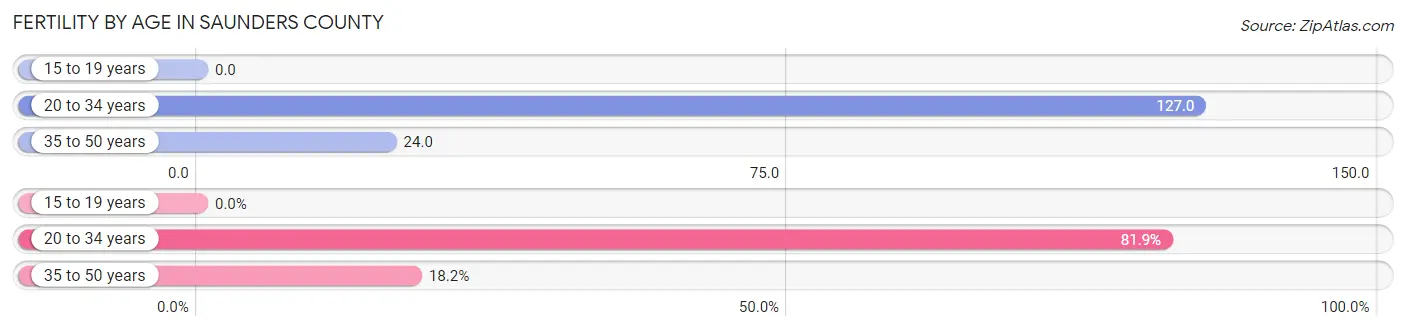
| Age Bracket | Women with Births | Births / 1,000 Women |
| 15 to 19 years | 0 (0.0%) | 0.0 |
| 20 to 34 years | 212 (81.9%) | 127.0 |
| 35 to 50 years | 47 (18.1%) | 24.0 |
| Total | 259 (100.0%) | 60.0 |
Fertility by Age by Marriage Status in Saunders County
79.5% of women with births (259) in Saunders County are married. The highest percentage of unmarried women with births falls into 35 to 50 years age bracket with 31.9% of them unmarried at the time of birth, while the lowest percentage of unmarried women with births belong to 20 to 34 years age bracket with 17.9% of them unmarried.
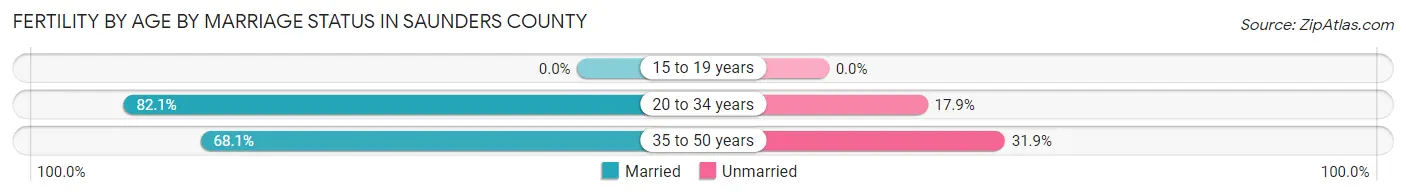
| Age Bracket | Married | Unmarried |
| 15 to 19 years | 0 (0.0%) | 0 (0.0%) |
| 20 to 34 years | 174 (82.1%) | 38 (17.9%) |
| 35 to 50 years | 32 (68.1%) | 15 (31.9%) |
| Total | 206 (79.5%) | 53 (20.5%) |
Fertility by Education in Saunders County
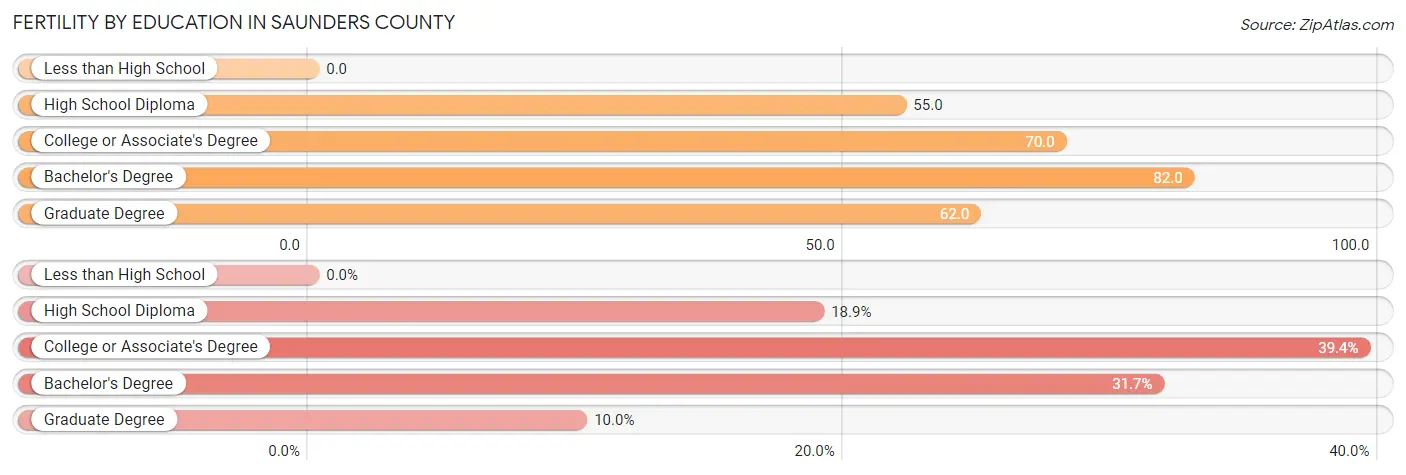
| Educational Attainment | Women with Births | Births / 1,000 Women |
| Less than High School | 0 (0.0%) | 0.0 |
| High School Diploma | 49 (18.9%) | 55.0 |
| College or Associate's Degree | 102 (39.4%) | 70.0 |
| Bachelor's Degree | 82 (31.7%) | 82.0 |
| Graduate Degree | 26 (10.0%) | 62.0 |
| Total | 259 (100.0%) | 60.0 |
Fertility by Education by Marriage Status in Saunders County
20.5% of women with births in Saunders County are unmarried. Women with the educational attainment of bachelor's degree are most likely to be married with 93.9% of them married at childbirth, while women with the educational attainment of high school diploma are least likely to be married with 32.7% of them unmarried at childbirth.
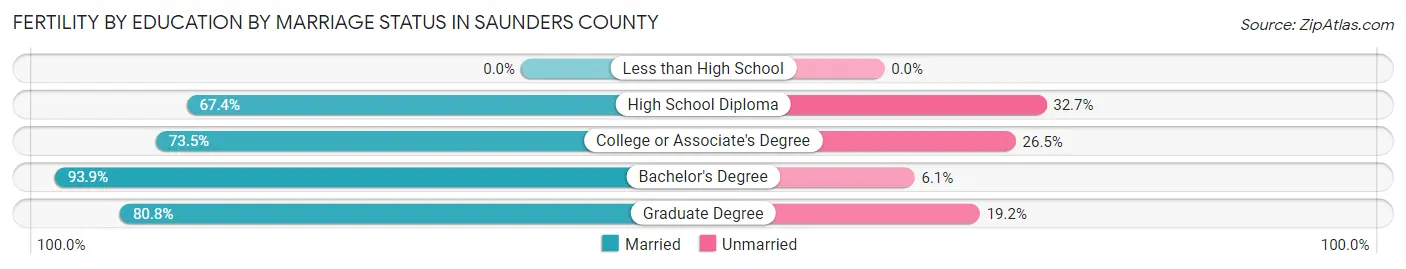
| Educational Attainment | Married | Unmarried |
| Less than High School | 0 (0.0%) | 0 (0.0%) |
| High School Diploma | 33 (67.3%) | 16 (32.7%) |
| College or Associate's Degree | 75 (73.5%) | 27 (26.5%) |
| Bachelor's Degree | 77 (93.9%) | 5 (6.1%) |
| Graduate Degree | 21 (80.8%) | 5 (19.2%) |
| Total | 206 (79.5%) | 53 (20.5%) |
Income in Saunders County
Income Overview in Saunders County
Per Capita Income in Saunders County is $41,364, while median incomes of families and households are $102,668 and $84,474 respectively.
| Characteristic | Number | Measure |
| Per Capita Income | 22,374 | $41,364 |
| Median Family Income | 6,168 | $102,668 |
| Mean Family Income | 6,168 | $118,631 |
| Median Household Income | 8,789 | $84,474 |
| Mean Household Income | 8,789 | $103,516 |
| Income Deficit | 6,168 | $11,194 |
| Wage / Income Gap (%) | 22,374 | 34.00% |
| Wage / Income Gap ($) | 22,374 | 66.00¢ per $1 |
| Gini / Inequality Index | 22,374 | 0.41 |
Earnings by Sex in Saunders County
Average Earnings in Saunders County are $46,243, $53,977 for men and $35,625 for women, a difference of 34.0%.
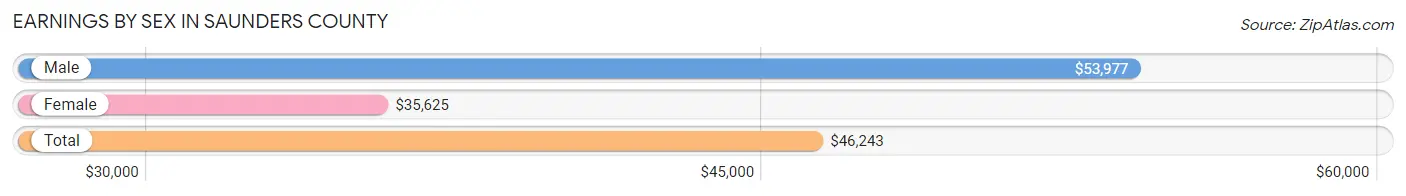
| Sex | Number | Average Earnings |
| Male | 7,133 (54.7%) | $53,977 |
| Female | 5,913 (45.3%) | $35,625 |
| Total | 13,046 (100.0%) | $46,243 |
Earnings by Sex by Income Bracket in Saunders County
The most common earnings brackets in Saunders County are $100,000+ for men (1,265 | 17.7%) and $50,000 to $54,999 for women (452 | 7.6%).
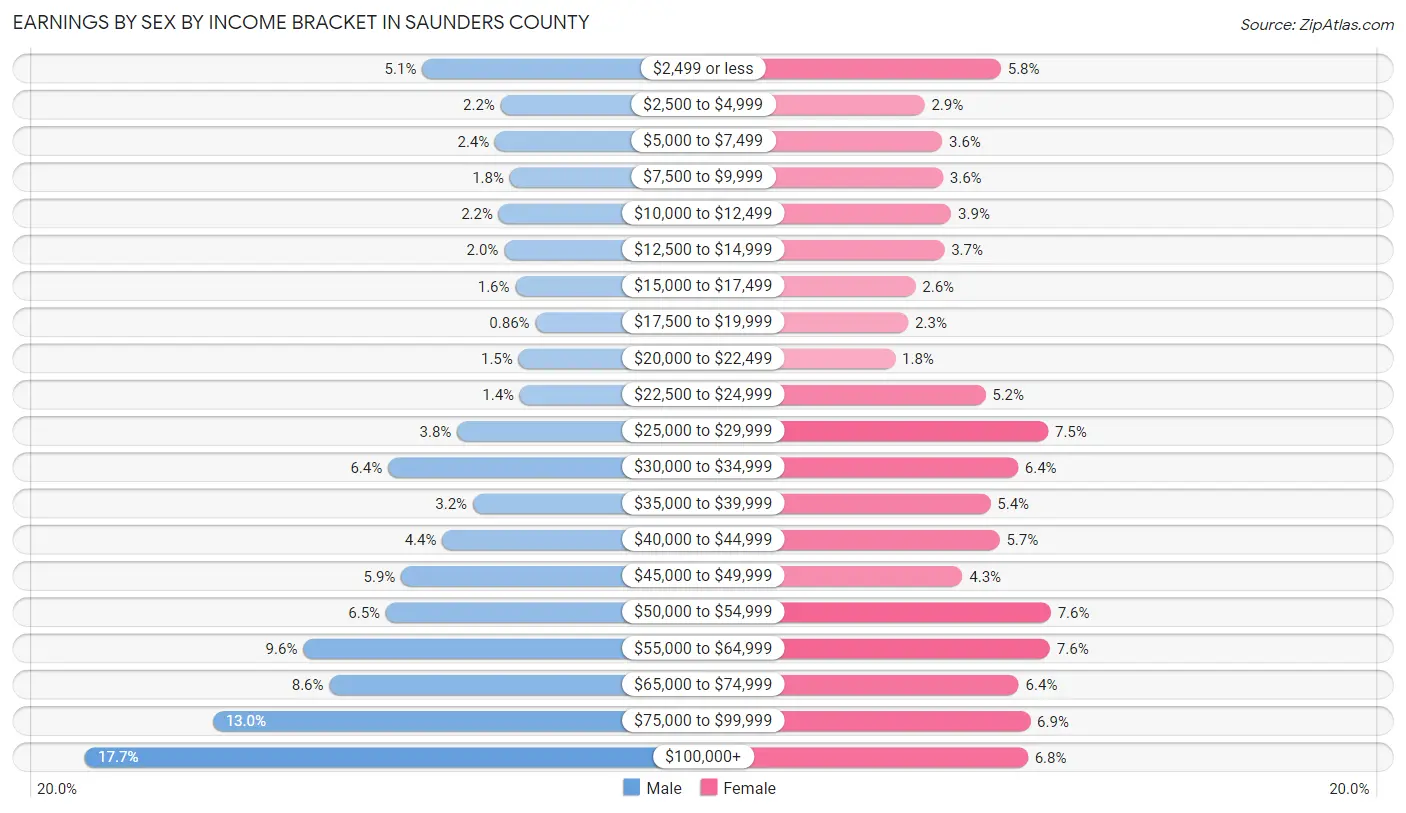
| Income | Male | Female |
| $2,499 or less | 364 (5.1%) | 341 (5.8%) |
| $2,500 to $4,999 | 154 (2.2%) | 172 (2.9%) |
| $5,000 to $7,499 | 169 (2.4%) | 211 (3.6%) |
| $7,500 to $9,999 | 130 (1.8%) | 213 (3.6%) |
| $10,000 to $12,499 | 159 (2.2%) | 231 (3.9%) |
| $12,500 to $14,999 | 145 (2.0%) | 216 (3.6%) |
| $15,000 to $17,499 | 115 (1.6%) | 152 (2.6%) |
| $17,500 to $19,999 | 61 (0.9%) | 136 (2.3%) |
| $20,000 to $22,499 | 106 (1.5%) | 107 (1.8%) |
| $22,500 to $24,999 | 103 (1.4%) | 307 (5.2%) |
| $25,000 to $29,999 | 270 (3.8%) | 446 (7.5%) |
| $30,000 to $34,999 | 455 (6.4%) | 379 (6.4%) |
| $35,000 to $39,999 | 228 (3.2%) | 318 (5.4%) |
| $40,000 to $44,999 | 310 (4.3%) | 338 (5.7%) |
| $45,000 to $49,999 | 420 (5.9%) | 256 (4.3%) |
| $50,000 to $54,999 | 461 (6.5%) | 452 (7.6%) |
| $55,000 to $64,999 | 682 (9.6%) | 450 (7.6%) |
| $65,000 to $74,999 | 612 (8.6%) | 381 (6.4%) |
| $75,000 to $99,999 | 924 (13.0%) | 406 (6.9%) |
| $100,000+ | 1,265 (17.7%) | 401 (6.8%) |
| Total | 7,133 (100.0%) | 5,913 (100.0%) |
Earnings by Sex by Educational Attainment in Saunders County
Average earnings in Saunders County are $61,133 for men and $40,981 for women, a difference of 33.0%. Men with an educational attainment of graduate degree enjoy the highest average annual earnings of $78,272, while those with less than high school education earn the least with $38,750. Women with an educational attainment of graduate degree earn the most with the average annual earnings of $60,273, while those with less than high school education have the smallest earnings of $25,843.
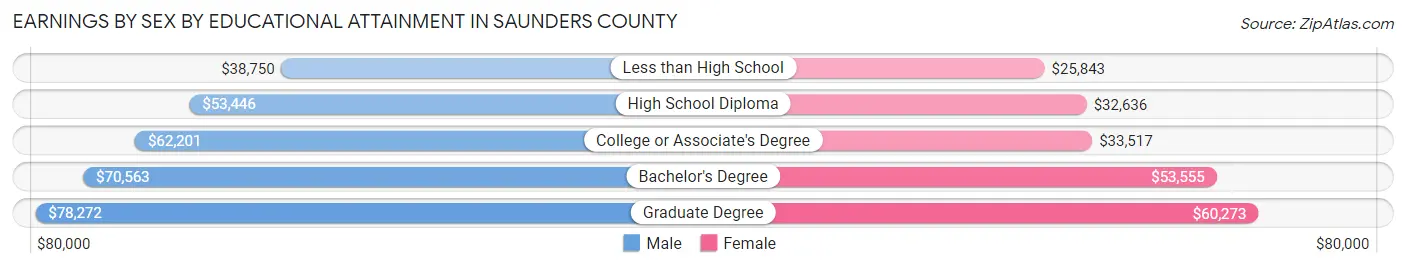
| Educational Attainment | Male Income | Female Income |
| Less than High School | $38,750 | $25,843 |
| High School Diploma | $53,446 | $32,636 |
| College or Associate's Degree | $62,201 | $33,517 |
| Bachelor's Degree | $70,563 | $53,555 |
| Graduate Degree | $78,272 | $60,273 |
| Total | $61,133 | $40,981 |
Family Income in Saunders County
Family Income Brackets in Saunders County
According to the Saunders County family income data, there are 1,733 families falling into the $100,000 to $149,999 income range, which is the most common income bracket and makes up 28.1% of all families. Conversely, the $10,000 to $14,999 income bracket is the least frequent group with only 80 families (1.3%) belonging to this category.
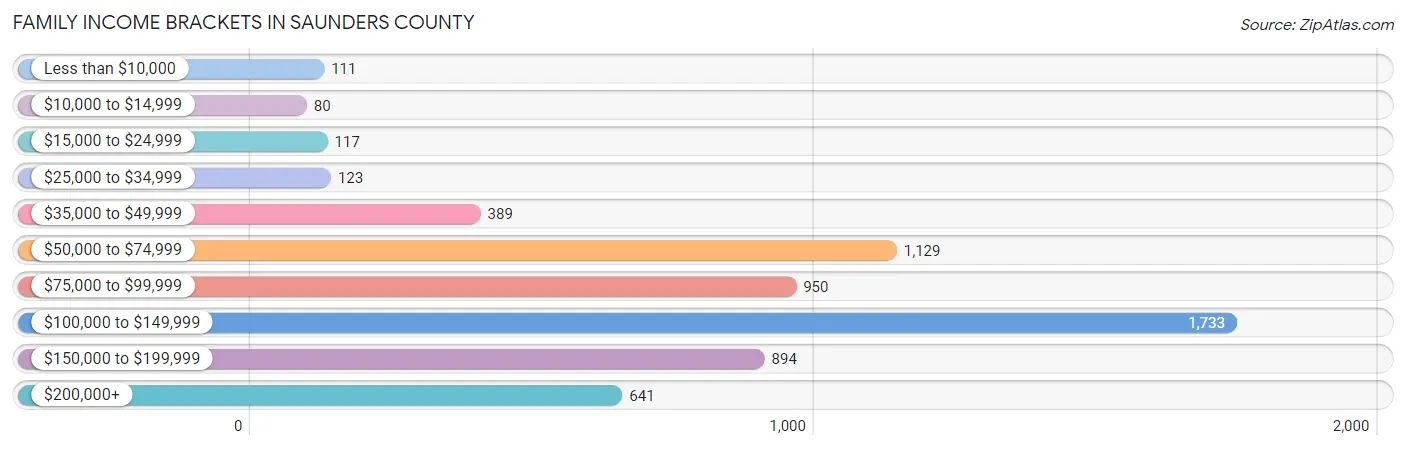
| Income Bracket | # Families | % Families |
| Less than $10,000 | 111 | 1.8% |
| $10,000 to $14,999 | 80 | 1.3% |
| $15,000 to $24,999 | 117 | 1.9% |
| $25,000 to $34,999 | 123 | 2.0% |
| $35,000 to $49,999 | 389 | 6.3% |
| $50,000 to $74,999 | 1,129 | 18.3% |
| $75,000 to $99,999 | 950 | 15.4% |
| $100,000 to $149,999 | 1,733 | 28.1% |
| $150,000 to $199,999 | 894 | 14.5% |
| $200,000+ | 641 | 10.4% |
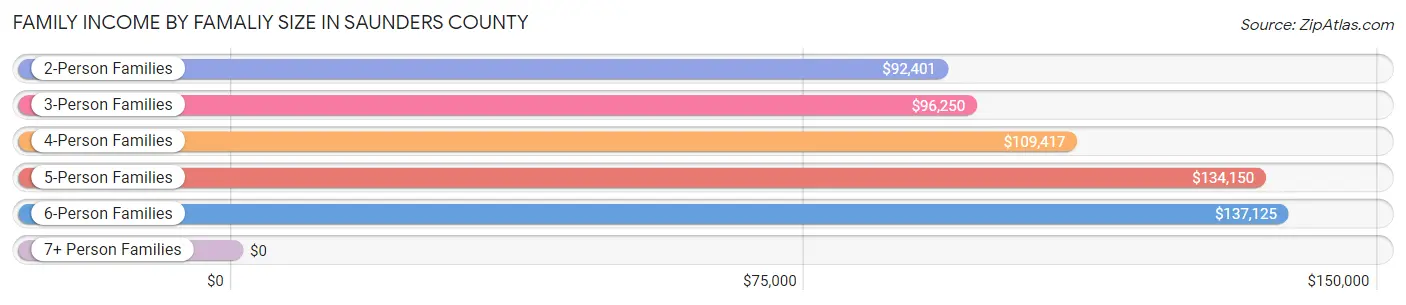
Family Income by Famaliy Size in Saunders County
6-person families (267 | 4.3%) account for the highest median family income in Saunders County with $137,125 per family, while 2-person families (3,085 | 50.0%) have the highest median income of $46,200 per family member.
| Income Bracket | # Families | Median Income |
| 2-Person Families | 3,085 (50.0%) | $92,401 |
| 3-Person Families | 1,105 (17.9%) | $96,250 |
| 4-Person Families | 967 (15.7%) | $109,417 |
| 5-Person Families | 602 (9.8%) | $134,150 |
| 6-Person Families | 267 (4.3%) | $137,125 |
| 7+ Person Families | 142 (2.3%) | $0 |
| Total | 6,168 (100.0%) | $102,668 |
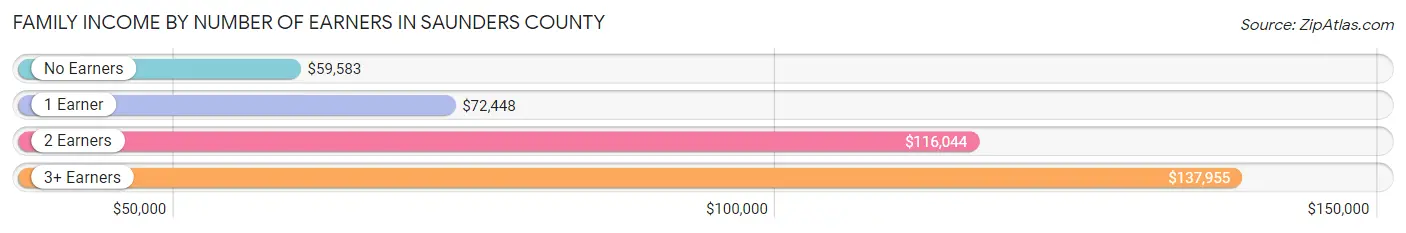
Family Income by Number of Earners in Saunders County
The median family income in Saunders County is $102,668, with families comprising 3+ earners (822) having the highest median family income of $137,955, while families with no earners (708) have the lowest median family income of $59,583, accounting for 13.3% and 11.5% of families, respectively.
| Number of Earners | # Families | Median Income |
| No Earners | 708 (11.5%) | $59,583 |
| 1 Earner | 1,471 (23.8%) | $72,448 |
| 2 Earners | 3,167 (51.3%) | $116,044 |
| 3+ Earners | 822 (13.3%) | $137,955 |
| Total | 6,168 (100.0%) | $102,668 |
Household Income in Saunders County
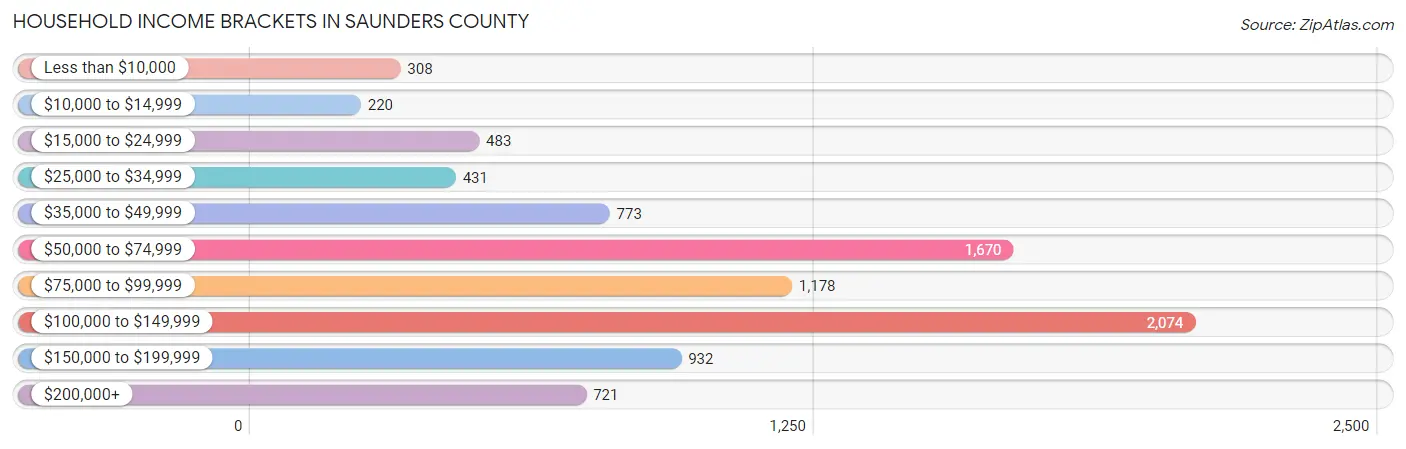
Household Income Brackets in Saunders County
With 2,074 households falling in the category, the $100,000 to $149,999 income range is the most frequent in Saunders County, accounting for 23.6% of all households. In contrast, only 220 households (2.5%) fall into the $10,000 to $14,999 income bracket, making it the least populous group.
| Income Bracket | # Households | % Households |
| Less than $10,000 | 308 | 3.5% |
| $10,000 to $14,999 | 220 | 2.5% |
| $15,000 to $24,999 | 483 | 5.5% |
| $25,000 to $34,999 | 431 | 4.9% |
| $35,000 to $49,999 | 773 | 8.8% |
| $50,000 to $74,999 | 1,670 | 19.0% |
| $75,000 to $99,999 | 1,178 | 13.4% |
| $100,000 to $149,999 | 2,074 | 23.6% |
| $150,000 to $199,999 | 932 | 10.6% |
| $200,000+ | 721 | 8.2% |
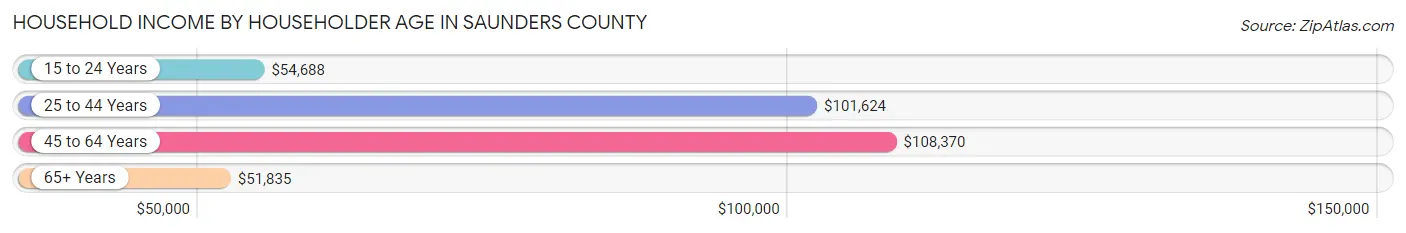
Household Income by Householder Age in Saunders County
The median household income in Saunders County is $84,474, with the highest median household income of $108,370 found in the 45 to 64 years age bracket for the primary householder. A total of 3,282 households (37.3%) fall into this category. Meanwhile, the 65+ years age bracket for the primary householder has the lowest median household income of $51,835, with 2,615 households (29.7%) in this group.
| Income Bracket | # Households | Median Income |
| 15 to 24 Years | 291 (3.3%) | $54,688 |
| 25 to 44 Years | 2,601 (29.6%) | $101,624 |
| 45 to 64 Years | 3,282 (37.3%) | $108,370 |
| 65+ Years | 2,615 (29.7%) | $51,835 |
| Total | 8,789 (100.0%) | $84,474 |
Poverty in Saunders County
Income Below Poverty by Sex and Age in Saunders County
With 5.9% poverty level for males and 7.5% for females among the residents of Saunders County, 12 to 14 year old males and 75 year old and over females are the most vulnerable to poverty, with 60 males (13.8%) and 158 females (17.1%) in their respective age groups living below the poverty level.
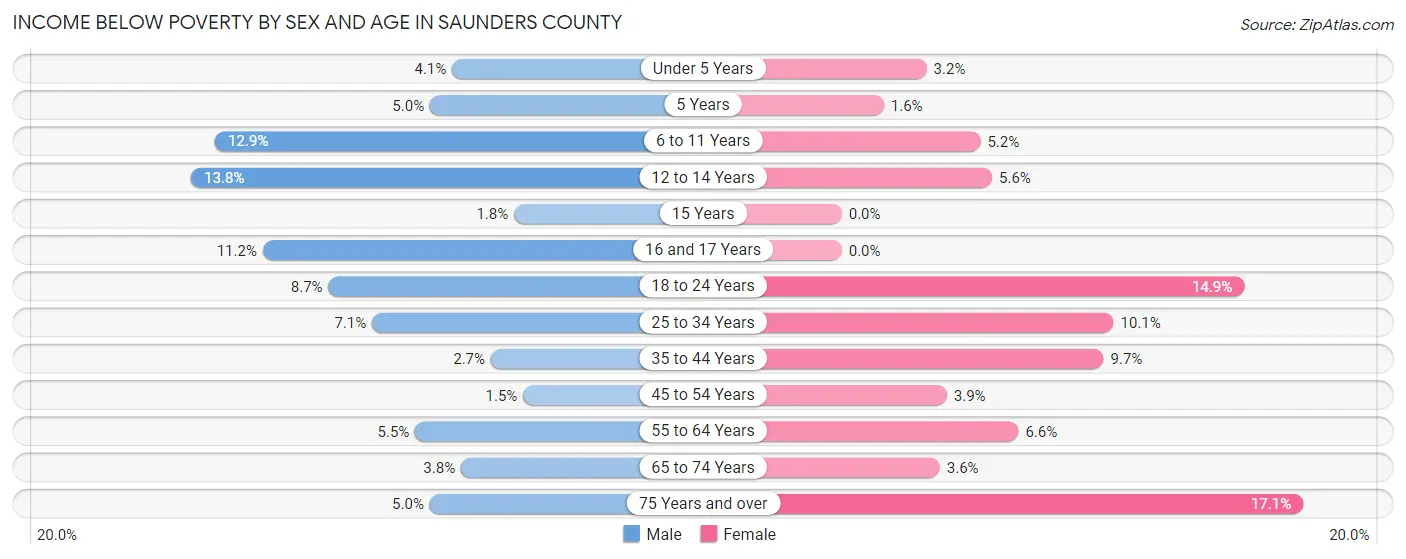
| Age Bracket | Male | Female |
| Under 5 Years | 29 (4.1%) | 21 (3.2%) |
| 5 Years | 9 (5.0%) | 3 (1.6%) |
| 6 to 11 Years | 125 (12.9%) | 44 (5.1%) |
| 12 to 14 Years | 60 (13.8%) | 23 (5.6%) |
| 15 Years | 2 (1.8%) | 0 (0.0%) |
| 16 and 17 Years | 49 (11.2%) | 0 (0.0%) |
| 18 to 24 Years | 73 (8.7%) | 109 (14.9%) |
| 25 to 34 Years | 82 (7.1%) | 116 (10.1%) |
| 35 to 44 Years | 40 (2.7%) | 130 (9.7%) |
| 45 to 54 Years | 19 (1.5%) | 49 (3.9%) |
| 55 to 64 Years | 101 (5.5%) | 109 (6.6%) |
| 65 to 74 Years | 47 (3.8%) | 41 (3.6%) |
| 75 Years and over | 32 (5.0%) | 158 (17.1%) |
| Total | 668 (5.9%) | 803 (7.5%) |
Income Above Poverty by Sex and Age in Saunders County
According to the poverty statistics in Saunders County, males aged 45 to 54 years and females aged 15 years are the age groups that are most secure financially, with 98.5% of males and 100.0% of females in these age groups living above the poverty line.
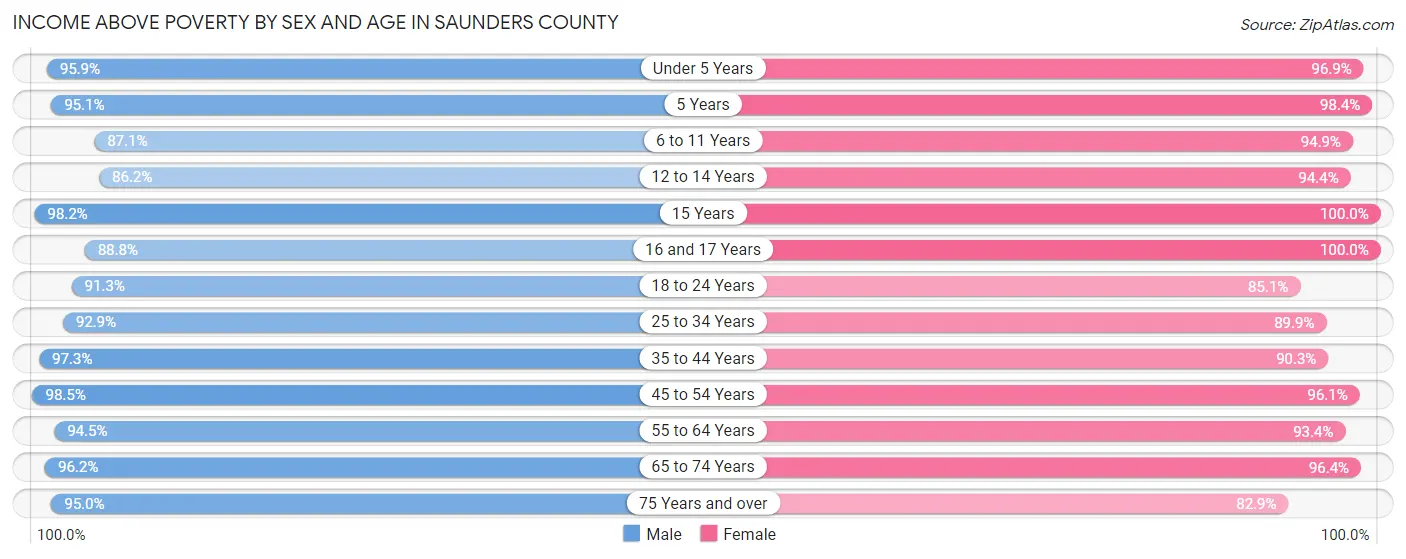
| Age Bracket | Male | Female |
| Under 5 Years | 673 (95.9%) | 646 (96.9%) |
| 5 Years | 173 (95.1%) | 189 (98.4%) |
| 6 to 11 Years | 842 (87.1%) | 810 (94.9%) |
| 12 to 14 Years | 374 (86.2%) | 389 (94.4%) |
| 15 Years | 107 (98.2%) | 170 (100.0%) |
| 16 and 17 Years | 390 (88.8%) | 277 (100.0%) |
| 18 to 24 Years | 764 (91.3%) | 621 (85.1%) |
| 25 to 34 Years | 1,073 (92.9%) | 1,034 (89.9%) |
| 35 to 44 Years | 1,449 (97.3%) | 1,207 (90.3%) |
| 45 to 54 Years | 1,259 (98.5%) | 1,208 (96.1%) |
| 55 to 64 Years | 1,736 (94.5%) | 1,553 (93.4%) |
| 65 to 74 Years | 1,191 (96.2%) | 1,085 (96.4%) |
| 75 Years and over | 613 (95.0%) | 765 (82.9%) |
| Total | 10,644 (94.1%) | 9,954 (92.5%) |
Income Below Poverty Among Married-Couple Families in Saunders County
The poverty statistics for married-couple families in Saunders County show that 1.7% or 91 of the total 5,263 families live below the poverty line. Families with no children have the highest poverty rate of 2.8%, comprising of 85 families. On the other hand, families with 3 or 4 children have the lowest poverty rate of 0.0%, which includes 0 families.
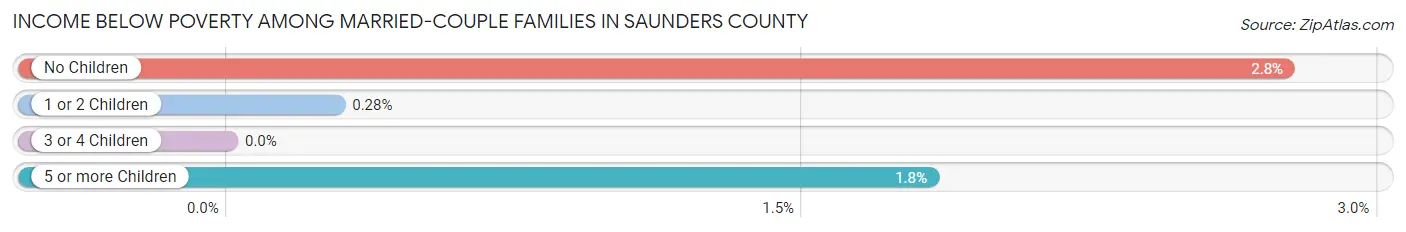
| Children | Above Poverty | Below Poverty |
| No Children | 2,997 (97.2%) | 85 (2.8%) |
| 1 or 2 Children | 1,404 (99.7%) | 4 (0.3%) |
| 3 or 4 Children | 664 (100.0%) | 0 (0.0%) |
| 5 or more Children | 107 (98.2%) | 2 (1.8%) |
| Total | 5,172 (98.3%) | 91 (1.7%) |
Income Below Poverty Among Single-Parent Households in Saunders County
According to the poverty data in Saunders County, 9.4% or 34 single-father households and 26.2% or 142 single-mother households are living below the poverty line. Among single-father households, those with 3 or 4 children have the highest poverty rate, with 8 households (50.0%) experiencing poverty. Likewise, among single-mother households, those with 3 or 4 children have the highest poverty rate, with 68 households (63.5%) falling below the poverty line.
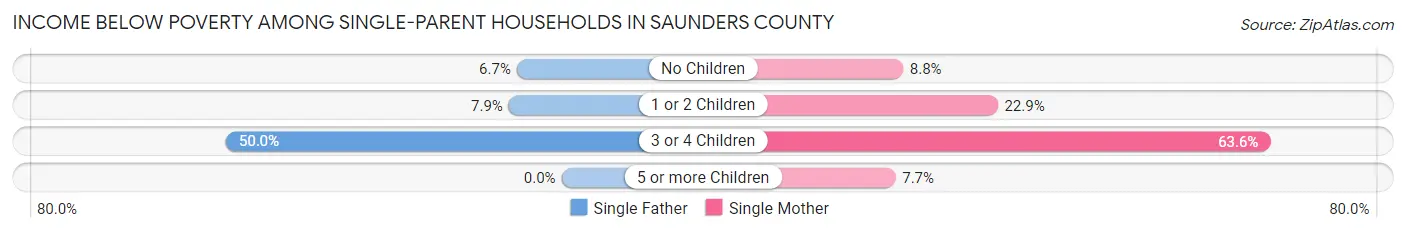
| Children | Single Father | Single Mother |
| No Children | 6 (6.7%) | 15 (8.8%) |
| 1 or 2 Children | 20 (7.9%) | 58 (22.9%) |
| 3 or 4 Children | 8 (50.0%) | 68 (63.5%) |
| 5 or more Children | 0 (0.0%) | 1 (7.7%) |
| Total | 34 (9.4%) | 142 (26.2%) |
Income Below Poverty Among Married-Couple vs Single-Parent Households in Saunders County
The poverty data for Saunders County shows that 91 of the married-couple family households (1.7%) and 176 of the single-parent households (19.5%) are living below the poverty level. Within the married-couple family households, those with no children have the highest poverty rate, with 85 households (2.8%) falling below the poverty line. Among the single-parent households, those with 3 or 4 children have the highest poverty rate, with 76 household (61.8%) living below poverty.
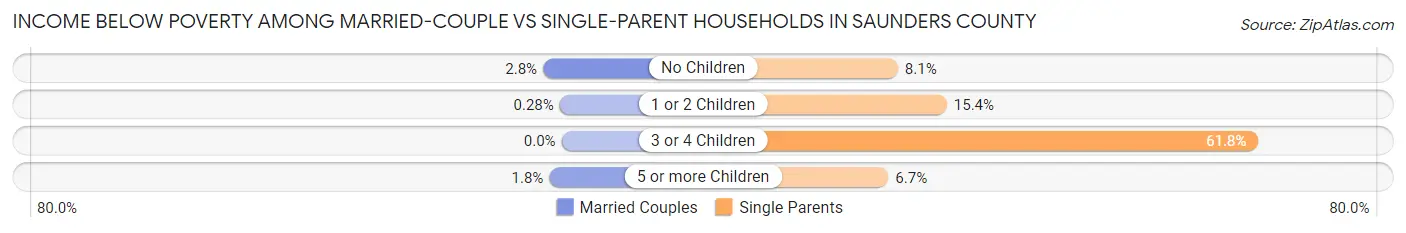
| Children | Married-Couple Families | Single-Parent Households |
| No Children | 85 (2.8%) | 21 (8.1%) |
| 1 or 2 Children | 4 (0.3%) | 78 (15.4%) |
| 3 or 4 Children | 0 (0.0%) | 76 (61.8%) |
| 5 or more Children | 2 (1.8%) | 1 (6.7%) |
| Total | 91 (1.7%) | 176 (19.5%) |
Employment Characteristics in Saunders County
Employment by Class of Employer in Saunders County
Among the 11,676 employed individuals in Saunders County, private company employees (6,935 | 59.4%), local government employees (1,230 | 10.5%), and not-for-profit organizations (1,086 | 9.3%) make up the most common classes of employment.
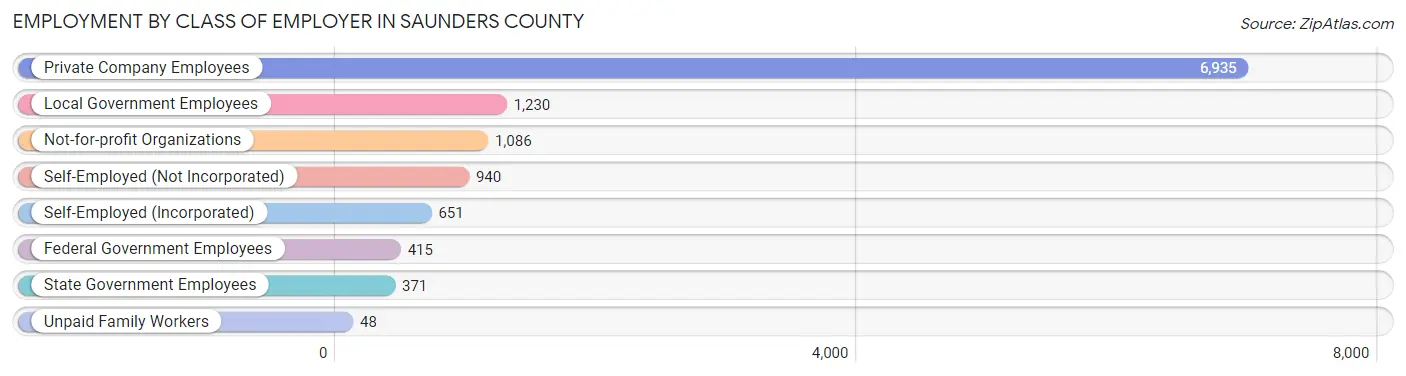
| Employer Class | # Employees | % Employees |
| Private Company Employees | 6,935 | 59.4% |
| Self-Employed (Incorporated) | 651 | 5.6% |
| Self-Employed (Not Incorporated) | 940 | 8.1% |
| Not-for-profit Organizations | 1,086 | 9.3% |
| Local Government Employees | 1,230 | 10.5% |
| State Government Employees | 371 | 3.2% |
| Federal Government Employees | 415 | 3.5% |
| Unpaid Family Workers | 48 | 0.4% |
| Total | 11,676 | 100.0% |
Employment Status by Age in Saunders County
According to the labor force statistics for Saunders County, out of the total population over 16 years of age (17,629), 69.2% or 12,199 individuals are in the labor force, with 2.4% or 293 of them unemployed. The age group with the highest labor force participation rate is 25 to 29 years, with 93.9% or 1,060 individuals in the labor force. Within the labor force, the 16 to 19 years age range has the highest percentage of unemployed individuals, with 16.7% or 96 of them being unemployed.
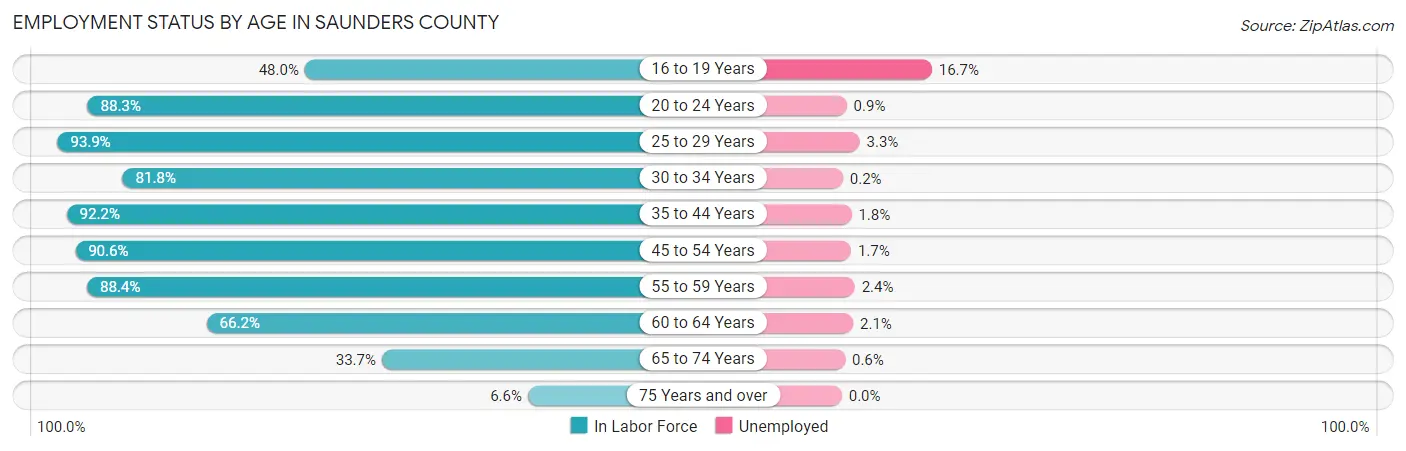
| Age Bracket | In Labor Force | Unemployed |
| 16 to 19 Years | 574 (48.0%) | 96 (16.7%) |
| 20 to 24 Years | 969 (88.3%) | 9 (0.9%) |
| 25 to 29 Years | 1,060 (93.9%) | 35 (3.3%) |
| 30 to 34 Years | 989 (81.8%) | 2 (0.2%) |
| 35 to 44 Years | 2,629 (92.2%) | 47 (1.8%) |
| 45 to 54 Years | 2,322 (90.6%) | 39 (1.7%) |
| 55 to 59 Years | 1,659 (88.4%) | 40 (2.4%) |
| 60 to 64 Years | 1,074 (66.2%) | 23 (2.1%) |
| 65 to 74 Years | 804 (33.7%) | 5 (0.6%) |
| 75 Years and over | 112 (6.6%) | 0 (0.0%) |
| Total | 12,199 (69.2%) | 293 (2.4%) |
Employment Status by Educational Attainment in Saunders County
According to labor force statistics for Saunders County, 86.5% of individuals (9,732) out of the total population between 25 and 64 years of age (11,251) are in the labor force, with 1.9% or 185 of them being unemployed. The group with the highest labor force participation rate are those with the educational attainment of bachelor's degree or higher, with 91.4% or 3,295 individuals in the labor force. Within the labor force, individuals with less than high school education have the highest percentage of unemployment, with 7.8% or 20 of them being unemployed.
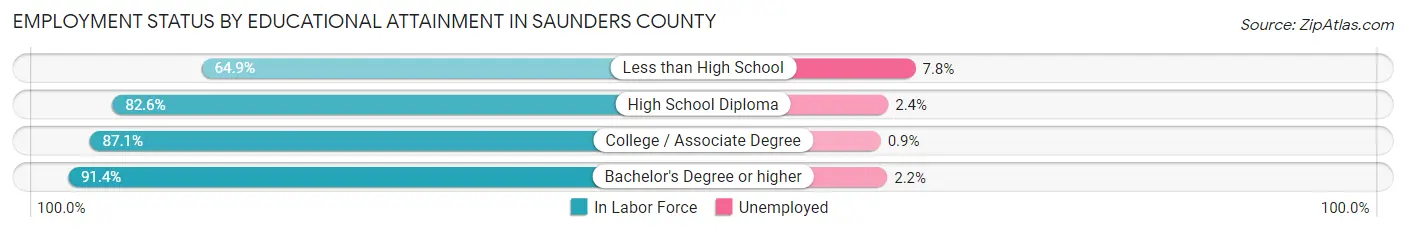
| Educational Attainment | In Labor Force | Unemployed |
| Less than High School | 257 (64.9%) | 31 (7.8%) |
| High School Diploma | 2,508 (82.6%) | 73 (2.4%) |
| College / Associate Degree | 3,670 (87.1%) | 38 (0.9%) |
| Bachelor's Degree or higher | 3,295 (91.4%) | 79 (2.2%) |
| Total | 9,732 (86.5%) | 214 (1.9%) |
Employment Occupations by Sex in Saunders County
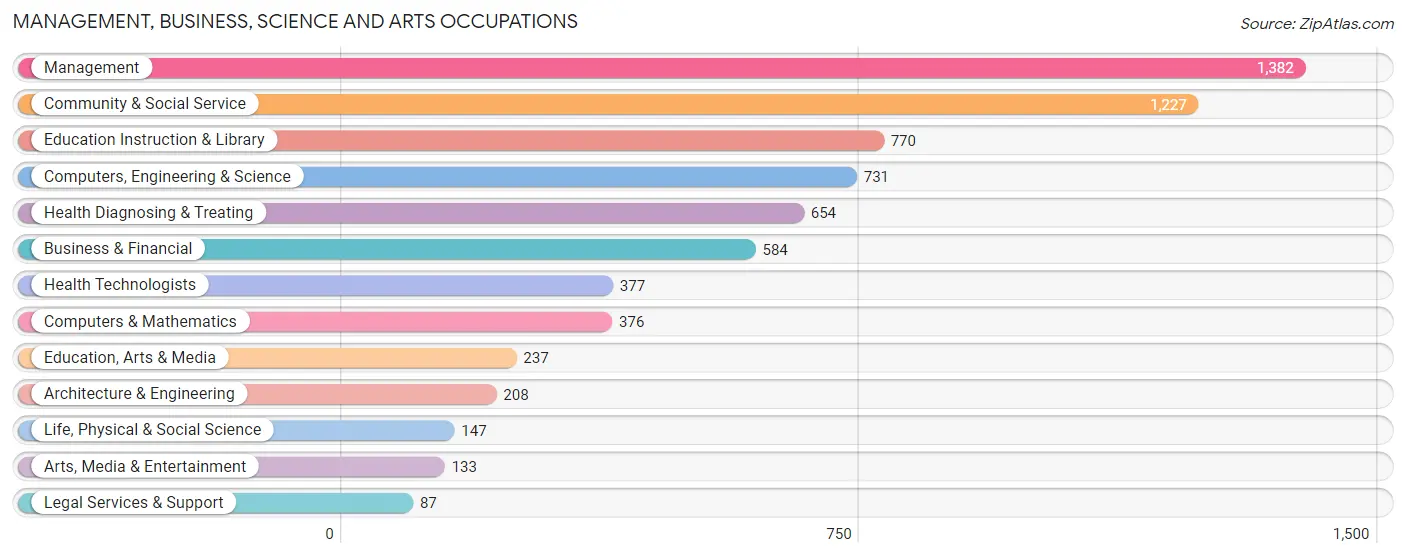
Management, Business, Science and Arts Occupations
The most common Management, Business, Science and Arts occupations in Saunders County are Management (1,382 | 11.7%), Community & Social Service (1,227 | 10.4%), Education Instruction & Library (770 | 6.5%), Computers, Engineering & Science (731 | 6.2%), and Health Diagnosing & Treating (654 | 5.6%).
Management, Business, Science and Arts Occupations by Sex
Within the Management, Business, Science and Arts occupations in Saunders County, the most male-oriented occupations are Architecture & Engineering (82.7%), Computers & Mathematics (69.7%), and Computers, Engineering & Science (69.1%), while the most female-oriented occupations are Legal Services & Support (90.8%), Health Technologists (82.5%), and Health Diagnosing & Treating (80.7%).
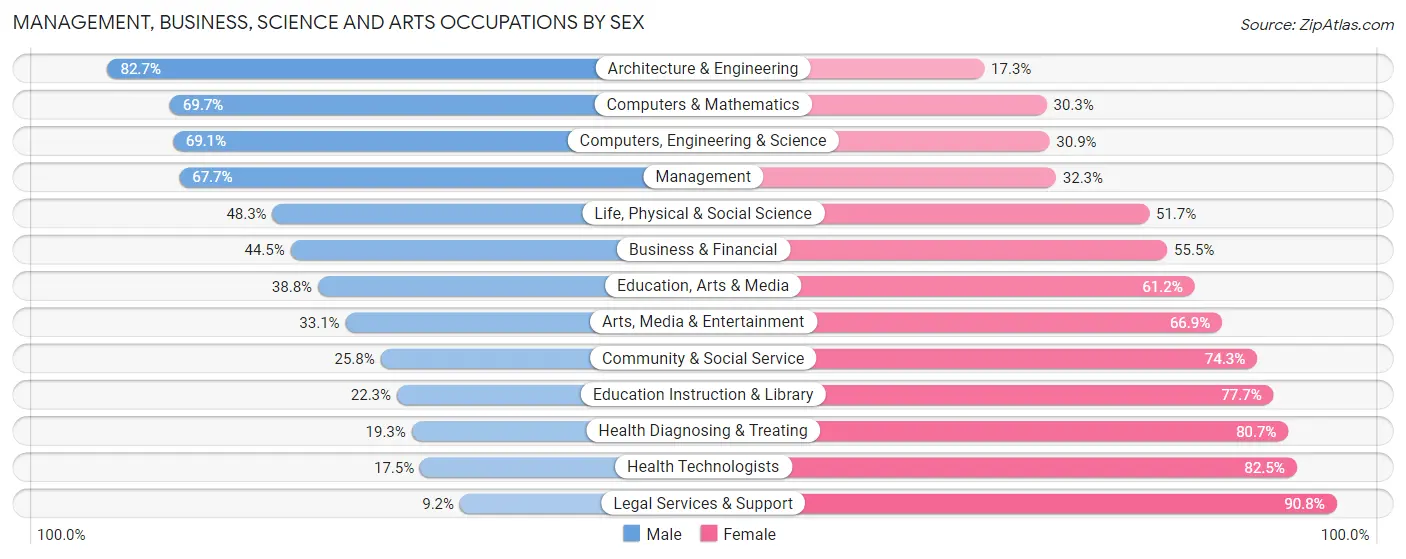
| Occupation | Male | Female |
| Management | 936 (67.7%) | 446 (32.3%) |
| Business & Financial | 260 (44.5%) | 324 (55.5%) |
| Computers, Engineering & Science | 505 (69.1%) | 226 (30.9%) |
| Computers & Mathematics | 262 (69.7%) | 114 (30.3%) |
| Architecture & Engineering | 172 (82.7%) | 36 (17.3%) |
| Life, Physical & Social Science | 71 (48.3%) | 76 (51.7%) |
| Community & Social Service | 316 (25.8%) | 911 (74.3%) |
| Education, Arts & Media | 92 (38.8%) | 145 (61.2%) |
| Legal Services & Support | 8 (9.2%) | 79 (90.8%) |
| Education Instruction & Library | 172 (22.3%) | 598 (77.7%) |
| Arts, Media & Entertainment | 44 (33.1%) | 89 (66.9%) |
| Health Diagnosing & Treating | 126 (19.3%) | 528 (80.7%) |
| Health Technologists | 66 (17.5%) | 311 (82.5%) |
| Total (Category) | 2,143 (46.8%) | 2,435 (53.2%) |
| Total (Overall) | 6,406 (54.3%) | 5,385 (45.7%) |
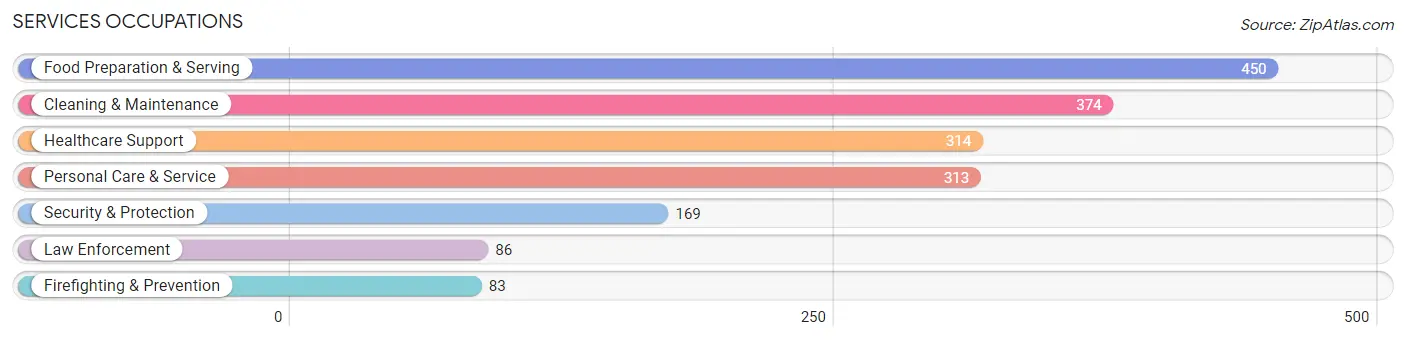
Services Occupations
The most common Services occupations in Saunders County are Food Preparation & Serving (450 | 3.8%), Cleaning & Maintenance (374 | 3.2%), Healthcare Support (314 | 2.7%), Personal Care & Service (313 | 2.6%), and Security & Protection (169 | 1.4%).
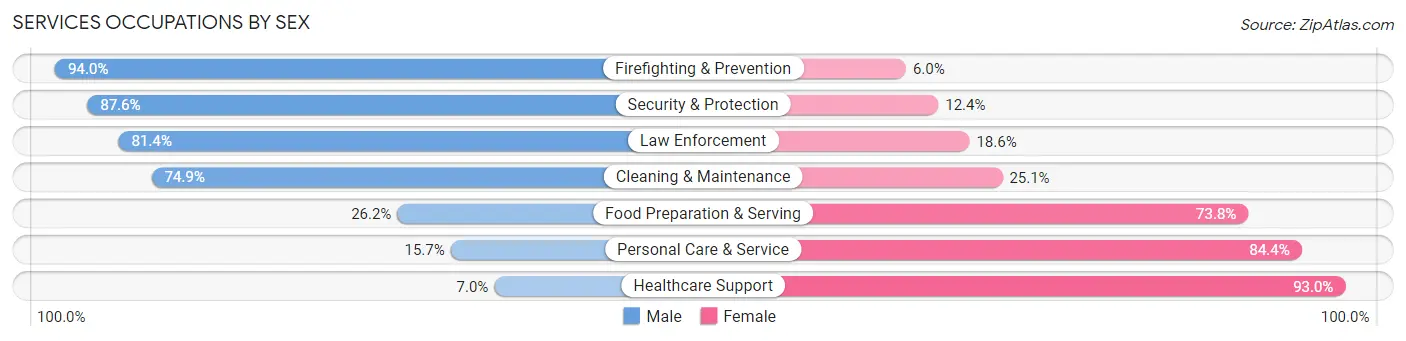
Services Occupations by Sex
Within the Services occupations in Saunders County, the most male-oriented occupations are Firefighting & Prevention (94.0%), Security & Protection (87.6%), and Law Enforcement (81.4%), while the most female-oriented occupations are Healthcare Support (93.0%), Personal Care & Service (84.4%), and Food Preparation & Serving (73.8%).
| Occupation | Male | Female |
| Healthcare Support | 22 (7.0%) | 292 (93.0%) |
| Security & Protection | 148 (87.6%) | 21 (12.4%) |
| Firefighting & Prevention | 78 (94.0%) | 5 (6.0%) |
| Law Enforcement | 70 (81.4%) | 16 (18.6%) |
| Food Preparation & Serving | 118 (26.2%) | 332 (73.8%) |
| Cleaning & Maintenance | 280 (74.9%) | 94 (25.1%) |
| Personal Care & Service | 49 (15.7%) | 264 (84.4%) |
| Total (Category) | 617 (38.1%) | 1,003 (61.9%) |
| Total (Overall) | 6,406 (54.3%) | 5,385 (45.7%) |
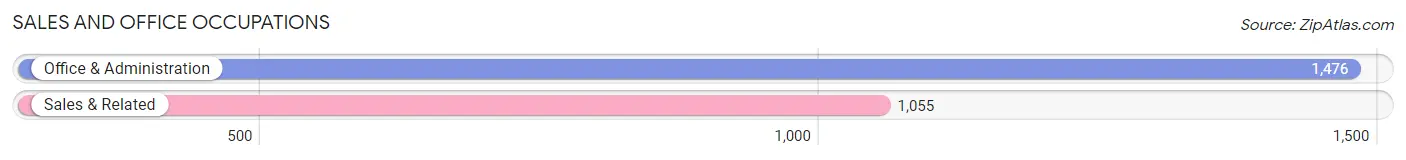
Sales and Office Occupations
The most common Sales and Office occupations in Saunders County are Office & Administration (1,476 | 12.5%), and Sales & Related (1,055 | 8.9%).
Sales and Office Occupations by Sex
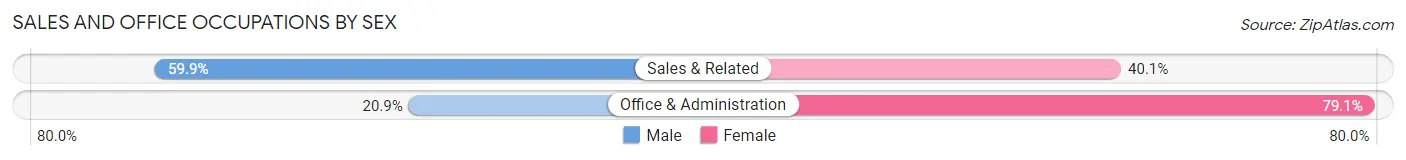
| Occupation | Male | Female |
| Sales & Related | 632 (59.9%) | 423 (40.1%) |
| Office & Administration | 309 (20.9%) | 1,167 (79.1%) |
| Total (Category) | 941 (37.2%) | 1,590 (62.8%) |
| Total (Overall) | 6,406 (54.3%) | 5,385 (45.7%) |
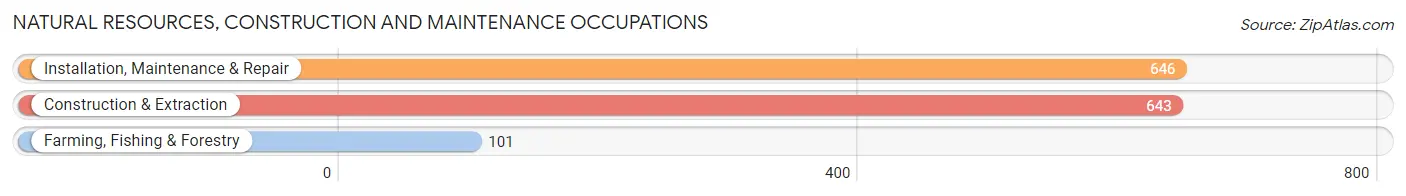
Natural Resources, Construction and Maintenance Occupations
The most common Natural Resources, Construction and Maintenance occupations in Saunders County are Installation, Maintenance & Repair (646 | 5.5%), Construction & Extraction (643 | 5.4%), and Farming, Fishing & Forestry (101 | 0.9%).
Natural Resources, Construction and Maintenance Occupations by Sex
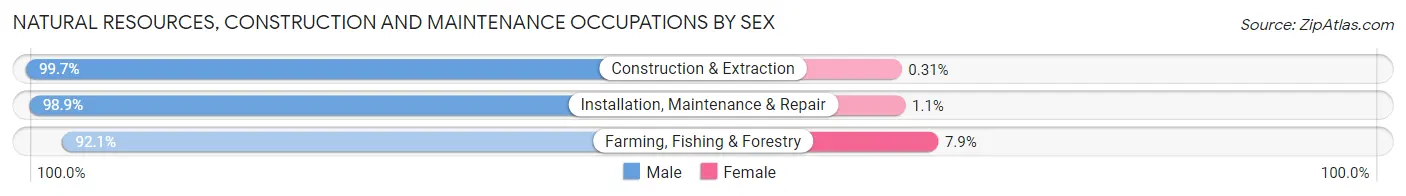
| Occupation | Male | Female |
| Farming, Fishing & Forestry | 93 (92.1%) | 8 (7.9%) |
| Construction & Extraction | 641 (99.7%) | 2 (0.3%) |
| Installation, Maintenance & Repair | 639 (98.9%) | 7 (1.1%) |
| Total (Category) | 1,373 (98.8%) | 17 (1.2%) |
| Total (Overall) | 6,406 (54.3%) | 5,385 (45.7%) |
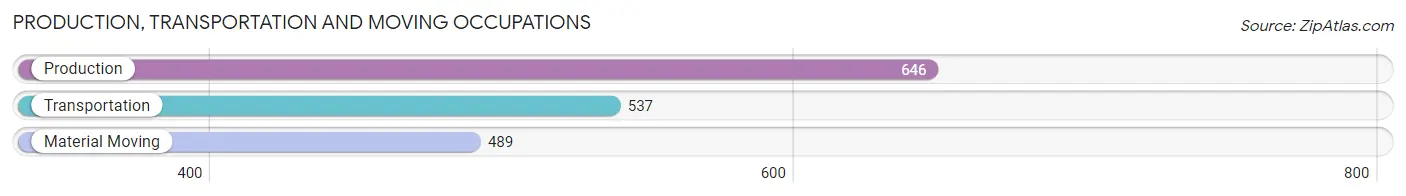
Production, Transportation and Moving Occupations
The most common Production, Transportation and Moving occupations in Saunders County are Production (646 | 5.5%), Transportation (537 | 4.5%), and Material Moving (489 | 4.2%).
Production, Transportation and Moving Occupations by Sex
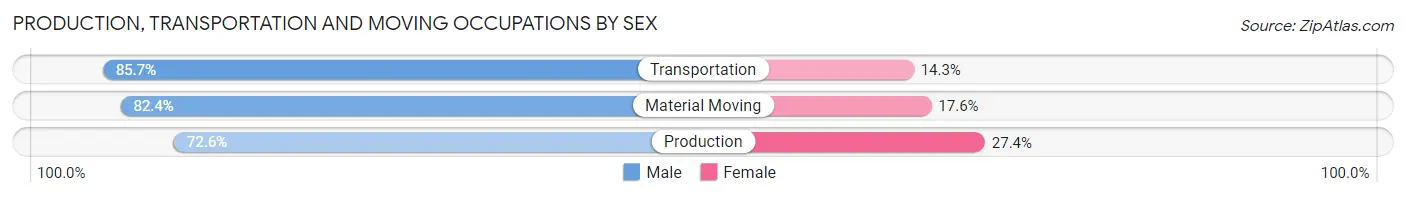
| Occupation | Male | Female |
| Production | 469 (72.6%) | 177 (27.4%) |
| Transportation | 460 (85.7%) | 77 (14.3%) |
| Material Moving | 403 (82.4%) | 86 (17.6%) |
| Total (Category) | 1,332 (79.7%) | 340 (20.3%) |
| Total (Overall) | 6,406 (54.3%) | 5,385 (45.7%) |
Employment Industries by Sex in Saunders County
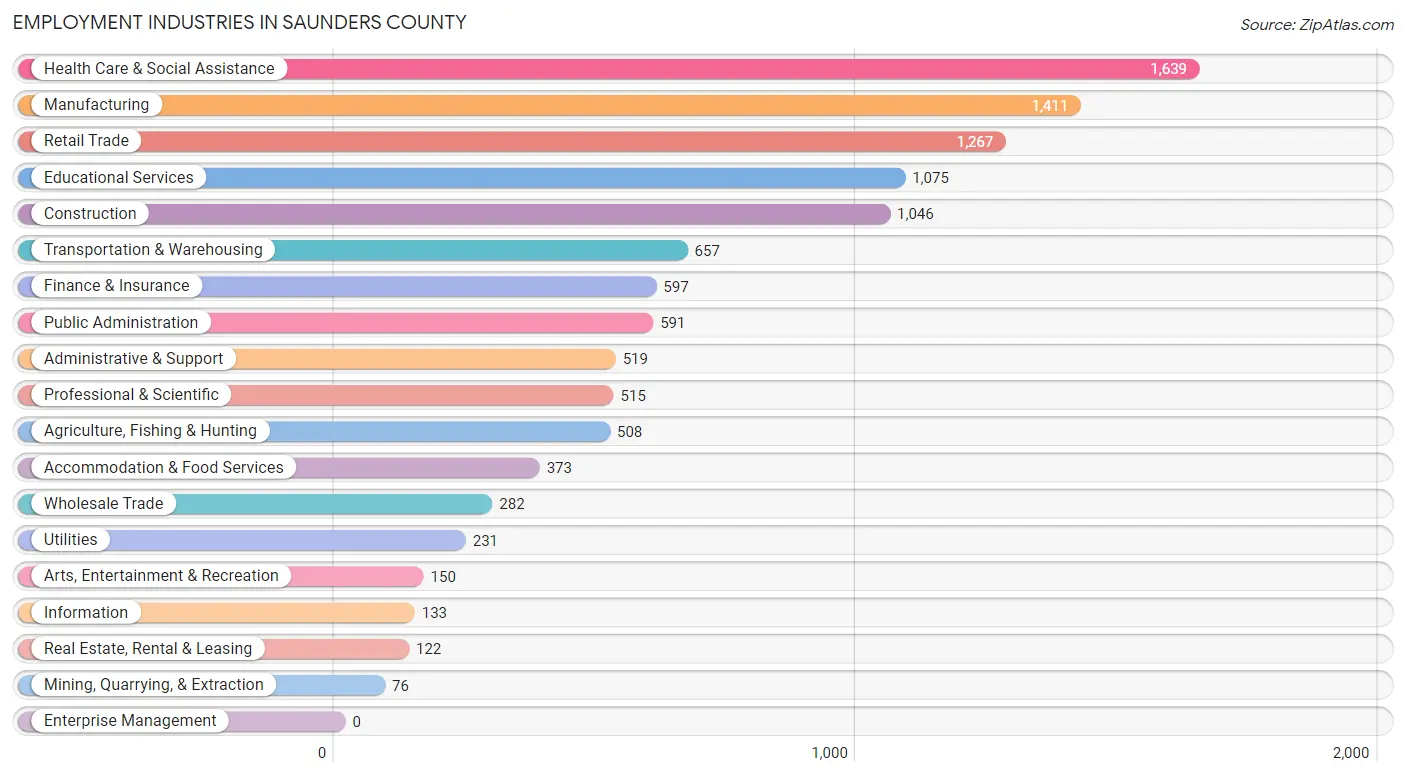
Employment Industries in Saunders County
The major employment industries in Saunders County include Health Care & Social Assistance (1,639 | 13.9%), Manufacturing (1,411 | 12.0%), Retail Trade (1,267 | 10.7%), Educational Services (1,075 | 9.1%), and Construction (1,046 | 8.9%).
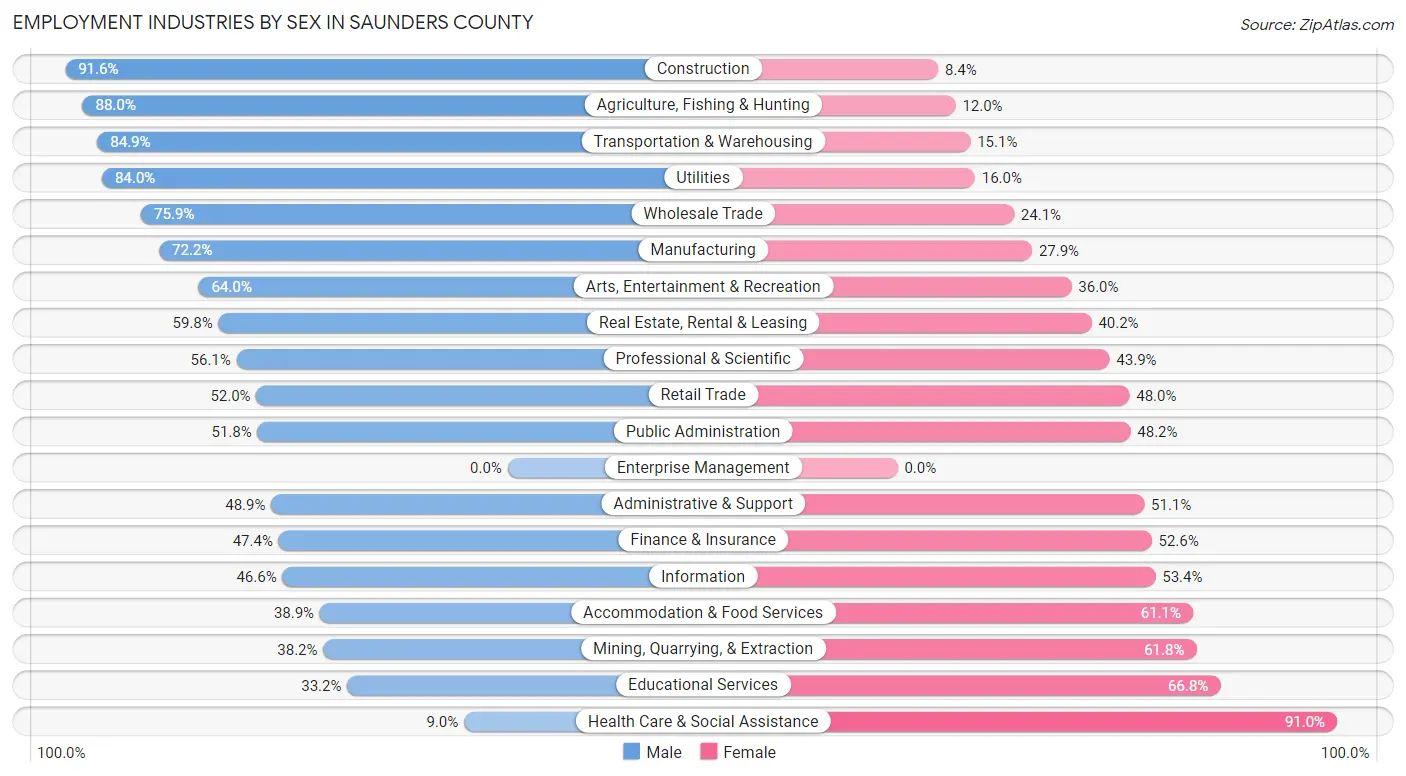
Employment Industries by Sex in Saunders County
The Saunders County industries that see more men than women are Construction (91.6%), Agriculture, Fishing & Hunting (88.0%), and Transportation & Warehousing (84.9%), whereas the industries that tend to have a higher number of women are Health Care & Social Assistance (91.0%), Educational Services (66.8%), and Mining, Quarrying, & Extraction (61.8%).
| Industry | Male | Female |
| Agriculture, Fishing & Hunting | 447 (88.0%) | 61 (12.0%) |
| Mining, Quarrying, & Extraction | 29 (38.2%) | 47 (61.8%) |
| Construction | 958 (91.6%) | 88 (8.4%) |
| Manufacturing | 1,018 (72.2%) | 393 (27.9%) |
| Wholesale Trade | 214 (75.9%) | 68 (24.1%) |
| Retail Trade | 659 (52.0%) | 608 (48.0%) |
| Transportation & Warehousing | 558 (84.9%) | 99 (15.1%) |
| Utilities | 194 (84.0%) | 37 (16.0%) |
| Information | 62 (46.6%) | 71 (53.4%) |
| Finance & Insurance | 283 (47.4%) | 314 (52.6%) |
| Real Estate, Rental & Leasing | 73 (59.8%) | 49 (40.2%) |
| Professional & Scientific | 289 (56.1%) | 226 (43.9%) |
| Enterprise Management | 0 (0.0%) | 0 (0.0%) |
| Administrative & Support | 254 (48.9%) | 265 (51.1%) |
| Educational Services | 357 (33.2%) | 718 (66.8%) |
| Health Care & Social Assistance | 148 (9.0%) | 1,491 (91.0%) |
| Arts, Entertainment & Recreation | 96 (64.0%) | 54 (36.0%) |
| Accommodation & Food Services | 145 (38.9%) | 228 (61.1%) |
| Public Administration | 306 (51.8%) | 285 (48.2%) |
| Total | 6,406 (54.3%) | 5,385 (45.7%) |
Education in Saunders County
School Enrollment in Saunders County
The most common levels of schooling among the 5,275 students in Saunders County are high school (1,379 | 26.1%), elementary school (1,236 | 23.4%), and middle school (1,042 | 19.8%).
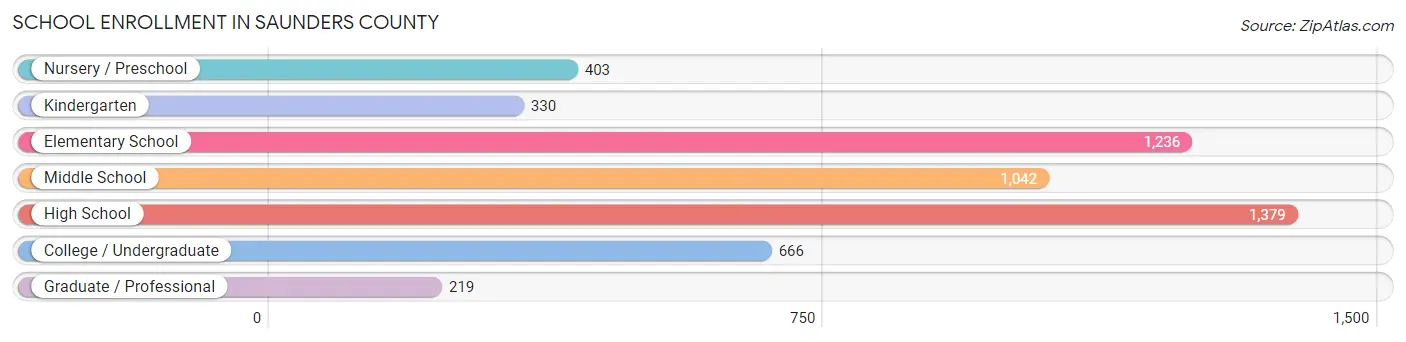
| School Level | # Students | % Students |
| Nursery / Preschool | 403 | 7.6% |
| Kindergarten | 330 | 6.3% |
| Elementary School | 1,236 | 23.4% |
| Middle School | 1,042 | 19.8% |
| High School | 1,379 | 26.1% |
| College / Undergraduate | 666 | 12.6% |
| Graduate / Professional | 219 | 4.2% |
| Total | 5,275 | 100.0% |
School Enrollment by Age by Funding Source in Saunders County
Out of a total of 5,275 students who are enrolled in schools in Saunders County, 1,081 (20.5%) attend a private institution, while the remaining 4,194 (79.5%) are enrolled in public schools. The age group of 35 years and over has the highest likelihood of being enrolled in private schools, with 88 (29.2% in the age bracket) enrolled. Conversely, the age group of 25 to 34 year olds has the lowest likelihood of being enrolled in a private school, with 106 (93.0% in the age bracket) attending a public institution.
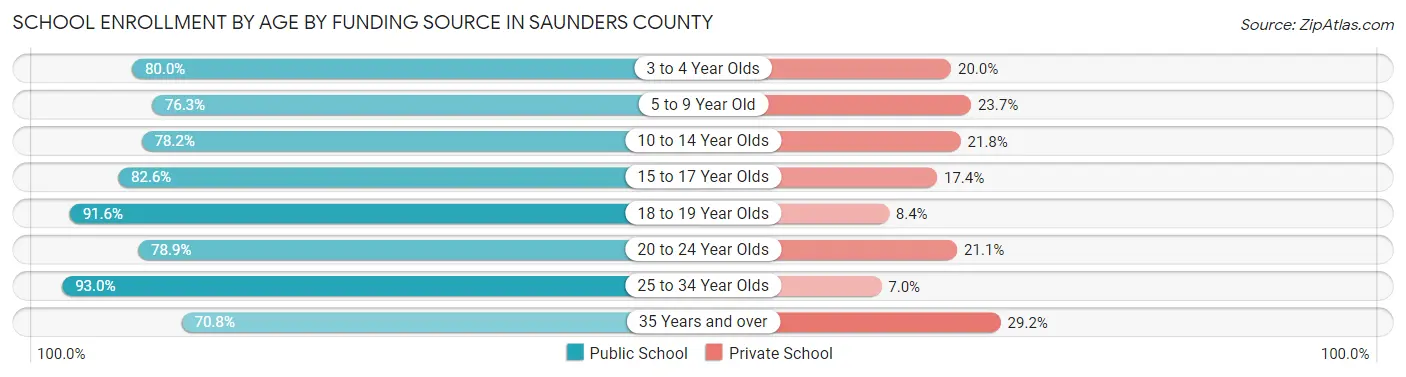
| Age Bracket | Public School | Private School |
| 3 to 4 Year Olds | 168 (80.0%) | 42 (20.0%) |
| 5 to 9 Year Old | 1,171 (76.3%) | 364 (23.7%) |
| 10 to 14 Year Olds | 1,113 (78.2%) | 310 (21.8%) |
| 15 to 17 Year Olds | 798 (82.6%) | 168 (17.4%) |
| 18 to 19 Year Olds | 392 (91.6%) | 36 (8.4%) |
| 20 to 24 Year Olds | 235 (78.9%) | 63 (21.1%) |
| 25 to 34 Year Olds | 106 (93.0%) | 8 (7.0%) |
| 35 Years and over | 213 (70.8%) | 88 (29.2%) |
| Total | 4,194 (79.5%) | 1,081 (20.5%) |
Educational Attainment by Field of Study in Saunders County
Business (975 | 19.5%), education (965 | 19.3%), bio, nature & agricultural (578 | 11.6%), arts & humanities (480 | 9.6%), and science & technology (433 | 8.7%) are the most common fields of study among 4,990 individuals in Saunders County who have obtained a bachelor's degree or higher.
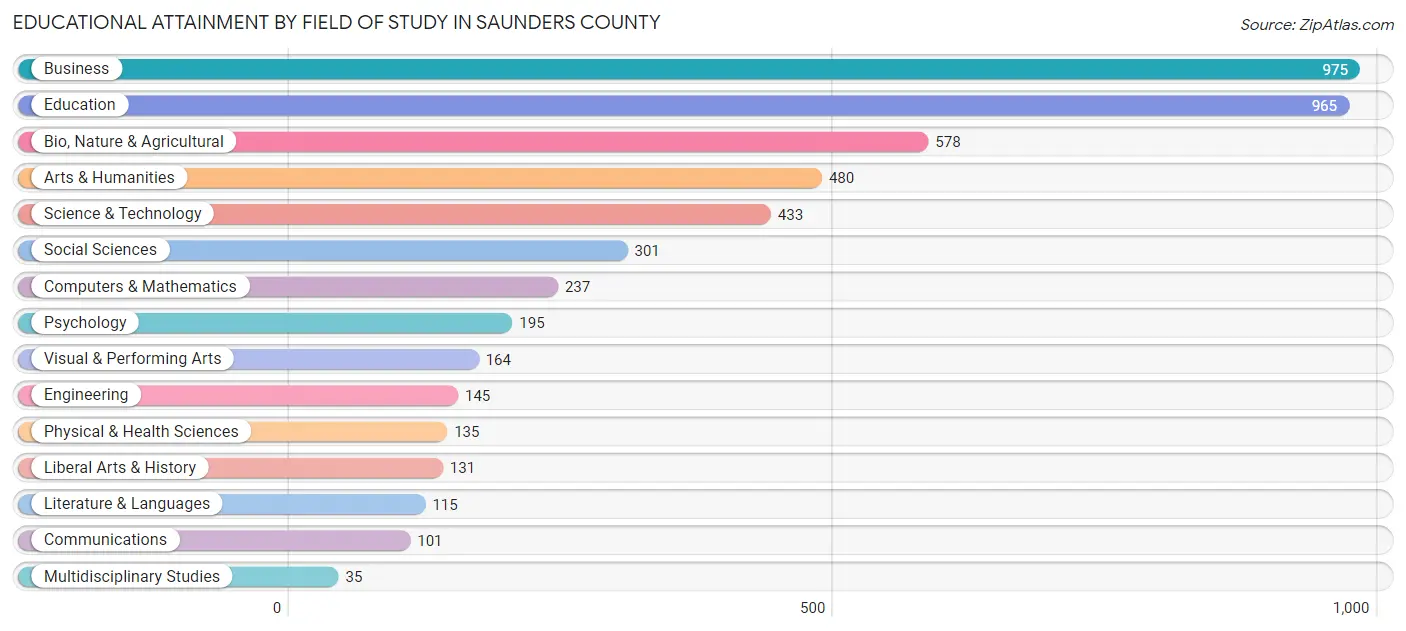
| Field of Study | # Graduates | % Graduates |
| Computers & Mathematics | 237 | 4.8% |
| Bio, Nature & Agricultural | 578 | 11.6% |
| Physical & Health Sciences | 135 | 2.7% |
| Psychology | 195 | 3.9% |
| Social Sciences | 301 | 6.0% |
| Engineering | 145 | 2.9% |
| Multidisciplinary Studies | 35 | 0.7% |
| Science & Technology | 433 | 8.7% |
| Business | 975 | 19.5% |
| Education | 965 | 19.3% |
| Literature & Languages | 115 | 2.3% |
| Liberal Arts & History | 131 | 2.6% |
| Visual & Performing Arts | 164 | 3.3% |
| Communications | 101 | 2.0% |
| Arts & Humanities | 480 | 9.6% |
| Total | 4,990 | 100.0% |
Transportation & Commute in Saunders County
Vehicle Availability by Sex in Saunders County
The most prevalent vehicle ownership categories in Saunders County are males with 2 vehicles (2,156, accounting for 33.7%) and females with 2 vehicles (1,766, making up 40.9%).
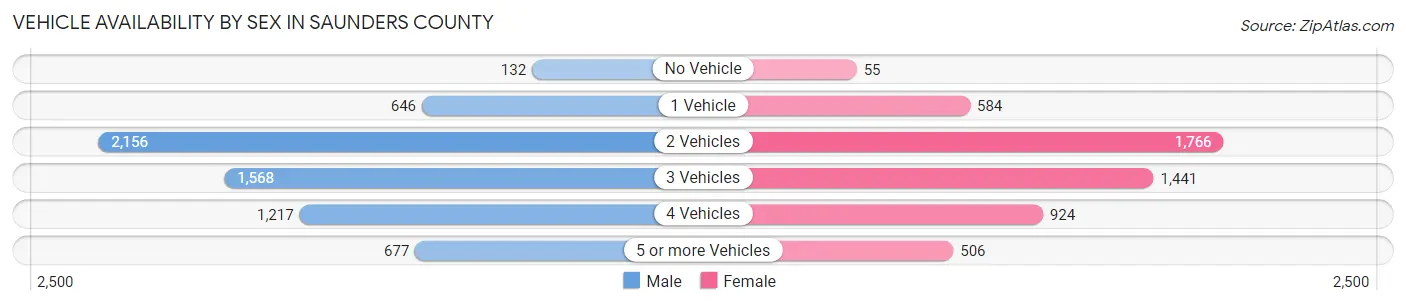
| Vehicles Available | Male | Female |
| No Vehicle | 132 (2.1%) | 55 (1.0%) |
| 1 Vehicle | 646 (10.1%) | 584 (11.1%) |
| 2 Vehicles | 2,156 (33.7%) | 1,766 (33.5%) |
| 3 Vehicles | 1,568 (24.5%) | 1,441 (27.3%) |
| 4 Vehicles | 1,217 (19.0%) | 924 (17.5%) |
| 5 or more Vehicles | 677 (10.6%) | 506 (9.6%) |
| Total | 6,396 (100.0%) | 5,276 (100.0%) |
Commute Time in Saunders County
The most frequently occuring commute durations in Saunders County are 30 to 34 minutes (1,511 commuters, 14.1%), 15 to 19 minutes (1,276 commuters, 11.9%), and 5 to 9 minutes (1,187 commuters, 11.0%).
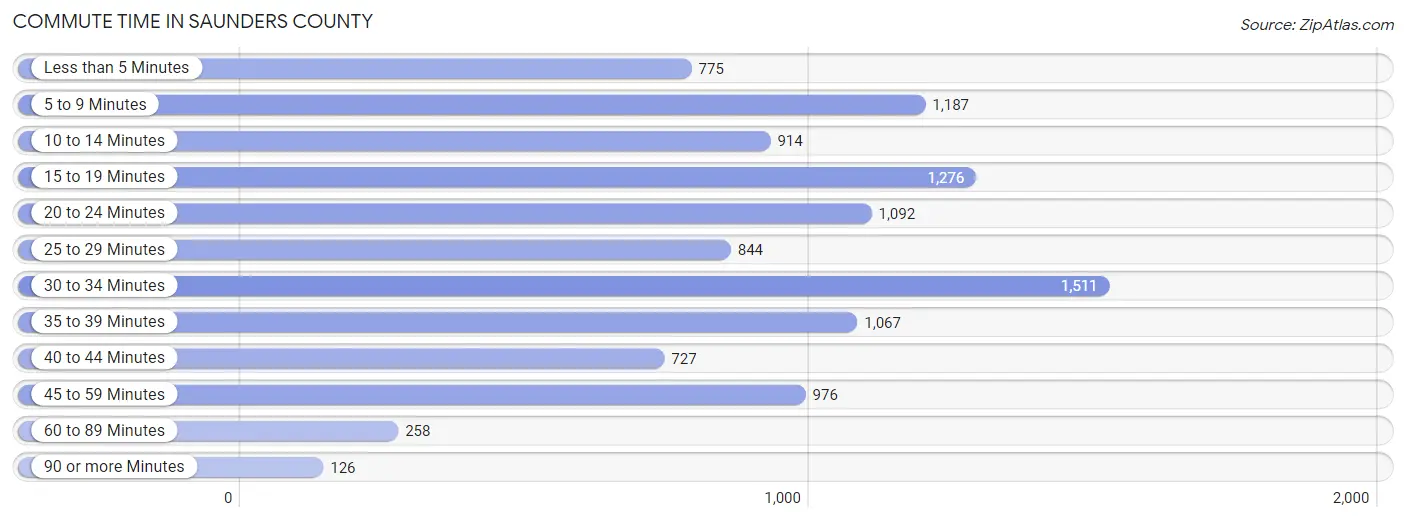
| Commute Time | # Commuters | % Commuters |
| Less than 5 Minutes | 775 | 7.2% |
| 5 to 9 Minutes | 1,187 | 11.0% |
| 10 to 14 Minutes | 914 | 8.5% |
| 15 to 19 Minutes | 1,276 | 11.9% |
| 20 to 24 Minutes | 1,092 | 10.2% |
| 25 to 29 Minutes | 844 | 7.9% |
| 30 to 34 Minutes | 1,511 | 14.1% |
| 35 to 39 Minutes | 1,067 | 9.9% |
| 40 to 44 Minutes | 727 | 6.8% |
| 45 to 59 Minutes | 976 | 9.1% |
| 60 to 89 Minutes | 258 | 2.4% |
| 90 or more Minutes | 126 | 1.2% |
Commute Time by Sex in Saunders County
The most common commute times in Saunders County are 30 to 34 minutes (984 commuters, 16.6%) for males and 5 to 9 minutes (640 commuters, 13.3%) for females.
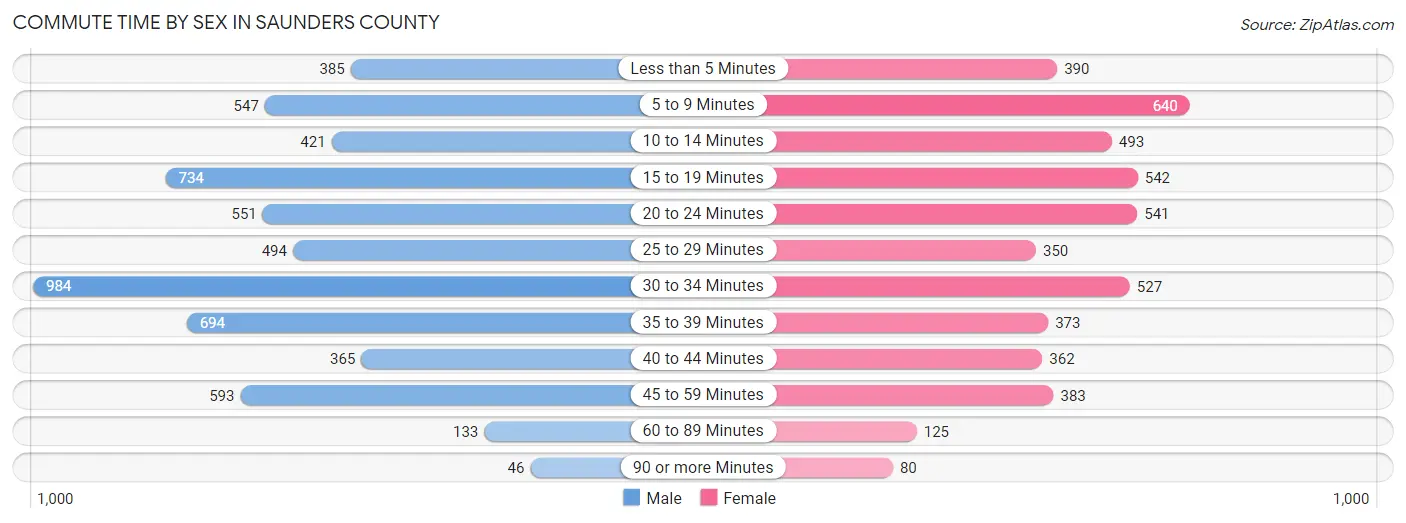
| Commute Time | Male | Female |
| Less than 5 Minutes | 385 (6.5%) | 390 (8.1%) |
| 5 to 9 Minutes | 547 (9.2%) | 640 (13.3%) |
| 10 to 14 Minutes | 421 (7.1%) | 493 (10.3%) |
| 15 to 19 Minutes | 734 (12.3%) | 542 (11.3%) |
| 20 to 24 Minutes | 551 (9.3%) | 541 (11.3%) |
| 25 to 29 Minutes | 494 (8.3%) | 350 (7.3%) |
| 30 to 34 Minutes | 984 (16.6%) | 527 (11.0%) |
| 35 to 39 Minutes | 694 (11.7%) | 373 (7.8%) |
| 40 to 44 Minutes | 365 (6.1%) | 362 (7.5%) |
| 45 to 59 Minutes | 593 (10.0%) | 383 (8.0%) |
| 60 to 89 Minutes | 133 (2.2%) | 125 (2.6%) |
| 90 or more Minutes | 46 (0.8%) | 80 (1.7%) |
Time of Departure to Work by Sex in Saunders County
The most frequent times of departure to work in Saunders County are 6:30 AM to 6:59 AM (887, 14.9%) for males and 7:00 AM to 7:29 AM (1,128, 23.5%) for females.
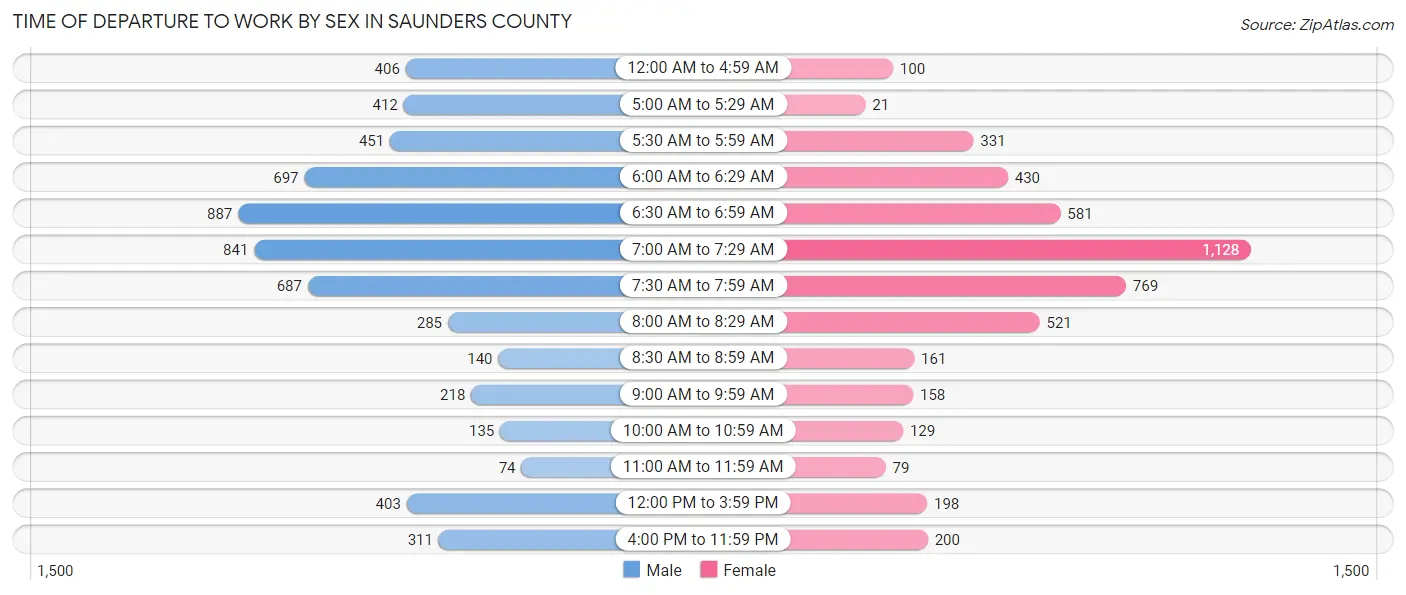
| Time of Departure | Male | Female |
| 12:00 AM to 4:59 AM | 406 (6.8%) | 100 (2.1%) |
| 5:00 AM to 5:29 AM | 412 (6.9%) | 21 (0.4%) |
| 5:30 AM to 5:59 AM | 451 (7.6%) | 331 (6.9%) |
| 6:00 AM to 6:29 AM | 697 (11.7%) | 430 (8.9%) |
| 6:30 AM to 6:59 AM | 887 (14.9%) | 581 (12.1%) |
| 7:00 AM to 7:29 AM | 841 (14.1%) | 1,128 (23.5%) |
| 7:30 AM to 7:59 AM | 687 (11.6%) | 769 (16.0%) |
| 8:00 AM to 8:29 AM | 285 (4.8%) | 521 (10.8%) |
| 8:30 AM to 8:59 AM | 140 (2.4%) | 161 (3.4%) |
| 9:00 AM to 9:59 AM | 218 (3.7%) | 158 (3.3%) |
| 10:00 AM to 10:59 AM | 135 (2.3%) | 129 (2.7%) |
| 11:00 AM to 11:59 AM | 74 (1.2%) | 79 (1.6%) |
| 12:00 PM to 3:59 PM | 403 (6.8%) | 198 (4.1%) |
| 4:00 PM to 11:59 PM | 311 (5.2%) | 200 (4.2%) |
| Total | 5,947 (100.0%) | 4,806 (100.0%) |
Housing Occupancy in Saunders County
Occupancy by Ownership in Saunders County
Of the total 8,789 dwellings in Saunders County, owner-occupied units account for 7,082 (80.6%), while renter-occupied units make up 1,707 (19.4%).
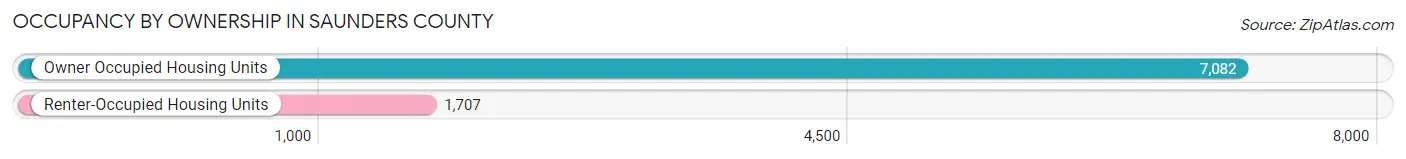
| Occupancy | # Housing Units | % Housing Units |
| Owner Occupied Housing Units | 7,082 | 80.6% |
| Renter-Occupied Housing Units | 1,707 | 19.4% |
| Total Occupied Housing Units | 8,789 | 100.0% |
Occupancy by Household Size in Saunders County
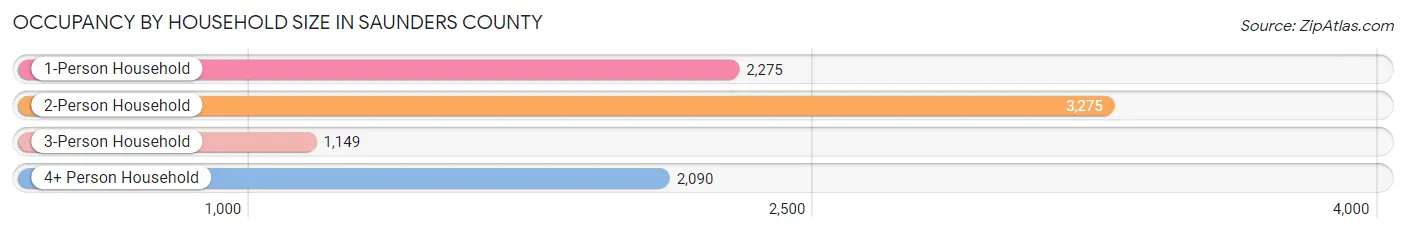
| Household Size | # Housing Units | % Housing Units |
| 1-Person Household | 2,275 | 25.9% |
| 2-Person Household | 3,275 | 37.3% |
| 3-Person Household | 1,149 | 13.1% |
| 4+ Person Household | 2,090 | 23.8% |
| Total Housing Units | 8,789 | 100.0% |
Occupancy by Ownership by Household Size in Saunders County
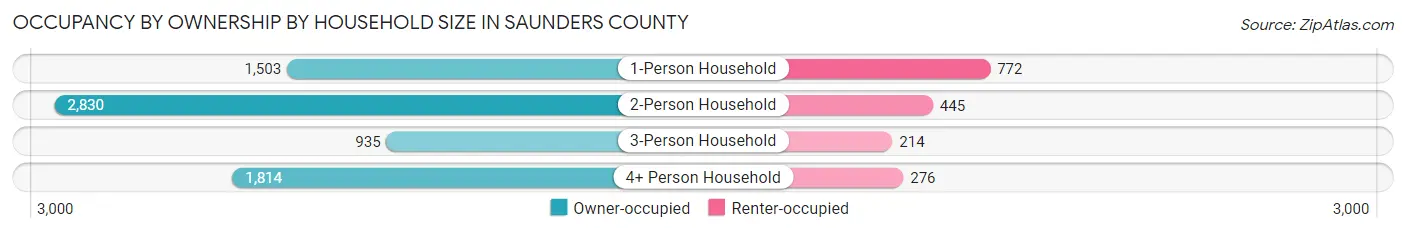
| Household Size | Owner-occupied | Renter-occupied |
| 1-Person Household | 1,503 (66.1%) | 772 (33.9%) |
| 2-Person Household | 2,830 (86.4%) | 445 (13.6%) |
| 3-Person Household | 935 (81.4%) | 214 (18.6%) |
| 4+ Person Household | 1,814 (86.8%) | 276 (13.2%) |
| Total Housing Units | 7,082 (80.6%) | 1,707 (19.4%) |
Occupancy by Educational Attainment in Saunders County
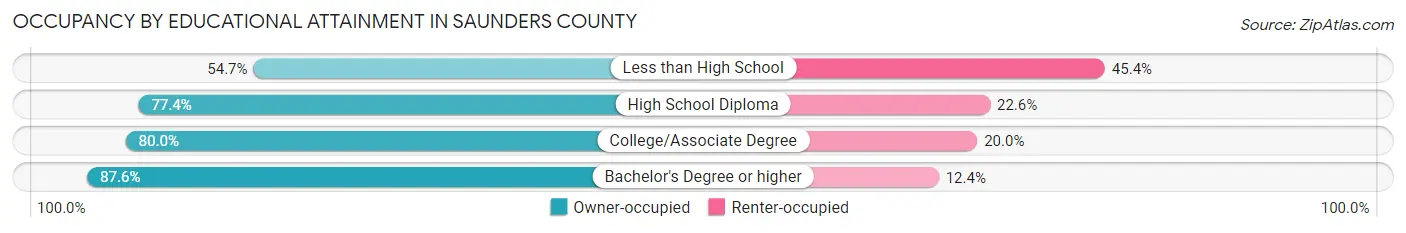
| Household Size | Owner-occupied | Renter-occupied |
| Less than High School | 182 (54.6%) | 151 (45.4%) |
| High School Diploma | 1,897 (77.4%) | 553 (22.6%) |
| College/Associate Degree | 2,701 (80.0%) | 677 (20.0%) |
| Bachelor's Degree or higher | 2,302 (87.6%) | 326 (12.4%) |
Occupancy by Age of Householder in Saunders County
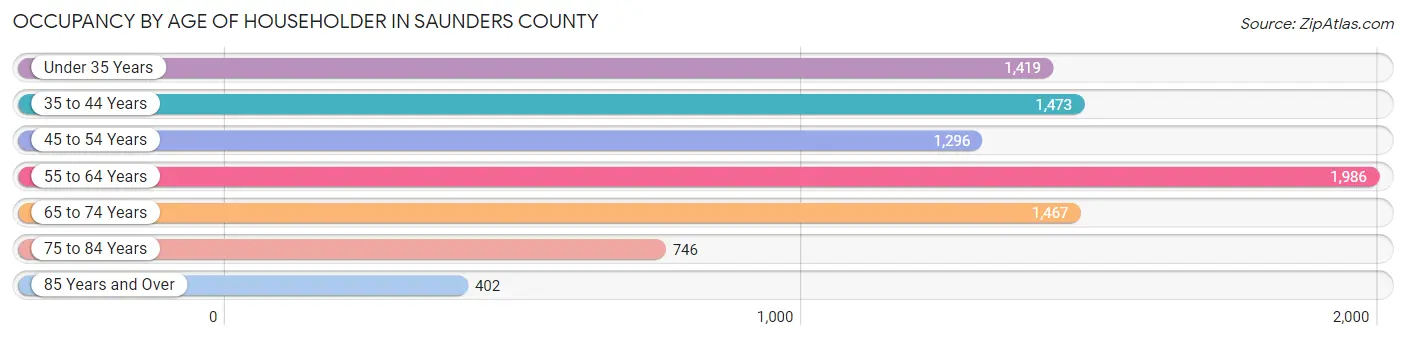
| Age Bracket | # Households | % Households |
| Under 35 Years | 1,419 | 16.2% |
| 35 to 44 Years | 1,473 | 16.8% |
| 45 to 54 Years | 1,296 | 14.7% |
| 55 to 64 Years | 1,986 | 22.6% |
| 65 to 74 Years | 1,467 | 16.7% |
| 75 to 84 Years | 746 | 8.5% |
| 85 Years and Over | 402 | 4.6% |
| Total | 8,789 | 100.0% |
Housing Finances in Saunders County
Median Income by Occupancy in Saunders County
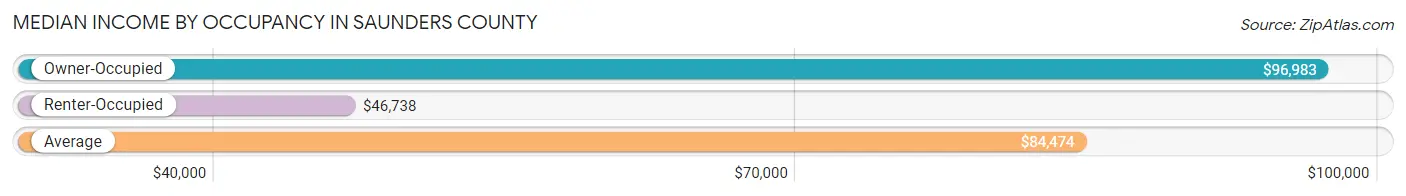
| Occupancy Type | # Households | Median Income |
| Owner-Occupied | 7,082 (80.6%) | $96,983 |
| Renter-Occupied | 1,707 (19.4%) | $46,738 |
| Average | 8,789 (100.0%) | $84,474 |
Occupancy by Householder Income Bracket in Saunders County
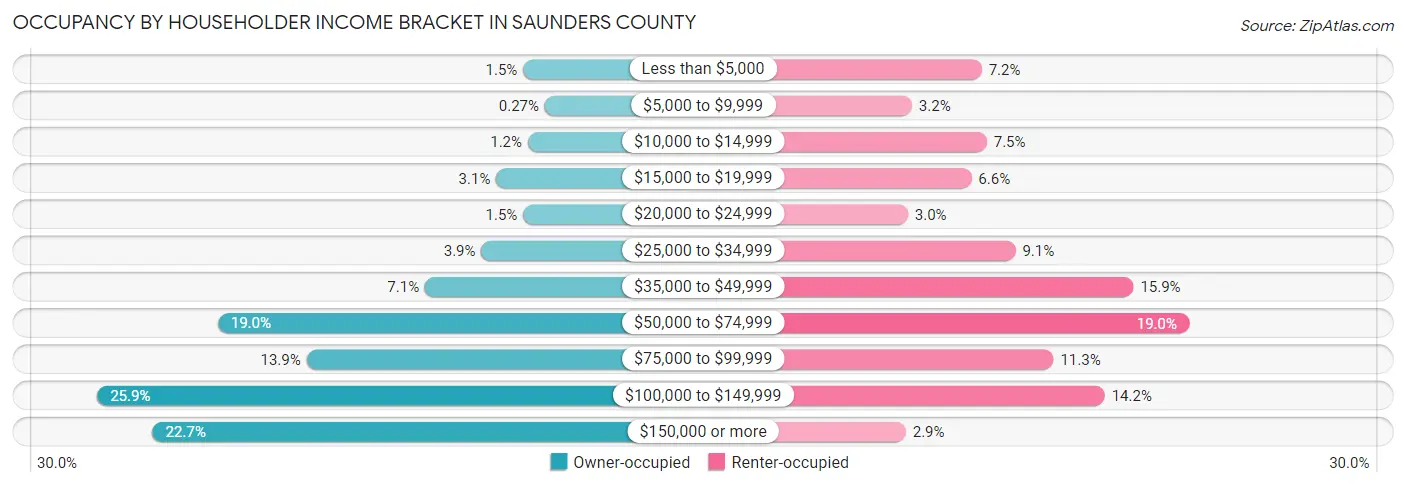
| Income Bracket | Owner-occupied | Renter-occupied |
| Less than $5,000 | 107 (1.5%) | 123 (7.2%) |
| $5,000 to $9,999 | 19 (0.3%) | 55 (3.2%) |
| $10,000 to $14,999 | 88 (1.2%) | 128 (7.5%) |
| $15,000 to $19,999 | 216 (3.0%) | 113 (6.6%) |
| $20,000 to $24,999 | 107 (1.5%) | 51 (3.0%) |
| $25,000 to $34,999 | 276 (3.9%) | 156 (9.1%) |
| $35,000 to $49,999 | 504 (7.1%) | 271 (15.9%) |
| $50,000 to $74,999 | 1,343 (19.0%) | 325 (19.0%) |
| $75,000 to $99,999 | 984 (13.9%) | 193 (11.3%) |
| $100,000 to $149,999 | 1,831 (25.9%) | 243 (14.2%) |
| $150,000 or more | 1,607 (22.7%) | 49 (2.9%) |
| Total | 7,082 (100.0%) | 1,707 (100.0%) |
Monthly Housing Cost Tiers in Saunders County
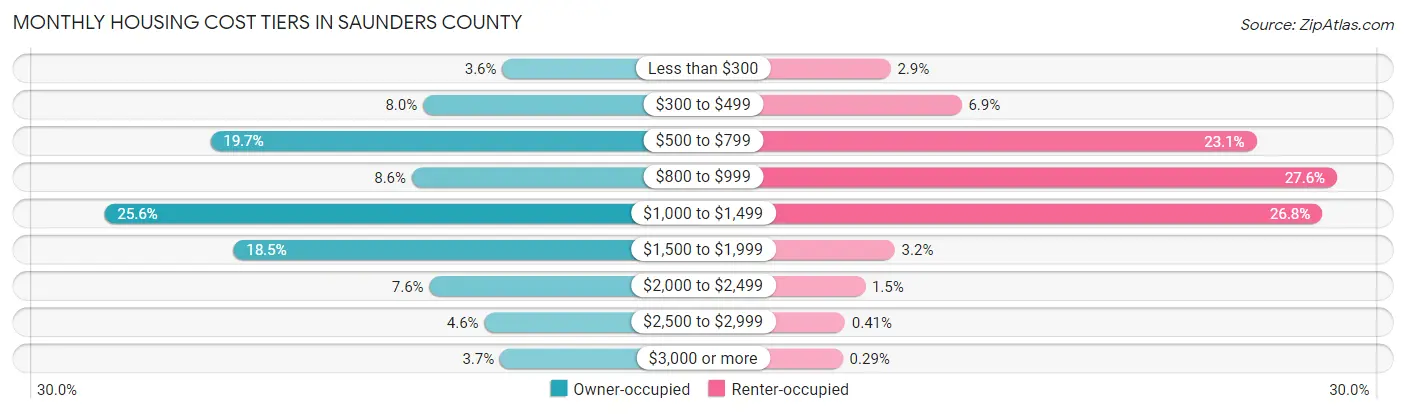
| Monthly Cost | Owner-occupied | Renter-occupied |
| Less than $300 | 256 (3.6%) | 50 (2.9%) |
| $300 to $499 | 566 (8.0%) | 117 (6.9%) |
| $500 to $799 | 1,398 (19.7%) | 395 (23.1%) |
| $800 to $999 | 610 (8.6%) | 471 (27.6%) |
| $1,000 to $1,499 | 1,812 (25.6%) | 457 (26.8%) |
| $1,500 to $1,999 | 1,308 (18.5%) | 54 (3.2%) |
| $2,000 to $2,499 | 541 (7.6%) | 26 (1.5%) |
| $2,500 to $2,999 | 326 (4.6%) | 7 (0.4%) |
| $3,000 or more | 265 (3.7%) | 5 (0.3%) |
| Total | 7,082 (100.0%) | 1,707 (100.0%) |
Physical Housing Characteristics in Saunders County
Housing Structures in Saunders County
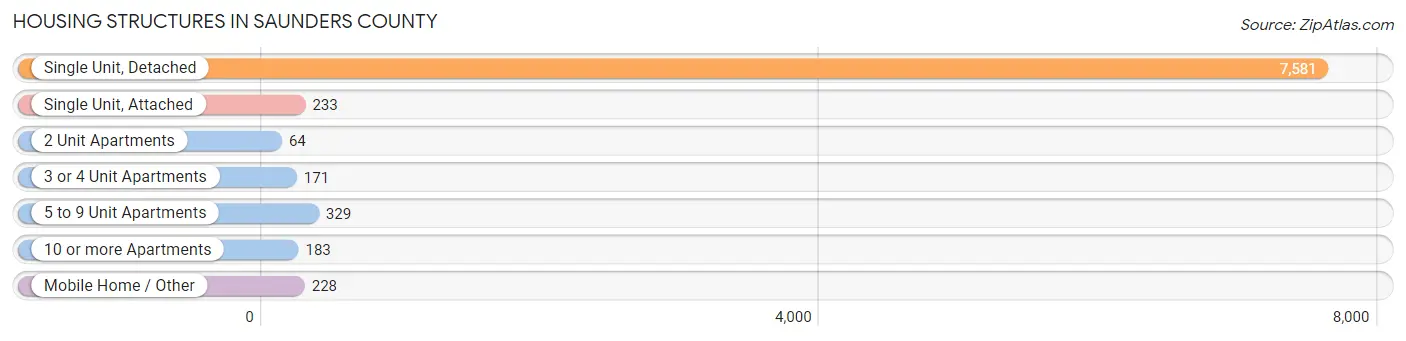
| Structure Type | # Housing Units | % Housing Units |
| Single Unit, Detached | 7,581 | 86.3% |
| Single Unit, Attached | 233 | 2.6% |
| 2 Unit Apartments | 64 | 0.7% |
| 3 or 4 Unit Apartments | 171 | 1.9% |
| 5 to 9 Unit Apartments | 329 | 3.7% |
| 10 or more Apartments | 183 | 2.1% |
| Mobile Home / Other | 228 | 2.6% |
| Total | 8,789 | 100.0% |
Housing Structures by Occupancy in Saunders County
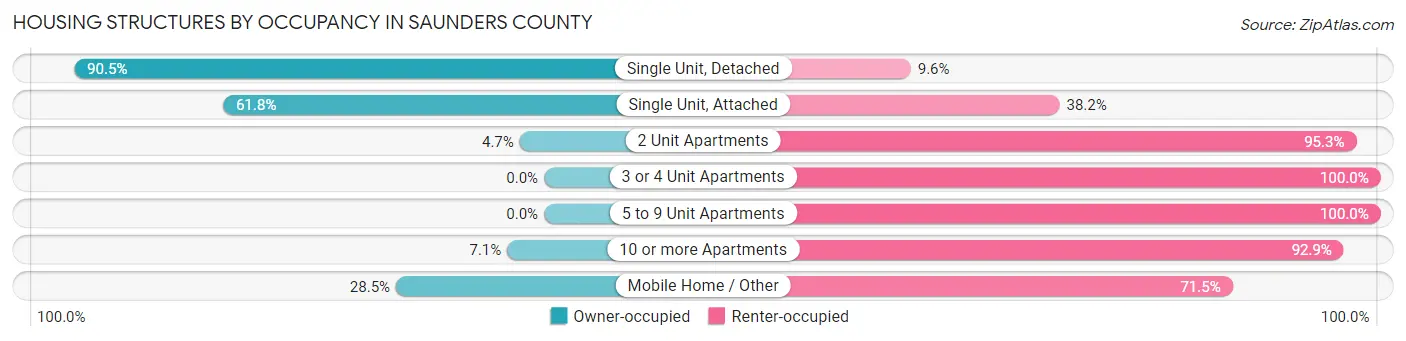
| Structure Type | Owner-occupied | Renter-occupied |
| Single Unit, Detached | 6,857 (90.4%) | 724 (9.6%) |
| Single Unit, Attached | 144 (61.8%) | 89 (38.2%) |
| 2 Unit Apartments | 3 (4.7%) | 61 (95.3%) |
| 3 or 4 Unit Apartments | 0 (0.0%) | 171 (100.0%) |
| 5 to 9 Unit Apartments | 0 (0.0%) | 329 (100.0%) |
| 10 or more Apartments | 13 (7.1%) | 170 (92.9%) |
| Mobile Home / Other | 65 (28.5%) | 163 (71.5%) |
| Total | 7,082 (80.6%) | 1,707 (19.4%) |
Housing Structures by Number of Rooms in Saunders County
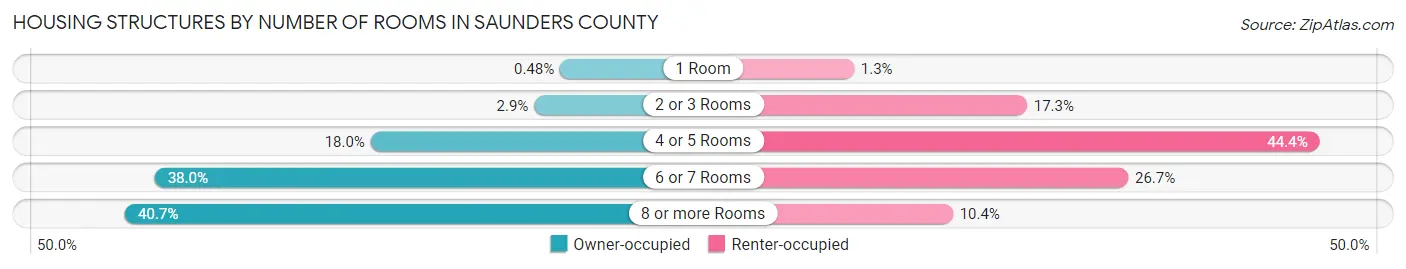
| Number of Rooms | Owner-occupied | Renter-occupied |
| 1 Room | 34 (0.5%) | 22 (1.3%) |
| 2 or 3 Rooms | 203 (2.9%) | 295 (17.3%) |
| 4 or 5 Rooms | 1,274 (18.0%) | 757 (44.4%) |
| 6 or 7 Rooms | 2,688 (38.0%) | 455 (26.7%) |
| 8 or more Rooms | 2,883 (40.7%) | 178 (10.4%) |
| Total | 7,082 (100.0%) | 1,707 (100.0%) |
Housing Structure by Heating Type in Saunders County
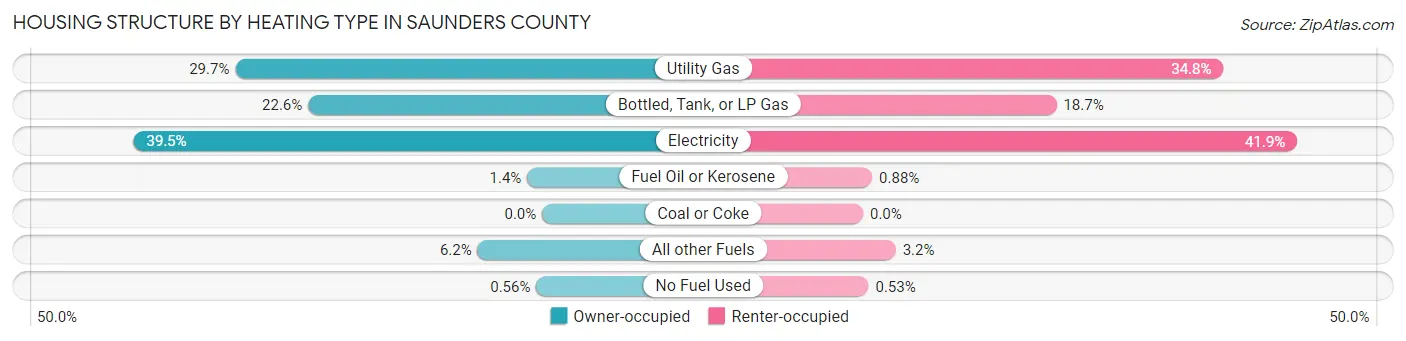
| Heating Type | Owner-occupied | Renter-occupied |
| Utility Gas | 2,100 (29.6%) | 594 (34.8%) |
| Bottled, Tank, or LP Gas | 1,601 (22.6%) | 319 (18.7%) |
| Electricity | 2,797 (39.5%) | 716 (41.9%) |
| Fuel Oil or Kerosene | 102 (1.4%) | 15 (0.9%) |
| Coal or Coke | 0 (0.0%) | 0 (0.0%) |
| All other Fuels | 442 (6.2%) | 54 (3.2%) |
| No Fuel Used | 40 (0.6%) | 9 (0.5%) |
| Total | 7,082 (100.0%) | 1,707 (100.0%) |
Household Vehicle Usage in Saunders County
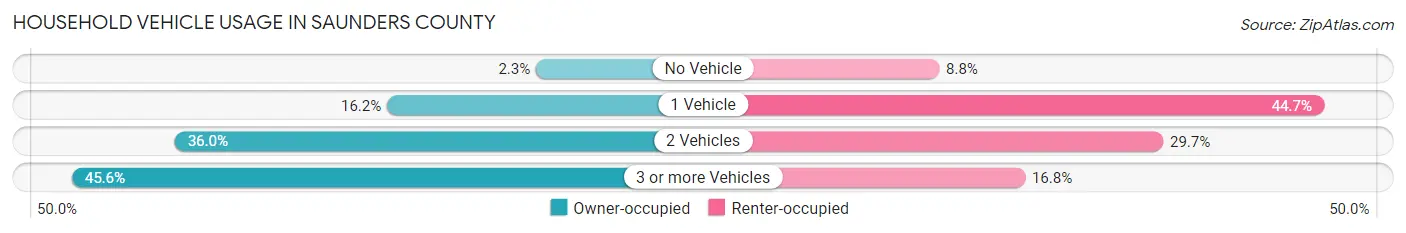
| Vehicles per Household | Owner-occupied | Renter-occupied |
| No Vehicle | 160 (2.3%) | 150 (8.8%) |
| 1 Vehicle | 1,145 (16.2%) | 763 (44.7%) |
| 2 Vehicles | 2,548 (36.0%) | 507 (29.7%) |
| 3 or more Vehicles | 3,229 (45.6%) | 287 (16.8%) |
| Total | 7,082 (100.0%) | 1,707 (100.0%) |
Real Estate & Mortgages in Saunders County
Real Estate and Mortgage Overview in Saunders County
| Characteristic | Without Mortgage | With Mortgage |
| Housing Units | 2,989 | 4,093 |
| Median Property Value | $229,300 | $216,500 |
| Median Household Income | $73,330 | $1,144 |
| Monthly Housing Costs | $666 | $262 |
| Real Estate Taxes | $3,136 | $120 |
Property Value by Mortgage Status in Saunders County
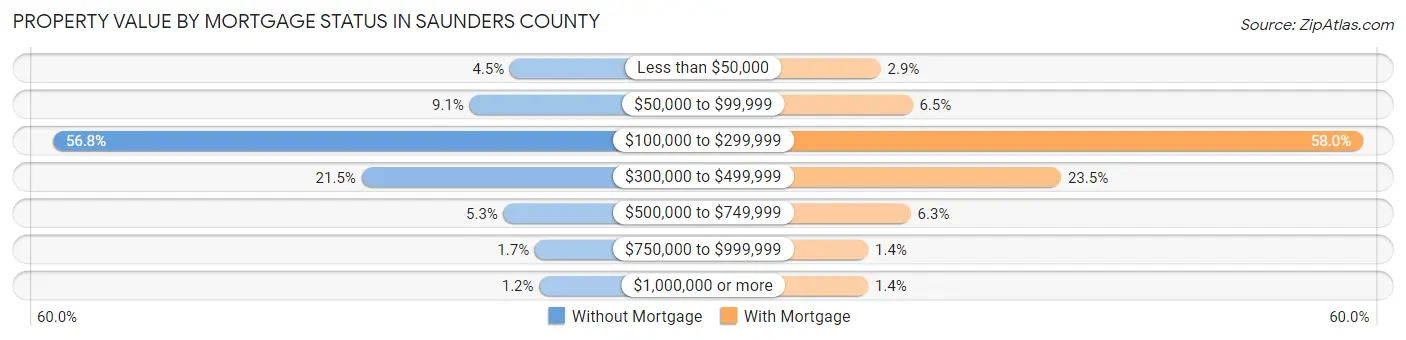
| Property Value | Without Mortgage | With Mortgage |
| Less than $50,000 | 135 (4.5%) | 117 (2.9%) |
| $50,000 to $99,999 | 273 (9.1%) | 266 (6.5%) |
| $100,000 to $299,999 | 1,697 (56.8%) | 2,374 (58.0%) |
| $300,000 to $499,999 | 642 (21.5%) | 961 (23.5%) |
| $500,000 to $749,999 | 157 (5.2%) | 258 (6.3%) |
| $750,000 to $999,999 | 50 (1.7%) | 59 (1.4%) |
| $1,000,000 or more | 35 (1.2%) | 58 (1.4%) |
| Total | 2,989 (100.0%) | 4,093 (100.0%) |
Household Income by Mortgage Status in Saunders County
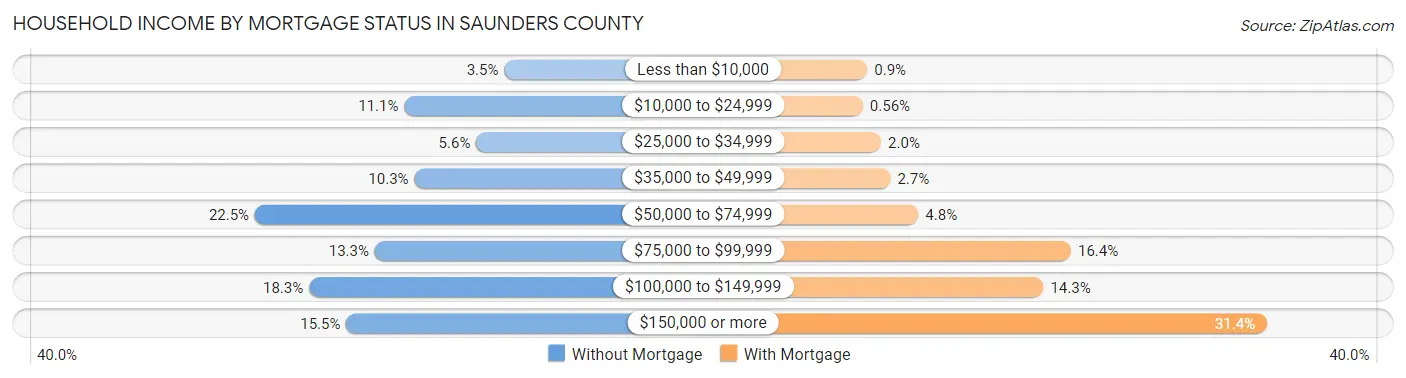
| Household Income | Without Mortgage | With Mortgage |
| Less than $10,000 | 103 (3.5%) | 37 (0.9%) |
| $10,000 to $24,999 | 331 (11.1%) | 23 (0.6%) |
| $25,000 to $34,999 | 167 (5.6%) | 80 (1.9%) |
| $35,000 to $49,999 | 308 (10.3%) | 109 (2.7%) |
| $50,000 to $74,999 | 671 (22.5%) | 196 (4.8%) |
| $75,000 to $99,999 | 398 (13.3%) | 672 (16.4%) |
| $100,000 to $149,999 | 548 (18.3%) | 586 (14.3%) |
| $150,000 or more | 463 (15.5%) | 1,283 (31.4%) |
| Total | 2,989 (100.0%) | 4,093 (100.0%) |
Property Value to Household Income Ratio in Saunders County
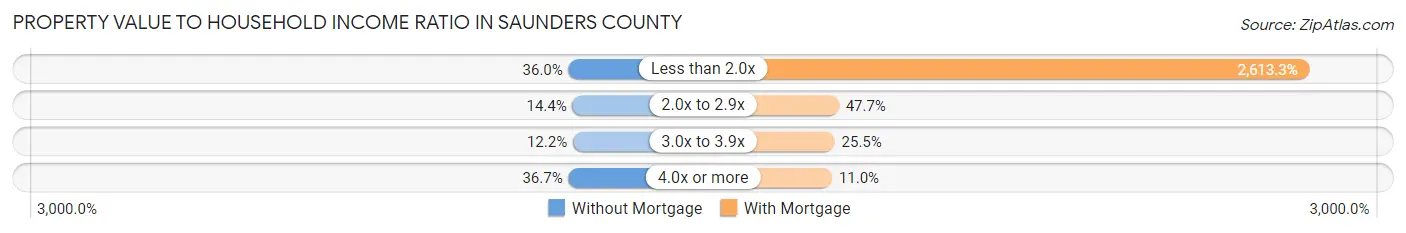
| Value-to-Income Ratio | Without Mortgage | With Mortgage |
| Less than 2.0x | 1,075 (36.0%) | 106,964 (2,613.3%) |
| 2.0x to 2.9x | 430 (14.4%) | 1,953 (47.7%) |
| 3.0x to 3.9x | 364 (12.2%) | 1,042 (25.5%) |
| 4.0x or more | 1,098 (36.7%) | 450 (11.0%) |
| Total | 2,989 (100.0%) | 4,093 (100.0%) |
Real Estate Taxes by Mortgage Status in Saunders County
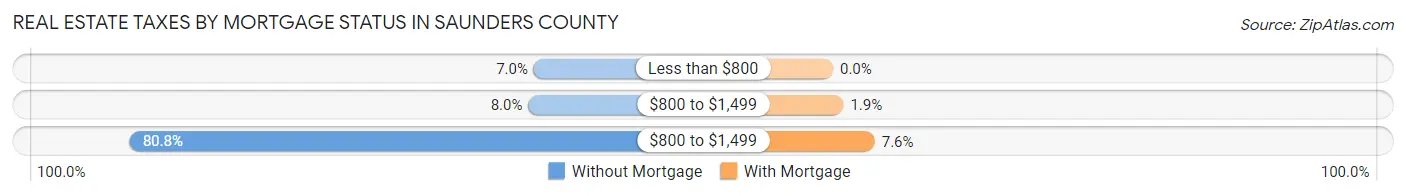
| Property Taxes | Without Mortgage | With Mortgage |
| Less than $800 | 209 (7.0%) | 0 (0.0%) |
| $800 to $1,499 | 239 (8.0%) | 78 (1.9%) |
| $800 to $1,499 | 2,415 (80.8%) | 312 (7.6%) |
| Total | 2,989 (100.0%) | 4,093 (100.0%) |
Health & Disability in Saunders County
Health Insurance Coverage by Age in Saunders County
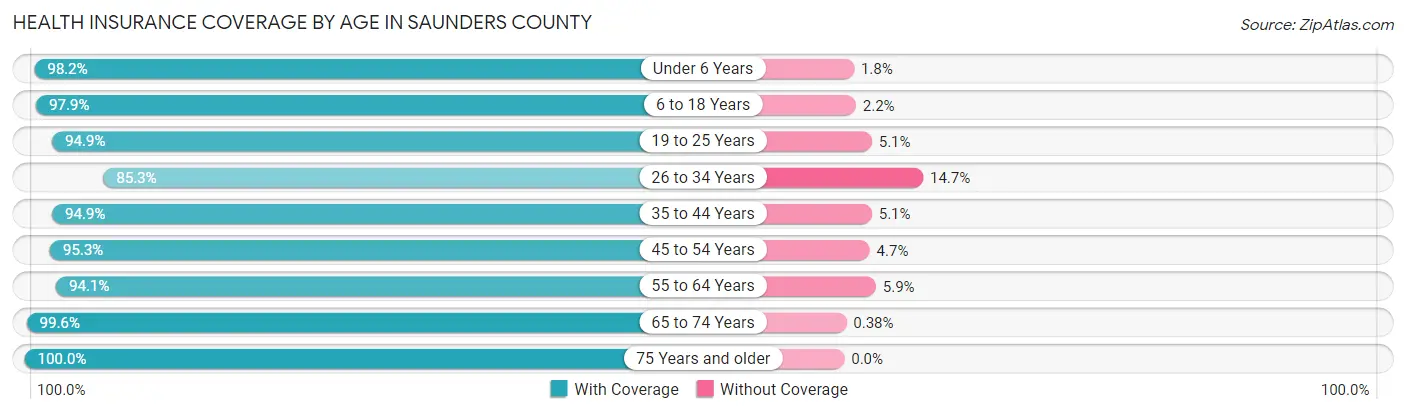
| Age Bracket | With Coverage | Without Coverage |
| Under 6 Years | 1,739 (98.2%) | 32 (1.8%) |
| 6 to 18 Years | 3,951 (97.9%) | 87 (2.1%) |
| 19 to 25 Years | 1,442 (94.9%) | 78 (5.1%) |
| 26 to 34 Years | 1,696 (85.3%) | 292 (14.7%) |
| 35 to 44 Years | 2,606 (94.9%) | 141 (5.1%) |
| 45 to 54 Years | 2,415 (95.3%) | 120 (4.7%) |
| 55 to 64 Years | 3,283 (94.1%) | 205 (5.9%) |
| 65 to 74 Years | 2,355 (99.6%) | 9 (0.4%) |
| 75 Years and older | 1,568 (100.0%) | 0 (0.0%) |
| Total | 21,055 (95.6%) | 964 (4.4%) |
Health Insurance Coverage by Citizenship Status in Saunders County
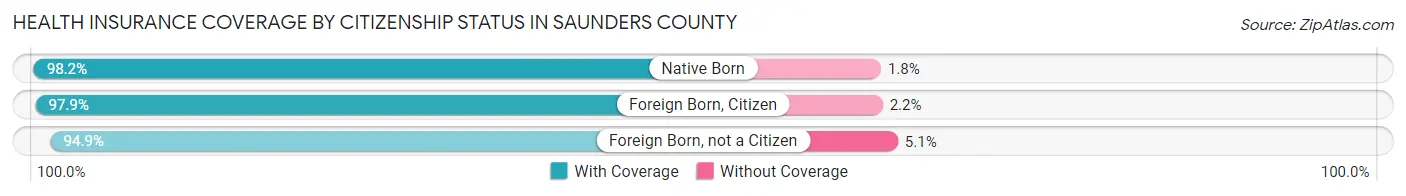
| Citizenship Status | With Coverage | Without Coverage |
| Native Born | 1,739 (98.2%) | 32 (1.8%) |
| Foreign Born, Citizen | 3,951 (97.9%) | 87 (2.1%) |
| Foreign Born, not a Citizen | 1,442 (94.9%) | 78 (5.1%) |
Health Insurance Coverage by Household Income in Saunders County
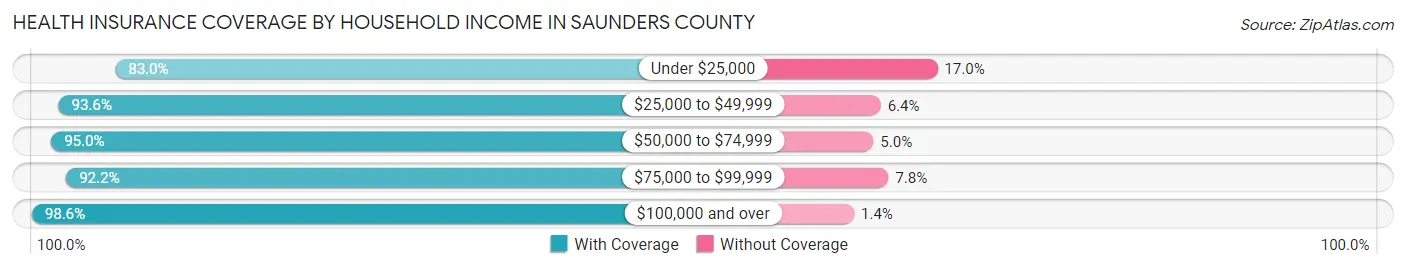
| Household Income | With Coverage | Without Coverage |
| Under $25,000 | 1,265 (83.0%) | 259 (17.0%) |
| $25,000 to $49,999 | 1,881 (93.6%) | 128 (6.4%) |
| $50,000 to $74,999 | 3,712 (95.0%) | 195 (5.0%) |
| $75,000 to $99,999 | 2,610 (92.2%) | 221 (7.8%) |
| $100,000 and over | 11,559 (98.6%) | 161 (1.4%) |
Public vs Private Health Insurance Coverage by Age in Saunders County
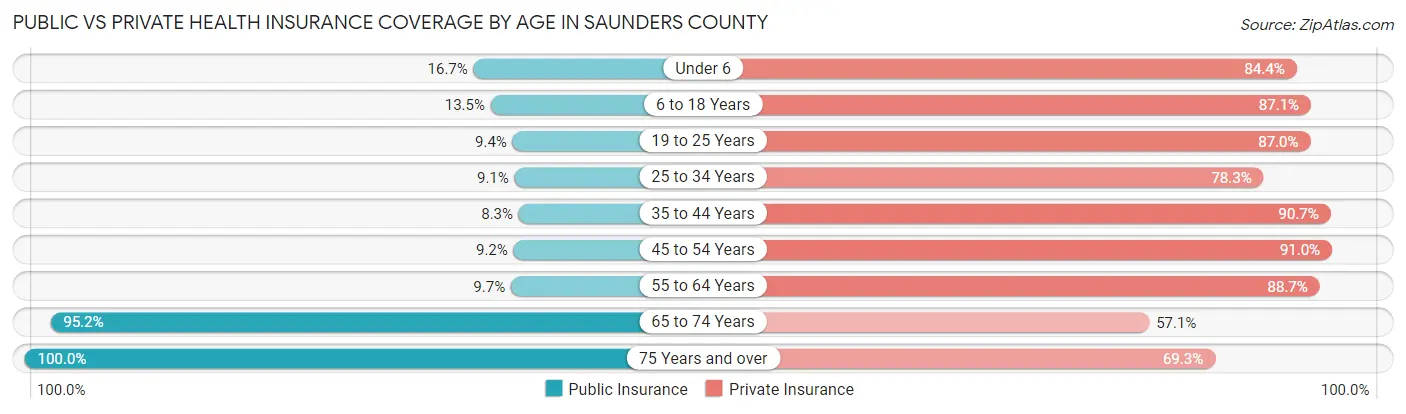
| Age Bracket | Public Insurance | Private Insurance |
| Under 6 | 295 (16.7%) | 1,495 (84.4%) |
| 6 to 18 Years | 544 (13.5%) | 3,516 (87.1%) |
| 19 to 25 Years | 143 (9.4%) | 1,322 (87.0%) |
| 25 to 34 Years | 180 (9.0%) | 1,556 (78.3%) |
| 35 to 44 Years | 227 (8.3%) | 2,492 (90.7%) |
| 45 to 54 Years | 234 (9.2%) | 2,306 (91.0%) |
| 55 to 64 Years | 339 (9.7%) | 3,093 (88.7%) |
| 65 to 74 Years | 2,251 (95.2%) | 1,349 (57.1%) |
| 75 Years and over | 1,568 (100.0%) | 1,086 (69.3%) |
| Total | 5,781 (26.3%) | 18,215 (82.7%) |
Disability Status by Sex by Age in Saunders County
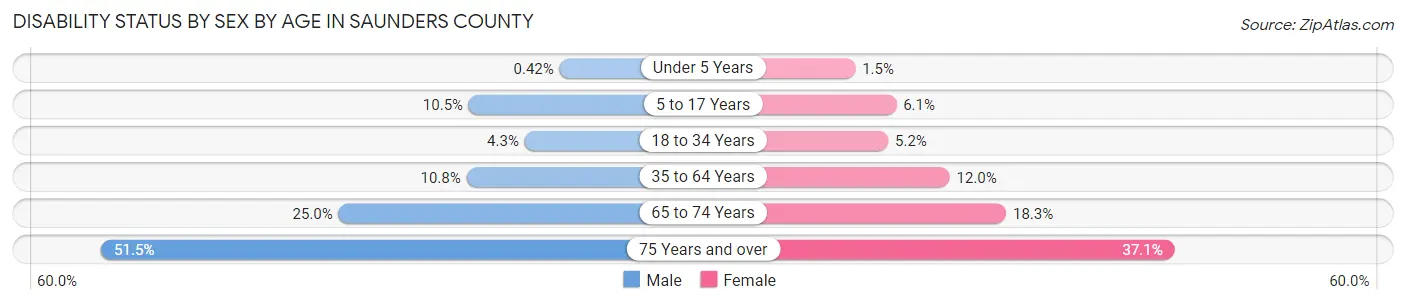
| Age Bracket | Male | Female |
| Under 5 Years | 3 (0.4%) | 10 (1.5%) |
| 5 to 17 Years | 226 (10.5%) | 117 (6.1%) |
| 18 to 34 Years | 85 (4.3%) | 97 (5.2%) |
| 35 to 64 Years | 492 (10.8%) | 505 (12.0%) |
| 65 to 74 Years | 310 (25.0%) | 206 (18.3%) |
| 75 Years and over | 332 (51.5%) | 342 (37.0%) |
Disability Class by Sex by Age in Saunders County
Disability Class: Hearing Difficulty
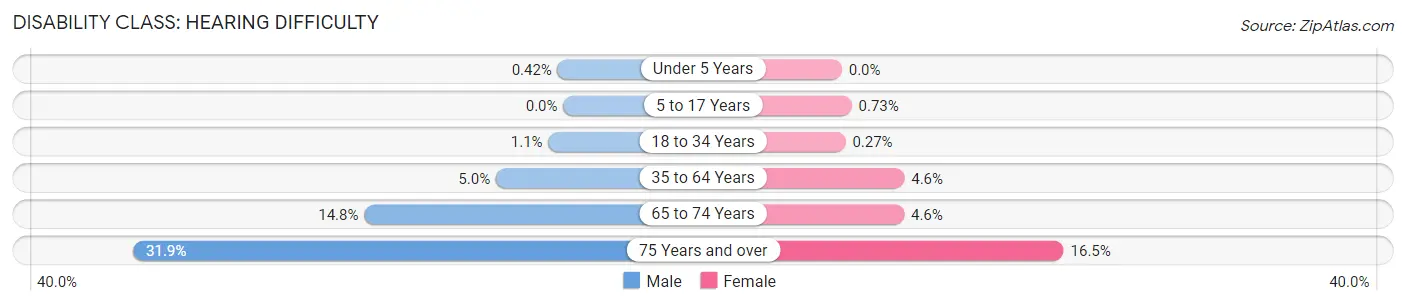
| Age Bracket | Male | Female |
| Under 5 Years | 3 (0.4%) | 0 (0.0%) |
| 5 to 17 Years | 0 (0.0%) | 14 (0.7%) |
| 18 to 34 Years | 22 (1.1%) | 5 (0.3%) |
| 35 to 64 Years | 228 (5.0%) | 195 (4.6%) |
| 65 to 74 Years | 183 (14.8%) | 52 (4.6%) |
| 75 Years and over | 206 (31.9%) | 152 (16.5%) |
Disability Class: Vision Difficulty
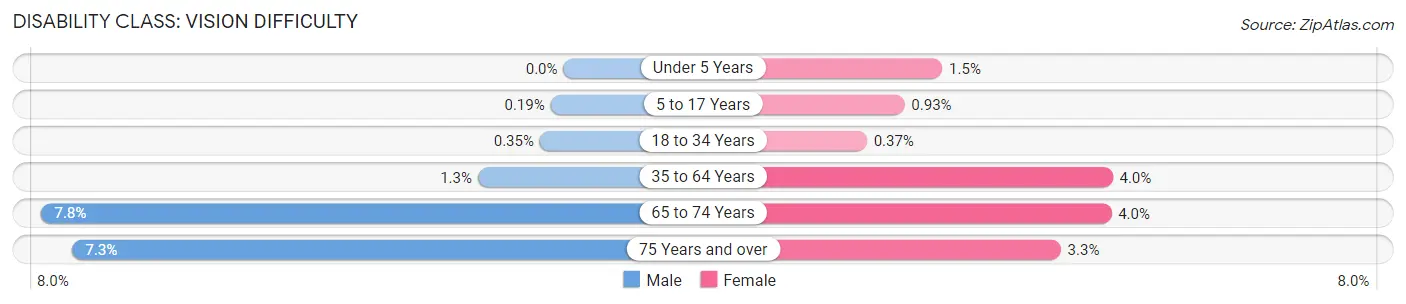
| Age Bracket | Male | Female |
| Under 5 Years | 0 (0.0%) | 10 (1.5%) |
| 5 to 17 Years | 4 (0.2%) | 18 (0.9%) |
| 18 to 34 Years | 7 (0.4%) | 7 (0.4%) |
| 35 to 64 Years | 58 (1.3%) | 169 (4.0%) |
| 65 to 74 Years | 96 (7.7%) | 45 (4.0%) |
| 75 Years and over | 47 (7.3%) | 30 (3.3%) |
Disability Class: Cognitive Difficulty
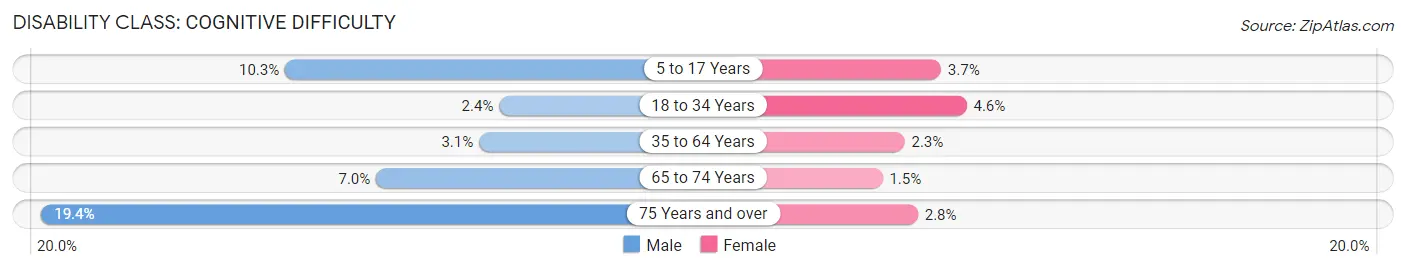
| Age Bracket | Male | Female |
| 5 to 17 Years | 222 (10.3%) | 71 (3.7%) |
| 18 to 34 Years | 47 (2.4%) | 87 (4.6%) |
| 35 to 64 Years | 143 (3.1%) | 98 (2.3%) |
| 65 to 74 Years | 86 (7.0%) | 17 (1.5%) |
| 75 Years and over | 125 (19.4%) | 26 (2.8%) |
Disability Class: Ambulatory Difficulty
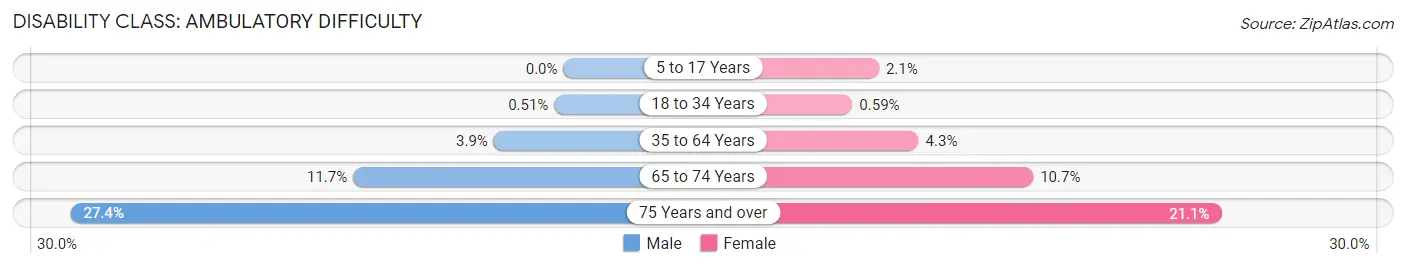
| Age Bracket | Male | Female |
| 5 to 17 Years | 0 (0.0%) | 40 (2.1%) |
| 18 to 34 Years | 10 (0.5%) | 11 (0.6%) |
| 35 to 64 Years | 177 (3.9%) | 180 (4.3%) |
| 65 to 74 Years | 145 (11.7%) | 120 (10.7%) |
| 75 Years and over | 177 (27.4%) | 195 (21.1%) |
Disability Class: Self-Care Difficulty
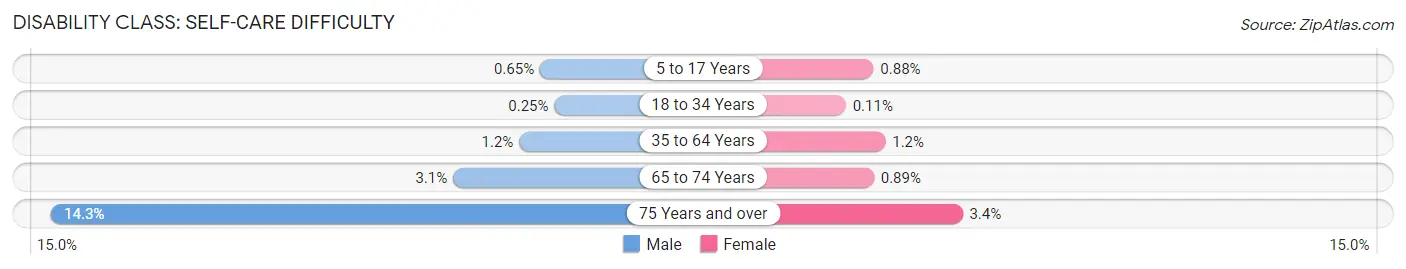
| Age Bracket | Male | Female |
| 5 to 17 Years | 14 (0.6%) | 17 (0.9%) |
| 18 to 34 Years | 5 (0.3%) | 2 (0.1%) |
| 35 to 64 Years | 56 (1.2%) | 51 (1.2%) |
| 65 to 74 Years | 38 (3.1%) | 10 (0.9%) |
| 75 Years and over | 92 (14.3%) | 31 (3.4%) |
Technology Access in Saunders County
Computing Device Access in Saunders County
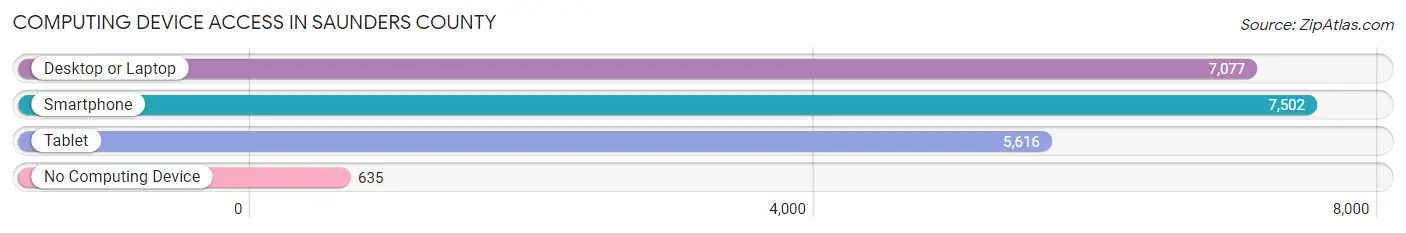
| Device Type | # Households | % Households |
| Desktop or Laptop | 7,077 | 80.5% |
| Smartphone | 7,502 | 85.4% |
| Tablet | 5,616 | 63.9% |
| No Computing Device | 635 | 7.2% |
| Total | 8,789 | 100.0% |
Internet Access in Saunders County
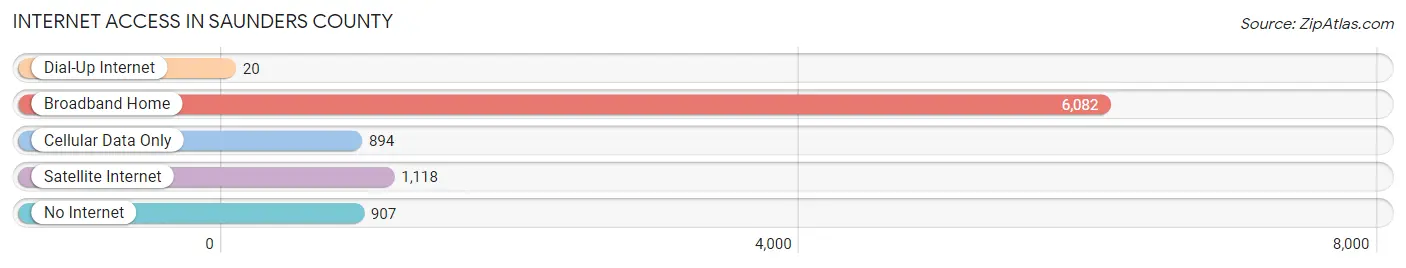
| Internet Type | # Households | % Households |
| Dial-Up Internet | 20 | 0.2% |
| Broadband Home | 6,082 | 69.2% |
| Cellular Data Only | 894 | 10.2% |
| Satellite Internet | 1,118 | 12.7% |
| No Internet | 907 | 10.3% |
| Total | 8,789 | 100.0% |
Saunders County Summary
Saunders County is located in the eastern part of Nebraska, in the Midwestern United States. It is bordered by Cass County to the north, Dodge County to the east, Otoe County to the south, and Lancaster County to the west. The county seat is Wahoo, and the largest city is Ashland. As of the 2010 census, the population was 20,780.
History
Saunders County was established in 1855 and named after Alvin Saunders, the first territorial governor of Nebraska. The county was originally part of the Omaha Indian Reservation, and the first settlers arrived in the area in the late 1840s. The county was organized in 1856, and the first county seat was located in Ashland. In 1871, the county seat was moved to Wahoo.
Geography
Saunders County covers an area of 576 square miles, of which 574 square miles is land and 2 square miles is water. The county is located in the Platte River Valley, and is drained by the Platte River and its tributaries. The terrain is generally flat, with some rolling hills in the western part of the county. The highest point in the county is located in the northwest corner, at an elevation of 1,400 feet.
The county is home to several state parks and wildlife areas, including Platte River State Park, Schramm Park State Recreation Area, and Two Rivers State Recreation Area.
Economy
Agriculture is the main economic activity in Saunders County. The county is home to a variety of crops, including corn, soybeans, wheat, and hay. Livestock production is also important, with cattle, hogs, and sheep being raised in the area.
The county is also home to several manufacturing companies, including a food processing plant, a plastics manufacturer, and a metal fabrication plant.
Demographics
As of the 2010 census, there were 20,780 people, 7,845 households, and 5,541 families living in Saunders County. The population density was 36 people per square mile. The racial makeup of the county was 95.3% White, 0.7% African American, 0.4% Native American, 0.5% Asian, 0.1% Pacific Islander, 1.7% from other races, and 1.3% from two or more races. Hispanic or Latino of any race were 4.2% of the population.
The median income for a household in the county was $50,945, and the median income for a family was $60,945. The per capita income for the county was $23,945. About 5.2% of families and 7.3% of the population were below the poverty line, including 9.2% of those under age 18 and 6.2% of those age 65 or over.
Common Questions
What is the Total Population of Saunders County?
Total Population of Saunders County is 22,374.
What is the Total Male Population of Saunders County?
Total Male Population of Saunders County is 11,495.
What is the Total Female Population of Saunders County?
Total Female Population of Saunders County is 10,879.
What is the Ratio of Males per 100 Females in Saunders County?
There are 105.66 Males per 100 Females in Saunders County.
What is the Ratio of Females per 100 Males in Saunders County?
There are 94.64 Females per 100 Males in Saunders County.
What is the Median Population Age in Saunders County?
Median Population Age in Saunders County is 40.4 Years.
What is the Average Family Size in Saunders County
Average Family Size in Saunders County is 3.0 People.
What is the Average Household Size in Saunders County
Average Household Size in Saunders County is 2.5 People.
What is Per Capita Income in Saunders County?
Per Capita income in Saunders County is $41,364.
What is the Median Family Income in Saunders County?
Median Family Income in Saunders County is $102,668.
What is the Median Household income in Saunders County?
Median Household Income in Saunders County is $84,474.
What is Income or Wage Gap in Saunders County?
Income or Wage Gap in Saunders County is 34.0%.
Women in Saunders County earn 66.0 cents for every dollar earned by a man.
What is Family Income Deficit in Saunders County?
Family Income Deficit in Saunders County is $11,194.
Families that are below poverty line in Saunders County earn $11,194 less on average than the poverty threshold level.
What is Inequality or Gini Index in Saunders County?
Inequality or Gini Index in Saunders County is 0.41.
How Large is the Labor Force in Saunders County?
There are 12,199 People in the Labor Forcein in Saunders County.
What is the Percentage of People in the Labor Force in Saunders County?
69.2% of People are in the Labor Force in Saunders County.
What is the Unemployment Rate in Saunders County?
Unemployment Rate in Saunders County is 2.4%.