Sarpy County, NE
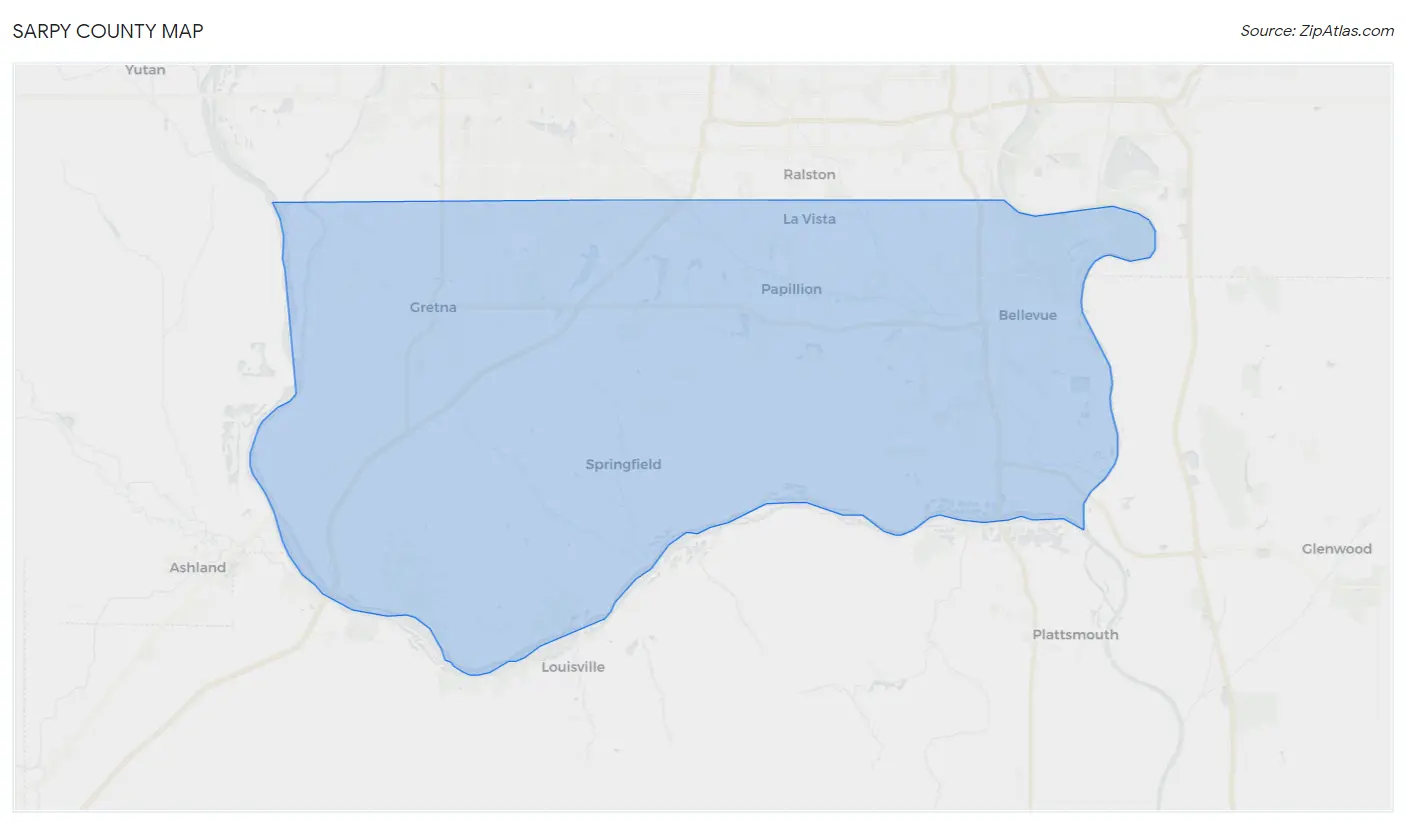
Sarpy County Map
Sarpy County Overview
191,272
TOTAL POPULATION
96,591
MALE POPULATION
94,681
FEMALE POPULATION
102.02
MALES / 100 FEMALES
98.02
FEMALES / 100 MALES
35.3
MEDIAN AGE
3.2
AVG FAMILY SIZE
2.7
AVG HOUSEHOLD SIZE
$43,845
PER CAPITA INCOME
$114,500
AVG FAMILY INCOME
$95,911
AVG HOUSEHOLD INCOME
31.5%
WAGE / INCOME GAP [ % ]
68.5¢/ $1
WAGE / INCOME GAP [ $ ]
$10,129
FAMILY INCOME DEFICIT
0.40
INEQUALITY / GINI INDEX
107,143
LABOR FORCE [ PEOPLE ]
73.2%
PERCENT IN LABOR FORCE
2.6%
UNEMPLOYMENT RATE
Sarpy County Area Codes
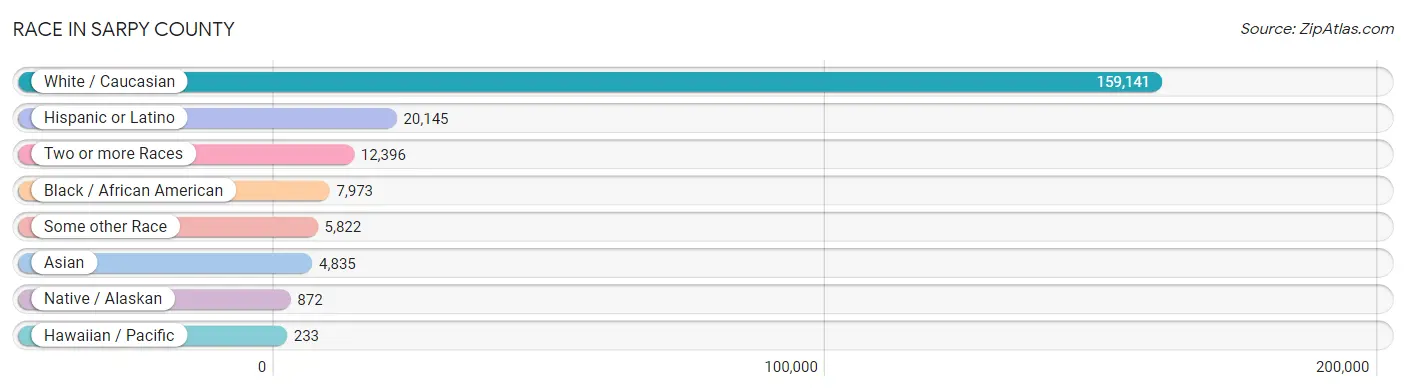
Race in Sarpy County
The most populous races in Sarpy County are White / Caucasian (159,141 | 83.2%), Hispanic or Latino (20,145 | 10.5%), and Two or more Races (12,396 | 6.5%).
| Race | # Population | % Population |
| Asian | 4,835 | 2.5% |
| Black / African American | 7,973 | 4.2% |
| Hawaiian / Pacific | 233 | 0.1% |
| Hispanic or Latino | 20,145 | 10.5% |
| Native / Alaskan | 872 | 0.5% |
| White / Caucasian | 159,141 | 83.2% |
| Two or more Races | 12,396 | 6.5% |
| Some other Race | 5,822 | 3.0% |
| Total | 191,272 | 100.0% |
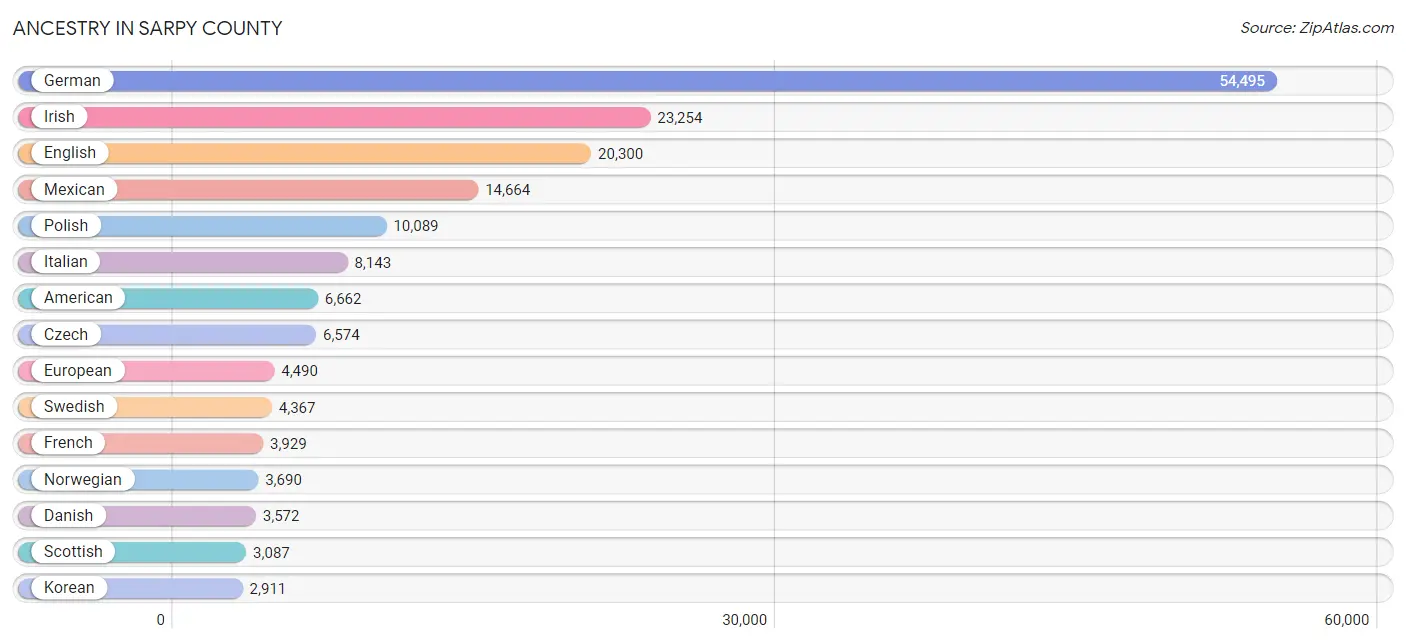
Ancestry in Sarpy County
The most populous ancestries reported in Sarpy County are German (54,495 | 28.5%), Irish (23,254 | 12.2%), English (20,300 | 10.6%), Mexican (14,664 | 7.7%), and Polish (10,089 | 5.3%), together accounting for 64.2% of all Sarpy County residents.
| Ancestry | # Population | % Population |
| Afghan | 35 | 0.0% |
| African | 317 | 0.2% |
| Albanian | 25 | 0.0% |
| American | 6,662 | 3.5% |
| Apache | 36 | 0.0% |
| Arab | 420 | 0.2% |
| Argentinean | 23 | 0.0% |
| Armenian | 6 | 0.0% |
| Assyrian / Chaldean / Syriac | 11 | 0.0% |
| Australian | 41 | 0.0% |
| Austrian | 297 | 0.2% |
| Bahamian | 40 | 0.0% |
| Belgian | 314 | 0.2% |
| Belizean | 11 | 0.0% |
| Bhutanese | 683 | 0.4% |
| Blackfeet | 21 | 0.0% |
| Bolivian | 62 | 0.0% |
| British | 1,105 | 0.6% |
| British West Indian | 53 | 0.0% |
| Bulgarian | 7 | 0.0% |
| Burmese | 966 | 0.5% |
| Canadian | 177 | 0.1% |
| Celtic | 31 | 0.0% |
| Central American | 1,406 | 0.7% |
| Central American Indian | 46 | 0.0% |
| Cherokee | 434 | 0.2% |
| Cheyenne | 13 | 0.0% |
| Chickasaw | 7 | 0.0% |
| Chinese | 30 | 0.0% |
| Chippewa | 53 | 0.0% |
| Choctaw | 41 | 0.0% |
| Colombian | 184 | 0.1% |
| Comanche | 36 | 0.0% |
| Costa Rican | 7 | 0.0% |
| Croatian | 467 | 0.2% |
| Crow | 8 | 0.0% |
| Cuban | 236 | 0.1% |
| Czech | 6,574 | 3.4% |
| Czechoslovakian | 528 | 0.3% |
| Danish | 3,572 | 1.9% |
| Delaware | 3 | 0.0% |
| Dominican | 251 | 0.1% |
| Dutch | 2,496 | 1.3% |
| Eastern European | 489 | 0.3% |
| Ecuadorian | 3 | 0.0% |
| English | 20,300 | 10.6% |
| European | 4,490 | 2.4% |
| Finnish | 351 | 0.2% |
| French | 3,929 | 2.1% |
| French American Indian | 22 | 0.0% |
| French Canadian | 786 | 0.4% |
| German | 54,495 | 28.5% |
| German Russian | 32 | 0.0% |
| Ghanaian | 39 | 0.0% |
| Greek | 457 | 0.2% |
| Guamanian / Chamorro | 122 | 0.1% |
| Guatemalan | 320 | 0.2% |
| Haitian | 13 | 0.0% |
| Honduran | 30 | 0.0% |
| Hungarian | 509 | 0.3% |
| Icelander | 47 | 0.0% |
| Indian (Asian) | 787 | 0.4% |
| Indonesian | 21 | 0.0% |
| Inupiat | 11 | 0.0% |
| Iranian | 38 | 0.0% |
| Iraqi | 47 | 0.0% |
| Irish | 23,254 | 12.2% |
| Iroquois | 20 | 0.0% |
| Italian | 8,143 | 4.3% |
| Jamaican | 45 | 0.0% |
| Japanese | 226 | 0.1% |
| Kenyan | 119 | 0.1% |
| Korean | 2,911 | 1.5% |
| Latvian | 68 | 0.0% |
| Lebanese | 216 | 0.1% |
| Lithuanian | 389 | 0.2% |
| Lumbee | 5 | 0.0% |
| Luxembourger | 30 | 0.0% |
| Malaysian | 61 | 0.0% |
| Mexican | 14,664 | 7.7% |
| Mexican American Indian | 178 | 0.1% |
| Native Hawaiian | 212 | 0.1% |
| Navajo | 150 | 0.1% |
| New Zealander | 9 | 0.0% |
| Nicaraguan | 76 | 0.0% |
| Nigerian | 6 | 0.0% |
| Northern European | 252 | 0.1% |
| Norwegian | 3,690 | 1.9% |
| Pakistani | 316 | 0.2% |
| Panamanian | 114 | 0.1% |
| Paraguayan | 3 | 0.0% |
| Pennsylvania German | 45 | 0.0% |
| Peruvian | 180 | 0.1% |
| Polish | 10,089 | 5.3% |
| Portuguese | 230 | 0.1% |
| Potawatomi | 93 | 0.1% |
| Pueblo | 38 | 0.0% |
| Puerto Rican | 1,186 | 0.6% |
| Romanian | 143 | 0.1% |
| Russian | 493 | 0.3% |
| Salvadoran | 859 | 0.4% |
| Samoan | 40 | 0.0% |
| Scandinavian | 775 | 0.4% |
| Scotch-Irish | 1,888 | 1.0% |
| Scottish | 3,087 | 1.6% |
| Serbian | 207 | 0.1% |
| Shoshone | 13 | 0.0% |
| Sioux | 214 | 0.1% |
| Slavic | 172 | 0.1% |
| Slovak | 58 | 0.0% |
| Slovene | 11 | 0.0% |
| Somali | 115 | 0.1% |
| South African | 30 | 0.0% |
| South American | 594 | 0.3% |
| South American Indian | 32 | 0.0% |
| Spaniard | 711 | 0.4% |
| Spanish | 409 | 0.2% |
| Spanish American | 107 | 0.1% |
| Sri Lankan | 940 | 0.5% |
| Subsaharan African | 1,918 | 1.0% |
| Sudanese | 650 | 0.3% |
| Swedish | 4,367 | 2.3% |
| Swiss | 633 | 0.3% |
| Syrian | 46 | 0.0% |
| Thai | 560 | 0.3% |
| Tohono O'Odham | 1 | 0.0% |
| Trinidadian and Tobagonian | 26 | 0.0% |
| Turkish | 54 | 0.0% |
| Ukrainian | 144 | 0.1% |
| Uruguayan | 41 | 0.0% |
| Venezuelan | 98 | 0.1% |
| Welsh | 1,317 | 0.7% |
| West Indian | 9 | 0.0% |
| Yugoslavian | 25 | 0.0% |
| Yuman | 13 | 0.0% |
| Yup'ik | 6 | 0.0% | View All 136 Rows |
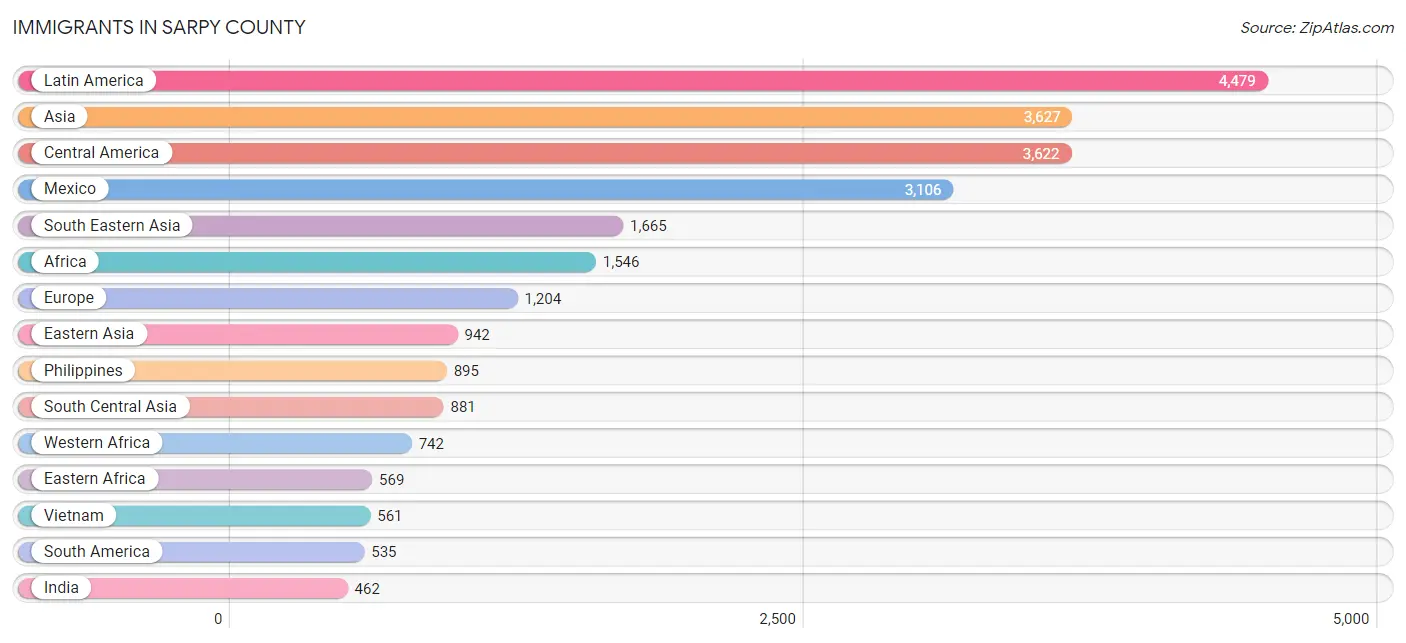
Immigrants in Sarpy County
The most numerous immigrant groups reported in Sarpy County came from Latin America (4,479 | 2.3%), Asia (3,627 | 1.9%), Central America (3,622 | 1.9%), Mexico (3,106 | 1.6%), and South Eastern Asia (1,665 | 0.9%), together accounting for 8.6% of all Sarpy County residents.
| Immigration Origin | # Population | % Population |
| Afghanistan | 175 | 0.1% |
| Africa | 1,546 | 0.8% |
| Argentina | 69 | 0.0% |
| Asia | 3,627 | 1.9% |
| Australia | 19 | 0.0% |
| Bahamas | 20 | 0.0% |
| Belarus | 30 | 0.0% |
| Bolivia | 40 | 0.0% |
| Bosnia and Herzegovina | 43 | 0.0% |
| Brazil | 18 | 0.0% |
| Cambodia | 74 | 0.0% |
| Cameroon | 70 | 0.0% |
| Canada | 189 | 0.1% |
| Caribbean | 322 | 0.2% |
| Central America | 3,622 | 1.9% |
| China | 250 | 0.1% |
| Colombia | 301 | 0.2% |
| Costa Rica | 7 | 0.0% |
| Cuba | 64 | 0.0% |
| Dominican Republic | 162 | 0.1% |
| Eastern Africa | 569 | 0.3% |
| Eastern Asia | 942 | 0.5% |
| Eastern Europe | 421 | 0.2% |
| El Salvador | 268 | 0.1% |
| England | 94 | 0.1% |
| Ethiopia | 41 | 0.0% |
| Europe | 1,204 | 0.6% |
| France | 4 | 0.0% |
| Germany | 293 | 0.2% |
| Ghana | 59 | 0.0% |
| Guatemala | 114 | 0.1% |
| Honduras | 29 | 0.0% |
| Hungary | 123 | 0.1% |
| India | 462 | 0.2% |
| Iran | 20 | 0.0% |
| Iraq | 53 | 0.0% |
| Ireland | 48 | 0.0% |
| Italy | 34 | 0.0% |
| Japan | 293 | 0.2% |
| Jordan | 18 | 0.0% |
| Kazakhstan | 13 | 0.0% |
| Kenya | 196 | 0.1% |
| Korea | 399 | 0.2% |
| Laos | 16 | 0.0% |
| Latin America | 4,479 | 2.3% |
| Lebanon | 14 | 0.0% |
| Lithuania | 19 | 0.0% |
| Malaysia | 8 | 0.0% |
| Mexico | 3,106 | 1.6% |
| Middle Africa | 70 | 0.0% |
| Nepal | 99 | 0.1% |
| Netherlands | 40 | 0.0% |
| Nicaragua | 48 | 0.0% |
| Northern Africa | 7 | 0.0% |
| Northern Europe | 311 | 0.2% |
| Oceania | 19 | 0.0% |
| Pakistan | 59 | 0.0% |
| Panama | 50 | 0.0% |
| Peru | 62 | 0.0% |
| Philippines | 895 | 0.5% |
| Poland | 31 | 0.0% |
| Romania | 55 | 0.0% |
| Russia | 78 | 0.0% |
| Scotland | 9 | 0.0% |
| Somalia | 115 | 0.1% |
| South Africa | 97 | 0.1% |
| South America | 535 | 0.3% |
| South Central Asia | 881 | 0.5% |
| South Eastern Asia | 1,665 | 0.9% |
| Southern Europe | 78 | 0.0% |
| Spain | 44 | 0.0% |
| Sudan | 7 | 0.0% |
| Sweden | 18 | 0.0% |
| Taiwan | 61 | 0.0% |
| Thailand | 94 | 0.1% |
| Trinidad and Tobago | 14 | 0.0% |
| Turkey | 54 | 0.0% |
| Ukraine | 13 | 0.0% |
| Uzbekistan | 9 | 0.0% |
| Venezuela | 45 | 0.0% |
| Vietnam | 561 | 0.3% |
| Western Africa | 742 | 0.4% |
| Western Asia | 139 | 0.1% |
| Western Europe | 337 | 0.2% | View All 84 Rows |
Sex and Age in Sarpy County
Sex and Age in Sarpy County
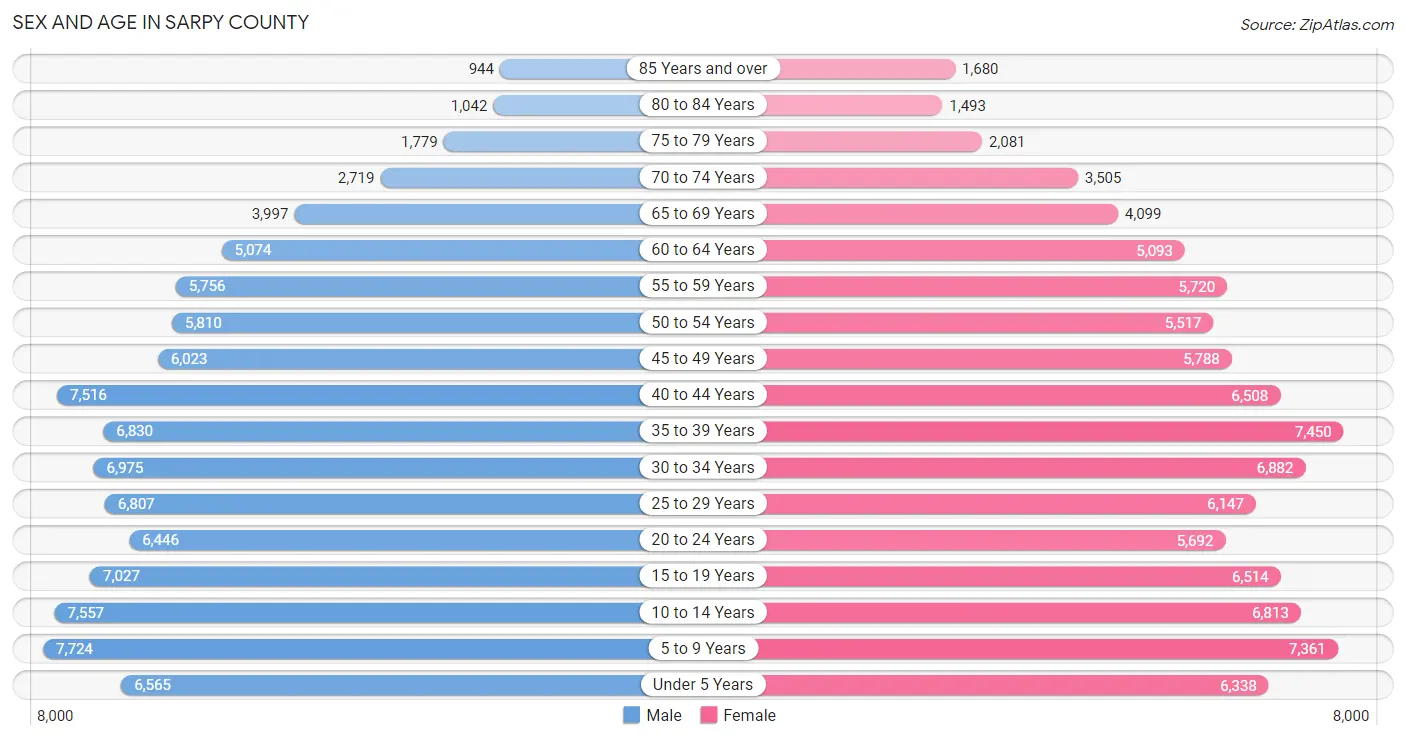
The most populous age groups in Sarpy County are 5 to 9 Years (7,724 | 8.0%) for men and 35 to 39 Years (7,450 | 7.9%) for women.
| Age Bracket | Male | Female |
| Under 5 Years | 6,565 (6.8%) | 6,338 (6.7%) |
| 5 to 9 Years | 7,724 (8.0%) | 7,361 (7.8%) |
| 10 to 14 Years | 7,557 (7.8%) | 6,813 (7.2%) |
| 15 to 19 Years | 7,027 (7.3%) | 6,514 (6.9%) |
| 20 to 24 Years | 6,446 (6.7%) | 5,692 (6.0%) |
| 25 to 29 Years | 6,807 (7.0%) | 6,147 (6.5%) |
| 30 to 34 Years | 6,975 (7.2%) | 6,882 (7.3%) |
| 35 to 39 Years | 6,830 (7.1%) | 7,450 (7.9%) |
| 40 to 44 Years | 7,516 (7.8%) | 6,508 (6.9%) |
| 45 to 49 Years | 6,023 (6.2%) | 5,788 (6.1%) |
| 50 to 54 Years | 5,810 (6.0%) | 5,517 (5.8%) |
| 55 to 59 Years | 5,756 (6.0%) | 5,720 (6.0%) |
| 60 to 64 Years | 5,074 (5.2%) | 5,093 (5.4%) |
| 65 to 69 Years | 3,997 (4.1%) | 4,099 (4.3%) |
| 70 to 74 Years | 2,719 (2.8%) | 3,505 (3.7%) |
| 75 to 79 Years | 1,779 (1.8%) | 2,081 (2.2%) |
| 80 to 84 Years | 1,042 (1.1%) | 1,493 (1.6%) |
| 85 Years and over | 944 (1.0%) | 1,680 (1.8%) |
| Total | 96,591 (100.0%) | 94,681 (100.0%) |
Families and Households in Sarpy County
Median Family Size in Sarpy County
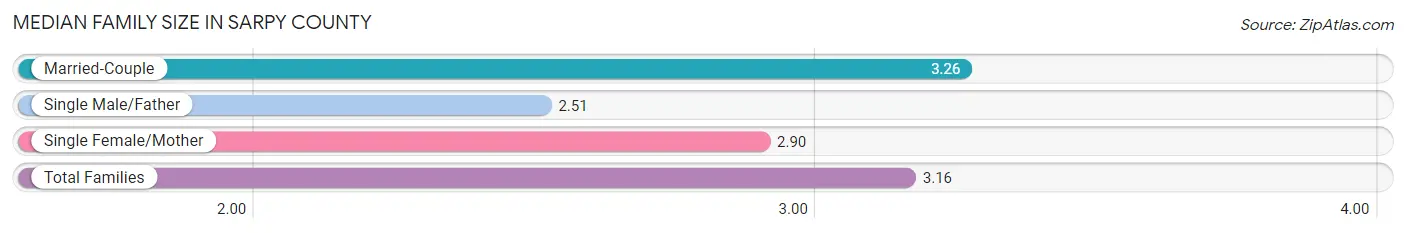
The median family size in Sarpy County is 3.16 persons per family, with married-couple families (40,454 | 79.7%) accounting for the largest median family size of 3.26 persons per family. On the other hand, single male/father families (3,550 | 7.0%) represent the smallest median family size with 2.51 persons per family.
| Family Type | # Families | Family Size |
| Married-Couple | 40,454 (79.7%) | 3.26 |
| Single Male/Father | 3,550 (7.0%) | 2.51 |
| Single Female/Mother | 6,750 (13.3%) | 2.90 |
| Total Families | 50,754 (100.0%) | 3.16 |
Median Household Size in Sarpy County
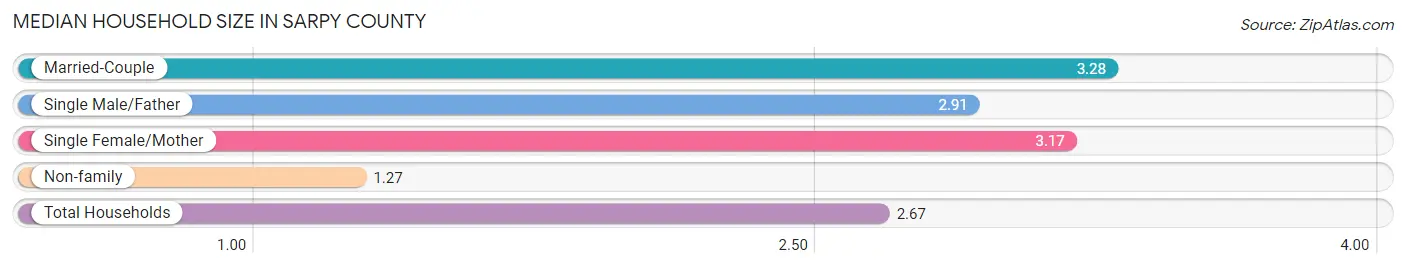
The median household size in Sarpy County is 2.67 persons per household, with married-couple households (40,454 | 56.9%) accounting for the largest median household size of 3.28 persons per household. non-family households (20,388 | 28.7%) represent the smallest median household size with 1.27 persons per household.
| Household Type | # Households | Household Size |
| Married-Couple | 40,454 (56.9%) | 3.28 |
| Single Male/Father | 3,550 (5.0%) | 2.91 |
| Single Female/Mother | 6,750 (9.5%) | 3.17 |
| Non-family | 20,388 (28.7%) | 1.27 |
| Total Households | 71,142 (100.0%) | 2.67 |
Household Size by Marriage Status in Sarpy County
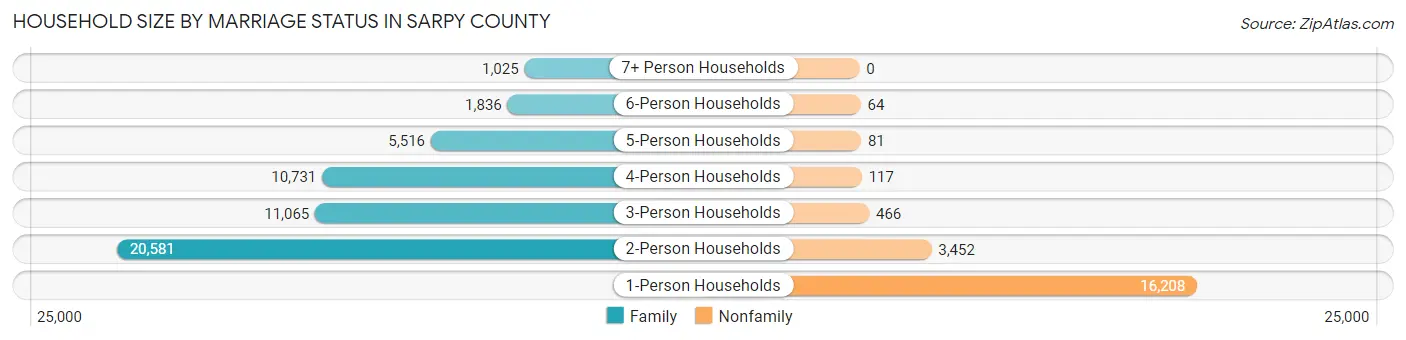
Out of a total of 71,142 households in Sarpy County, 50,754 (71.3%) are family households, while 20,388 (28.7%) are nonfamily households. The most numerous type of family households are 2-person households, comprising 20,581, and the most common type of nonfamily households are 1-person households, comprising 16,208.
| Household Size | Family Households | Nonfamily Households |
| 1-Person Households | - | 16,208 (22.8%) |
| 2-Person Households | 20,581 (28.9%) | 3,452 (4.9%) |
| 3-Person Households | 11,065 (15.5%) | 466 (0.7%) |
| 4-Person Households | 10,731 (15.1%) | 117 (0.2%) |
| 5-Person Households | 5,516 (7.7%) | 81 (0.1%) |
| 6-Person Households | 1,836 (2.6%) | 64 (0.1%) |
| 7+ Person Households | 1,025 (1.4%) | 0 (0.0%) |
| Total | 50,754 (71.3%) | 20,388 (28.7%) |
Female Fertility in Sarpy County
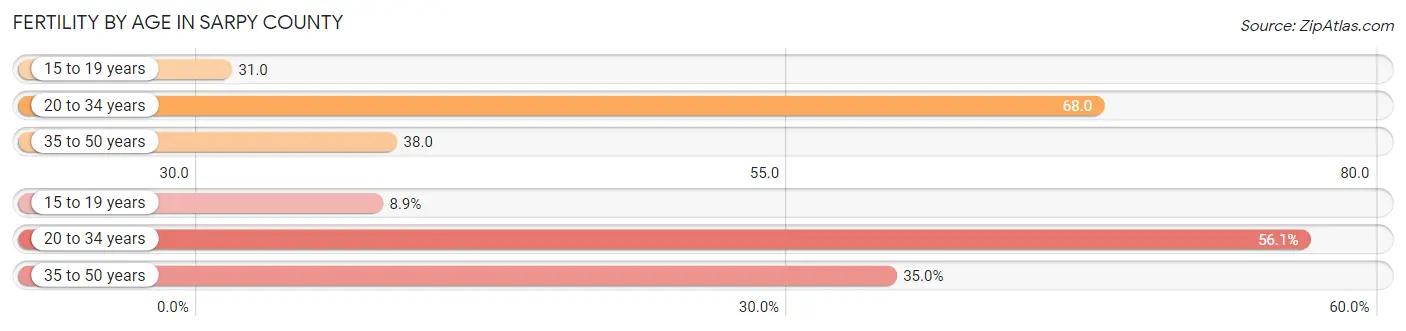
Fertility by Age in Sarpy County
Average fertility rate in Sarpy County is 49.0 births per 1,000 women. Women in the age bracket of 20 to 34 years have the highest fertility rate with 68.0 births per 1,000 women. Women in the age bracket of 20 to 34 years acount for 56.1% of all women with births.
| Age Bracket | Women with Births | Births / 1,000 Women |
| 15 to 19 years | 201 (8.9%) | 31.0 |
| 20 to 34 years | 1,270 (56.1%) | 68.0 |
| 35 to 50 years | 793 (35.0%) | 38.0 |
| Total | 2,264 (100.0%) | 49.0 |
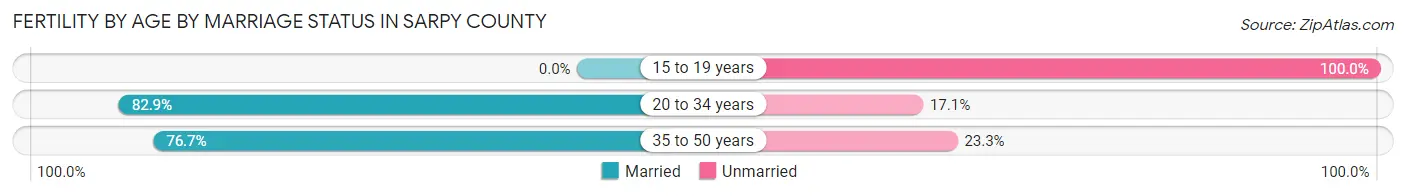
Fertility by Age by Marriage Status in Sarpy County
73.4% of women with births (2,264) in Sarpy County are married. The highest percentage of unmarried women with births falls into 15 to 19 years age bracket with 100.0% of them unmarried at the time of birth, while the lowest percentage of unmarried women with births belong to 20 to 34 years age bracket with 17.1% of them unmarried.
| Age Bracket | Married | Unmarried |
| 15 to 19 years | 0 (0.0%) | 201 (100.0%) |
| 20 to 34 years | 1,053 (82.9%) | 217 (17.1%) |
| 35 to 50 years | 608 (76.7%) | 185 (23.3%) |
| Total | 1,662 (73.4%) | 602 (26.6%) |
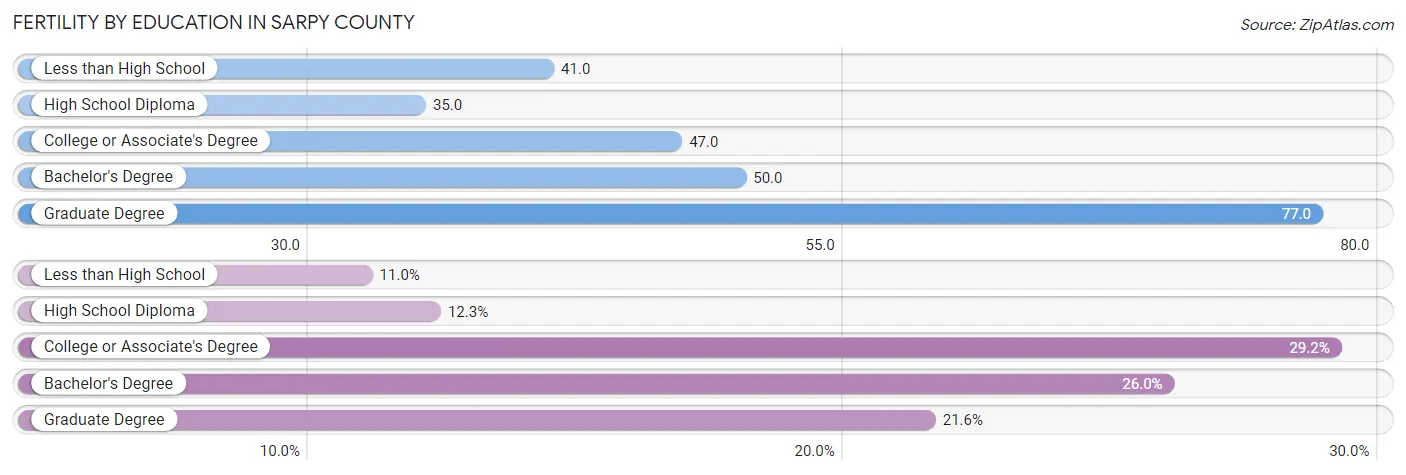
Fertility by Education in Sarpy County
Average fertility rate in Sarpy County is 49.0 births per 1,000 women. Women with the education attainment of graduate degree have the highest fertility rate of 77.0 births per 1,000 women, while women with the education attainment of high school diploma have the lowest fertility at 35.0 births per 1,000 women. Women with the education attainment of college or associate's degree represent 29.1% of all women with births.
| Educational Attainment | Women with Births | Births / 1,000 Women |
| Less than High School | 249 (11.0%) | 41.0 |
| High School Diploma | 278 (12.3%) | 35.0 |
| College or Associate's Degree | 660 (29.1%) | 47.0 |
| Bachelor's Degree | 589 (26.0%) | 50.0 |
| Graduate Degree | 488 (21.5%) | 77.0 |
| Total | 2,264 (100.0%) | 49.0 |
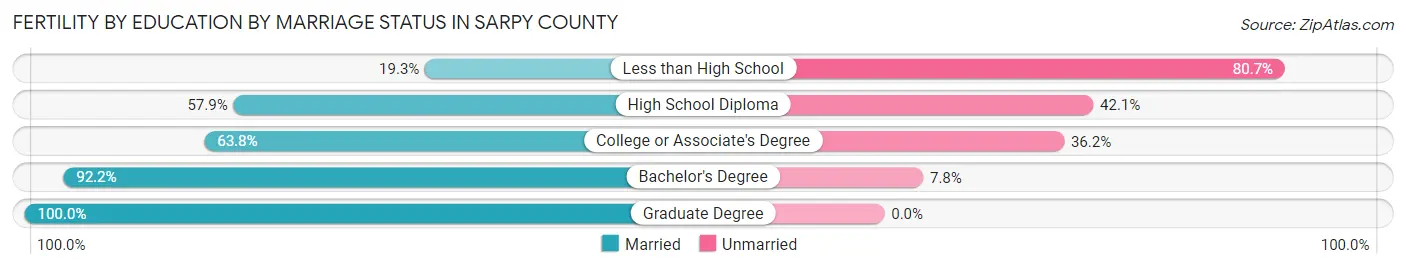
Fertility by Education by Marriage Status in Sarpy County
26.6% of women with births in Sarpy County are unmarried. Women with the educational attainment of graduate degree are most likely to be married with 100.0% of them married at childbirth, while women with the educational attainment of less than high school are least likely to be married with 80.7% of them unmarried at childbirth.
| Educational Attainment | Married | Unmarried |
| Less than High School | 48 (19.3%) | 201 (80.7%) |
| High School Diploma | 161 (57.9%) | 117 (42.1%) |
| College or Associate's Degree | 421 (63.8%) | 239 (36.2%) |
| Bachelor's Degree | 543 (92.2%) | 46 (7.8%) |
| Graduate Degree | 488 (100.0%) | 0 (0.0%) |
| Total | 1,662 (73.4%) | 602 (26.6%) |
Income in Sarpy County
Income Overview in Sarpy County
Per Capita Income in Sarpy County is $43,845, while median incomes of families and households are $114,500 and $95,911 respectively.
| Characteristic | Number | Measure |
| Per Capita Income | 191,272 | $43,845 |
| Median Family Income | 50,754 | $114,500 |
| Mean Family Income | 50,754 | $133,407 |
| Median Household Income | 71,142 | $95,911 |
| Mean Household Income | 71,142 | $116,470 |
| Income Deficit | 50,754 | $10,129 |
| Wage / Income Gap (%) | 191,272 | 31.46% |
| Wage / Income Gap ($) | 191,272 | 68.54¢ per $1 |
| Gini / Inequality Index | 191,272 | 0.40 |
Earnings by Sex in Sarpy County
Average Earnings in Sarpy County are $49,423, $59,146 for men and $40,540 for women, a difference of 31.5%.
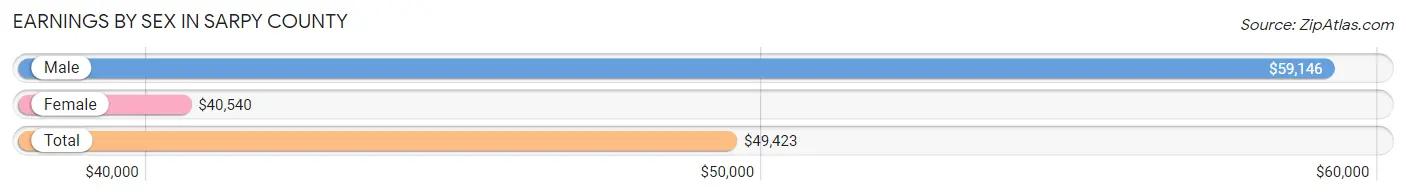
| Sex | Number | Average Earnings |
| Male | 59,969 (53.8%) | $59,146 |
| Female | 51,564 (46.2%) | $40,540 |
| Total | 111,533 (100.0%) | $49,423 |
Earnings by Sex by Income Bracket in Sarpy County
The most common earnings brackets in Sarpy County are $100,000+ for men (13,071 | 21.8%) and $75,000 to $99,999 for women (5,223 | 10.1%).
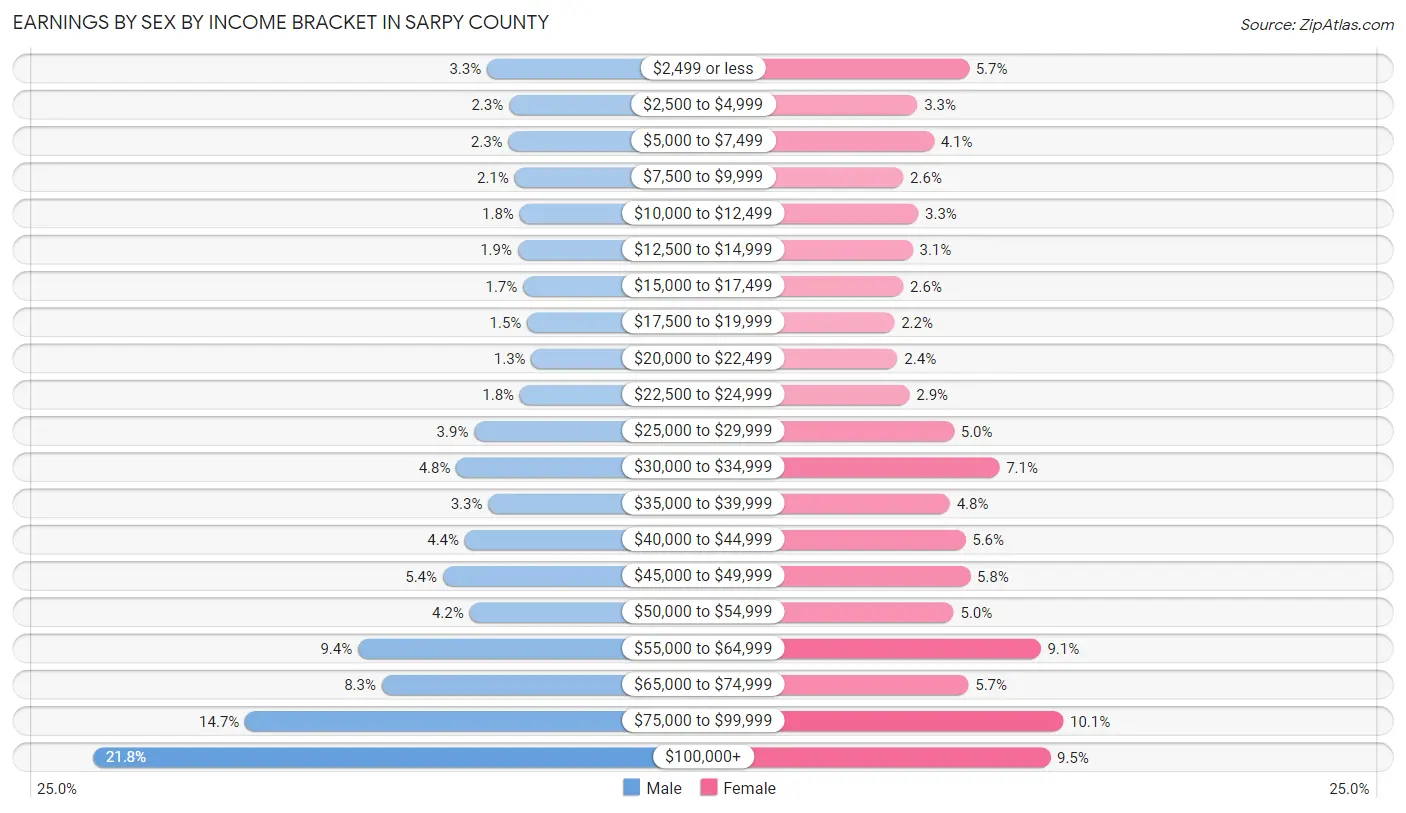
| Income | Male | Female |
| $2,499 or less | 2,003 (3.3%) | 2,946 (5.7%) |
| $2,500 to $4,999 | 1,387 (2.3%) | 1,702 (3.3%) |
| $5,000 to $7,499 | 1,406 (2.3%) | 2,100 (4.1%) |
| $7,500 to $9,999 | 1,229 (2.1%) | 1,361 (2.6%) |
| $10,000 to $12,499 | 1,086 (1.8%) | 1,721 (3.3%) |
| $12,500 to $14,999 | 1,141 (1.9%) | 1,586 (3.1%) |
| $15,000 to $17,499 | 989 (1.7%) | 1,362 (2.6%) |
| $17,500 to $19,999 | 875 (1.5%) | 1,147 (2.2%) |
| $20,000 to $22,499 | 754 (1.3%) | 1,222 (2.4%) |
| $22,500 to $24,999 | 1,081 (1.8%) | 1,509 (2.9%) |
| $25,000 to $29,999 | 2,361 (3.9%) | 2,583 (5.0%) |
| $30,000 to $34,999 | 2,868 (4.8%) | 3,680 (7.1%) |
| $35,000 to $39,999 | 1,966 (3.3%) | 2,483 (4.8%) |
| $40,000 to $44,999 | 2,629 (4.4%) | 2,864 (5.6%) |
| $45,000 to $49,999 | 3,247 (5.4%) | 2,975 (5.8%) |
| $50,000 to $54,999 | 2,493 (4.2%) | 2,579 (5.0%) |
| $55,000 to $64,999 | 5,627 (9.4%) | 4,675 (9.1%) |
| $65,000 to $74,999 | 4,961 (8.3%) | 2,936 (5.7%) |
| $75,000 to $99,999 | 8,795 (14.7%) | 5,223 (10.1%) |
| $100,000+ | 13,071 (21.8%) | 4,910 (9.5%) |
| Total | 59,969 (100.0%) | 51,564 (100.0%) |
Earnings by Sex by Educational Attainment in Sarpy County
Average earnings in Sarpy County are $67,784 for men and $46,759 for women, a difference of 31.0%. Men with an educational attainment of graduate degree enjoy the highest average annual earnings of $100,666, while those with less than high school education earn the least with $45,704. Women with an educational attainment of graduate degree earn the most with the average annual earnings of $72,203, while those with less than high school education have the smallest earnings of $24,000.
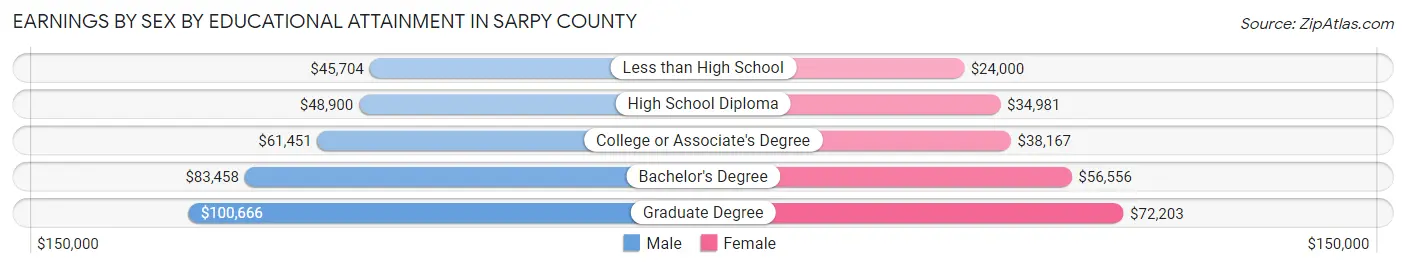
| Educational Attainment | Male Income | Female Income |
| Less than High School | $45,704 | $24,000 |
| High School Diploma | $48,900 | $34,981 |
| College or Associate's Degree | $61,451 | $38,167 |
| Bachelor's Degree | $83,458 | $56,556 |
| Graduate Degree | $100,666 | $72,203 |
| Total | $67,784 | $46,759 |
Family Income in Sarpy County
Family Income Brackets in Sarpy County
According to the Sarpy County family income data, there are 13,145 families falling into the $100,000 to $149,999 income range, which is the most common income bracket and makes up 25.9% of all families. Conversely, the $10,000 to $14,999 income bracket is the least frequent group with only 406 families (0.8%) belonging to this category.
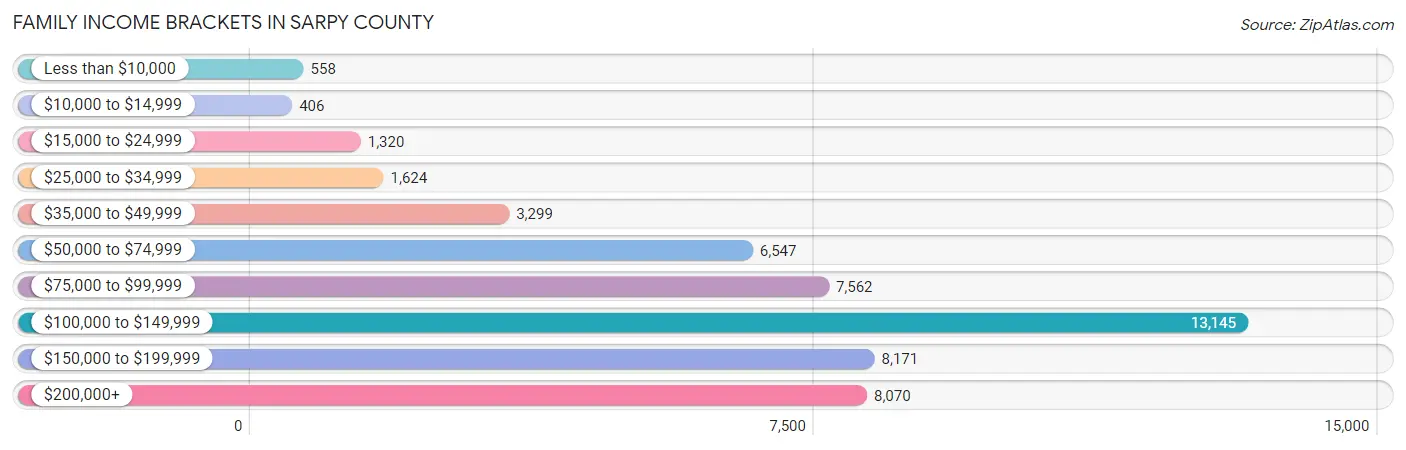
| Income Bracket | # Families | % Families |
| Less than $10,000 | 558 | 1.1% |
| $10,000 to $14,999 | 406 | 0.8% |
| $15,000 to $24,999 | 1,320 | 2.6% |
| $25,000 to $34,999 | 1,624 | 3.2% |
| $35,000 to $49,999 | 3,299 | 6.5% |
| $50,000 to $74,999 | 6,547 | 12.9% |
| $75,000 to $99,999 | 7,562 | 14.9% |
| $100,000 to $149,999 | 13,145 | 25.9% |
| $150,000 to $199,999 | 8,171 | 16.1% |
| $200,000+ | 8,070 | 15.9% |
Family Income by Famaliy Size in Sarpy County
7+ person families (781 | 1.5%) account for the highest median family income in Sarpy County with $147,646 per family, while 2-person families (21,857 | 43.1%) have the highest median income of $48,140 per family member.
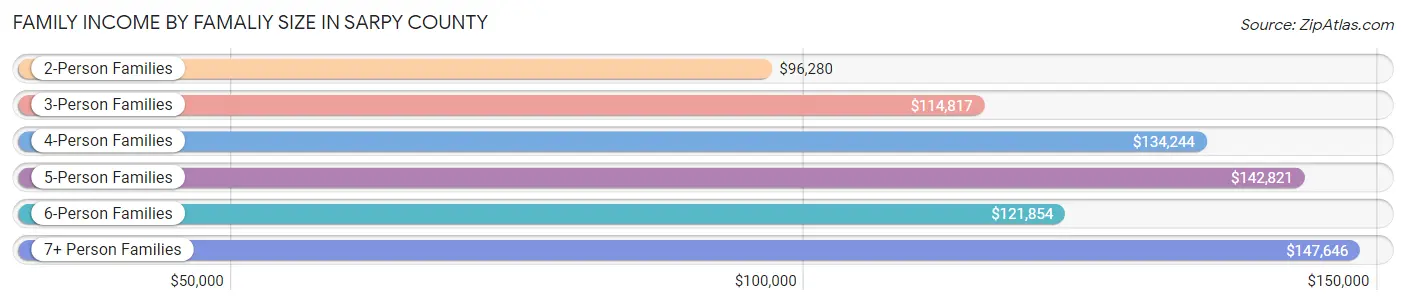
| Income Bracket | # Families | Median Income |
| 2-Person Families | 21,857 (43.1%) | $96,280 |
| 3-Person Families | 10,810 (21.3%) | $114,817 |
| 4-Person Families | 10,464 (20.6%) | $134,244 |
| 5-Person Families | 5,083 (10.0%) | $142,821 |
| 6-Person Families | 1,759 (3.5%) | $121,854 |
| 7+ Person Families | 781 (1.5%) | $147,646 |
| Total | 50,754 (100.0%) | $114,500 |
Family Income by Number of Earners in Sarpy County
The median family income in Sarpy County is $114,500, with families comprising 3+ earners (7,133) having the highest median family income of $162,475, while families with no earners (4,904) have the lowest median family income of $66,266, accounting for 14.1% and 9.7% of families, respectively.
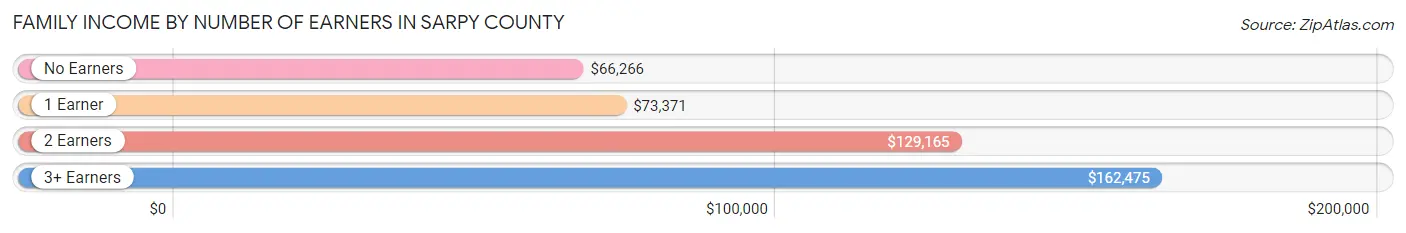
| Number of Earners | # Families | Median Income |
| No Earners | 4,904 (9.7%) | $66,266 |
| 1 Earner | 13,992 (27.6%) | $73,371 |
| 2 Earners | 24,725 (48.7%) | $129,165 |
| 3+ Earners | 7,133 (14.1%) | $162,475 |
| Total | 50,754 (100.0%) | $114,500 |
Household Income in Sarpy County
Household Income Brackets in Sarpy County
With 15,722 households falling in the category, the $100,000 to $149,999 income range is the most frequent in Sarpy County, accounting for 22.1% of all households. In contrast, only 1,067 households (1.5%) fall into the $10,000 to $14,999 income bracket, making it the least populous group.

| Income Bracket | # Households | % Households |
| Less than $10,000 | 1,565 | 2.2% |
| $10,000 to $14,999 | 1,067 | 1.5% |
| $15,000 to $24,999 | 3,344 | 4.7% |
| $25,000 to $34,999 | 4,197 | 5.9% |
| $35,000 to $49,999 | 6,332 | 8.9% |
| $50,000 to $74,999 | 10,387 | 14.6% |
| $75,000 to $99,999 | 10,316 | 14.5% |
| $100,000 to $149,999 | 15,722 | 22.1% |
| $150,000 to $199,999 | 9,177 | 12.9% |
| $200,000+ | 9,035 | 12.7% |
Household Income by Householder Age in Sarpy County
The median household income in Sarpy County is $95,911, with the highest median household income of $117,991 found in the 45 to 64 years age bracket for the primary householder. A total of 25,363 households (35.6%) fall into this category. Meanwhile, the 15 to 24 years age bracket for the primary householder has the lowest median household income of $53,839, with 3,493 households (4.9%) in this group.
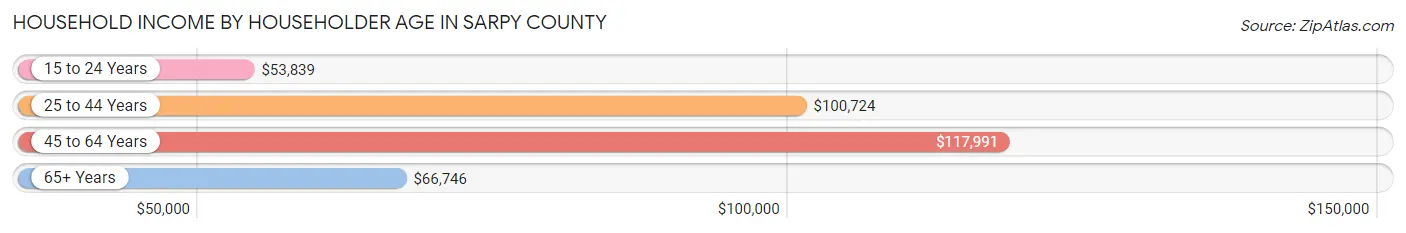
| Income Bracket | # Households | Median Income |
| 15 to 24 Years | 3,493 (4.9%) | $53,839 |
| 25 to 44 Years | 28,119 (39.5%) | $100,724 |
| 45 to 64 Years | 25,363 (35.6%) | $117,991 |
| 65+ Years | 14,167 (19.9%) | $66,746 |
| Total | 71,142 (100.0%) | $95,911 |
Poverty in Sarpy County
Income Below Poverty by Sex and Age in Sarpy County
With 5.0% poverty level for males and 5.9% for females among the residents of Sarpy County, 15 year old males and 18 to 24 year old females are the most vulnerable to poverty, with 117 males (9.7%) and 981 females (12.6%) in their respective age groups living below the poverty level.
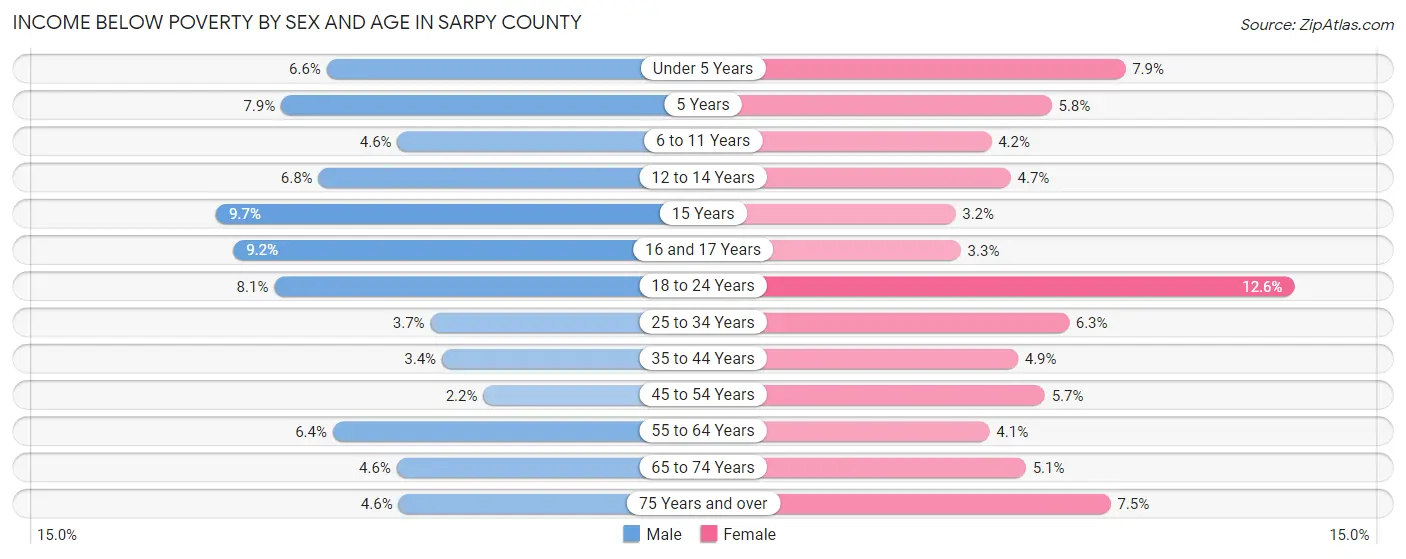
| Age Bracket | Male | Female |
| Under 5 Years | 429 (6.6%) | 490 (7.9%) |
| 5 Years | 110 (7.9%) | 97 (5.8%) |
| 6 to 11 Years | 420 (4.6%) | 356 (4.2%) |
| 12 to 14 Years | 303 (6.8%) | 176 (4.7%) |
| 15 Years | 117 (9.7%) | 42 (3.2%) |
| 16 and 17 Years | 305 (9.2%) | 99 (3.3%) |
| 18 to 24 Years | 701 (8.1%) | 981 (12.6%) |
| 25 to 34 Years | 508 (3.7%) | 822 (6.3%) |
| 35 to 44 Years | 484 (3.4%) | 684 (4.9%) |
| 45 to 54 Years | 263 (2.2%) | 638 (5.7%) |
| 55 to 64 Years | 694 (6.4%) | 443 (4.1%) |
| 65 to 74 Years | 310 (4.6%) | 389 (5.1%) |
| 75 Years and over | 166 (4.6%) | 371 (7.5%) |
| Total | 4,810 (5.0%) | 5,588 (5.9%) |
Income Above Poverty by Sex and Age in Sarpy County
According to the poverty statistics in Sarpy County, males aged 45 to 54 years and females aged 15 years are the age groups that are most secure financially, with 97.8% of males and 96.8% of females in these age groups living above the poverty line.
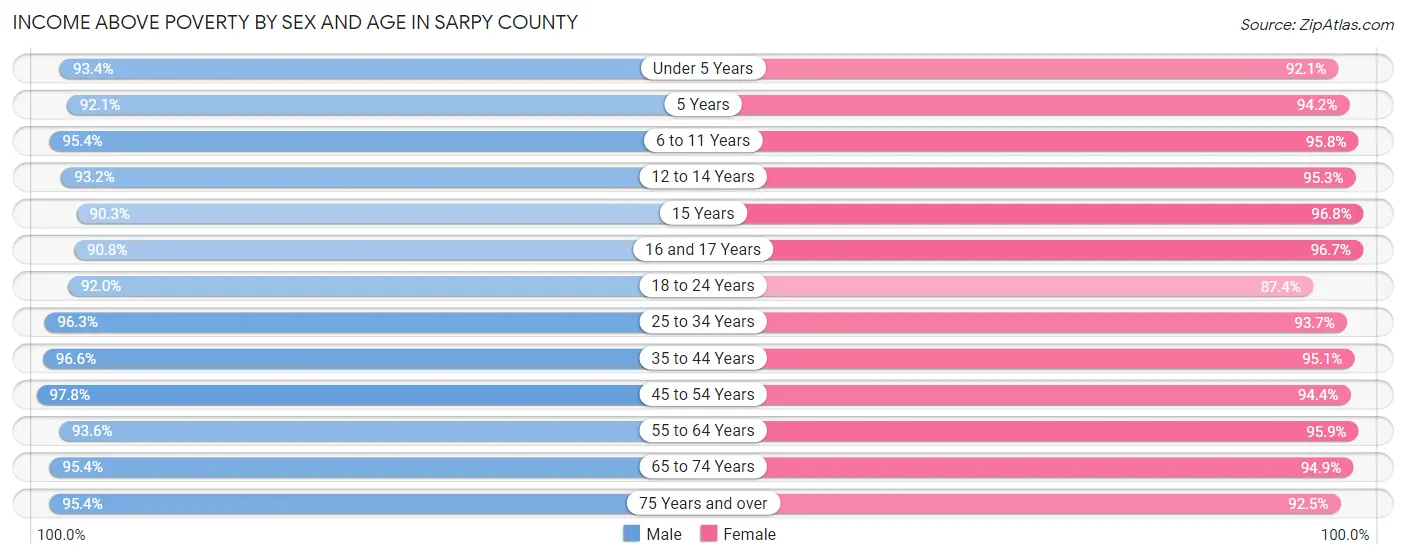
| Age Bracket | Male | Female |
| Under 5 Years | 6,080 (93.4%) | 5,718 (92.1%) |
| 5 Years | 1,289 (92.1%) | 1,563 (94.2%) |
| 6 to 11 Years | 8,665 (95.4%) | 8,199 (95.8%) |
| 12 to 14 Years | 4,140 (93.2%) | 3,567 (95.3%) |
| 15 Years | 1,093 (90.3%) | 1,286 (96.8%) |
| 16 and 17 Years | 3,015 (90.8%) | 2,888 (96.7%) |
| 18 to 24 Years | 8,008 (91.9%) | 6,803 (87.4%) |
| 25 to 34 Years | 13,214 (96.3%) | 12,190 (93.7%) |
| 35 to 44 Years | 13,825 (96.6%) | 13,264 (95.1%) |
| 45 to 54 Years | 11,523 (97.8%) | 10,662 (94.4%) |
| 55 to 64 Years | 10,123 (93.6%) | 10,325 (95.9%) |
| 65 to 74 Years | 6,375 (95.4%) | 7,208 (94.9%) |
| 75 Years and over | 3,450 (95.4%) | 4,592 (92.5%) |
| Total | 90,800 (95.0%) | 88,265 (94.1%) |
Income Below Poverty Among Married-Couple Families in Sarpy County
The poverty statistics for married-couple families in Sarpy County show that 1.7% or 697 of the total 40,454 families live below the poverty line. Families with 3 or 4 children have the highest poverty rate of 2.0%, comprising of 95 families. On the other hand, families with 5 or more children have the lowest poverty rate of 0.0%, which includes 0 families.
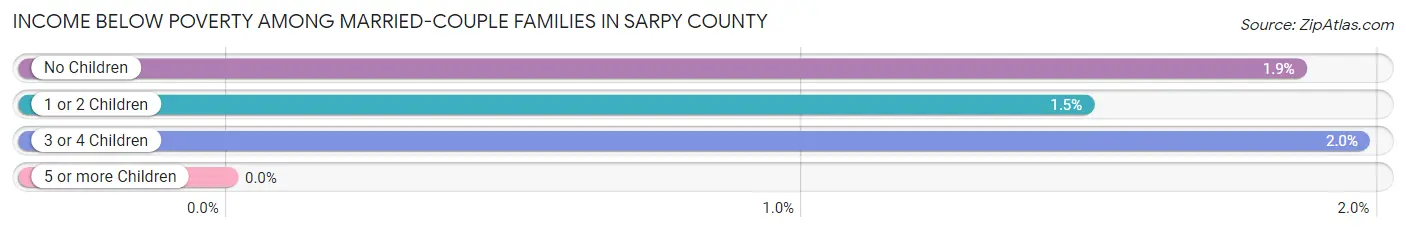
| Children | Above Poverty | Below Poverty |
| No Children | 20,266 (98.1%) | 385 (1.9%) |
| 1 or 2 Children | 14,338 (98.5%) | 217 (1.5%) |
| 3 or 4 Children | 4,716 (98.0%) | 95 (2.0%) |
| 5 or more Children | 437 (100.0%) | 0 (0.0%) |
| Total | 39,757 (98.3%) | 697 (1.7%) |
Income Below Poverty Among Single-Parent Households in Sarpy County
According to the poverty data in Sarpy County, 6.3% or 224 single-father households and 15.8% or 1,067 single-mother households are living below the poverty line. Among single-father households, those with 3 or 4 children have the highest poverty rate, with 27 households (11.1%) experiencing poverty. Likewise, among single-mother households, those with 3 or 4 children have the highest poverty rate, with 359 households (40.6%) falling below the poverty line.
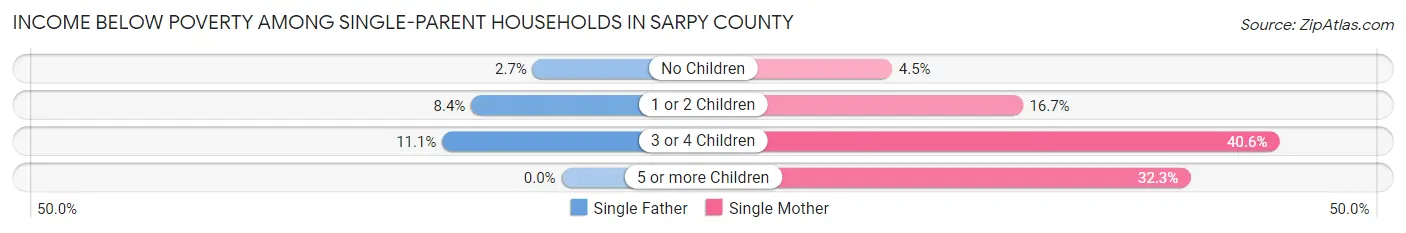
| Children | Single Father | Single Mother |
| No Children | 37 (2.7%) | 101 (4.5%) |
| 1 or 2 Children | 160 (8.4%) | 597 (16.7%) |
| 3 or 4 Children | 27 (11.1%) | 359 (40.6%) |
| 5 or more Children | 0 (0.0%) | 10 (32.3%) |
| Total | 224 (6.3%) | 1,067 (15.8%) |
Income Below Poverty Among Married-Couple vs Single-Parent Households in Sarpy County
The poverty data for Sarpy County shows that 697 of the married-couple family households (1.7%) and 1,291 of the single-parent households (12.5%) are living below the poverty level. Within the married-couple family households, those with 3 or 4 children have the highest poverty rate, with 95 households (2.0%) falling below the poverty line. Among the single-parent households, those with 3 or 4 children have the highest poverty rate, with 386 household (34.2%) living below poverty.
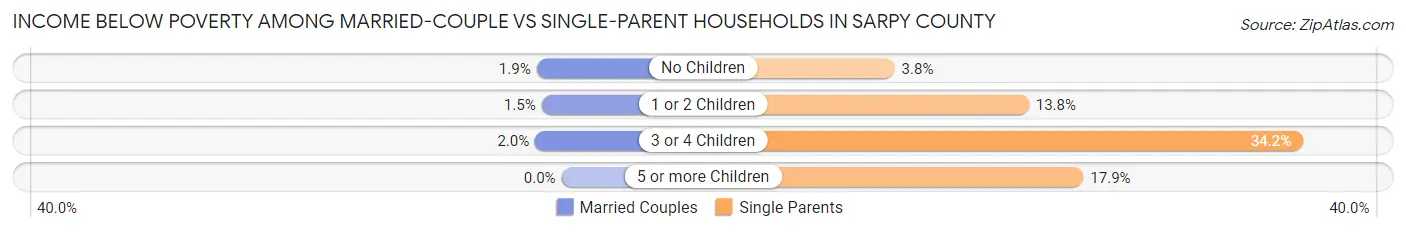
| Children | Married-Couple Families | Single-Parent Households |
| No Children | 385 (1.9%) | 138 (3.8%) |
| 1 or 2 Children | 217 (1.5%) | 757 (13.8%) |
| 3 or 4 Children | 95 (2.0%) | 386 (34.2%) |
| 5 or more Children | 0 (0.0%) | 10 (17.9%) |
| Total | 697 (1.7%) | 1,291 (12.5%) |
Employment Characteristics in Sarpy County
Employment by Class of Employer in Sarpy County
Among the 103,080 employed individuals in Sarpy County, private company employees (67,839 | 65.8%), not-for-profit organizations (9,108 | 8.8%), and federal government employees (9,012 | 8.7%) make up the most common classes of employment.
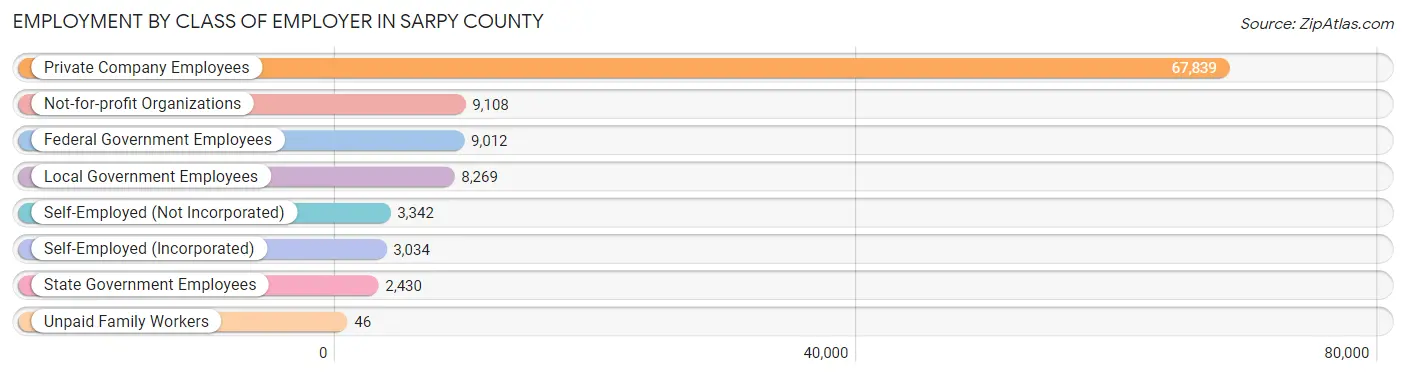
| Employer Class | # Employees | % Employees |
| Private Company Employees | 67,839 | 65.8% |
| Self-Employed (Incorporated) | 3,034 | 2.9% |
| Self-Employed (Not Incorporated) | 3,342 | 3.2% |
| Not-for-profit Organizations | 9,108 | 8.8% |
| Local Government Employees | 8,269 | 8.0% |
| State Government Employees | 2,430 | 2.4% |
| Federal Government Employees | 9,012 | 8.7% |
| Unpaid Family Workers | 46 | 0.0% |
| Total | 103,080 | 100.0% |
Employment Status by Age in Sarpy County
According to the labor force statistics for Sarpy County, out of the total population over 16 years of age (146,370), 73.2% or 107,143 individuals are in the labor force, with 2.6% or 2,786 of them unemployed. The age group with the highest labor force participation rate is 35 to 44 years, with 90.1% or 25,502 individuals in the labor force. Within the labor force, the 16 to 19 years age range has the highest percentage of unemployed individuals, with 8.1% or 500 of them being unemployed.
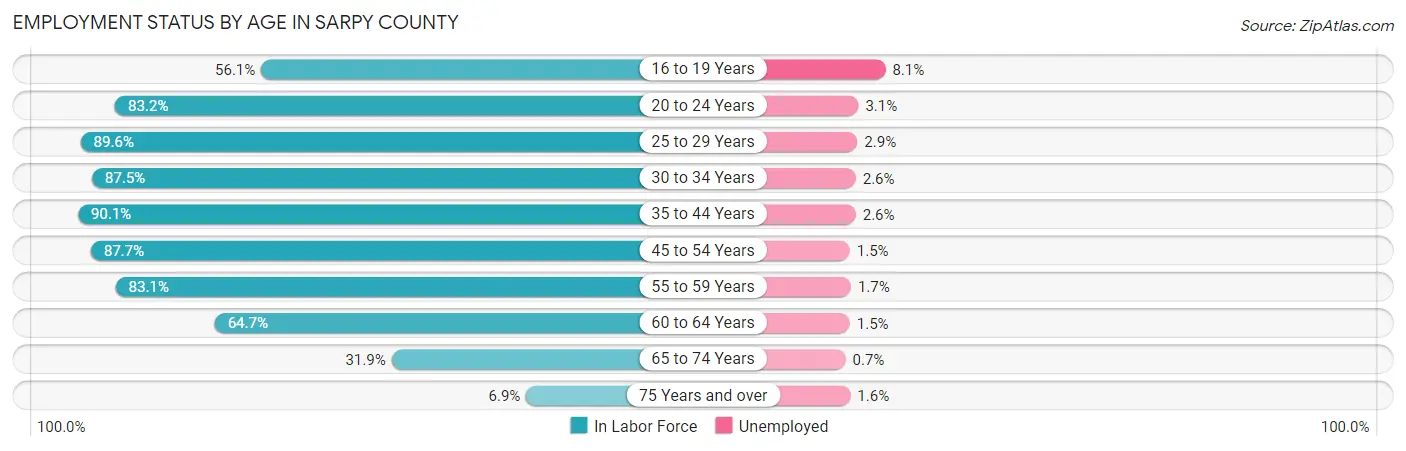
| Age Bracket | In Labor Force | Unemployed |
| 16 to 19 Years | 6,169 (56.1%) | 500 (8.1%) |
| 20 to 24 Years | 10,099 (83.2%) | 313 (3.1%) |
| 25 to 29 Years | 11,607 (89.6%) | 337 (2.9%) |
| 30 to 34 Years | 12,125 (87.5%) | 315 (2.6%) |
| 35 to 44 Years | 25,502 (90.1%) | 663 (2.6%) |
| 45 to 54 Years | 20,292 (87.7%) | 304 (1.5%) |
| 55 to 59 Years | 9,537 (83.1%) | 162 (1.7%) |
| 60 to 64 Years | 6,578 (64.7%) | 99 (1.5%) |
| 65 to 74 Years | 4,568 (31.9%) | 32 (0.7%) |
| 75 Years and over | 622 (6.9%) | 10 (1.6%) |
| Total | 107,143 (73.2%) | 2,786 (2.6%) |
Employment Status by Educational Attainment in Sarpy County
According to labor force statistics for Sarpy County, 85.7% of individuals (85,611) out of the total population between 25 and 64 years of age (99,896) are in the labor force, with 2.2% or 1,883 of them being unemployed. The group with the highest labor force participation rate are those with the educational attainment of bachelor's degree or higher, with 90.3% or 39,460 individuals in the labor force. Within the labor force, individuals with high school diploma education have the highest percentage of unemployment, with 3.5% or 496 of them being unemployed.
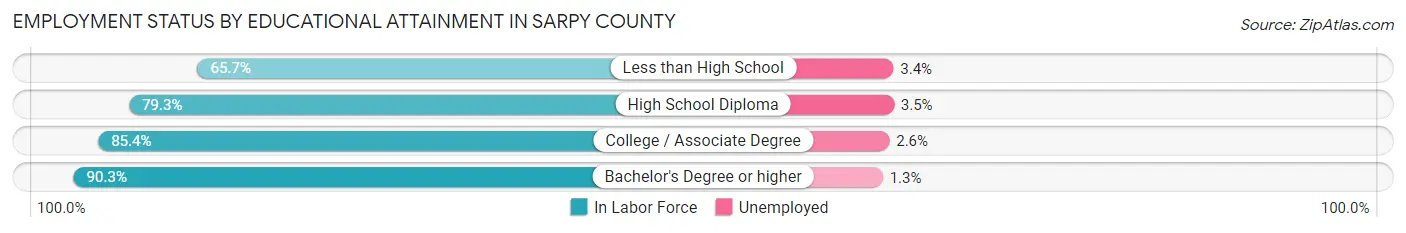
| Educational Attainment | In Labor Force | Unemployed |
| Less than High School | 2,468 (65.7%) | 128 (3.4%) |
| High School Diploma | 14,159 (79.3%) | 625 (3.5%) |
| College / Associate Degree | 29,536 (85.4%) | 899 (2.6%) |
| Bachelor's Degree or higher | 39,460 (90.3%) | 568 (1.3%) |
| Total | 85,611 (85.7%) | 2,198 (2.2%) |
Employment Occupations by Sex in Sarpy County
Management, Business, Science and Arts Occupations
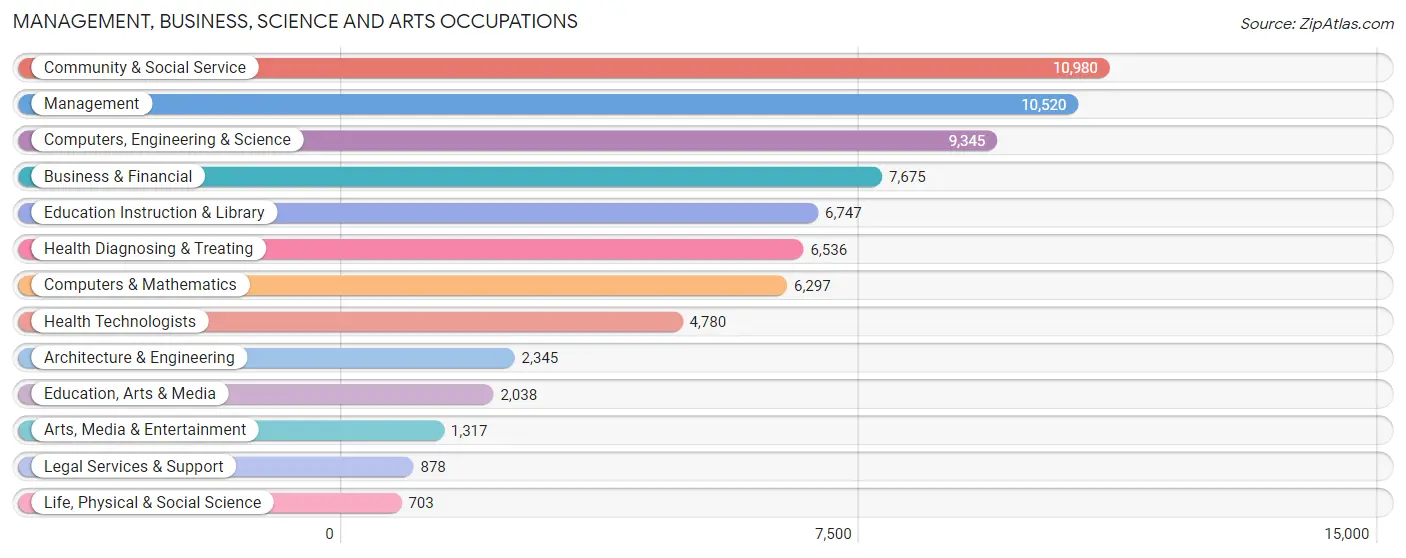
The most common Management, Business, Science and Arts occupations in Sarpy County are Community & Social Service (10,980 | 10.9%), Management (10,520 | 10.5%), Computers, Engineering & Science (9,345 | 9.3%), Business & Financial (7,675 | 7.6%), and Education Instruction & Library (6,747 | 6.7%).
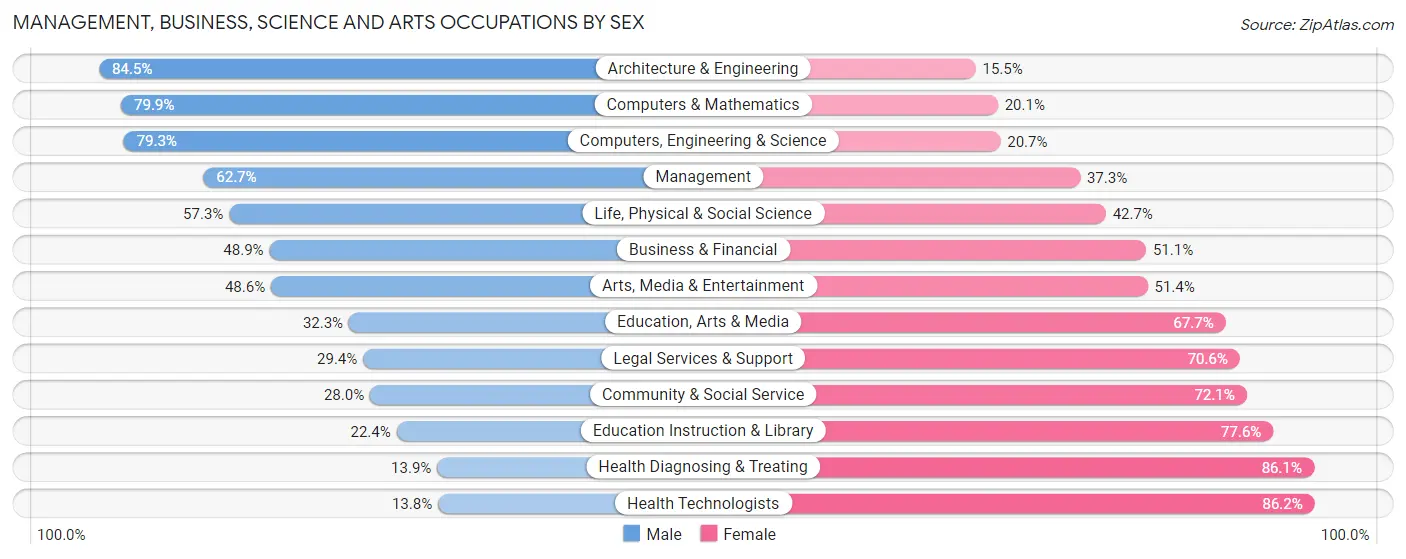
Management, Business, Science and Arts Occupations by Sex
Within the Management, Business, Science and Arts occupations in Sarpy County, the most male-oriented occupations are Architecture & Engineering (84.5%), Computers & Mathematics (79.9%), and Computers, Engineering & Science (79.3%), while the most female-oriented occupations are Health Technologists (86.2%), Health Diagnosing & Treating (86.1%), and Education Instruction & Library (77.6%).
| Occupation | Male | Female |
| Management | 6,596 (62.7%) | 3,924 (37.3%) |
| Business & Financial | 3,755 (48.9%) | 3,920 (51.1%) |
| Computers, Engineering & Science | 7,413 (79.3%) | 1,932 (20.7%) |
| Computers & Mathematics | 5,029 (79.9%) | 1,268 (20.1%) |
| Architecture & Engineering | 1,981 (84.5%) | 364 (15.5%) |
| Life, Physical & Social Science | 403 (57.3%) | 300 (42.7%) |
| Community & Social Service | 3,069 (28.0%) | 7,911 (72.1%) |
| Education, Arts & Media | 659 (32.3%) | 1,379 (67.7%) |
| Legal Services & Support | 258 (29.4%) | 620 (70.6%) |
| Education Instruction & Library | 1,512 (22.4%) | 5,235 (77.6%) |
| Arts, Media & Entertainment | 640 (48.6%) | 677 (51.4%) |
| Health Diagnosing & Treating | 911 (13.9%) | 5,625 (86.1%) |
| Health Technologists | 658 (13.8%) | 4,122 (86.2%) |
| Total (Category) | 21,744 (48.3%) | 23,312 (51.7%) |
| Total (Overall) | 52,995 (52.8%) | 47,380 (47.2%) |
Services Occupations
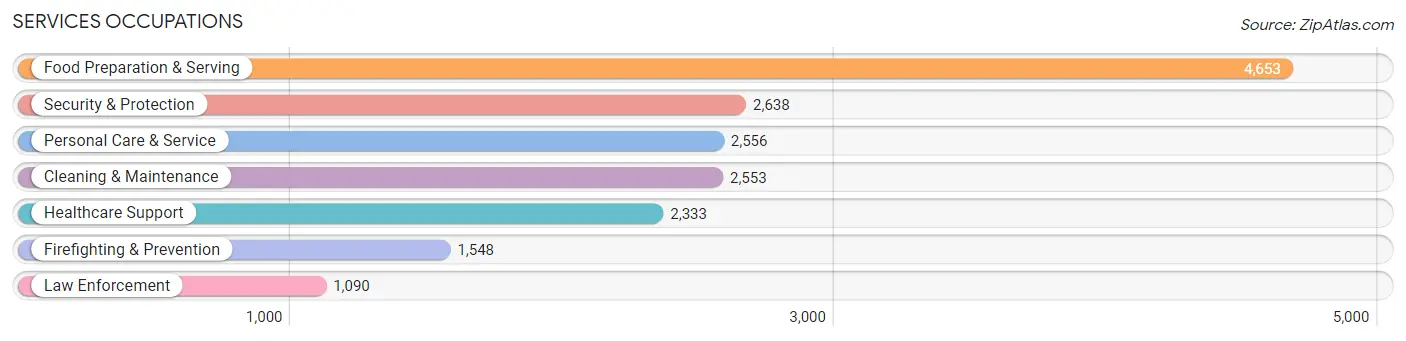
The most common Services occupations in Sarpy County are Food Preparation & Serving (4,653 | 4.6%), Security & Protection (2,638 | 2.6%), Personal Care & Service (2,556 | 2.5%), Cleaning & Maintenance (2,553 | 2.5%), and Healthcare Support (2,333 | 2.3%).
Services Occupations by Sex
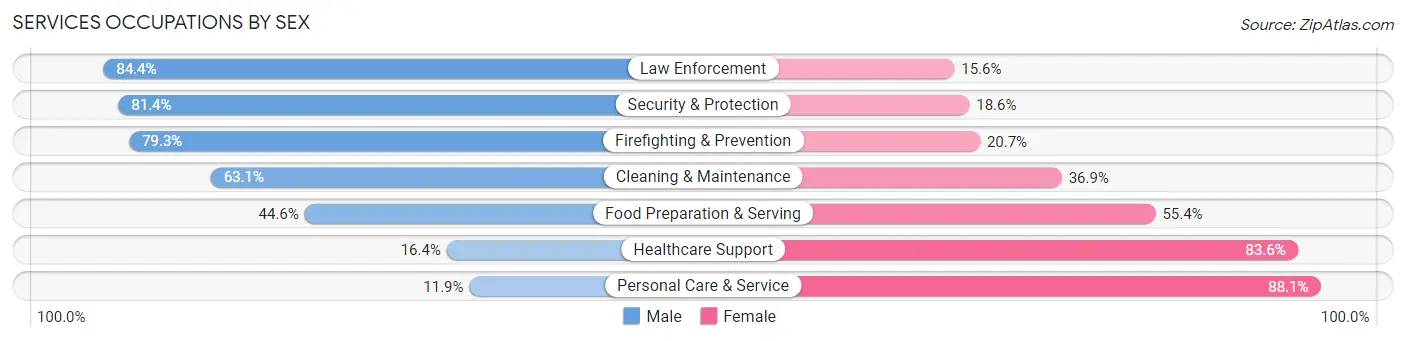
Within the Services occupations in Sarpy County, the most male-oriented occupations are Law Enforcement (84.4%), Security & Protection (81.4%), and Firefighting & Prevention (79.3%), while the most female-oriented occupations are Personal Care & Service (88.1%), Healthcare Support (83.6%), and Food Preparation & Serving (55.4%).
| Occupation | Male | Female |
| Healthcare Support | 383 (16.4%) | 1,950 (83.6%) |
| Security & Protection | 2,148 (81.4%) | 490 (18.6%) |
| Firefighting & Prevention | 1,228 (79.3%) | 320 (20.7%) |
| Law Enforcement | 920 (84.4%) | 170 (15.6%) |
| Food Preparation & Serving | 2,074 (44.6%) | 2,579 (55.4%) |
| Cleaning & Maintenance | 1,612 (63.1%) | 941 (36.9%) |
| Personal Care & Service | 305 (11.9%) | 2,251 (88.1%) |
| Total (Category) | 6,522 (44.3%) | 8,211 (55.7%) |
| Total (Overall) | 52,995 (52.8%) | 47,380 (47.2%) |
Sales and Office Occupations
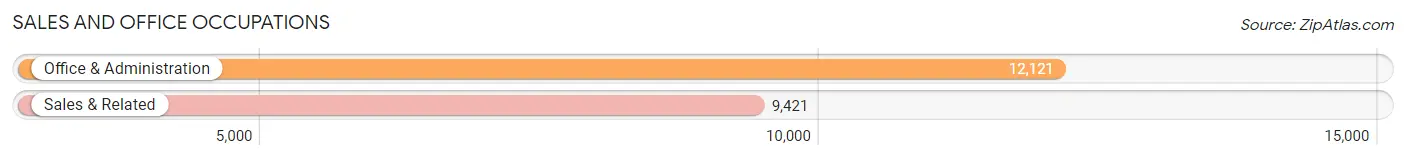
The most common Sales and Office occupations in Sarpy County are Office & Administration (12,121 | 12.1%), and Sales & Related (9,421 | 9.4%).
Sales and Office Occupations by Sex
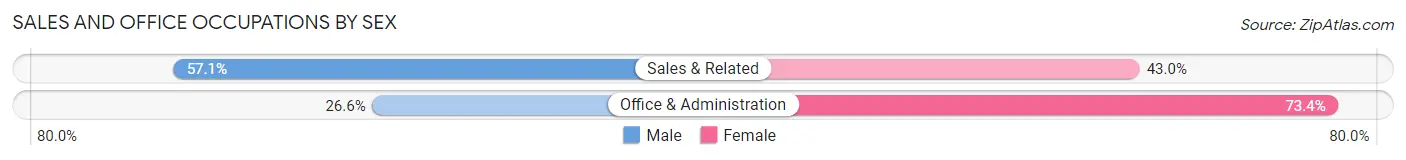
| Occupation | Male | Female |
| Sales & Related | 5,375 (57.1%) | 4,046 (42.9%) |
| Office & Administration | 3,228 (26.6%) | 8,893 (73.4%) |
| Total (Category) | 8,603 (39.9%) | 12,939 (60.1%) |
| Total (Overall) | 52,995 (52.8%) | 47,380 (47.2%) |
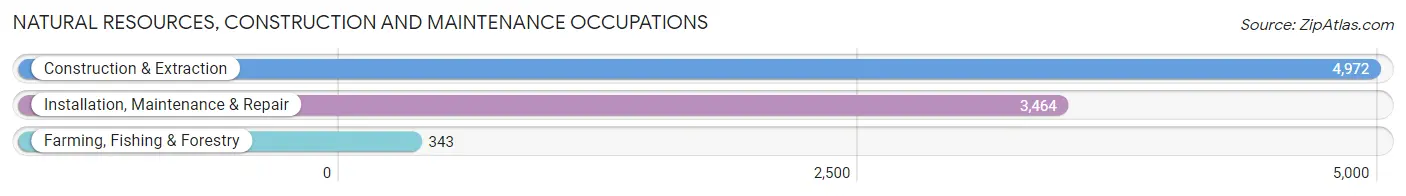
Natural Resources, Construction and Maintenance Occupations
The most common Natural Resources, Construction and Maintenance occupations in Sarpy County are Construction & Extraction (4,972 | 5.0%), Installation, Maintenance & Repair (3,464 | 3.5%), and Farming, Fishing & Forestry (343 | 0.3%).
Natural Resources, Construction and Maintenance Occupations by Sex
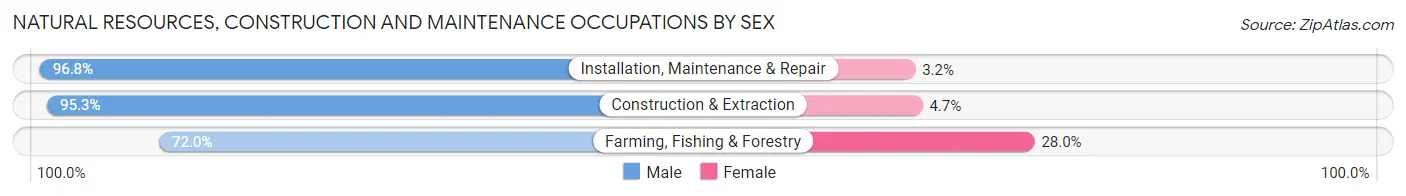
| Occupation | Male | Female |
| Farming, Fishing & Forestry | 247 (72.0%) | 96 (28.0%) |
| Construction & Extraction | 4,739 (95.3%) | 233 (4.7%) |
| Installation, Maintenance & Repair | 3,354 (96.8%) | 110 (3.2%) |
| Total (Category) | 8,340 (95.0%) | 439 (5.0%) |
| Total (Overall) | 52,995 (52.8%) | 47,380 (47.2%) |
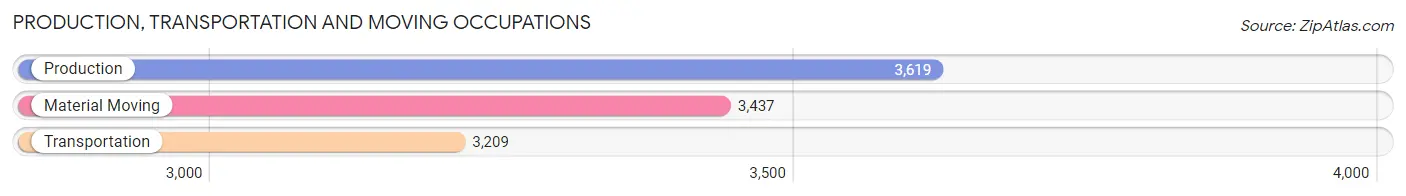
Production, Transportation and Moving Occupations
The most common Production, Transportation and Moving occupations in Sarpy County are Production (3,619 | 3.6%), Material Moving (3,437 | 3.4%), and Transportation (3,209 | 3.2%).
Production, Transportation and Moving Occupations by Sex
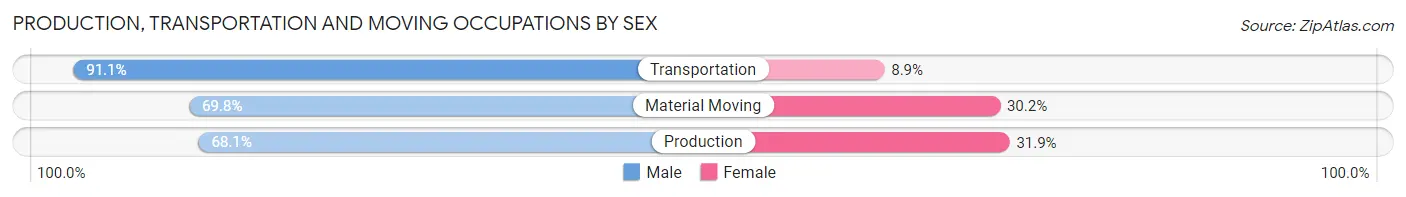
| Occupation | Male | Female |
| Production | 2,464 (68.1%) | 1,155 (31.9%) |
| Transportation | 2,922 (91.1%) | 287 (8.9%) |
| Material Moving | 2,400 (69.8%) | 1,037 (30.2%) |
| Total (Category) | 7,786 (75.8%) | 2,479 (24.1%) |
| Total (Overall) | 52,995 (52.8%) | 47,380 (47.2%) |
Employment Industries by Sex in Sarpy County
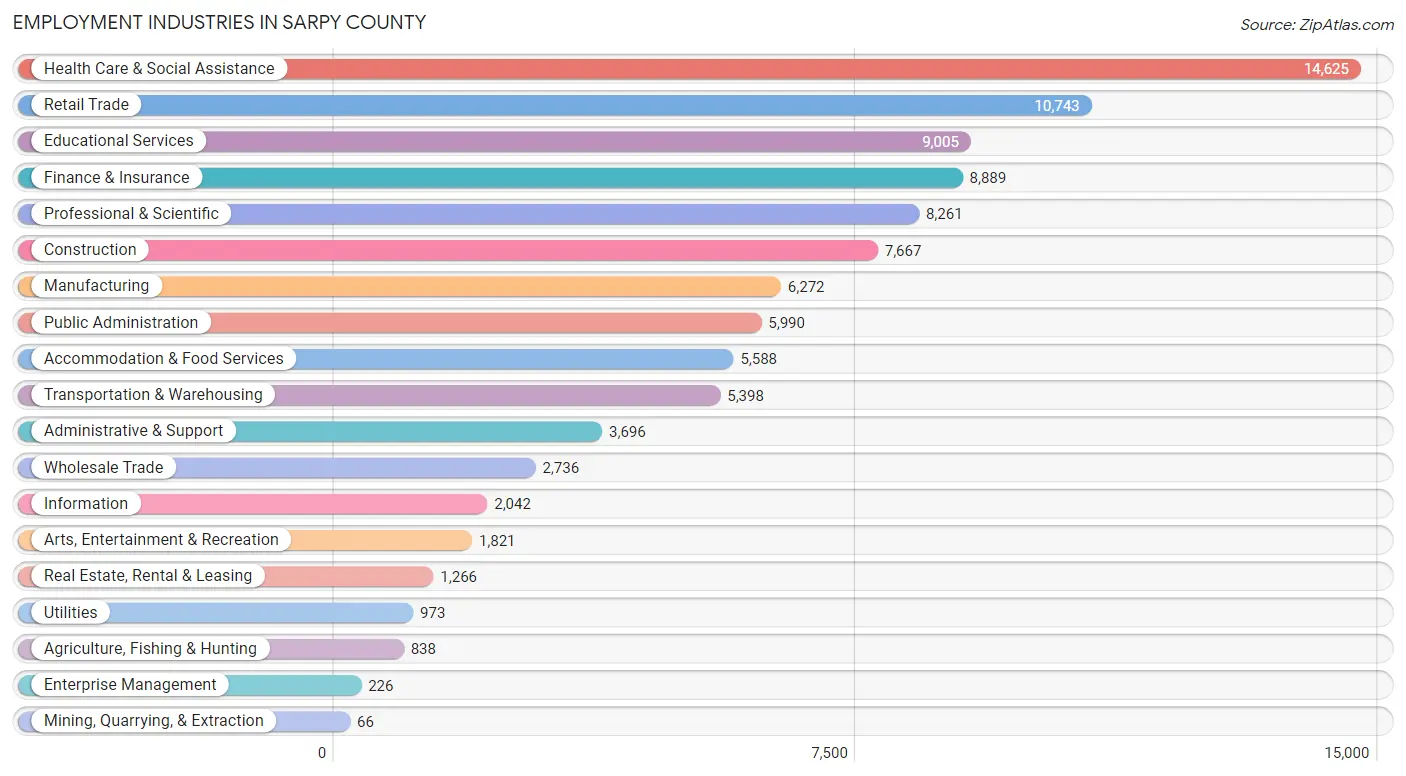
Employment Industries in Sarpy County
The major employment industries in Sarpy County include Health Care & Social Assistance (14,625 | 14.6%), Retail Trade (10,743 | 10.7%), Educational Services (9,005 | 9.0%), Finance & Insurance (8,889 | 8.9%), and Professional & Scientific (8,261 | 8.2%).
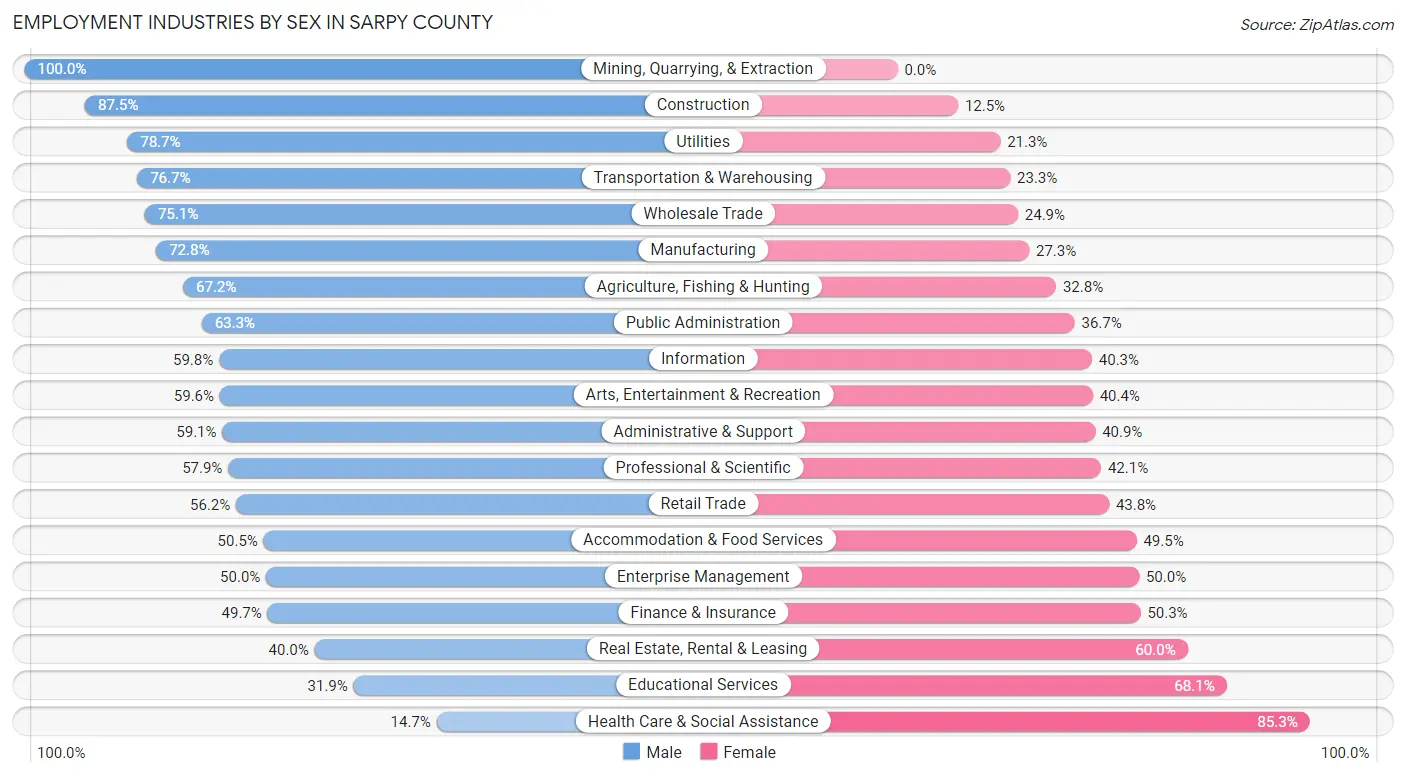
Employment Industries by Sex in Sarpy County
The Sarpy County industries that see more men than women are Mining, Quarrying, & Extraction (100.0%), Construction (87.5%), and Utilities (78.7%), whereas the industries that tend to have a higher number of women are Health Care & Social Assistance (85.3%), Educational Services (68.1%), and Real Estate, Rental & Leasing (60.0%).
| Industry | Male | Female |
| Agriculture, Fishing & Hunting | 563 (67.2%) | 275 (32.8%) |
| Mining, Quarrying, & Extraction | 66 (100.0%) | 0 (0.0%) |
| Construction | 6,706 (87.5%) | 961 (12.5%) |
| Manufacturing | 4,563 (72.8%) | 1,709 (27.3%) |
| Wholesale Trade | 2,054 (75.1%) | 682 (24.9%) |
| Retail Trade | 6,040 (56.2%) | 4,703 (43.8%) |
| Transportation & Warehousing | 4,139 (76.7%) | 1,259 (23.3%) |
| Utilities | 766 (78.7%) | 207 (21.3%) |
| Information | 1,220 (59.8%) | 822 (40.3%) |
| Finance & Insurance | 4,418 (49.7%) | 4,471 (50.3%) |
| Real Estate, Rental & Leasing | 506 (40.0%) | 760 (60.0%) |
| Professional & Scientific | 4,780 (57.9%) | 3,481 (42.1%) |
| Enterprise Management | 113 (50.0%) | 113 (50.0%) |
| Administrative & Support | 2,183 (59.1%) | 1,513 (40.9%) |
| Educational Services | 2,873 (31.9%) | 6,132 (68.1%) |
| Health Care & Social Assistance | 2,152 (14.7%) | 12,473 (85.3%) |
| Arts, Entertainment & Recreation | 1,085 (59.6%) | 736 (40.4%) |
| Accommodation & Food Services | 2,823 (50.5%) | 2,765 (49.5%) |
| Public Administration | 3,794 (63.3%) | 2,196 (36.7%) |
| Total | 52,995 (52.8%) | 47,380 (47.2%) |
Education in Sarpy County
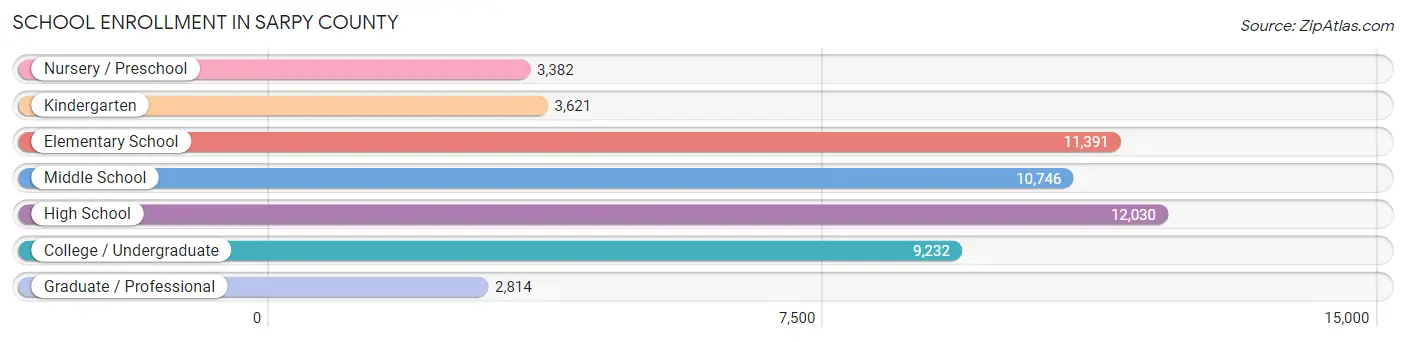
School Enrollment in Sarpy County
The most common levels of schooling among the 53,216 students in Sarpy County are high school (12,030 | 22.6%), elementary school (11,391 | 21.4%), and middle school (10,746 | 20.2%).
| School Level | # Students | % Students |
| Nursery / Preschool | 3,382 | 6.4% |
| Kindergarten | 3,621 | 6.8% |
| Elementary School | 11,391 | 21.4% |
| Middle School | 10,746 | 20.2% |
| High School | 12,030 | 22.6% |
| College / Undergraduate | 9,232 | 17.3% |
| Graduate / Professional | 2,814 | 5.3% |
| Total | 53,216 | 100.0% |
School Enrollment by Age by Funding Source in Sarpy County
Out of a total of 53,216 students who are enrolled in schools in Sarpy County, 8,621 (16.2%) attend a private institution, while the remaining 44,595 (83.8%) are enrolled in public schools. The age group of 3 to 4 year olds has the highest likelihood of being enrolled in private schools, with 1,134 (46.3% in the age bracket) enrolled. Conversely, the age group of 15 to 17 year olds has the lowest likelihood of being enrolled in a private school, with 7,784 (89.3% in the age bracket) attending a public institution.
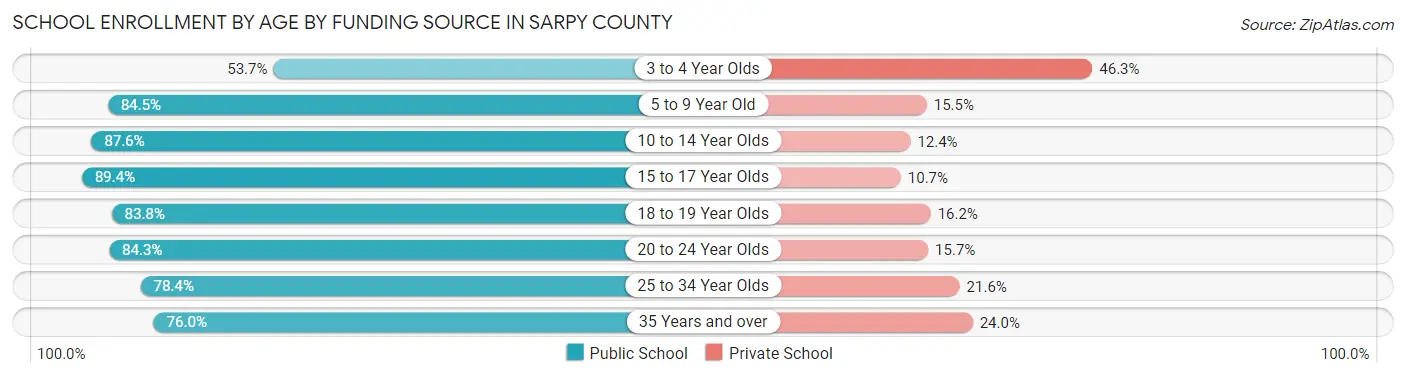
| Age Bracket | Public School | Private School |
| 3 to 4 Year Olds | 1,314 (53.7%) | 1,134 (46.3%) |
| 5 to 9 Year Old | 12,027 (84.5%) | 2,202 (15.5%) |
| 10 to 14 Year Olds | 12,418 (87.6%) | 1,764 (12.4%) |
| 15 to 17 Year Olds | 7,784 (89.3%) | 928 (10.6%) |
| 18 to 19 Year Olds | 2,687 (83.8%) | 520 (16.2%) |
| 20 to 24 Year Olds | 3,689 (84.3%) | 689 (15.7%) |
| 25 to 34 Year Olds | 2,661 (78.4%) | 733 (21.6%) |
| 35 Years and over | 2,025 (76.0%) | 641 (24.0%) |
| Total | 44,595 (83.8%) | 8,621 (16.2%) |
Educational Attainment by Field of Study in Sarpy County
Business (13,590 | 24.6%), education (7,428 | 13.5%), science & technology (6,003 | 10.9%), arts & humanities (4,828 | 8.7%), and computers & mathematics (3,385 | 6.1%) are the most common fields of study among 55,213 individuals in Sarpy County who have obtained a bachelor's degree or higher.
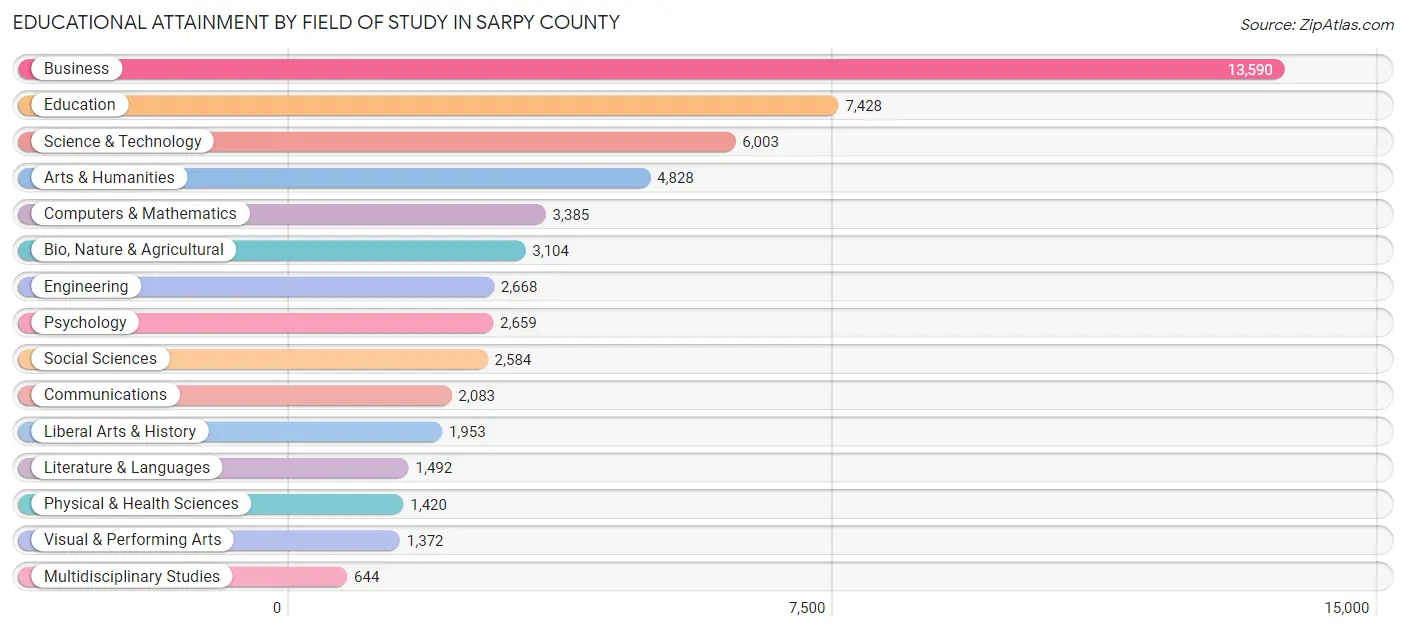
| Field of Study | # Graduates | % Graduates |
| Computers & Mathematics | 3,385 | 6.1% |
| Bio, Nature & Agricultural | 3,104 | 5.6% |
| Physical & Health Sciences | 1,420 | 2.6% |
| Psychology | 2,659 | 4.8% |
| Social Sciences | 2,584 | 4.7% |
| Engineering | 2,668 | 4.8% |
| Multidisciplinary Studies | 644 | 1.2% |
| Science & Technology | 6,003 | 10.9% |
| Business | 13,590 | 24.6% |
| Education | 7,428 | 13.5% |
| Literature & Languages | 1,492 | 2.7% |
| Liberal Arts & History | 1,953 | 3.5% |
| Visual & Performing Arts | 1,372 | 2.5% |
| Communications | 2,083 | 3.8% |
| Arts & Humanities | 4,828 | 8.7% |
| Total | 55,213 | 100.0% |
Transportation & Commute in Sarpy County
Vehicle Availability by Sex in Sarpy County
The most prevalent vehicle ownership categories in Sarpy County are males with 2 vehicles (25,925, accounting for 46.7%) and females with 2 vehicles (20,155, making up 54.9%).
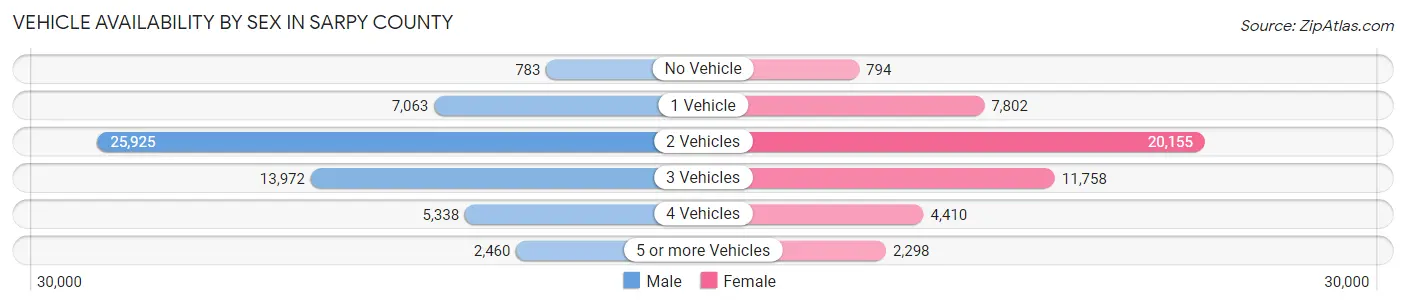
| Vehicles Available | Male | Female |
| No Vehicle | 783 (1.4%) | 794 (1.7%) |
| 1 Vehicle | 7,063 (12.7%) | 7,802 (16.5%) |
| 2 Vehicles | 25,925 (46.7%) | 20,155 (42.7%) |
| 3 Vehicles | 13,972 (25.2%) | 11,758 (24.9%) |
| 4 Vehicles | 5,338 (9.6%) | 4,410 (9.3%) |
| 5 or more Vehicles | 2,460 (4.4%) | 2,298 (4.9%) |
| Total | 55,541 (100.0%) | 47,217 (100.0%) |
Commute Time in Sarpy County
The most frequently occuring commute durations in Sarpy County are 20 to 24 minutes (19,888 commuters, 21.6%), 15 to 19 minutes (17,551 commuters, 19.1%), and 10 to 14 minutes (14,690 commuters, 16.0%).
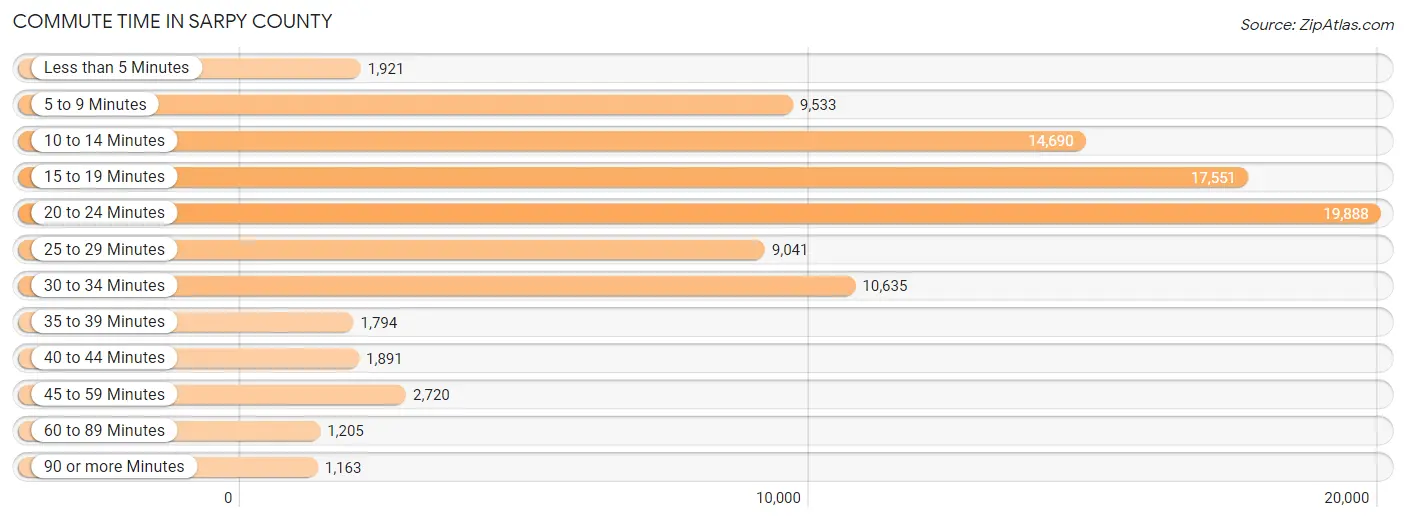
| Commute Time | # Commuters | % Commuters |
| Less than 5 Minutes | 1,921 | 2.1% |
| 5 to 9 Minutes | 9,533 | 10.4% |
| 10 to 14 Minutes | 14,690 | 16.0% |
| 15 to 19 Minutes | 17,551 | 19.1% |
| 20 to 24 Minutes | 19,888 | 21.6% |
| 25 to 29 Minutes | 9,041 | 9.8% |
| 30 to 34 Minutes | 10,635 | 11.6% |
| 35 to 39 Minutes | 1,794 | 1.9% |
| 40 to 44 Minutes | 1,891 | 2.1% |
| 45 to 59 Minutes | 2,720 | 3.0% |
| 60 to 89 Minutes | 1,205 | 1.3% |
| 90 or more Minutes | 1,163 | 1.3% |
Commute Time by Sex in Sarpy County
The most common commute times in Sarpy County are 20 to 24 minutes (10,661 commuters, 21.2%) for males and 20 to 24 minutes (9,227 commuters, 22.1%) for females.
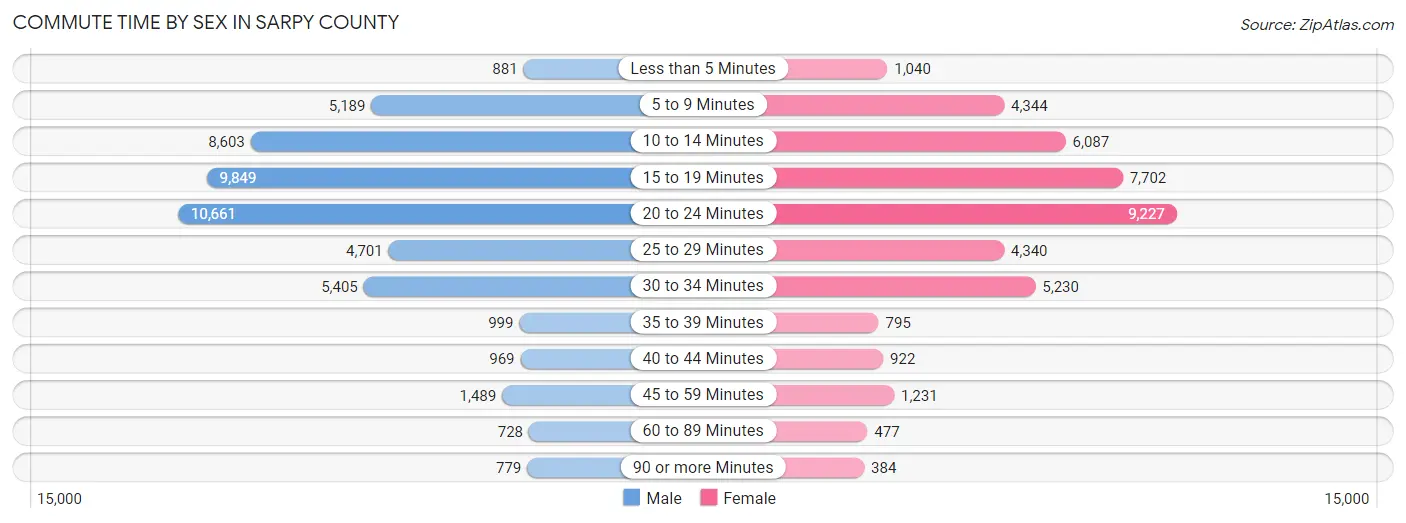
| Commute Time | Male | Female |
| Less than 5 Minutes | 881 (1.8%) | 1,040 (2.5%) |
| 5 to 9 Minutes | 5,189 (10.3%) | 4,344 (10.4%) |
| 10 to 14 Minutes | 8,603 (17.1%) | 6,087 (14.6%) |
| 15 to 19 Minutes | 9,849 (19.6%) | 7,702 (18.4%) |
| 20 to 24 Minutes | 10,661 (21.2%) | 9,227 (22.1%) |
| 25 to 29 Minutes | 4,701 (9.3%) | 4,340 (10.4%) |
| 30 to 34 Minutes | 5,405 (10.8%) | 5,230 (12.5%) |
| 35 to 39 Minutes | 999 (2.0%) | 795 (1.9%) |
| 40 to 44 Minutes | 969 (1.9%) | 922 (2.2%) |
| 45 to 59 Minutes | 1,489 (3.0%) | 1,231 (2.9%) |
| 60 to 89 Minutes | 728 (1.5%) | 477 (1.1%) |
| 90 or more Minutes | 779 (1.5%) | 384 (0.9%) |
Time of Departure to Work by Sex in Sarpy County
The most frequent times of departure to work in Sarpy County are 7:00 AM to 7:29 AM (8,675, 17.3%) for males and 7:00 AM to 7:29 AM (8,850, 21.2%) for females.
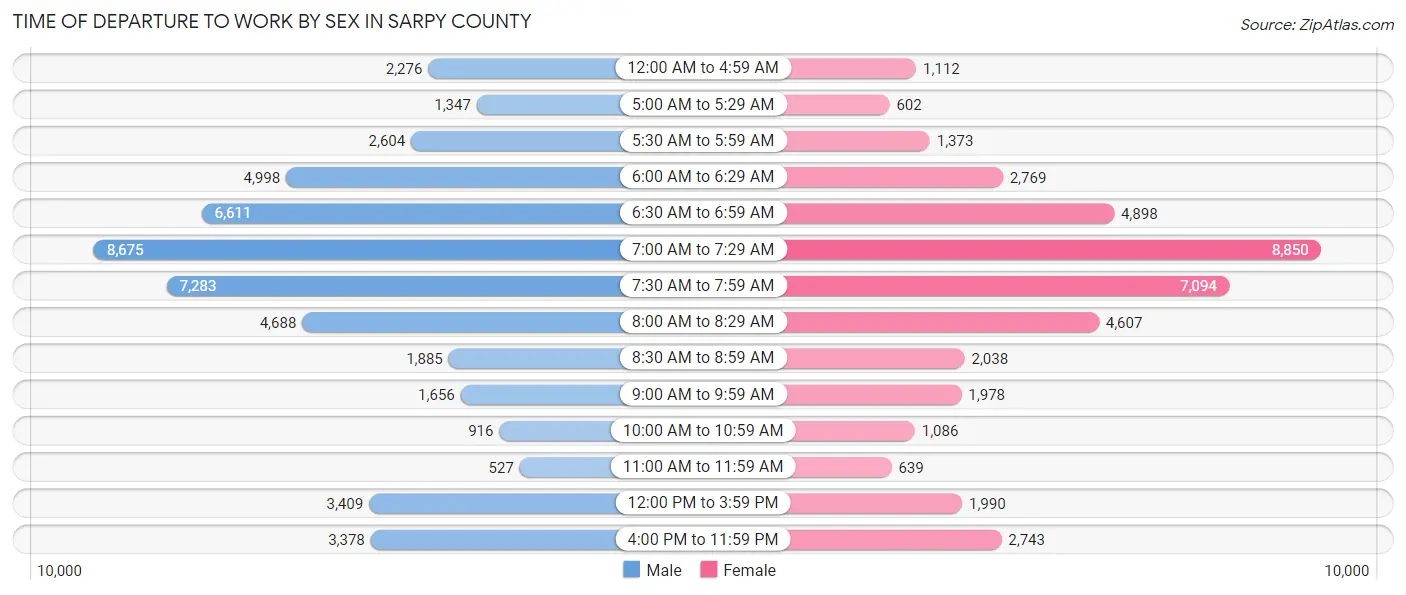
| Time of Departure | Male | Female |
| 12:00 AM to 4:59 AM | 2,276 (4.5%) | 1,112 (2.7%) |
| 5:00 AM to 5:29 AM | 1,347 (2.7%) | 602 (1.4%) |
| 5:30 AM to 5:59 AM | 2,604 (5.2%) | 1,373 (3.3%) |
| 6:00 AM to 6:29 AM | 4,998 (10.0%) | 2,769 (6.6%) |
| 6:30 AM to 6:59 AM | 6,611 (13.2%) | 4,898 (11.7%) |
| 7:00 AM to 7:29 AM | 8,675 (17.3%) | 8,850 (21.2%) |
| 7:30 AM to 7:59 AM | 7,283 (14.5%) | 7,094 (17.0%) |
| 8:00 AM to 8:29 AM | 4,688 (9.3%) | 4,607 (11.0%) |
| 8:30 AM to 8:59 AM | 1,885 (3.7%) | 2,038 (4.9%) |
| 9:00 AM to 9:59 AM | 1,656 (3.3%) | 1,978 (4.7%) |
| 10:00 AM to 10:59 AM | 916 (1.8%) | 1,086 (2.6%) |
| 11:00 AM to 11:59 AM | 527 (1.1%) | 639 (1.5%) |
| 12:00 PM to 3:59 PM | 3,409 (6.8%) | 1,990 (4.8%) |
| 4:00 PM to 11:59 PM | 3,378 (6.7%) | 2,743 (6.6%) |
| Total | 50,253 (100.0%) | 41,779 (100.0%) |
Housing Occupancy in Sarpy County
Occupancy by Ownership in Sarpy County
Of the total 71,142 dwellings in Sarpy County, owner-occupied units account for 49,735 (69.9%), while renter-occupied units make up 21,407 (30.1%).
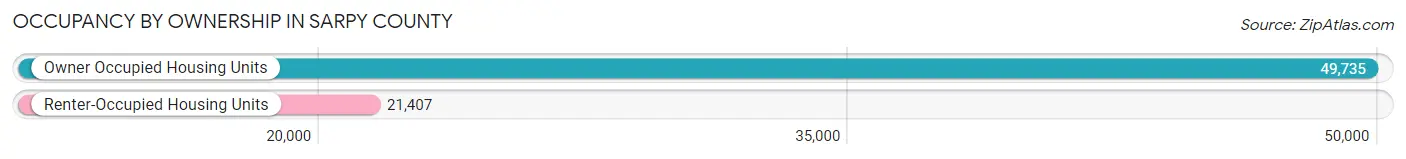
| Occupancy | # Housing Units | % Housing Units |
| Owner Occupied Housing Units | 49,735 | 69.9% |
| Renter-Occupied Housing Units | 21,407 | 30.1% |
| Total Occupied Housing Units | 71,142 | 100.0% |
Occupancy by Household Size in Sarpy County
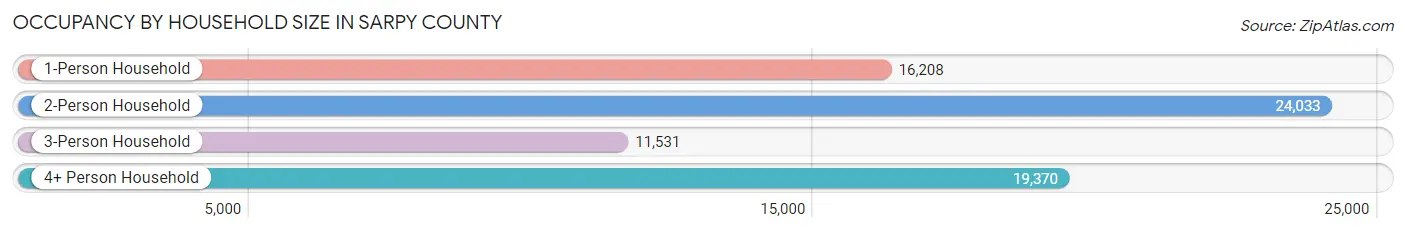
| Household Size | # Housing Units | % Housing Units |
| 1-Person Household | 16,208 | 22.8% |
| 2-Person Household | 24,033 | 33.8% |
| 3-Person Household | 11,531 | 16.2% |
| 4+ Person Household | 19,370 | 27.2% |
| Total Housing Units | 71,142 | 100.0% |
Occupancy by Ownership by Household Size in Sarpy County
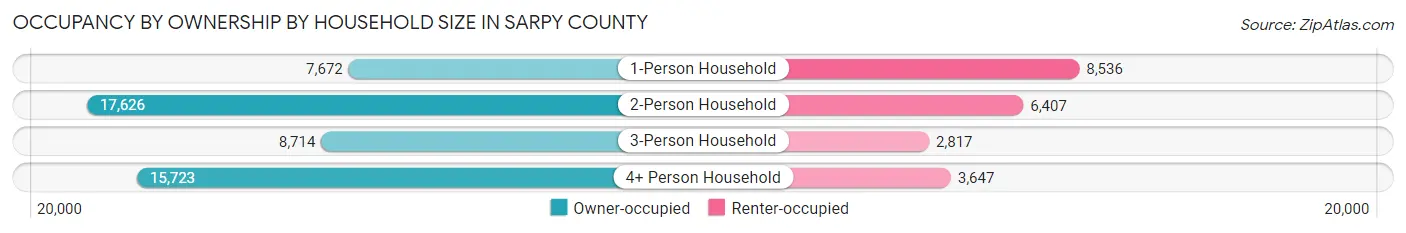
| Household Size | Owner-occupied | Renter-occupied |
| 1-Person Household | 7,672 (47.3%) | 8,536 (52.7%) |
| 2-Person Household | 17,626 (73.3%) | 6,407 (26.7%) |
| 3-Person Household | 8,714 (75.6%) | 2,817 (24.4%) |
| 4+ Person Household | 15,723 (81.2%) | 3,647 (18.8%) |
| Total Housing Units | 49,735 (69.9%) | 21,407 (30.1%) |
Occupancy by Educational Attainment in Sarpy County
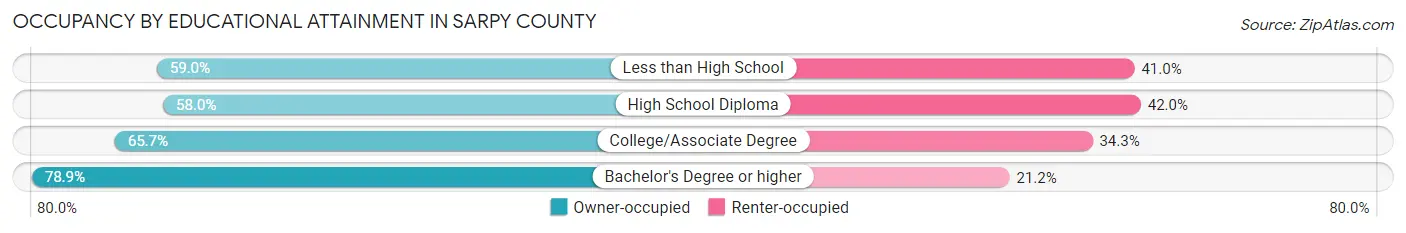
| Household Size | Owner-occupied | Renter-occupied |
| Less than High School | 1,340 (59.0%) | 930 (41.0%) |
| High School Diploma | 7,315 (58.0%) | 5,291 (42.0%) |
| College/Associate Degree | 16,400 (65.7%) | 8,567 (34.3%) |
| Bachelor's Degree or higher | 24,680 (78.8%) | 6,619 (21.1%) |
Occupancy by Age of Householder in Sarpy County
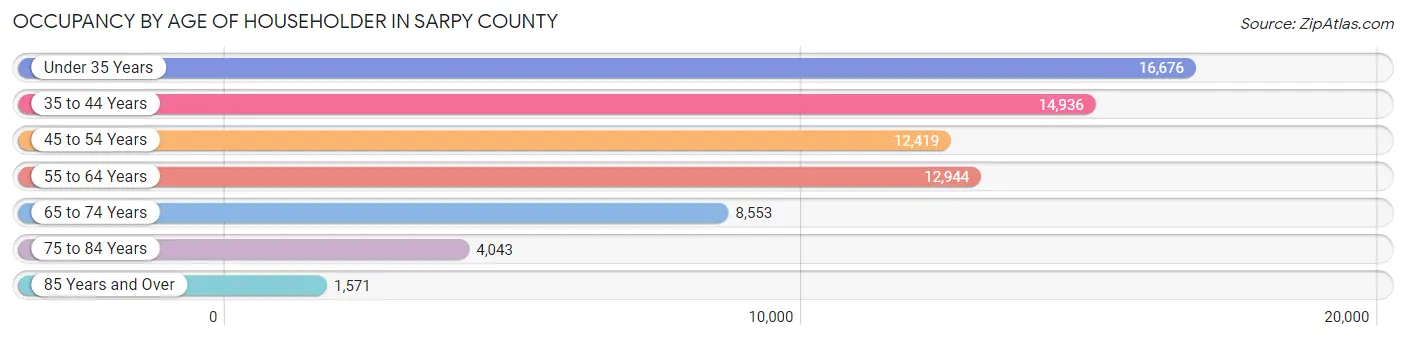
| Age Bracket | # Households | % Households |
| Under 35 Years | 16,676 | 23.4% |
| 35 to 44 Years | 14,936 | 21.0% |
| 45 to 54 Years | 12,419 | 17.5% |
| 55 to 64 Years | 12,944 | 18.2% |
| 65 to 74 Years | 8,553 | 12.0% |
| 75 to 84 Years | 4,043 | 5.7% |
| 85 Years and Over | 1,571 | 2.2% |
| Total | 71,142 | 100.0% |
Housing Finances in Sarpy County
Median Income by Occupancy in Sarpy County
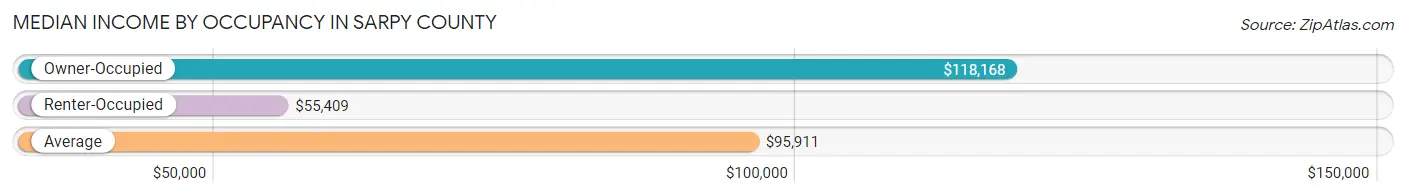
| Occupancy Type | # Households | Median Income |
| Owner-Occupied | 49,735 (69.9%) | $118,168 |
| Renter-Occupied | 21,407 (30.1%) | $55,409 |
| Average | 71,142 (100.0%) | $95,911 |
Occupancy by Householder Income Bracket in Sarpy County
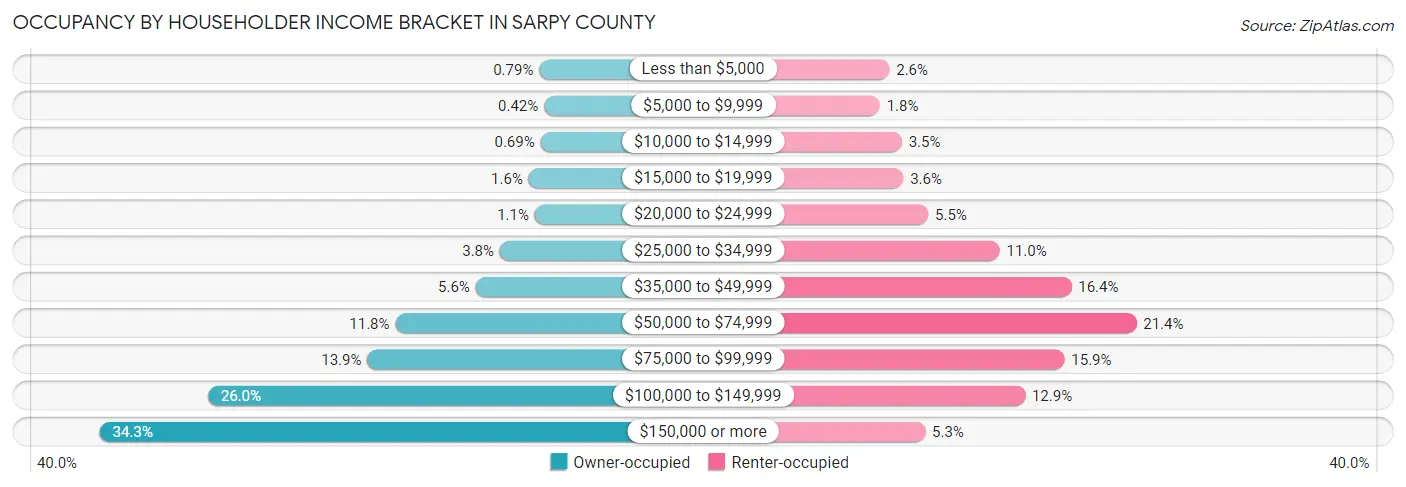
| Income Bracket | Owner-occupied | Renter-occupied |
| Less than $5,000 | 393 (0.8%) | 550 (2.6%) |
| $5,000 to $9,999 | 208 (0.4%) | 393 (1.8%) |
| $10,000 to $14,999 | 344 (0.7%) | 753 (3.5%) |
| $15,000 to $19,999 | 789 (1.6%) | 777 (3.6%) |
| $20,000 to $24,999 | 562 (1.1%) | 1,183 (5.5%) |
| $25,000 to $34,999 | 1,884 (3.8%) | 2,348 (11.0%) |
| $35,000 to $49,999 | 2,798 (5.6%) | 3,520 (16.4%) |
| $50,000 to $74,999 | 5,843 (11.7%) | 4,579 (21.4%) |
| $75,000 to $99,999 | 6,907 (13.9%) | 3,406 (15.9%) |
| $100,000 to $149,999 | 12,951 (26.0%) | 2,763 (12.9%) |
| $150,000 or more | 17,056 (34.3%) | 1,135 (5.3%) |
| Total | 49,735 (100.0%) | 21,407 (100.0%) |
Monthly Housing Cost Tiers in Sarpy County
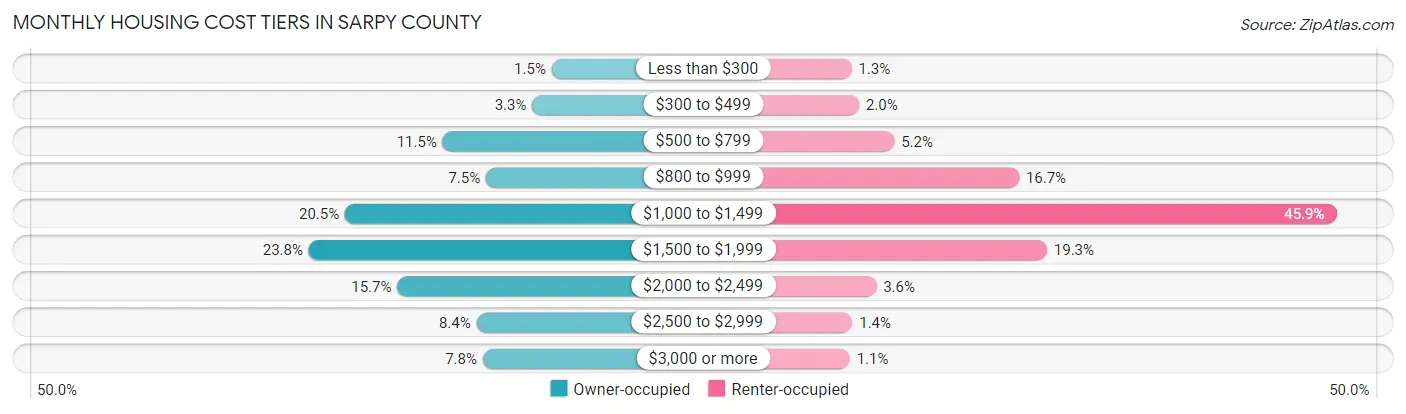
| Monthly Cost | Owner-occupied | Renter-occupied |
| Less than $300 | 730 (1.5%) | 279 (1.3%) |
| $300 to $499 | 1,622 (3.3%) | 426 (2.0%) |
| $500 to $799 | 5,724 (11.5%) | 1,119 (5.2%) |
| $800 to $999 | 3,740 (7.5%) | 3,577 (16.7%) |
| $1,000 to $1,499 | 10,194 (20.5%) | 9,832 (45.9%) |
| $1,500 to $1,999 | 11,859 (23.8%) | 4,127 (19.3%) |
| $2,000 to $2,499 | 7,803 (15.7%) | 764 (3.6%) |
| $2,500 to $2,999 | 4,174 (8.4%) | 293 (1.4%) |
| $3,000 or more | 3,889 (7.8%) | 242 (1.1%) |
| Total | 49,735 (100.0%) | 21,407 (100.0%) |
Physical Housing Characteristics in Sarpy County
Housing Structures in Sarpy County
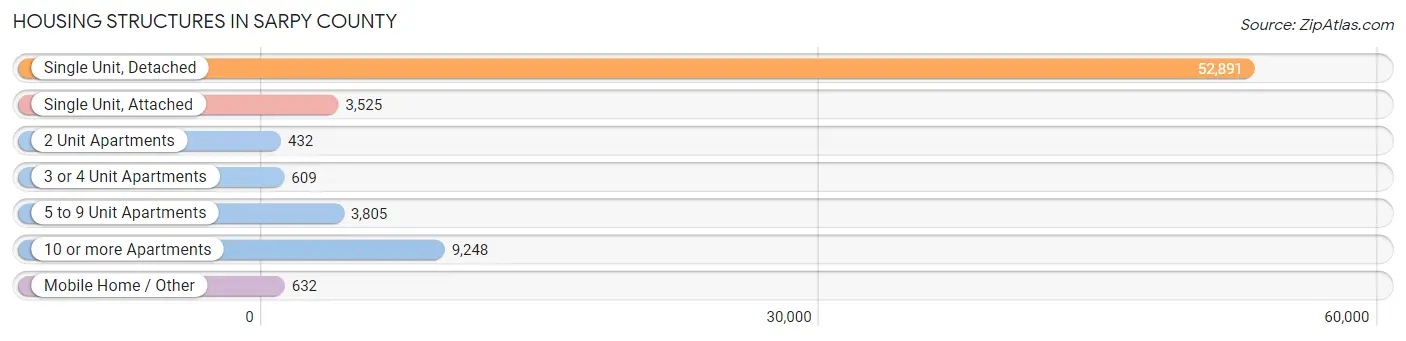
| Structure Type | # Housing Units | % Housing Units |
| Single Unit, Detached | 52,891 | 74.4% |
| Single Unit, Attached | 3,525 | 5.0% |
| 2 Unit Apartments | 432 | 0.6% |
| 3 or 4 Unit Apartments | 609 | 0.9% |
| 5 to 9 Unit Apartments | 3,805 | 5.3% |
| 10 or more Apartments | 9,248 | 13.0% |
| Mobile Home / Other | 632 | 0.9% |
| Total | 71,142 | 100.0% |
Housing Structures by Occupancy in Sarpy County
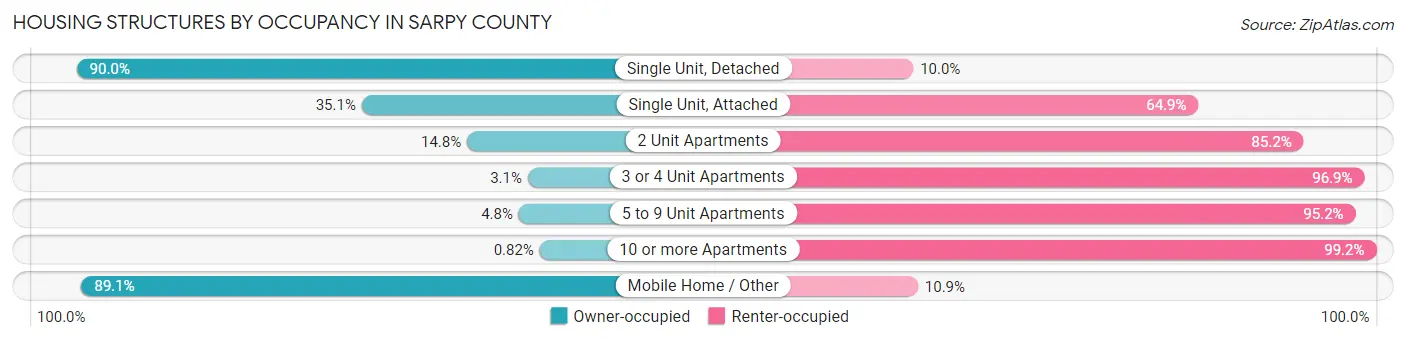
| Structure Type | Owner-occupied | Renter-occupied |
| Single Unit, Detached | 47,592 (90.0%) | 5,299 (10.0%) |
| Single Unit, Attached | 1,237 (35.1%) | 2,288 (64.9%) |
| 2 Unit Apartments | 64 (14.8%) | 368 (85.2%) |
| 3 or 4 Unit Apartments | 19 (3.1%) | 590 (96.9%) |
| 5 to 9 Unit Apartments | 184 (4.8%) | 3,621 (95.2%) |
| 10 or more Apartments | 76 (0.8%) | 9,172 (99.2%) |
| Mobile Home / Other | 563 (89.1%) | 69 (10.9%) |
| Total | 49,735 (69.9%) | 21,407 (30.1%) |
Housing Structures by Number of Rooms in Sarpy County
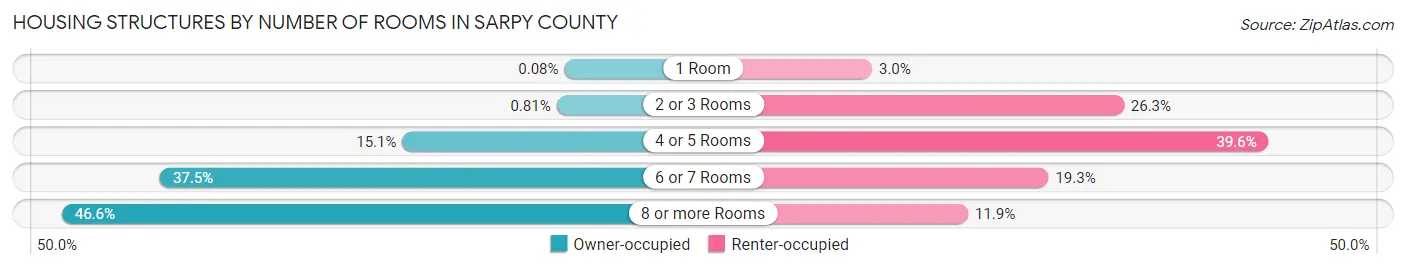
| Number of Rooms | Owner-occupied | Renter-occupied |
| 1 Room | 42 (0.1%) | 635 (3.0%) |
| 2 or 3 Rooms | 404 (0.8%) | 5,621 (26.3%) |
| 4 or 5 Rooms | 7,494 (15.1%) | 8,486 (39.6%) |
| 6 or 7 Rooms | 18,640 (37.5%) | 4,129 (19.3%) |
| 8 or more Rooms | 23,155 (46.6%) | 2,536 (11.8%) |
| Total | 49,735 (100.0%) | 21,407 (100.0%) |
Housing Structure by Heating Type in Sarpy County
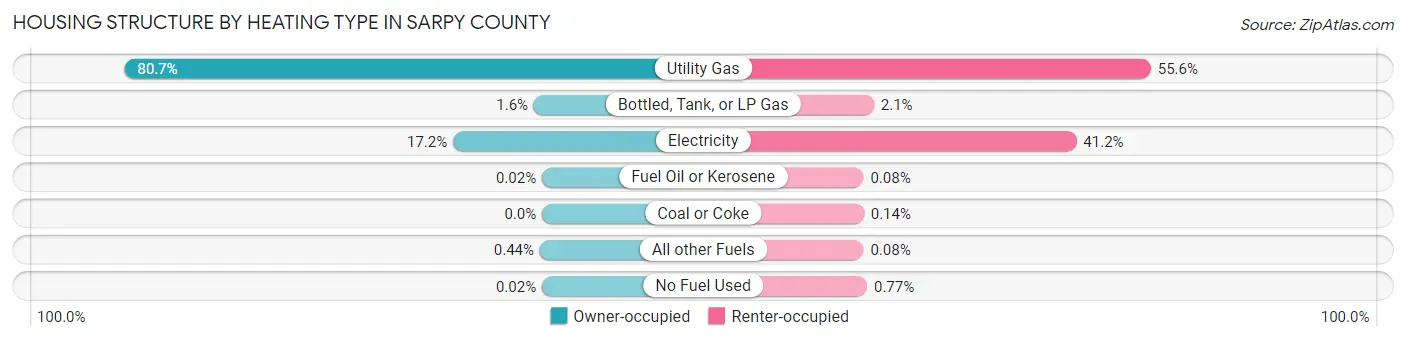
| Heating Type | Owner-occupied | Renter-occupied |
| Utility Gas | 40,147 (80.7%) | 11,903 (55.6%) |
| Bottled, Tank, or LP Gas | 788 (1.6%) | 448 (2.1%) |
| Electricity | 8,559 (17.2%) | 8,826 (41.2%) |
| Fuel Oil or Kerosene | 10 (0.0%) | 17 (0.1%) |
| Coal or Coke | 0 (0.0%) | 31 (0.1%) |
| All other Fuels | 219 (0.4%) | 17 (0.1%) |
| No Fuel Used | 12 (0.0%) | 165 (0.8%) |
| Total | 49,735 (100.0%) | 21,407 (100.0%) |
Household Vehicle Usage in Sarpy County
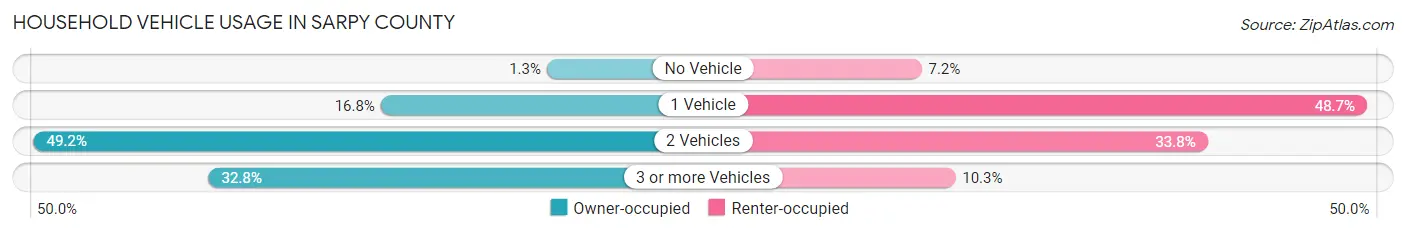
| Vehicles per Household | Owner-occupied | Renter-occupied |
| No Vehicle | 622 (1.3%) | 1,531 (7.1%) |
| 1 Vehicle | 8,336 (16.8%) | 10,427 (48.7%) |
| 2 Vehicles | 24,450 (49.2%) | 7,244 (33.8%) |
| 3 or more Vehicles | 16,327 (32.8%) | 2,205 (10.3%) |
| Total | 49,735 (100.0%) | 21,407 (100.0%) |
Real Estate & Mortgages in Sarpy County
Real Estate and Mortgage Overview in Sarpy County
| Characteristic | Without Mortgage | With Mortgage |
| Housing Units | 13,470 | 36,265 |
| Median Property Value | $242,000 | $270,500 |
| Median Household Income | $89,475 | $13,916 |
| Monthly Housing Costs | $770 | $3,877 |
| Real Estate Taxes | $4,500 | $890 |
Property Value by Mortgage Status in Sarpy County
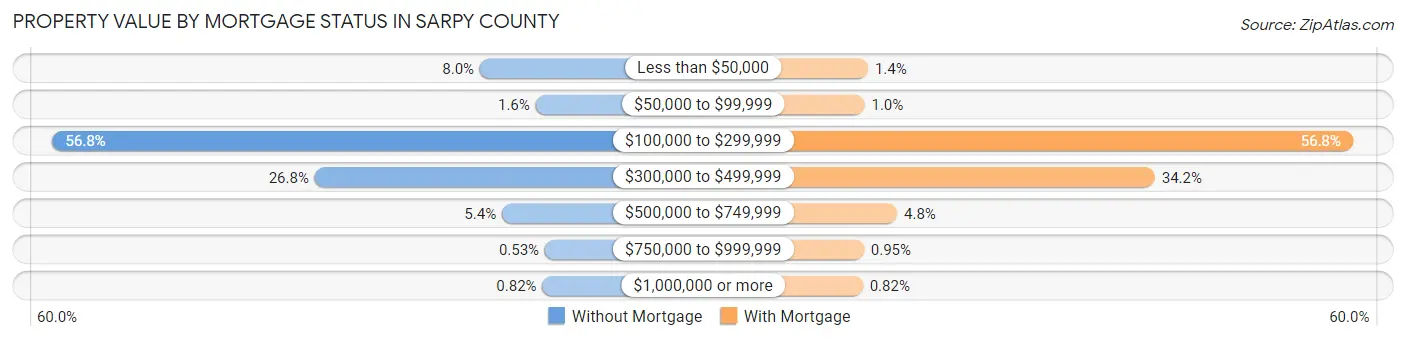
| Property Value | Without Mortgage | With Mortgage |
| Less than $50,000 | 1,072 (8.0%) | 514 (1.4%) |
| $50,000 to $99,999 | 215 (1.6%) | 373 (1.0%) |
| $100,000 to $299,999 | 7,653 (56.8%) | 20,610 (56.8%) |
| $300,000 to $499,999 | 3,615 (26.8%) | 12,403 (34.2%) |
| $500,000 to $749,999 | 733 (5.4%) | 1,724 (4.8%) |
| $750,000 to $999,999 | 71 (0.5%) | 345 (0.9%) |
| $1,000,000 or more | 111 (0.8%) | 296 (0.8%) |
| Total | 13,470 (100.0%) | 36,265 (100.0%) |
Household Income by Mortgage Status in Sarpy County
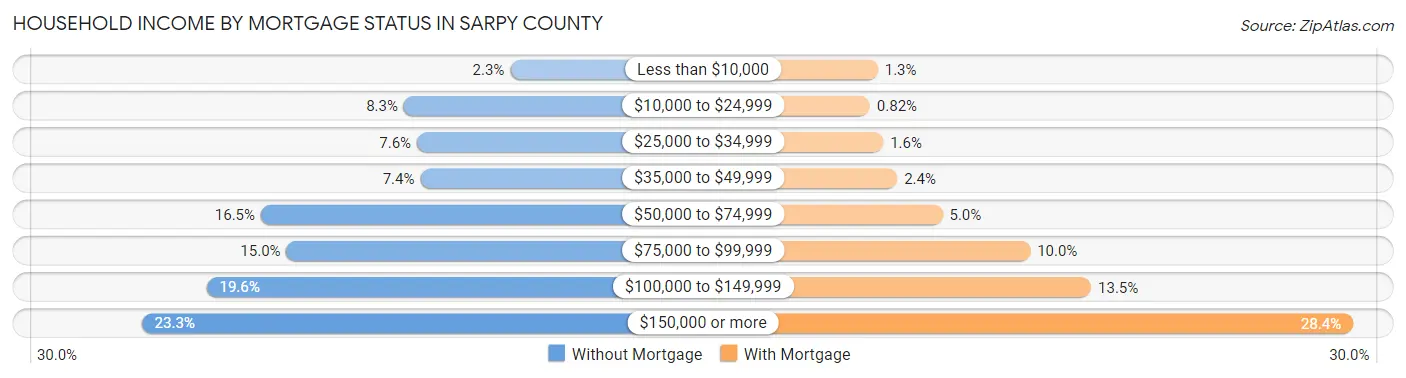
| Household Income | Without Mortgage | With Mortgage |
| Less than $10,000 | 303 (2.2%) | 459 (1.3%) |
| $10,000 to $24,999 | 1,122 (8.3%) | 298 (0.8%) |
| $25,000 to $34,999 | 1,021 (7.6%) | 573 (1.6%) |
| $35,000 to $49,999 | 995 (7.4%) | 863 (2.4%) |
| $50,000 to $74,999 | 2,223 (16.5%) | 1,803 (5.0%) |
| $75,000 to $99,999 | 2,026 (15.0%) | 3,620 (10.0%) |
| $100,000 to $149,999 | 2,640 (19.6%) | 4,881 (13.5%) |
| $150,000 or more | 3,140 (23.3%) | 10,311 (28.4%) |
| Total | 13,470 (100.0%) | 36,265 (100.0%) |
Property Value to Household Income Ratio in Sarpy County
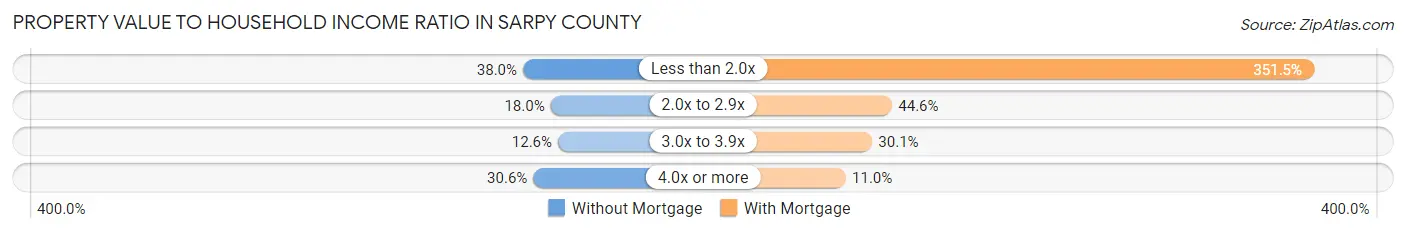
| Value-to-Income Ratio | Without Mortgage | With Mortgage |
| Less than 2.0x | 5,124 (38.0%) | 127,478 (351.5%) |
| 2.0x to 2.9x | 2,421 (18.0%) | 16,177 (44.6%) |
| 3.0x to 3.9x | 1,697 (12.6%) | 10,930 (30.1%) |
| 4.0x or more | 4,117 (30.6%) | 3,999 (11.0%) |
| Total | 13,470 (100.0%) | 36,265 (100.0%) |
Real Estate Taxes by Mortgage Status in Sarpy County
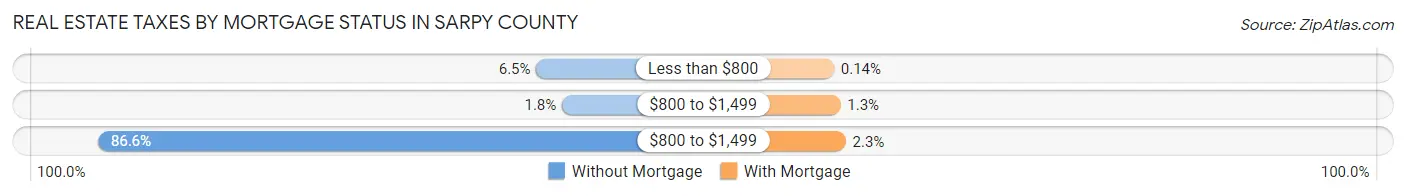
| Property Taxes | Without Mortgage | With Mortgage |
| Less than $800 | 879 (6.5%) | 51 (0.1%) |
| $800 to $1,499 | 246 (1.8%) | 487 (1.3%) |
| $800 to $1,499 | 11,667 (86.6%) | 834 (2.3%) |
| Total | 13,470 (100.0%) | 36,265 (100.0%) |
Health & Disability in Sarpy County
Health Insurance Coverage by Age in Sarpy County
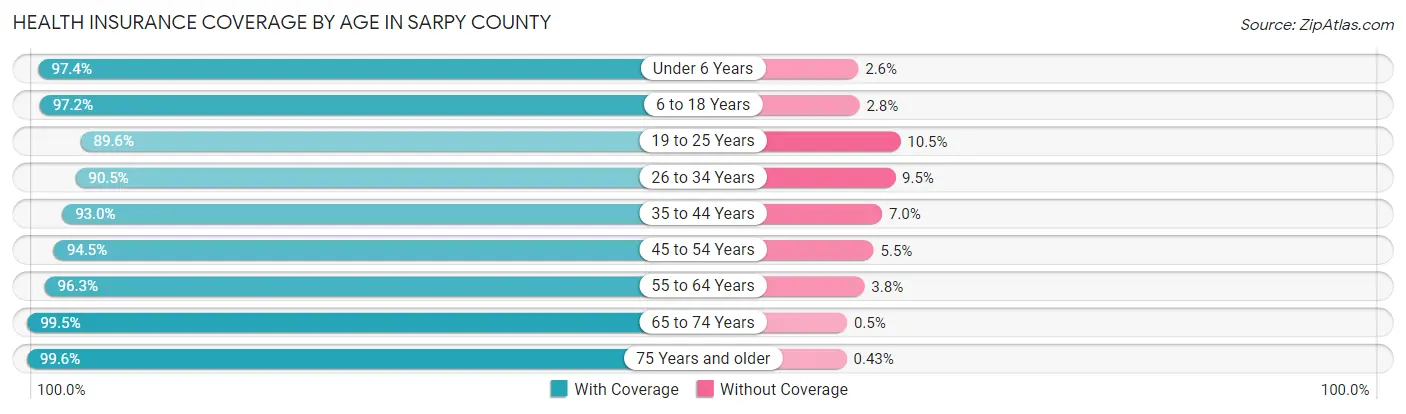
| Age Bracket | With Coverage | Without Coverage |
| Under 6 Years | 15,575 (97.4%) | 418 (2.6%) |
| 6 to 18 Years | 36,599 (97.2%) | 1,066 (2.8%) |
| 19 to 25 Years | 13,818 (89.5%) | 1,613 (10.4%) |
| 26 to 34 Years | 20,517 (90.5%) | 2,149 (9.5%) |
| 35 to 44 Years | 25,469 (93.0%) | 1,923 (7.0%) |
| 45 to 54 Years | 21,680 (94.5%) | 1,251 (5.5%) |
| 55 to 64 Years | 20,737 (96.3%) | 807 (3.7%) |
| 65 to 74 Years | 14,211 (99.5%) | 71 (0.5%) |
| 75 Years and older | 8,542 (99.6%) | 37 (0.4%) |
| Total | 177,148 (95.0%) | 9,335 (5.0%) |
Health Insurance Coverage by Citizenship Status in Sarpy County
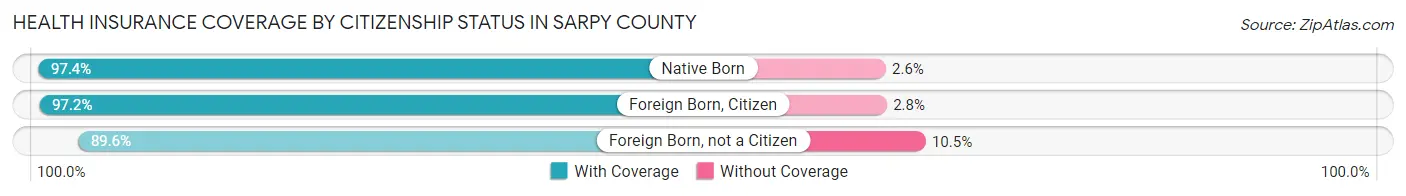
| Citizenship Status | With Coverage | Without Coverage |
| Native Born | 15,575 (97.4%) | 418 (2.6%) |
| Foreign Born, Citizen | 36,599 (97.2%) | 1,066 (2.8%) |
| Foreign Born, not a Citizen | 13,818 (89.5%) | 1,613 (10.4%) |
Health Insurance Coverage by Household Income in Sarpy County
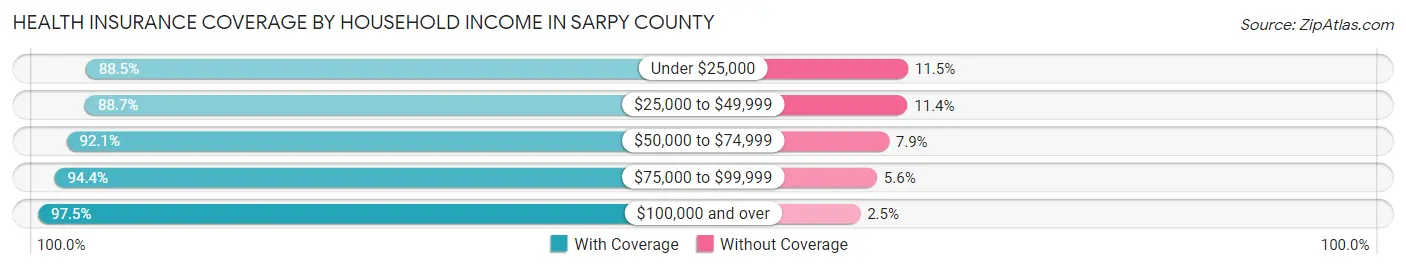
| Household Income | With Coverage | Without Coverage |
| Under $25,000 | 8,341 (88.5%) | 1,081 (11.5%) |
| $25,000 to $49,999 | 16,816 (88.6%) | 2,152 (11.4%) |
| $50,000 to $74,999 | 21,923 (92.1%) | 1,876 (7.9%) |
| $75,000 to $99,999 | 25,284 (94.4%) | 1,511 (5.6%) |
| $100,000 and over | 104,605 (97.5%) | 2,699 (2.5%) |
Public vs Private Health Insurance Coverage by Age in Sarpy County
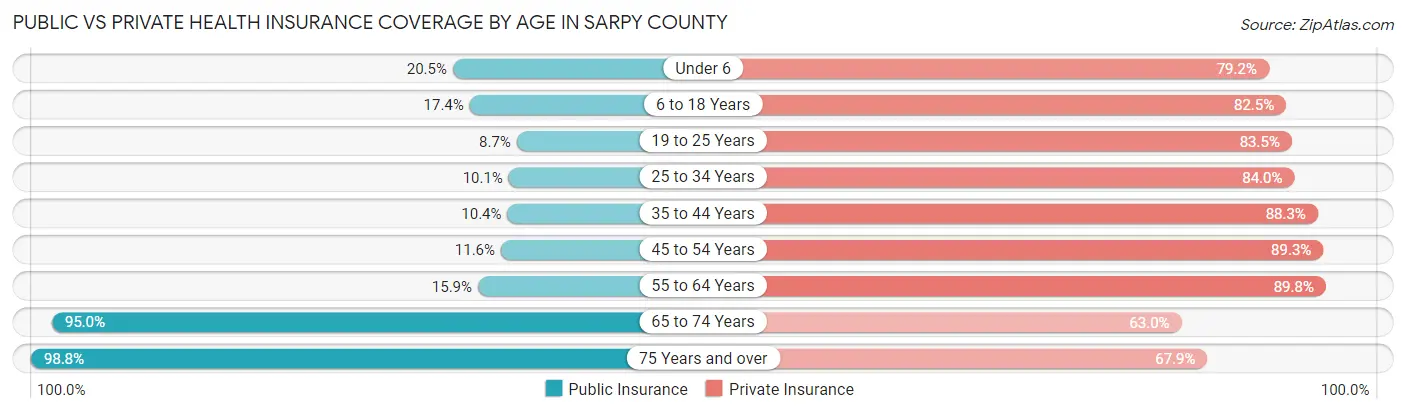
| Age Bracket | Public Insurance | Private Insurance |
| Under 6 | 3,281 (20.5%) | 12,673 (79.2%) |
| 6 to 18 Years | 6,552 (17.4%) | 31,053 (82.5%) |
| 19 to 25 Years | 1,337 (8.7%) | 12,887 (83.5%) |
| 25 to 34 Years | 2,298 (10.1%) | 19,034 (84.0%) |
| 35 to 44 Years | 2,846 (10.4%) | 24,196 (88.3%) |
| 45 to 54 Years | 2,659 (11.6%) | 20,487 (89.3%) |
| 55 to 64 Years | 3,420 (15.9%) | 19,351 (89.8%) |
| 65 to 74 Years | 13,561 (95.0%) | 9,003 (63.0%) |
| 75 Years and over | 8,479 (98.8%) | 5,821 (67.8%) |
| Total | 44,433 (23.8%) | 154,505 (82.9%) |
Disability Status by Sex by Age in Sarpy County
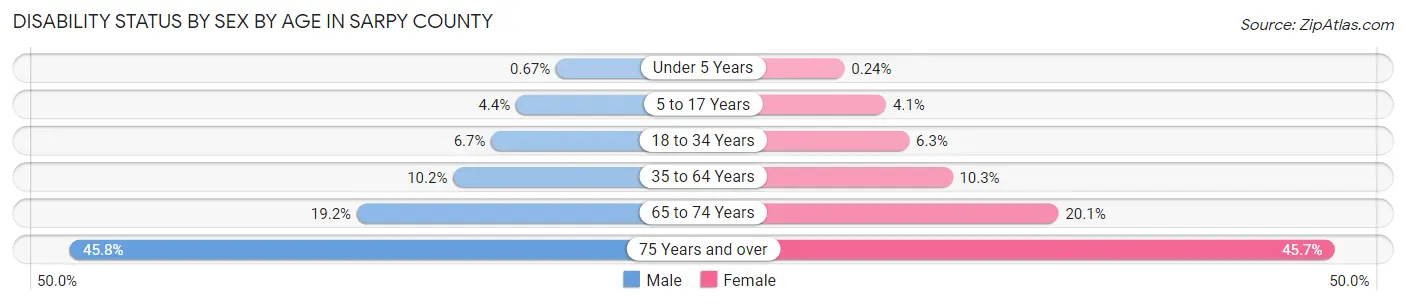
| Age Bracket | Male | Female |
| Under 5 Years | 44 (0.7%) | 15 (0.2%) |
| 5 to 17 Years | 869 (4.4%) | 760 (4.1%) |
| 18 to 34 Years | 1,351 (6.7%) | 1,273 (6.2%) |
| 35 to 64 Years | 3,668 (10.2%) | 3,697 (10.3%) |
| 65 to 74 Years | 1,281 (19.2%) | 1,528 (20.1%) |
| 75 Years and over | 1,655 (45.8%) | 2,268 (45.7%) |
Disability Class by Sex by Age in Sarpy County
Disability Class: Hearing Difficulty
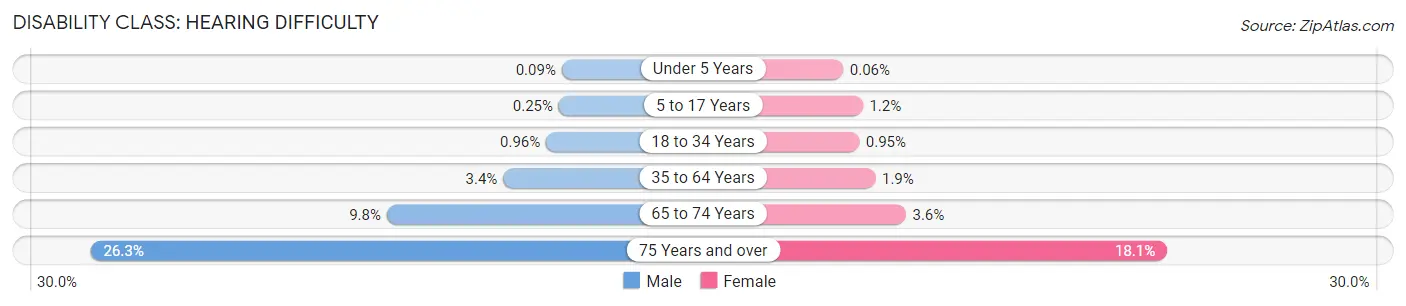
| Age Bracket | Male | Female |
| Under 5 Years | 6 (0.1%) | 4 (0.1%) |
| 5 to 17 Years | 50 (0.3%) | 212 (1.1%) |
| 18 to 34 Years | 194 (1.0%) | 194 (0.9%) |
| 35 to 64 Years | 1,203 (3.4%) | 664 (1.8%) |
| 65 to 74 Years | 657 (9.8%) | 270 (3.5%) |
| 75 Years and over | 952 (26.3%) | 899 (18.1%) |
Disability Class: Vision Difficulty
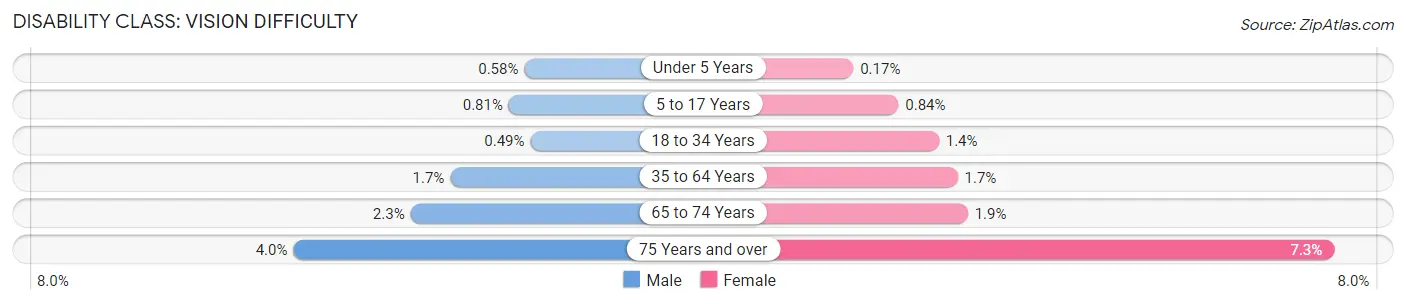
| Age Bracket | Male | Female |
| Under 5 Years | 38 (0.6%) | 11 (0.2%) |
| 5 to 17 Years | 160 (0.8%) | 155 (0.8%) |
| 18 to 34 Years | 99 (0.5%) | 293 (1.4%) |
| 35 to 64 Years | 603 (1.7%) | 620 (1.7%) |
| 65 to 74 Years | 152 (2.3%) | 142 (1.9%) |
| 75 Years and over | 145 (4.0%) | 363 (7.3%) |
Disability Class: Cognitive Difficulty
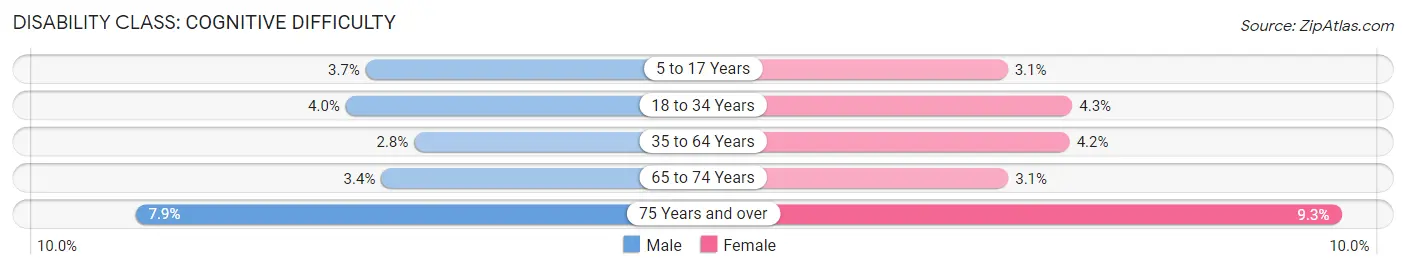
| Age Bracket | Male | Female |
| 5 to 17 Years | 728 (3.7%) | 569 (3.1%) |
| 18 to 34 Years | 817 (4.0%) | 871 (4.3%) |
| 35 to 64 Years | 995 (2.8%) | 1,522 (4.2%) |
| 65 to 74 Years | 226 (3.4%) | 235 (3.1%) |
| 75 Years and over | 287 (7.9%) | 460 (9.3%) |
Disability Class: Ambulatory Difficulty
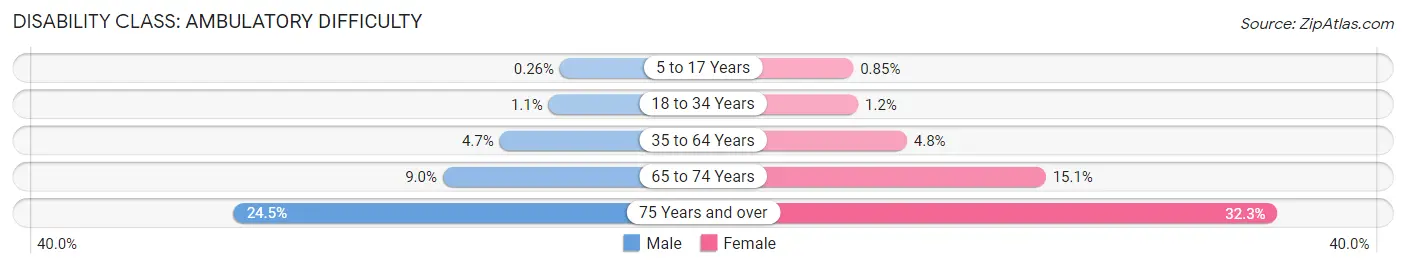
| Age Bracket | Male | Female |
| 5 to 17 Years | 52 (0.3%) | 158 (0.9%) |
| 18 to 34 Years | 223 (1.1%) | 247 (1.2%) |
| 35 to 64 Years | 1,699 (4.7%) | 1,739 (4.8%) |
| 65 to 74 Years | 598 (8.9%) | 1,150 (15.1%) |
| 75 Years and over | 885 (24.5%) | 1,605 (32.3%) |
Disability Class: Self-Care Difficulty
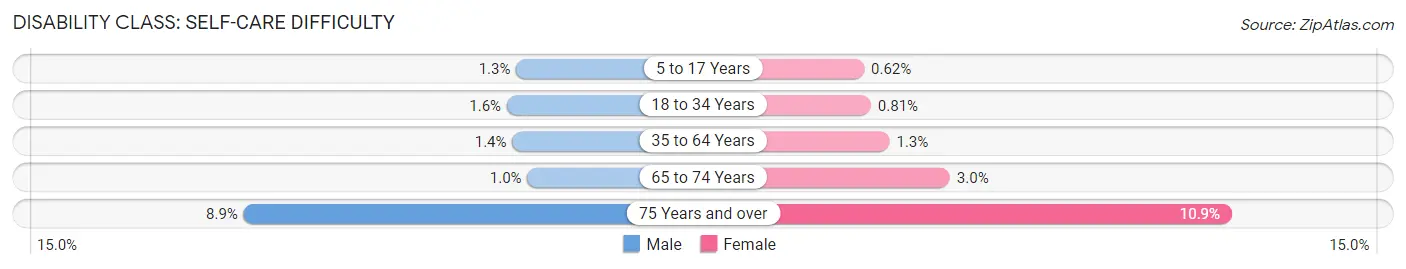
| Age Bracket | Male | Female |
| 5 to 17 Years | 259 (1.3%) | 115 (0.6%) |
| 18 to 34 Years | 317 (1.6%) | 164 (0.8%) |
| 35 to 64 Years | 510 (1.4%) | 480 (1.3%) |
| 65 to 74 Years | 67 (1.0%) | 229 (3.0%) |
| 75 Years and over | 322 (8.9%) | 539 (10.9%) |
Technology Access in Sarpy County
Computing Device Access in Sarpy County
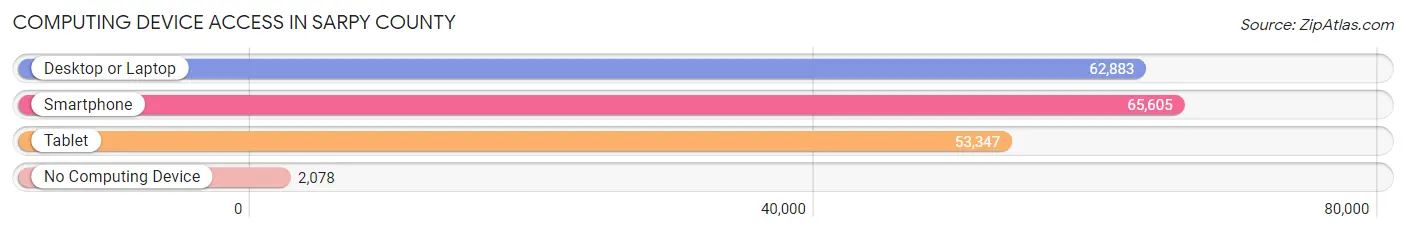
| Device Type | # Households | % Households |
| Desktop or Laptop | 62,883 | 88.4% |
| Smartphone | 65,605 | 92.2% |
| Tablet | 53,347 | 75.0% |
| No Computing Device | 2,078 | 2.9% |
| Total | 71,142 | 100.0% |
Internet Access in Sarpy County
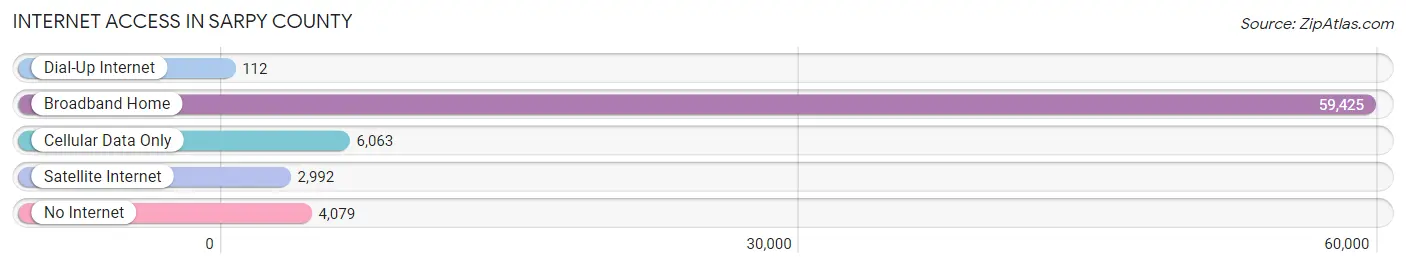
| Internet Type | # Households | % Households |
| Dial-Up Internet | 112 | 0.2% |
| Broadband Home | 59,425 | 83.5% |
| Cellular Data Only | 6,063 | 8.5% |
| Satellite Internet | 2,992 | 4.2% |
| No Internet | 4,079 | 5.7% |
| Total | 71,142 | 100.0% |
Sarpy County Summary
Sarpy County is located in the state of Nebraska in the Midwestern United States. It is the third most populous county in the state, with a population of over 170,000 people. The county seat is Papillion, and the largest city is Bellevue. Sarpy County is bordered by Douglas County to the north, Cass County to the east, Saunders County to the south, and Dodge County to the west.
History
Sarpy County was established in 1857, and was named after Colonel Peter Sarpy, a fur trader and early settler in the area. The county was originally part of the Nebraska Territory, and was part of the original Douglas County. In 1854, the Nebraska Territory was divided into two counties, Douglas and Sarpy. In 1855, Sarpy County was further divided into two counties, Cass and Sarpy.
The county was largely rural until the 1950s, when the population began to grow rapidly due to the growth of the Omaha metropolitan area. The county experienced a population boom in the 1970s and 1980s, and the population has continued to grow since then.
Geography
Sarpy County is located in the eastern part of Nebraska, and is part of the Omaha-Council Bluffs metropolitan area. The county is located in the Missouri River Valley, and is bordered by Douglas County to the north, Cass County to the east, Saunders County to the south, and Dodge County to the west. The county covers an area of 545 square miles, and has a population density of 315 people per square mile.
The county is largely flat, with some rolling hills in the western part of the county. The county is drained by the Platte River, which flows through the county from north to south. The county is home to several lakes, including Lake Zorinsky, Lake Wanahoo, and Lake Manawa.
Economy
Sarpy County has a diverse economy, with a mix of manufacturing, retail, and service industries. The county is home to several large employers, including the Offutt Air Force Base, the University of Nebraska Medical Center, and the Omaha Public Power District. The county is also home to several large retail and service businesses, including the Nebraska Crossing Outlets, the Shadow Lake Towne Center, and the Bellevue University.
The county has a strong agricultural sector, with corn, soybeans, and hay being the main crops. The county is also home to several wineries, breweries, and distilleries.
Demographics
As of the 2010 census, Sarpy County had a population of over 170,000 people. The population is largely white (86.3%), with smaller percentages of African Americans (4.7%), Hispanics (4.3%), and Asians (2.7%). The median household income is $68,845, and the median home value is $182,400.
The county is home to several large cities, including Papillion (population 24,000), Bellevue (population 53,000), and La Vista (population 17,000). The county is also home to several smaller towns, including Gretna (population 5,000), Springfield (population 2,000), and Offutt Air Force Base (population 8,000).
Common Questions
What is the Total Population of Sarpy County?
Total Population of Sarpy County is 191,272.
What is the Total Male Population of Sarpy County?
Total Male Population of Sarpy County is 96,591.
What is the Total Female Population of Sarpy County?
Total Female Population of Sarpy County is 94,681.
What is the Ratio of Males per 100 Females in Sarpy County?
There are 102.02 Males per 100 Females in Sarpy County.
What is the Ratio of Females per 100 Males in Sarpy County?
There are 98.02 Females per 100 Males in Sarpy County.
What is the Median Population Age in Sarpy County?
Median Population Age in Sarpy County is 35.3 Years.
What is the Average Family Size in Sarpy County
Average Family Size in Sarpy County is 3.2 People.
What is the Average Household Size in Sarpy County
Average Household Size in Sarpy County is 2.7 People.
What is Per Capita Income in Sarpy County?
Per Capita income in Sarpy County is $43,845.
What is the Median Family Income in Sarpy County?
Median Family Income in Sarpy County is $114,500.
What is the Median Household income in Sarpy County?
Median Household Income in Sarpy County is $95,911.
What is Income or Wage Gap in Sarpy County?
Income or Wage Gap in Sarpy County is 31.5%.
Women in Sarpy County earn 68.5 cents for every dollar earned by a man.
What is Family Income Deficit in Sarpy County?
Family Income Deficit in Sarpy County is $10,129.
Families that are below poverty line in Sarpy County earn $10,129 less on average than the poverty threshold level.
What is Inequality or Gini Index in Sarpy County?
Inequality or Gini Index in Sarpy County is 0.40.
How Large is the Labor Force in Sarpy County?
There are 107,143 People in the Labor Forcein in Sarpy County.
What is the Percentage of People in the Labor Force in Sarpy County?
73.2% of People are in the Labor Force in Sarpy County.
What is the Unemployment Rate in Sarpy County?
Unemployment Rate in Sarpy County is 2.6%.