Saline County, NE
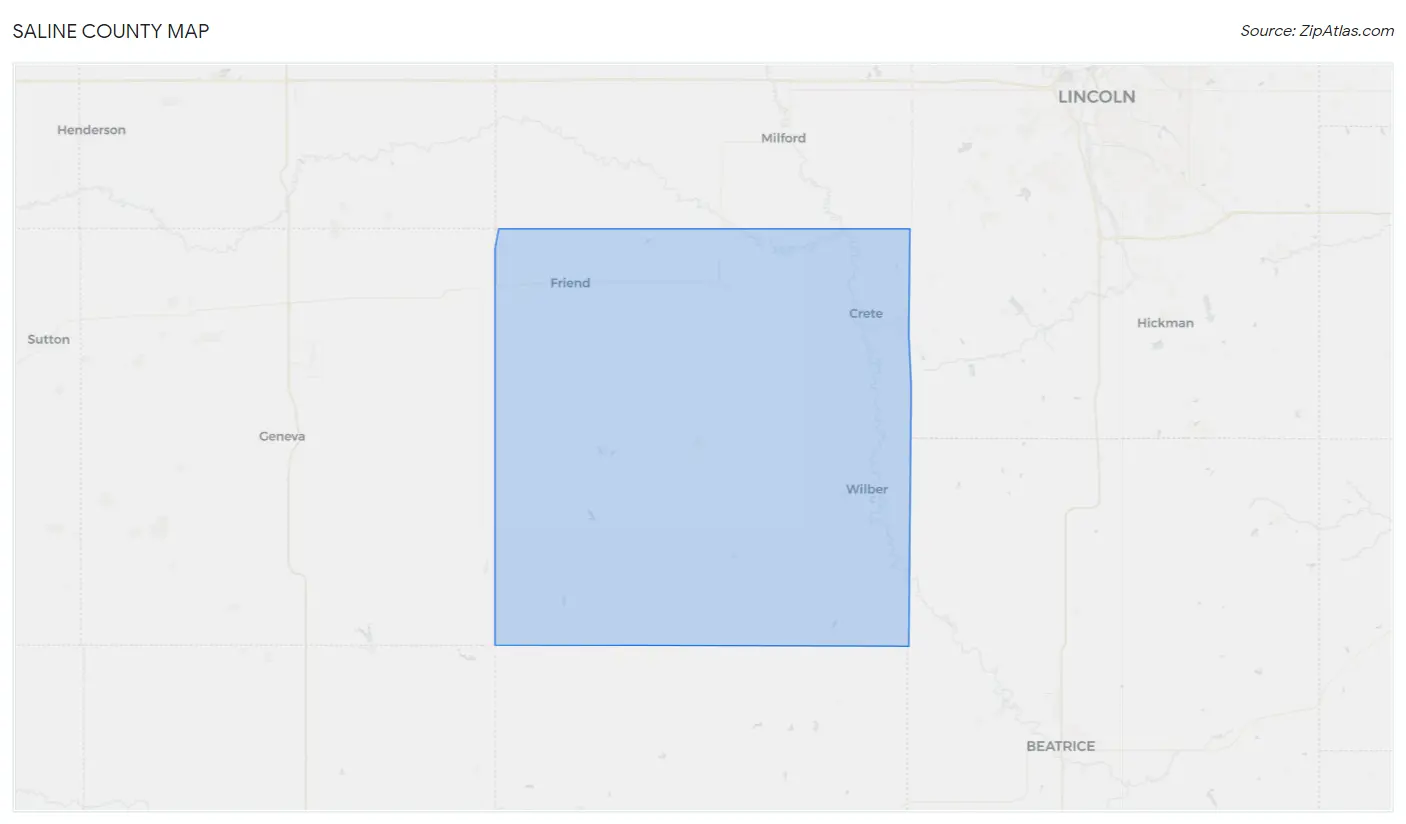
Saline County Map
Saline County Overview
14,275
TOTAL POPULATION
7,286
MALE POPULATION
6,989
FEMALE POPULATION
104.25
MALES / 100 FEMALES
95.92
FEMALES / 100 MALES
38.6
MEDIAN AGE
3.0
AVG FAMILY SIZE
2.6
AVG HOUSEHOLD SIZE
$32,563
PER CAPITA INCOME
$83,048
AVG FAMILY INCOME
$71,104
AVG HOUSEHOLD INCOME
31.7%
WAGE / INCOME GAP [ % ]
68.3¢/ $1
WAGE / INCOME GAP [ $ ]
$8,532
FAMILY INCOME DEFICIT
0.41
INEQUALITY / GINI INDEX
7,369
LABOR FORCE [ PEOPLE ]
67.2%
PERCENT IN LABOR FORCE
2.1%
UNEMPLOYMENT RATE
Saline County Area Codes
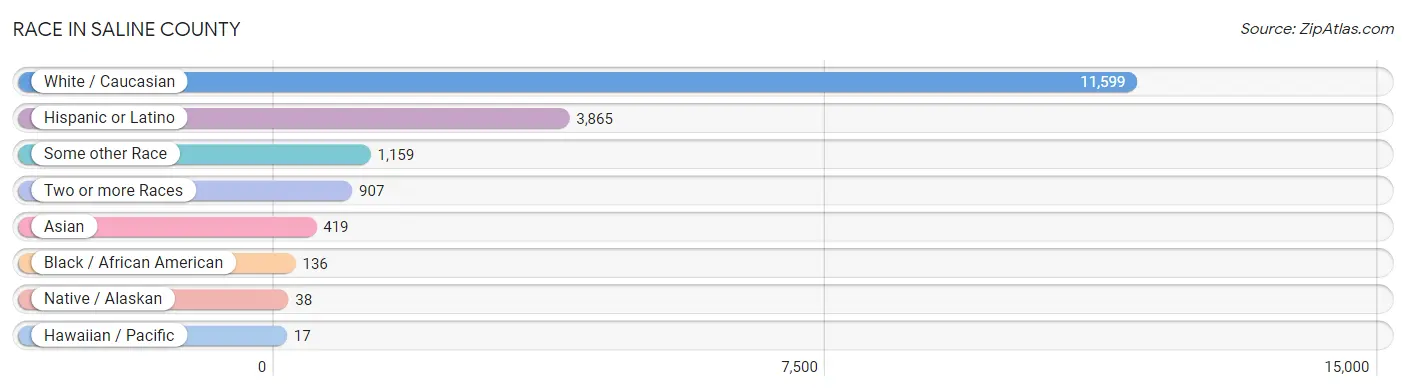
Race in Saline County
The most populous races in Saline County are White / Caucasian (11,599 | 81.2%), Hispanic or Latino (3,865 | 27.1%), and Some other Race (1,159 | 8.1%).
| Race | # Population | % Population |
| Asian | 419 | 2.9% |
| Black / African American | 136 | 0.9% |
| Hawaiian / Pacific | 17 | 0.1% |
| Hispanic or Latino | 3,865 | 27.1% |
| Native / Alaskan | 38 | 0.3% |
| White / Caucasian | 11,599 | 81.2% |
| Two or more Races | 907 | 6.4% |
| Some other Race | 1,159 | 8.1% |
| Total | 14,275 | 100.0% |
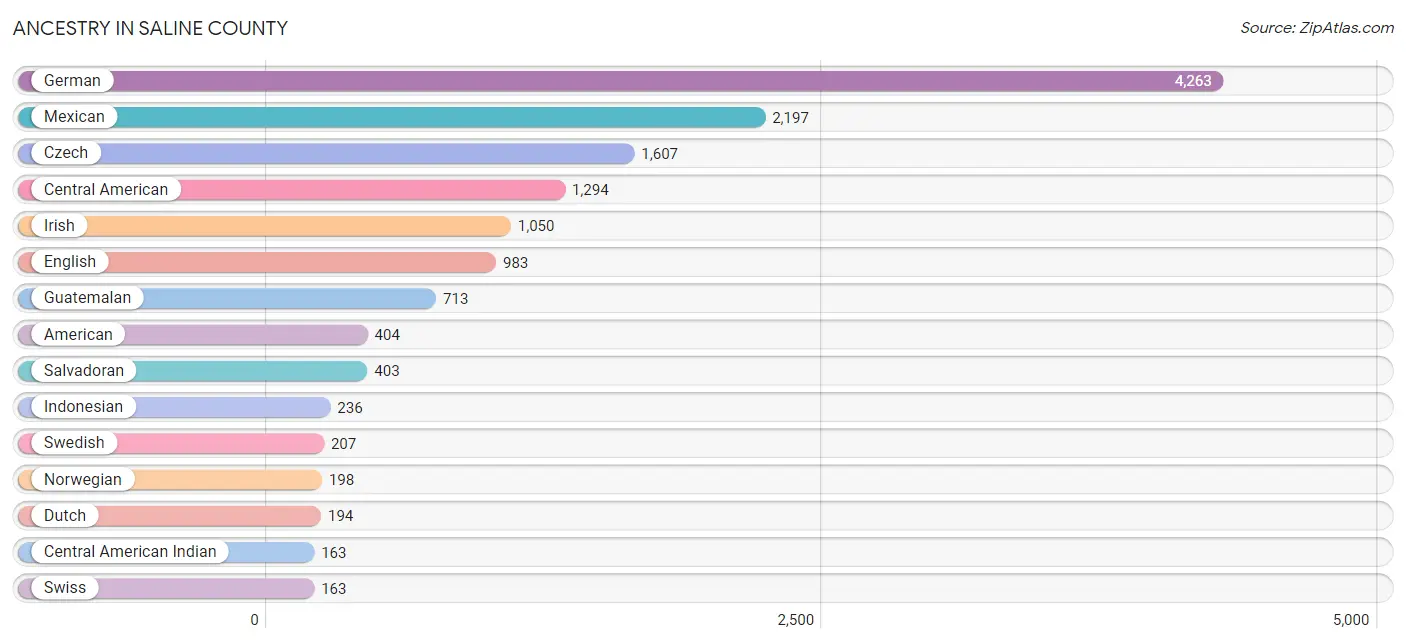
Ancestry in Saline County
The most populous ancestries reported in Saline County are German (4,263 | 29.9%), Mexican (2,197 | 15.4%), Czech (1,607 | 11.3%), Central American (1,294 | 9.1%), and Irish (1,050 | 7.4%), together accounting for 72.9% of all Saline County residents.
| Ancestry | # Population | % Population |
| African | 24 | 0.2% |
| American | 404 | 2.8% |
| Arab | 3 | 0.0% |
| Austrian | 106 | 0.7% |
| Belgian | 3 | 0.0% |
| Bhutanese | 67 | 0.5% |
| British | 13 | 0.1% |
| Canadian | 5 | 0.0% |
| Central American | 1,294 | 9.1% |
| Central American Indian | 163 | 1.1% |
| Cherokee | 15 | 0.1% |
| Cuban | 112 | 0.8% |
| Czech | 1,607 | 11.3% |
| Czechoslovakian | 125 | 0.9% |
| Danish | 114 | 0.8% |
| Dutch | 194 | 1.4% |
| Eastern European | 3 | 0.0% |
| English | 983 | 6.9% |
| European | 157 | 1.1% |
| Finnish | 2 | 0.0% |
| French | 162 | 1.1% |
| French Canadian | 60 | 0.4% |
| German | 4,263 | 29.9% |
| Guatemalan | 713 | 5.0% |
| Haitian | 27 | 0.2% |
| Honduran | 73 | 0.5% |
| Hungarian | 22 | 0.2% |
| Indian (Asian) | 13 | 0.1% |
| Indonesian | 236 | 1.7% |
| Irish | 1,050 | 7.4% |
| Italian | 74 | 0.5% |
| Kenyan | 39 | 0.3% |
| Korean | 13 | 0.1% |
| Latvian | 9 | 0.1% |
| Lebanese | 3 | 0.0% |
| Luxembourger | 15 | 0.1% |
| Malaysian | 22 | 0.2% |
| Mexican | 2,197 | 15.4% |
| Native Hawaiian | 17 | 0.1% |
| Navajo | 23 | 0.2% |
| Northern European | 3 | 0.0% |
| Norwegian | 198 | 1.4% |
| Pennsylvania German | 1 | 0.0% |
| Peruvian | 4 | 0.0% |
| Polish | 157 | 1.1% |
| Portuguese | 9 | 0.1% |
| Puerto Rican | 59 | 0.4% |
| Russian | 60 | 0.4% |
| Salvadoran | 403 | 2.8% |
| Scotch-Irish | 51 | 0.4% |
| Scottish | 76 | 0.5% |
| Sioux | 17 | 0.1% |
| Slavic | 16 | 0.1% |
| South American | 4 | 0.0% |
| Sri Lankan | 54 | 0.4% |
| Subsaharan African | 63 | 0.4% |
| Swedish | 207 | 1.5% |
| Swiss | 163 | 1.1% |
| Thai | 8 | 0.1% |
| Welsh | 83 | 0.6% | View All 60 Rows |
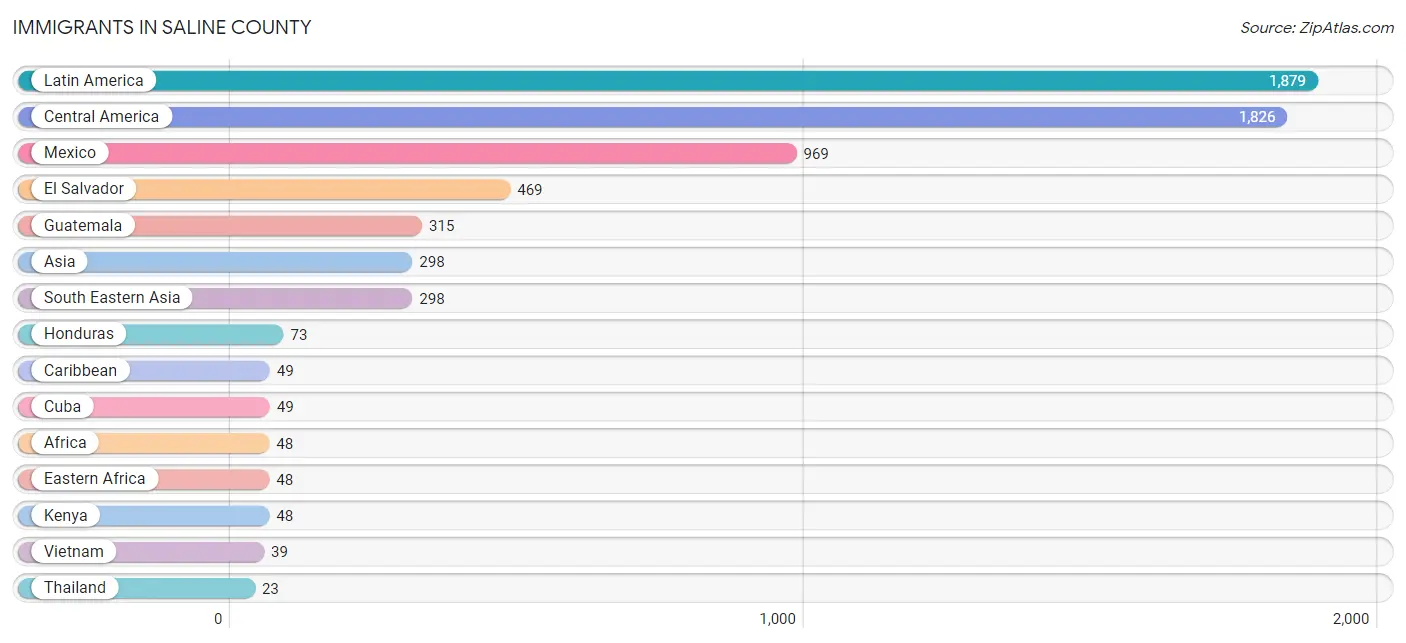
Immigrants in Saline County
The most numerous immigrant groups reported in Saline County came from Latin America (1,879 | 13.2%), Central America (1,826 | 12.8%), Mexico (969 | 6.8%), El Salvador (469 | 3.3%), and Guatemala (315 | 2.2%), together accounting for 38.2% of all Saline County residents.
| Immigration Origin | # Population | % Population |
| Africa | 48 | 0.3% |
| Asia | 298 | 2.1% |
| Caribbean | 49 | 0.3% |
| Central America | 1,826 | 12.8% |
| Cuba | 49 | 0.3% |
| Eastern Africa | 48 | 0.3% |
| El Salvador | 469 | 3.3% |
| Europe | 12 | 0.1% |
| Germany | 5 | 0.0% |
| Guatemala | 315 | 2.2% |
| Honduras | 73 | 0.5% |
| Ireland | 7 | 0.1% |
| Kenya | 48 | 0.3% |
| Laos | 14 | 0.1% |
| Latin America | 1,879 | 13.2% |
| Mexico | 969 | 6.8% |
| Northern Europe | 7 | 0.1% |
| Peru | 4 | 0.0% |
| Philippines | 18 | 0.1% |
| Singapore | 4 | 0.0% |
| South America | 4 | 0.0% |
| South Eastern Asia | 298 | 2.1% |
| Thailand | 23 | 0.2% |
| Vietnam | 39 | 0.3% |
| Western Europe | 5 | 0.0% | View All 25 Rows |
Sex and Age in Saline County
Sex and Age in Saline County
The most populous age groups in Saline County are 10 to 14 Years (742 | 10.2%) for men and 15 to 19 Years (601 | 8.6%) for women.
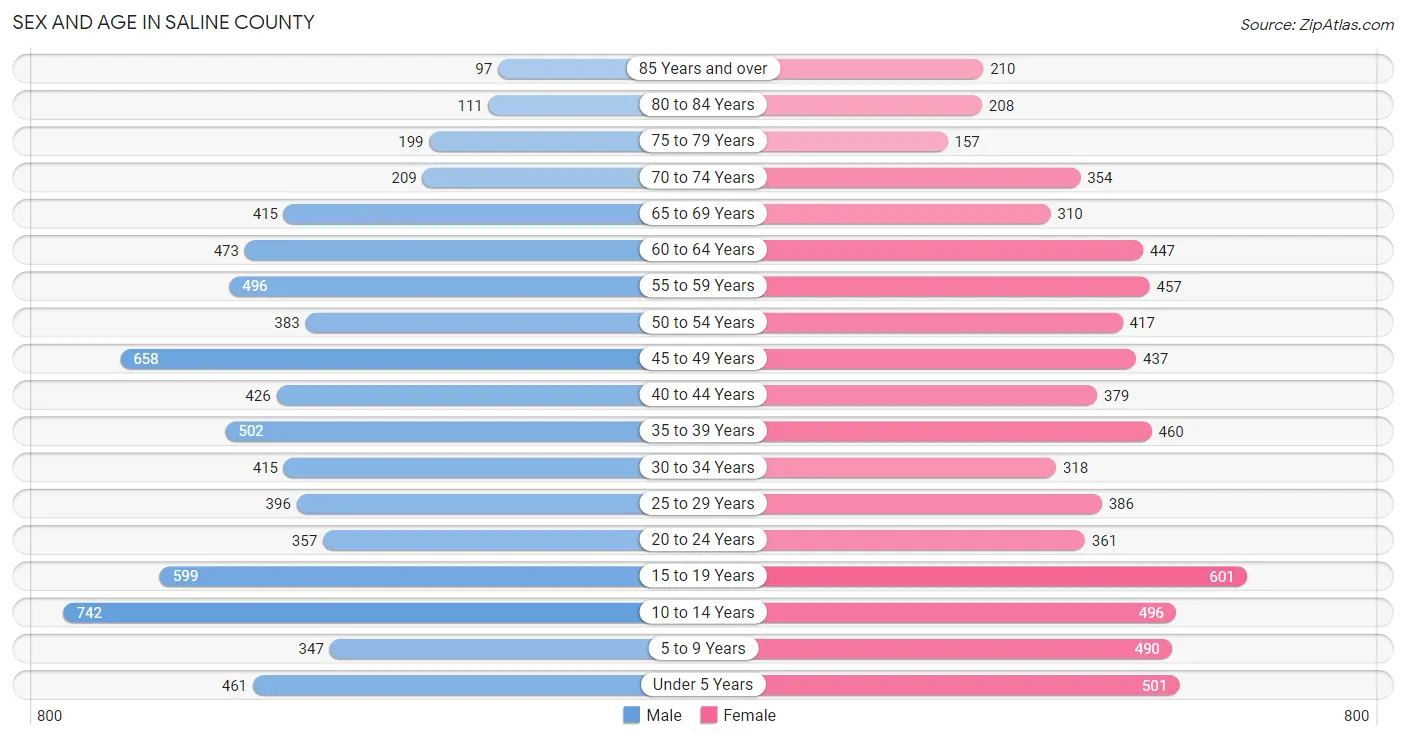
| Age Bracket | Male | Female |
| Under 5 Years | 461 (6.3%) | 501 (7.2%) |
| 5 to 9 Years | 347 (4.8%) | 490 (7.0%) |
| 10 to 14 Years | 742 (10.2%) | 496 (7.1%) |
| 15 to 19 Years | 599 (8.2%) | 601 (8.6%) |
| 20 to 24 Years | 357 (4.9%) | 361 (5.2%) |
| 25 to 29 Years | 396 (5.4%) | 386 (5.5%) |
| 30 to 34 Years | 415 (5.7%) | 318 (4.5%) |
| 35 to 39 Years | 502 (6.9%) | 460 (6.6%) |
| 40 to 44 Years | 426 (5.9%) | 379 (5.4%) |
| 45 to 49 Years | 658 (9.0%) | 437 (6.2%) |
| 50 to 54 Years | 383 (5.3%) | 417 (6.0%) |
| 55 to 59 Years | 496 (6.8%) | 457 (6.5%) |
| 60 to 64 Years | 473 (6.5%) | 447 (6.4%) |
| 65 to 69 Years | 415 (5.7%) | 310 (4.4%) |
| 70 to 74 Years | 209 (2.9%) | 354 (5.1%) |
| 75 to 79 Years | 199 (2.7%) | 157 (2.2%) |
| 80 to 84 Years | 111 (1.5%) | 208 (3.0%) |
| 85 Years and over | 97 (1.3%) | 210 (3.0%) |
| Total | 7,286 (100.0%) | 6,989 (100.0%) |
Families and Households in Saline County
Median Family Size in Saline County
The median family size in Saline County is 3.03 persons per family, with single male/father families (274 | 7.4%) accounting for the largest median family size of 3.45 persons per family. On the other hand, single female/mother families (471 | 12.7%) represent the smallest median family size with 2.95 persons per family.
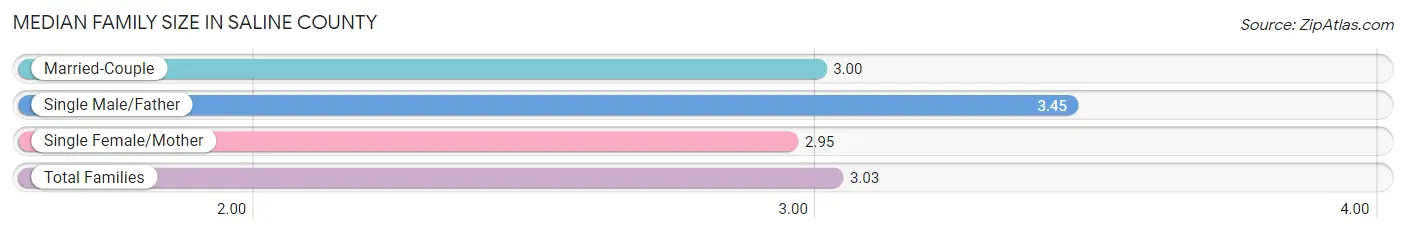
| Family Type | # Families | Family Size |
| Married-Couple | 2,959 (79.9%) | 3.00 |
| Single Male/Father | 274 (7.4%) | 3.45 |
| Single Female/Mother | 471 (12.7%) | 2.95 |
| Total Families | 3,704 (100.0%) | 3.03 |
Median Household Size in Saline County
The median household size in Saline County is 2.64 persons per household, with single male/father households (274 | 5.3%) accounting for the largest median household size of 4.45 persons per household. non-family households (1,433 | 27.9%) represent the smallest median household size with 1.21 persons per household.
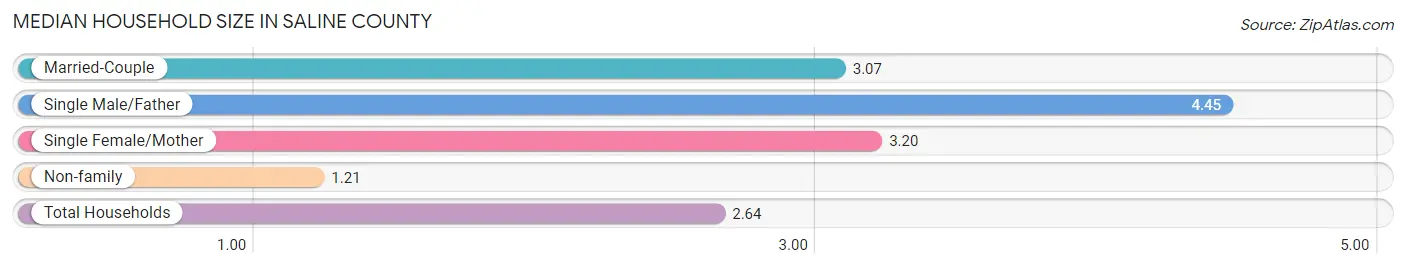
| Household Type | # Households | Household Size |
| Married-Couple | 2,959 (57.6%) | 3.07 |
| Single Male/Father | 274 (5.3%) | 4.45 |
| Single Female/Mother | 471 (9.2%) | 3.20 |
| Non-family | 1,433 (27.9%) | 1.21 |
| Total Households | 5,137 (100.0%) | 2.64 |
Household Size by Marriage Status in Saline County
Out of a total of 5,137 households in Saline County, 3,704 (72.1%) are family households, while 1,433 (27.9%) are nonfamily households. The most numerous type of family households are 2-person households, comprising 1,655, and the most common type of nonfamily households are 1-person households, comprising 1,172.
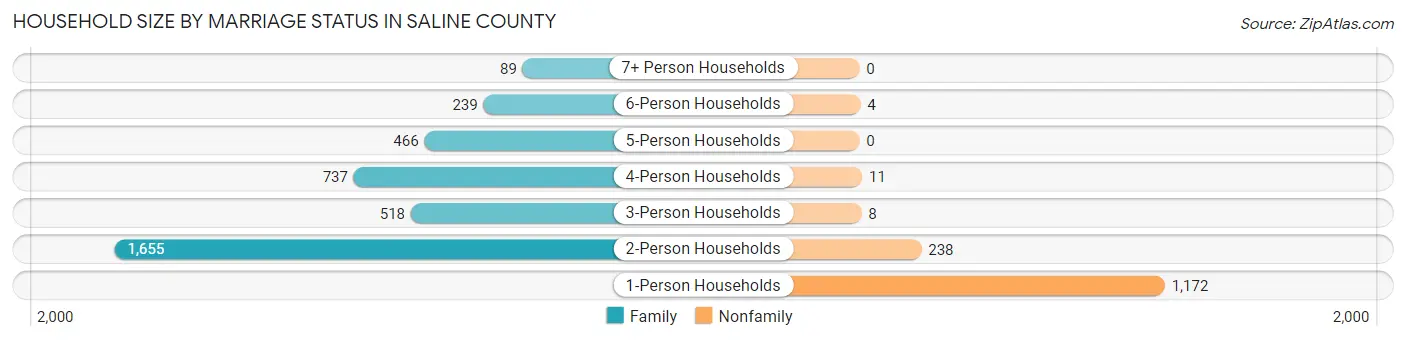
| Household Size | Family Households | Nonfamily Households |
| 1-Person Households | - | 1,172 (22.8%) |
| 2-Person Households | 1,655 (32.2%) | 238 (4.6%) |
| 3-Person Households | 518 (10.1%) | 8 (0.2%) |
| 4-Person Households | 737 (14.3%) | 11 (0.2%) |
| 5-Person Households | 466 (9.1%) | 0 (0.0%) |
| 6-Person Households | 239 (4.6%) | 4 (0.1%) |
| 7+ Person Households | 89 (1.7%) | 0 (0.0%) |
| Total | 3,704 (72.1%) | 1,433 (27.9%) |
Female Fertility in Saline County
Fertility by Age in Saline County
Average fertility rate in Saline County is 63.0 births per 1,000 women. Women in the age bracket of 20 to 34 years have the highest fertility rate with 162.0 births per 1,000 women. Women in the age bracket of 20 to 34 years acount for 89.6% of all women with births.
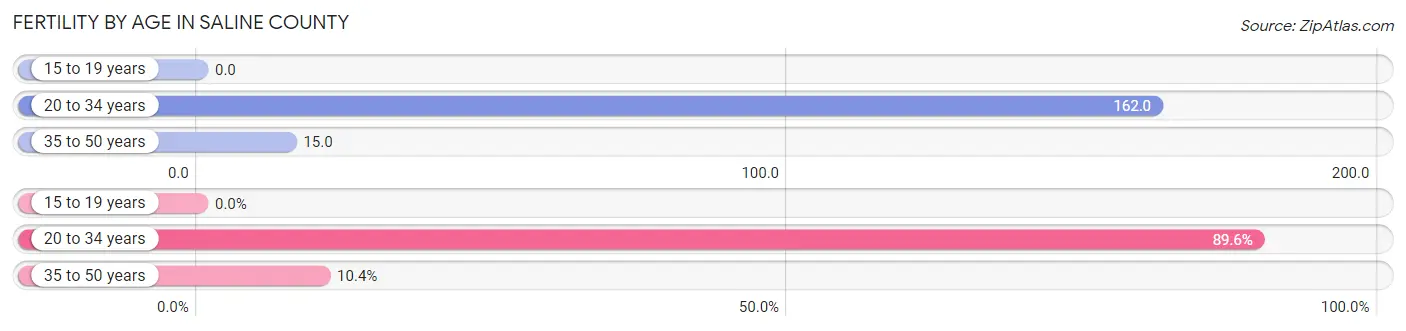
| Age Bracket | Women with Births | Births / 1,000 Women |
| 15 to 19 years | 0 (0.0%) | 0.0 |
| 20 to 34 years | 173 (89.6%) | 162.0 |
| 35 to 50 years | 20 (10.4%) | 15.0 |
| Total | 193 (100.0%) | 63.0 |
Fertility by Age by Marriage Status in Saline County
77.7% of women with births (193) in Saline County are married. The highest percentage of unmarried women with births falls into 20 to 34 years age bracket with 23.7% of them unmarried at the time of birth, while the lowest percentage of unmarried women with births belong to 35 to 50 years age bracket with 10.0% of them unmarried.
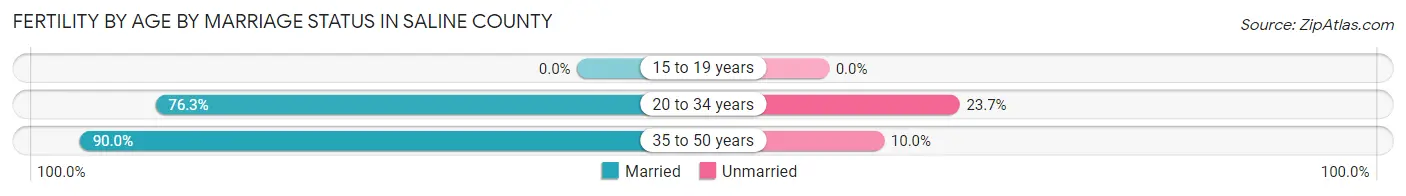
| Age Bracket | Married | Unmarried |
| 15 to 19 years | 0 (0.0%) | 0 (0.0%) |
| 20 to 34 years | 132 (76.3%) | 41 (23.7%) |
| 35 to 50 years | 18 (90.0%) | 2 (10.0%) |
| Total | 150 (77.7%) | 43 (22.3%) |
Fertility by Education in Saline County
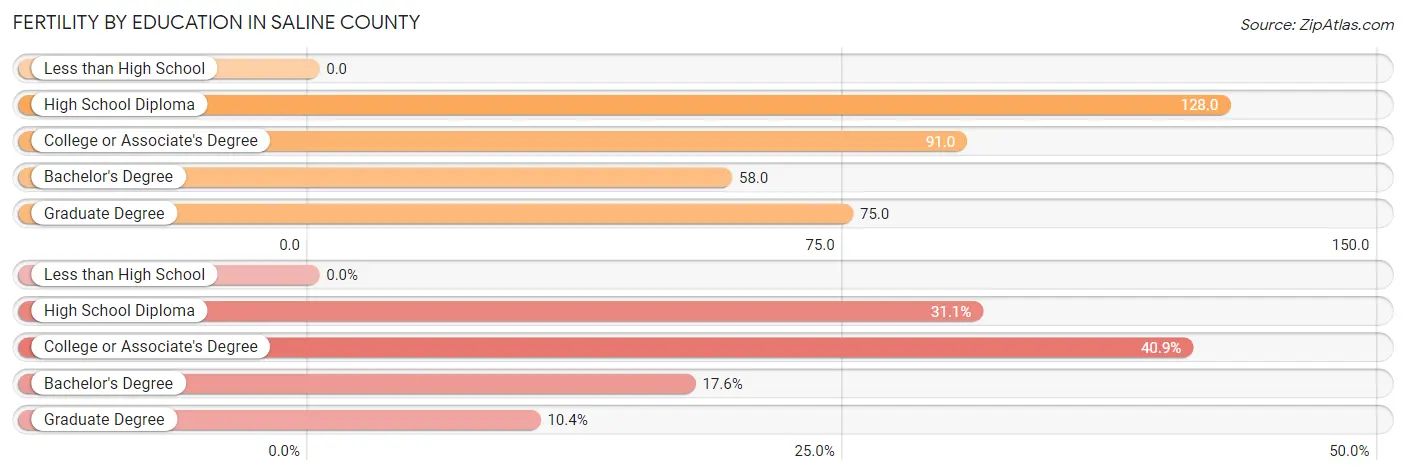
| Educational Attainment | Women with Births | Births / 1,000 Women |
| Less than High School | 0 (0.0%) | 0.0 |
| High School Diploma | 60 (31.1%) | 128.0 |
| College or Associate's Degree | 79 (40.9%) | 91.0 |
| Bachelor's Degree | 34 (17.6%) | 58.0 |
| Graduate Degree | 20 (10.4%) | 75.0 |
| Total | 193 (100.0%) | 63.0 |
Fertility by Education by Marriage Status in Saline County
22.3% of women with births in Saline County are unmarried. Women with the educational attainment of bachelor's degree are most likely to be married with 100.0% of them married at childbirth, while women with the educational attainment of college or associate's degree are least likely to be married with 51.9% of them unmarried at childbirth.
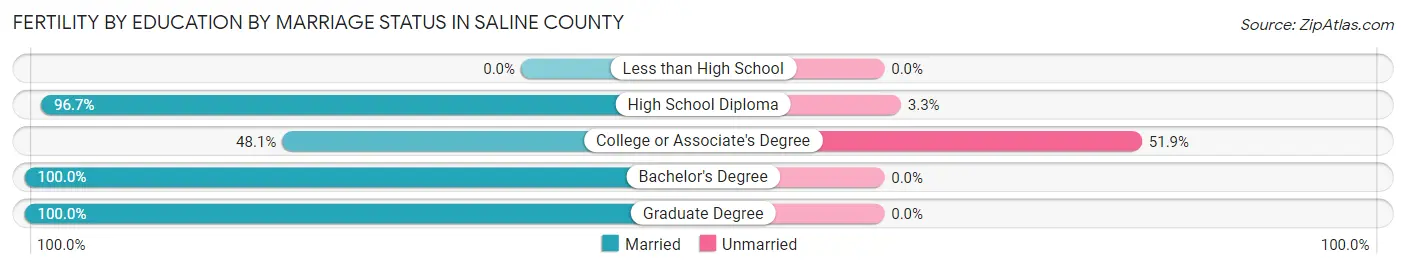
| Educational Attainment | Married | Unmarried |
| Less than High School | 0 (0.0%) | 0 (0.0%) |
| High School Diploma | 58 (96.7%) | 2 (3.3%) |
| College or Associate's Degree | 38 (48.1%) | 41 (51.9%) |
| Bachelor's Degree | 34 (100.0%) | 0 (0.0%) |
| Graduate Degree | 20 (100.0%) | 0 (0.0%) |
| Total | 150 (77.7%) | 43 (22.3%) |
Income in Saline County
Income Overview in Saline County
Per Capita Income in Saline County is $32,563, while median incomes of families and households are $83,048 and $71,104 respectively.
| Characteristic | Number | Measure |
| Per Capita Income | 14,275 | $32,563 |
| Median Family Income | 3,704 | $83,048 |
| Mean Family Income | 3,704 | $99,416 |
| Median Household Income | 5,137 | $71,104 |
| Mean Household Income | 5,137 | $87,415 |
| Income Deficit | 3,704 | $8,532 |
| Wage / Income Gap (%) | 14,275 | 31.69% |
| Wage / Income Gap ($) | 14,275 | 68.31¢ per $1 |
| Gini / Inequality Index | 14,275 | 0.41 |
Earnings by Sex in Saline County
Average Earnings in Saline County are $39,292, $46,007 for men and $31,428 for women, a difference of 31.7%.
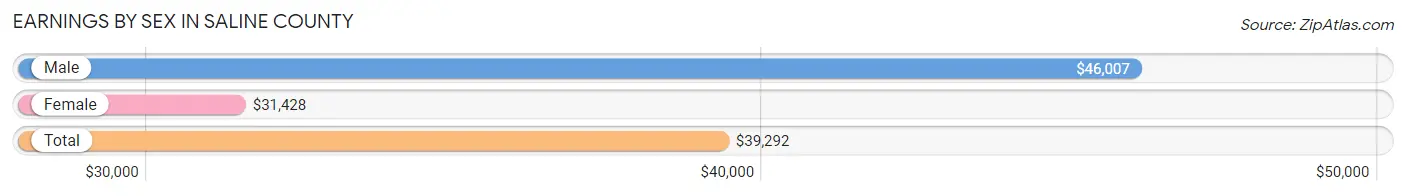
| Sex | Number | Average Earnings |
| Male | 4,407 (55.0%) | $46,007 |
| Female | 3,605 (45.0%) | $31,428 |
| Total | 8,012 (100.0%) | $39,292 |
Earnings by Sex by Income Bracket in Saline County
The most common earnings brackets in Saline County are $55,000 to $64,999 for men (493 | 11.2%) and $30,000 to $34,999 for women (331 | 9.2%).
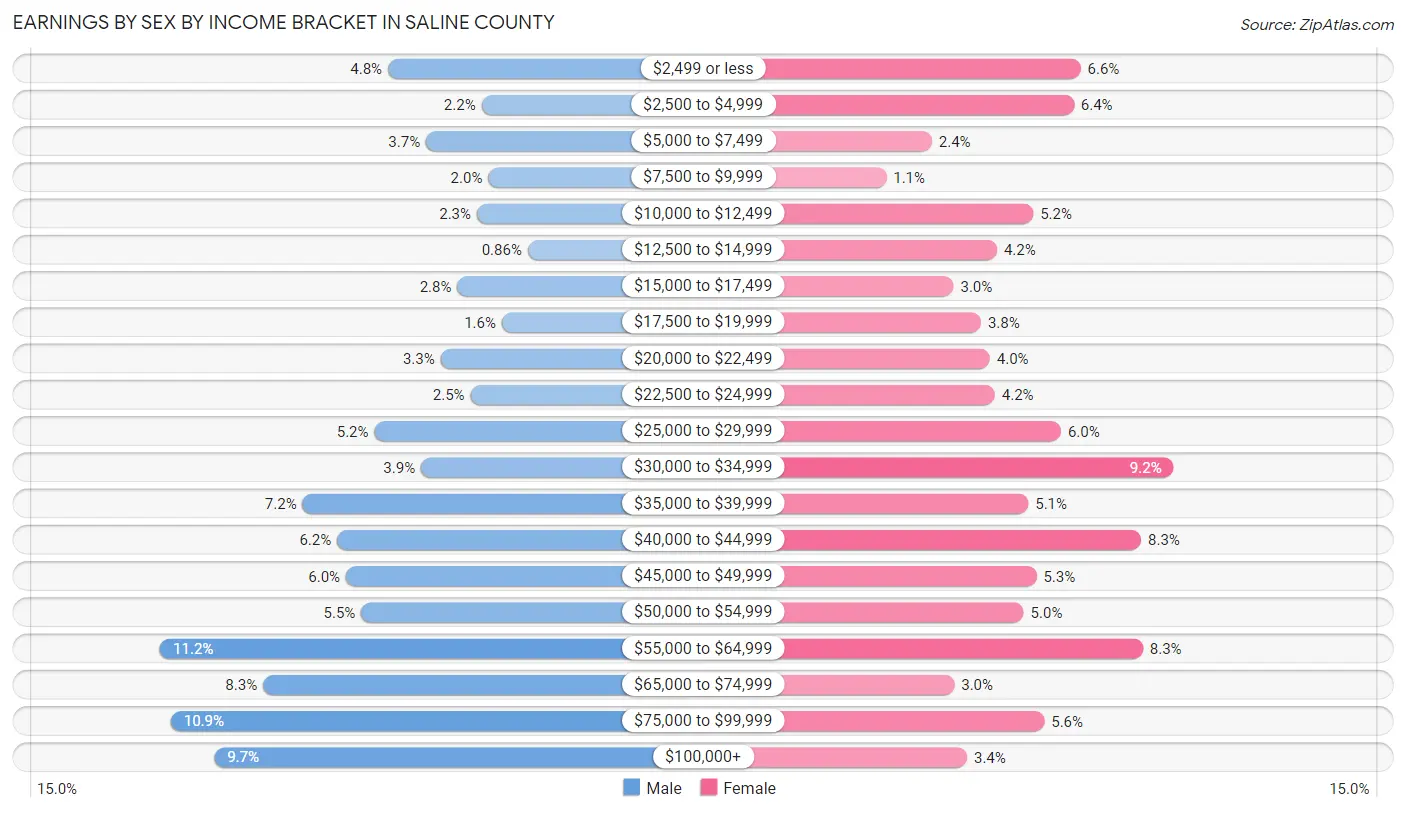
| Income | Male | Female |
| $2,499 or less | 211 (4.8%) | 237 (6.6%) |
| $2,500 to $4,999 | 95 (2.2%) | 230 (6.4%) |
| $5,000 to $7,499 | 164 (3.7%) | 86 (2.4%) |
| $7,500 to $9,999 | 87 (2.0%) | 40 (1.1%) |
| $10,000 to $12,499 | 101 (2.3%) | 189 (5.2%) |
| $12,500 to $14,999 | 38 (0.9%) | 152 (4.2%) |
| $15,000 to $17,499 | 125 (2.8%) | 108 (3.0%) |
| $17,500 to $19,999 | 70 (1.6%) | 136 (3.8%) |
| $20,000 to $22,499 | 146 (3.3%) | 145 (4.0%) |
| $22,500 to $24,999 | 109 (2.5%) | 150 (4.2%) |
| $25,000 to $29,999 | 228 (5.2%) | 217 (6.0%) |
| $30,000 to $34,999 | 170 (3.9%) | 331 (9.2%) |
| $35,000 to $39,999 | 317 (7.2%) | 184 (5.1%) |
| $40,000 to $44,999 | 274 (6.2%) | 298 (8.3%) |
| $45,000 to $49,999 | 263 (6.0%) | 192 (5.3%) |
| $50,000 to $54,999 | 244 (5.5%) | 179 (5.0%) |
| $55,000 to $64,999 | 493 (11.2%) | 300 (8.3%) |
| $65,000 to $74,999 | 366 (8.3%) | 109 (3.0%) |
| $75,000 to $99,999 | 480 (10.9%) | 200 (5.6%) |
| $100,000+ | 426 (9.7%) | 122 (3.4%) |
| Total | 4,407 (100.0%) | 3,605 (100.0%) |
Earnings by Sex by Educational Attainment in Saline County
Average earnings in Saline County are $51,718 for men and $36,193 for women, a difference of 30.0%. Men with an educational attainment of graduate degree enjoy the highest average annual earnings of $71,719, while those with less than high school education earn the least with $46,233. Women with an educational attainment of graduate degree earn the most with the average annual earnings of $59,018, while those with high school diploma education have the smallest earnings of $26,650.
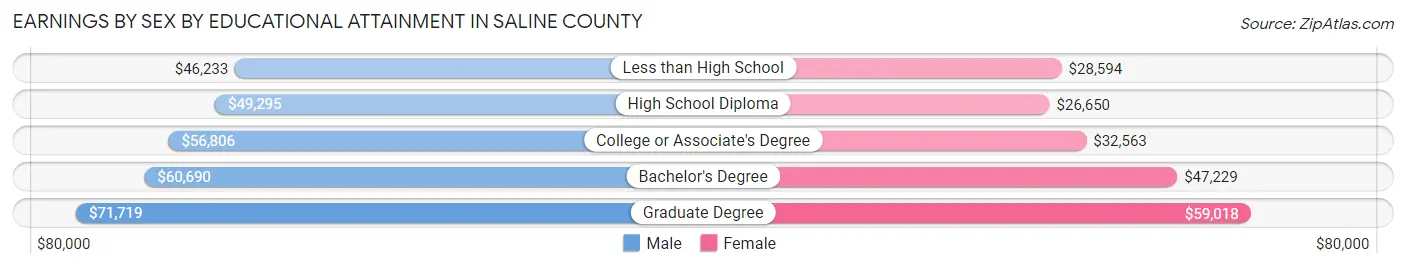
| Educational Attainment | Male Income | Female Income |
| Less than High School | $46,233 | $28,594 |
| High School Diploma | $49,295 | $26,650 |
| College or Associate's Degree | $56,806 | $32,563 |
| Bachelor's Degree | $60,690 | $47,229 |
| Graduate Degree | $71,719 | $59,018 |
| Total | $51,718 | $36,193 |
Family Income in Saline County
Family Income Brackets in Saline County
According to the Saline County family income data, there are 867 families falling into the $100,000 to $149,999 income range, which is the most common income bracket and makes up 23.4% of all families. Conversely, the $10,000 to $14,999 income bracket is the least frequent group with only 30 families (0.8%) belonging to this category.
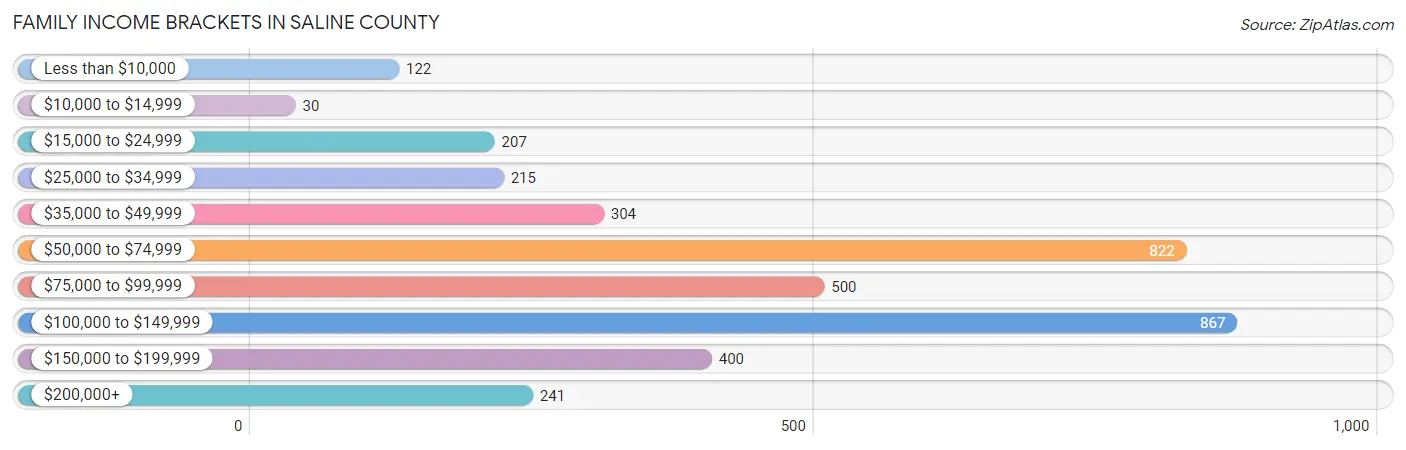
| Income Bracket | # Families | % Families |
| Less than $10,000 | 122 | 3.3% |
| $10,000 to $14,999 | 30 | 0.8% |
| $15,000 to $24,999 | 207 | 5.6% |
| $25,000 to $34,999 | 215 | 5.8% |
| $35,000 to $49,999 | 304 | 8.2% |
| $50,000 to $74,999 | 822 | 22.2% |
| $75,000 to $99,999 | 500 | 13.5% |
| $100,000 to $149,999 | 867 | 23.4% |
| $150,000 to $199,999 | 400 | 10.8% |
| $200,000+ | 241 | 6.5% |
Family Income by Famaliy Size in Saline County
7+ person families (86 | 2.3%) account for the highest median family income in Saline County with $192,663 per family, while 2-person families (1,749 | 47.2%) have the highest median income of $36,214 per family member.
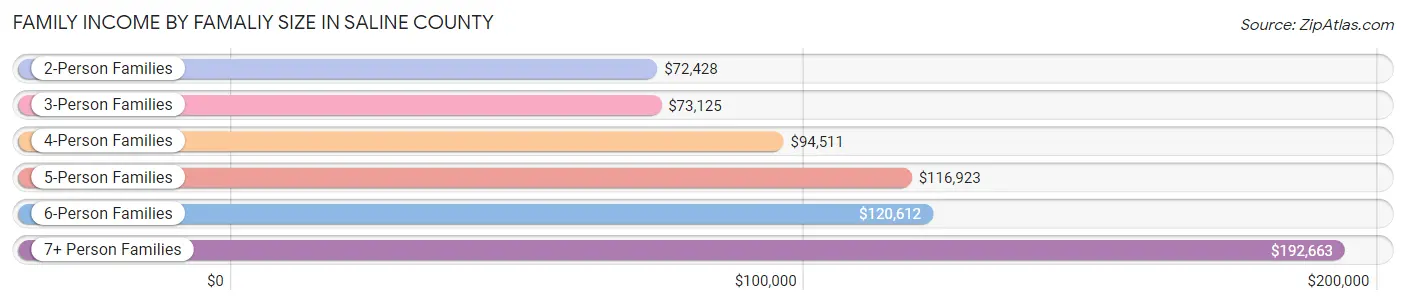
| Income Bracket | # Families | Median Income |
| 2-Person Families | 1,749 (47.2%) | $72,428 |
| 3-Person Families | 631 (17.0%) | $73,125 |
| 4-Person Families | 639 (17.2%) | $94,511 |
| 5-Person Families | 362 (9.8%) | $116,923 |
| 6-Person Families | 237 (6.4%) | $120,612 |
| 7+ Person Families | 86 (2.3%) | $192,663 |
| Total | 3,704 (100.0%) | $83,048 |
Family Income by Number of Earners in Saline County
The median family income in Saline County is $83,048, with families comprising 3+ earners (496) having the highest median family income of $138,000, while families with 1 earner (951) have the lowest median family income of $45,724, accounting for 13.4% and 25.7% of families, respectively.
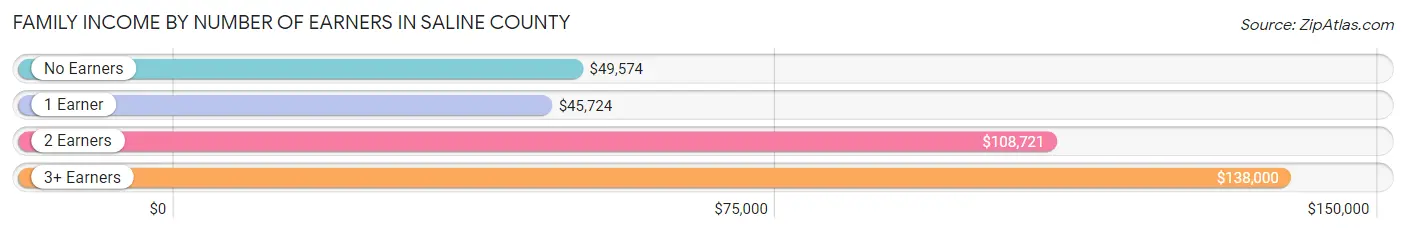
| Number of Earners | # Families | Median Income |
| No Earners | 525 (14.2%) | $49,574 |
| 1 Earner | 951 (25.7%) | $45,724 |
| 2 Earners | 1,732 (46.8%) | $108,721 |
| 3+ Earners | 496 (13.4%) | $138,000 |
| Total | 3,704 (100.0%) | $83,048 |
Household Income in Saline County
Household Income Brackets in Saline County
With 1,058 households falling in the category, the $50,000 to $74,999 income range is the most frequent in Saline County, accounting for 20.6% of all households. In contrast, only 103 households (2.0%) fall into the $10,000 to $14,999 income bracket, making it the least populous group.
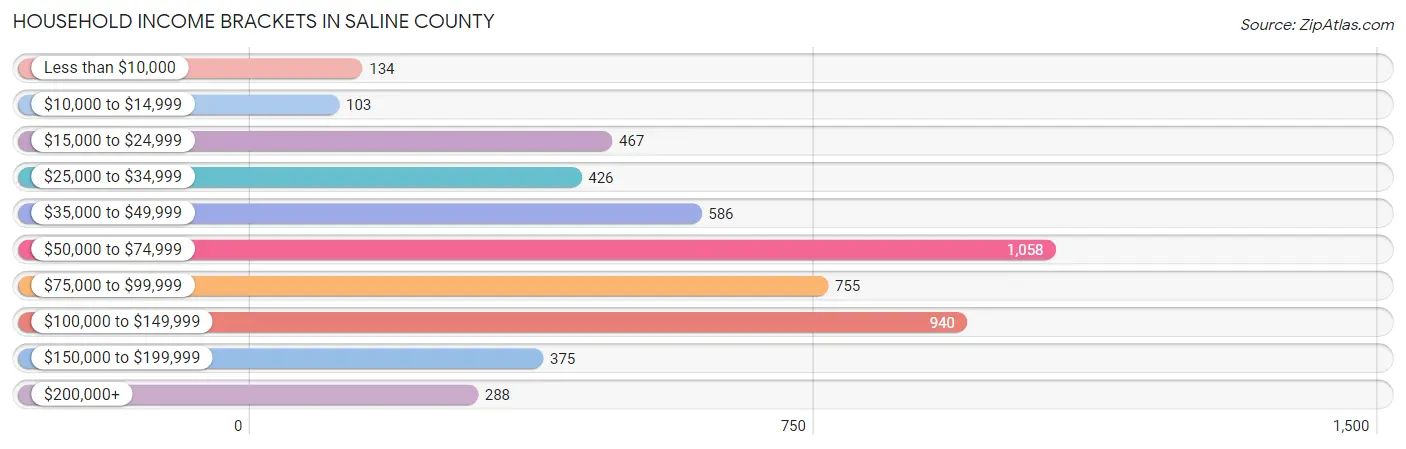
| Income Bracket | # Households | % Households |
| Less than $10,000 | 134 | 2.6% |
| $10,000 to $14,999 | 103 | 2.0% |
| $15,000 to $24,999 | 467 | 9.1% |
| $25,000 to $34,999 | 426 | 8.3% |
| $35,000 to $49,999 | 586 | 11.4% |
| $50,000 to $74,999 | 1,058 | 20.6% |
| $75,000 to $99,999 | 755 | 14.7% |
| $100,000 to $149,999 | 940 | 18.3% |
| $150,000 to $199,999 | 375 | 7.3% |
| $200,000+ | 288 | 5.6% |
Household Income by Householder Age in Saline County
The median household income in Saline County is $71,104, with the highest median household income of $90,234 found in the 25 to 44 years age bracket for the primary householder. A total of 1,563 households (30.4%) fall into this category. Meanwhile, the 15 to 24 years age bracket for the primary householder has the lowest median household income of $0, with 92 households (1.8%) in this group.
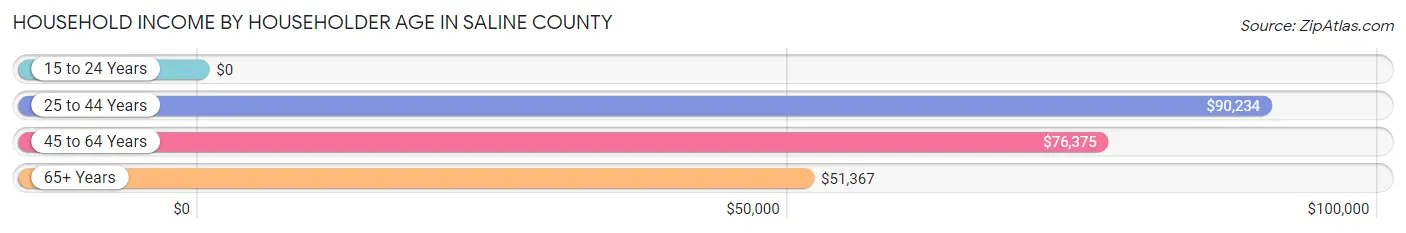
| Income Bracket | # Households | Median Income |
| 15 to 24 Years | 92 (1.8%) | $0 |
| 25 to 44 Years | 1,563 (30.4%) | $90,234 |
| 45 to 64 Years | 2,057 (40.0%) | $76,375 |
| 65+ Years | 1,425 (27.7%) | $51,367 |
| Total | 5,137 (100.0%) | $71,104 |
Poverty in Saline County
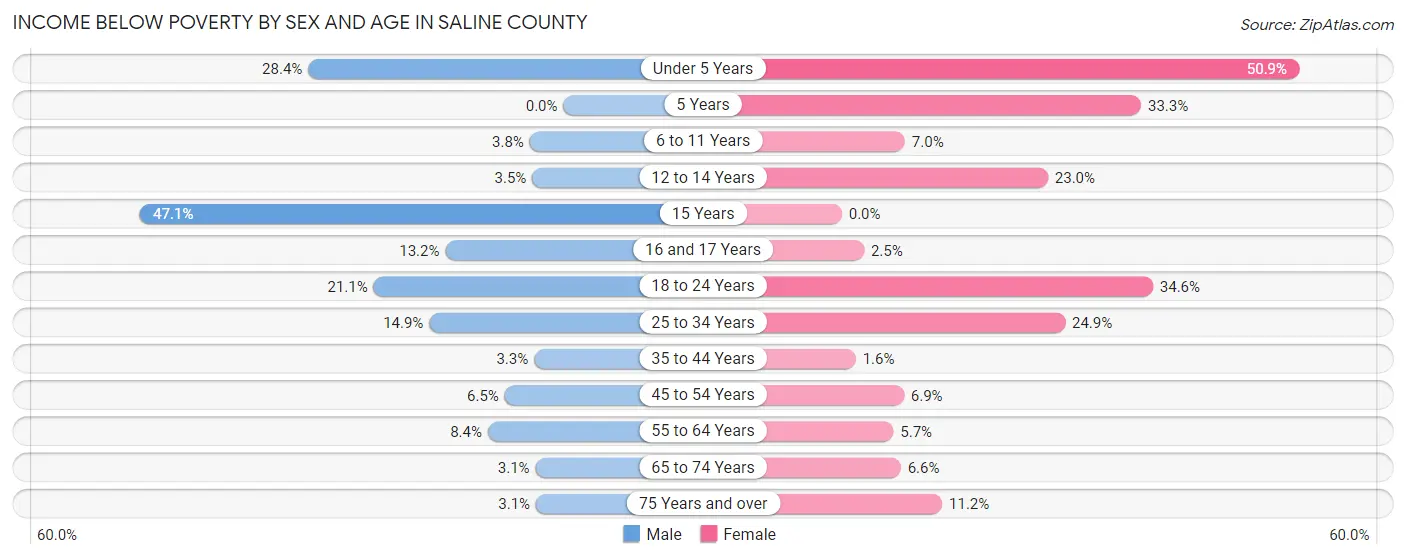
Income Below Poverty by Sex and Age in Saline County
With 9.2% poverty level for males and 13.6% for females among the residents of Saline County, 15 year old males and under 5 year old females are the most vulnerable to poverty, with 33 males (47.1%) and 255 females (50.9%) in their respective age groups living below the poverty level.
| Age Bracket | Male | Female |
| Under 5 Years | 131 (28.4%) | 255 (50.9%) |
| 5 Years | 0 (0.0%) | 10 (33.3%) |
| 6 to 11 Years | 22 (3.7%) | 47 (7.0%) |
| 12 to 14 Years | 16 (3.5%) | 42 (23.0%) |
| 15 Years | 33 (47.1%) | 0 (0.0%) |
| 16 and 17 Years | 28 (13.2%) | 4 (2.5%) |
| 18 to 24 Years | 78 (21.1%) | 133 (34.6%) |
| 25 to 34 Years | 118 (14.9%) | 175 (24.9%) |
| 35 to 44 Years | 30 (3.3%) | 13 (1.5%) |
| 45 to 54 Years | 68 (6.5%) | 59 (6.9%) |
| 55 to 64 Years | 80 (8.4%) | 50 (5.7%) |
| 65 to 74 Years | 19 (3.1%) | 41 (6.6%) |
| 75 Years and over | 12 (3.0%) | 60 (11.2%) |
| Total | 635 (9.2%) | 889 (13.6%) |
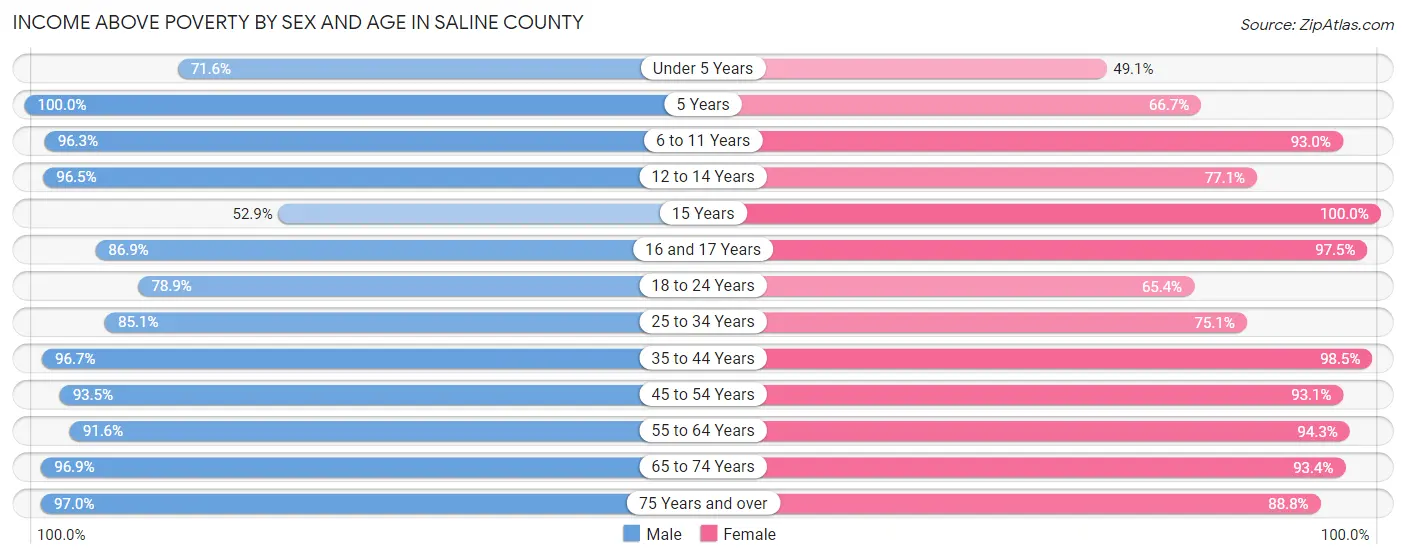
Income Above Poverty by Sex and Age in Saline County
According to the poverty statistics in Saline County, males aged 5 years and females aged 15 years are the age groups that are most secure financially, with 100.0% of males and 100.0% of females in these age groups living above the poverty line.
| Age Bracket | Male | Female |
| Under 5 Years | 330 (71.6%) | 246 (49.1%) |
| 5 Years | 33 (100.0%) | 20 (66.7%) |
| 6 to 11 Years | 564 (96.3%) | 622 (93.0%) |
| 12 to 14 Years | 445 (96.5%) | 141 (77.0%) |
| 15 Years | 37 (52.9%) | 202 (100.0%) |
| 16 and 17 Years | 185 (86.9%) | 158 (97.5%) |
| 18 to 24 Years | 291 (78.9%) | 251 (65.4%) |
| 25 to 34 Years | 672 (85.1%) | 529 (75.1%) |
| 35 to 44 Years | 890 (96.7%) | 826 (98.5%) |
| 45 to 54 Years | 973 (93.5%) | 795 (93.1%) |
| 55 to 64 Years | 871 (91.6%) | 821 (94.3%) |
| 65 to 74 Years | 591 (96.9%) | 584 (93.4%) |
| 75 Years and over | 382 (97.0%) | 477 (88.8%) |
| Total | 6,264 (90.8%) | 5,672 (86.5%) |
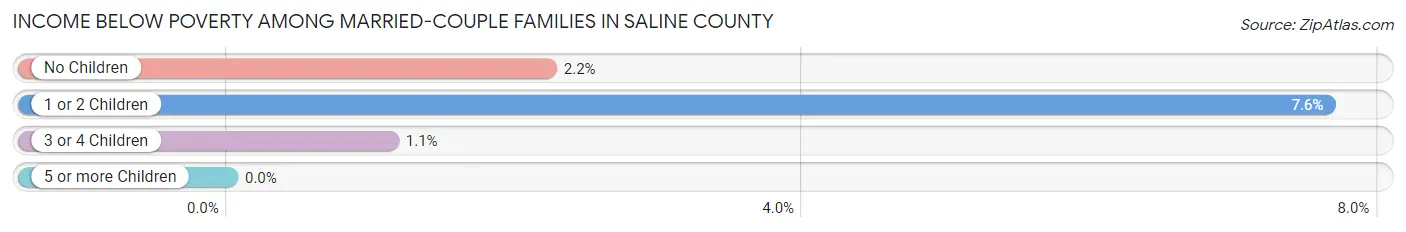
Income Below Poverty Among Married-Couple Families in Saline County
The poverty statistics for married-couple families in Saline County show that 3.8% or 114 of the total 2,959 families live below the poverty line. Families with 1 or 2 children have the highest poverty rate of 7.6%, comprising of 75 families. On the other hand, families with 5 or more children have the lowest poverty rate of 0.0%, which includes 0 families.
| Children | Above Poverty | Below Poverty |
| No Children | 1,497 (97.8%) | 34 (2.2%) |
| 1 or 2 Children | 907 (92.4%) | 75 (7.6%) |
| 3 or 4 Children | 440 (98.9%) | 5 (1.1%) |
| 5 or more Children | 1 (100.0%) | 0 (0.0%) |
| Total | 2,845 (96.2%) | 114 (3.8%) |
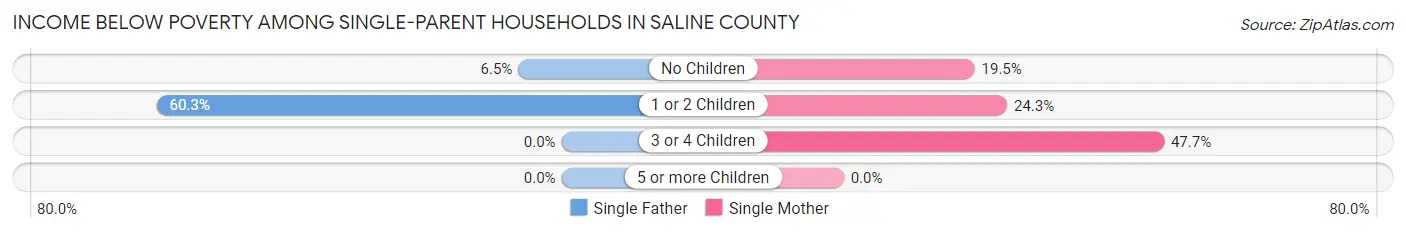
Income Below Poverty Among Single-Parent Households in Saline County
According to the poverty data in Saline County, 39.1% or 107 single-father households and 25.3% or 119 single-mother households are living below the poverty line. Among single-father households, those with 1 or 2 children have the highest poverty rate, with 105 households (60.3%) experiencing poverty. Likewise, among single-mother households, those with 3 or 4 children have the highest poverty rate, with 21 households (47.7%) falling below the poverty line.
| Children | Single Father | Single Mother |
| No Children | 2 (6.5%) | 24 (19.5%) |
| 1 or 2 Children | 105 (60.3%) | 74 (24.3%) |
| 3 or 4 Children | 0 (0.0%) | 21 (47.7%) |
| 5 or more Children | 0 (0.0%) | 0 (0.0%) |
| Total | 107 (39.1%) | 119 (25.3%) |
Income Below Poverty Among Married-Couple vs Single-Parent Households in Saline County
The poverty data for Saline County shows that 114 of the married-couple family households (3.8%) and 226 of the single-parent households (30.3%) are living below the poverty level. Within the married-couple family households, those with 1 or 2 children have the highest poverty rate, with 75 households (7.6%) falling below the poverty line. Among the single-parent households, those with 1 or 2 children have the highest poverty rate, with 179 household (37.4%) living below poverty.
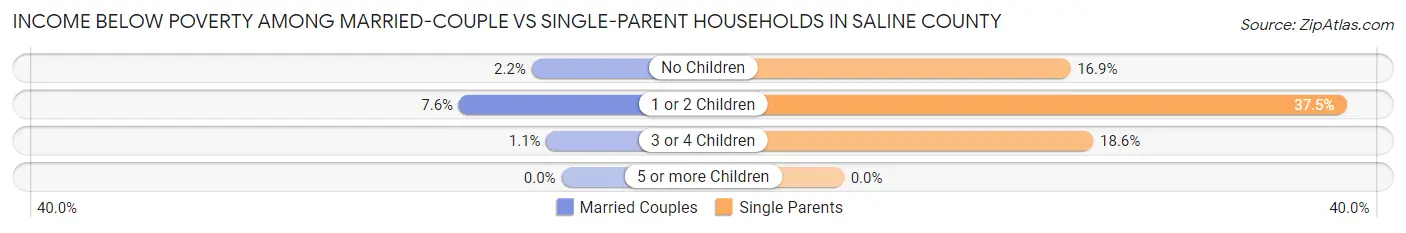
| Children | Married-Couple Families | Single-Parent Households |
| No Children | 34 (2.2%) | 26 (16.9%) |
| 1 or 2 Children | 75 (7.6%) | 179 (37.4%) |
| 3 or 4 Children | 5 (1.1%) | 21 (18.6%) |
| 5 or more Children | 0 (0.0%) | 0 (0.0%) |
| Total | 114 (3.8%) | 226 (30.3%) |
Employment Characteristics in Saline County
Employment by Class of Employer in Saline County
Among the 6,999 employed individuals in Saline County, private company employees (4,118 | 58.8%), not-for-profit organizations (925 | 13.2%), and local government employees (737 | 10.5%) make up the most common classes of employment.
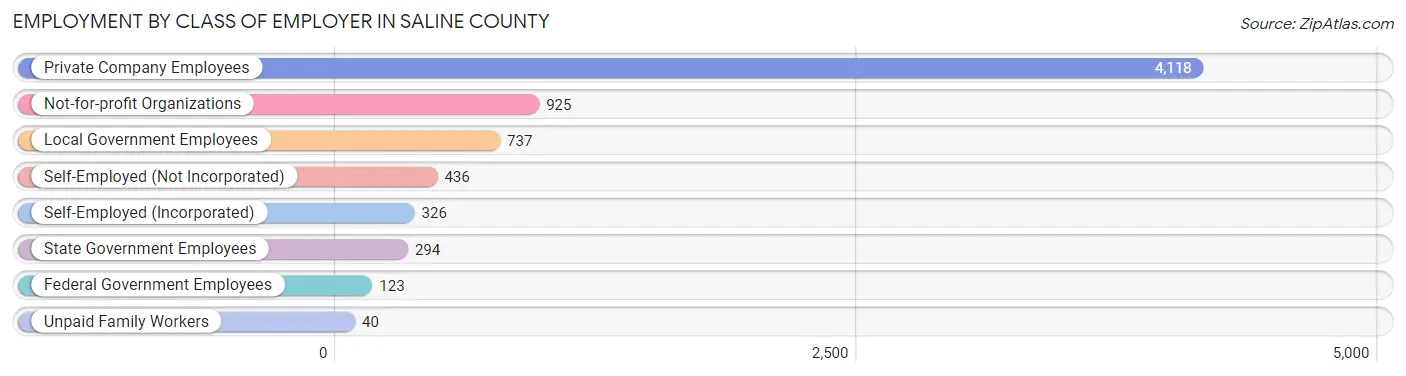
| Employer Class | # Employees | % Employees |
| Private Company Employees | 4,118 | 58.8% |
| Self-Employed (Incorporated) | 326 | 4.7% |
| Self-Employed (Not Incorporated) | 436 | 6.2% |
| Not-for-profit Organizations | 925 | 13.2% |
| Local Government Employees | 737 | 10.5% |
| State Government Employees | 294 | 4.2% |
| Federal Government Employees | 123 | 1.8% |
| Unpaid Family Workers | 40 | 0.6% |
| Total | 6,999 | 100.0% |
Employment Status by Age in Saline County
According to the labor force statistics for Saline County, out of the total population over 16 years of age (10,966), 67.2% or 7,369 individuals are in the labor force, with 2.1% or 155 of them unemployed. The age group with the highest labor force participation rate is 35 to 44 years, with 95.2% or 1,682 individuals in the labor force. Within the labor force, the 16 to 19 years age range has the highest percentage of unemployed individuals, with 11.4% or 41 of them being unemployed.
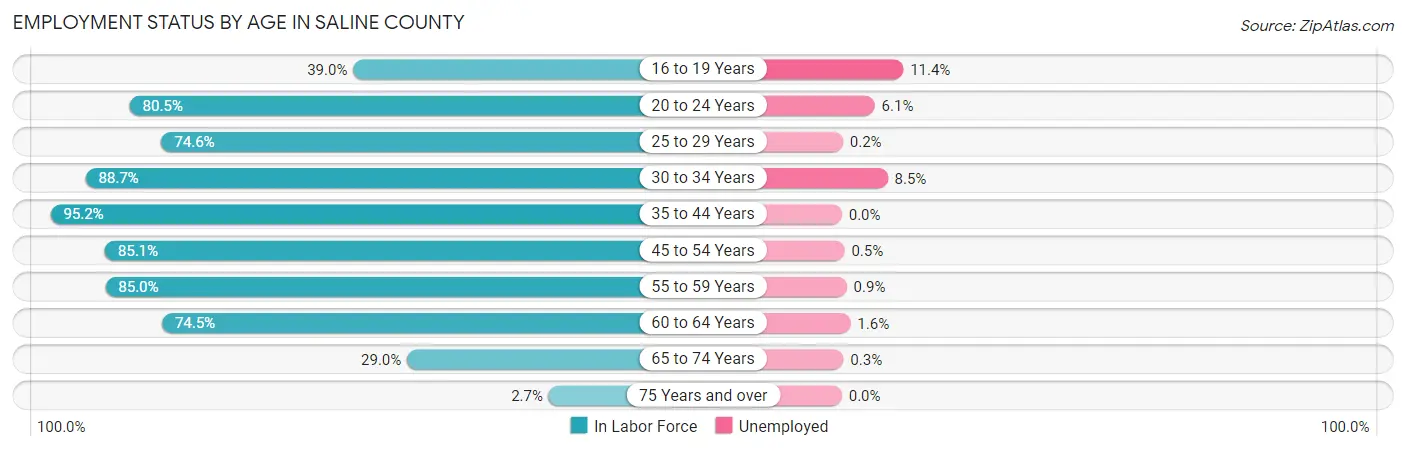
| Age Bracket | In Labor Force | Unemployed |
| 16 to 19 Years | 362 (39.0%) | 41 (11.4%) |
| 20 to 24 Years | 578 (80.5%) | 35 (6.1%) |
| 25 to 29 Years | 583 (74.6%) | 1 (0.2%) |
| 30 to 34 Years | 650 (88.7%) | 55 (8.5%) |
| 35 to 44 Years | 1,682 (95.2%) | 0 (0.0%) |
| 45 to 54 Years | 1,613 (85.1%) | 8 (0.5%) |
| 55 to 59 Years | 810 (85.0%) | 7 (0.9%) |
| 60 to 64 Years | 685 (74.5%) | 11 (1.6%) |
| 65 to 74 Years | 374 (29.0%) | 1 (0.3%) |
| 75 Years and over | 27 (2.7%) | 0 (0.0%) |
| Total | 7,369 (67.2%) | 155 (2.1%) |
Employment Status by Educational Attainment in Saline County
According to labor force statistics for Saline County, 85.4% of individuals (6,021) out of the total population between 25 and 64 years of age (7,050) are in the labor force, with 1.4% or 84 of them being unemployed. The group with the highest labor force participation rate are those with the educational attainment of bachelor's degree or higher, with 94.2% or 1,548 individuals in the labor force. Within the labor force, individuals with high school diploma education have the highest percentage of unemployment, with 3.0% or 43 of them being unemployed.
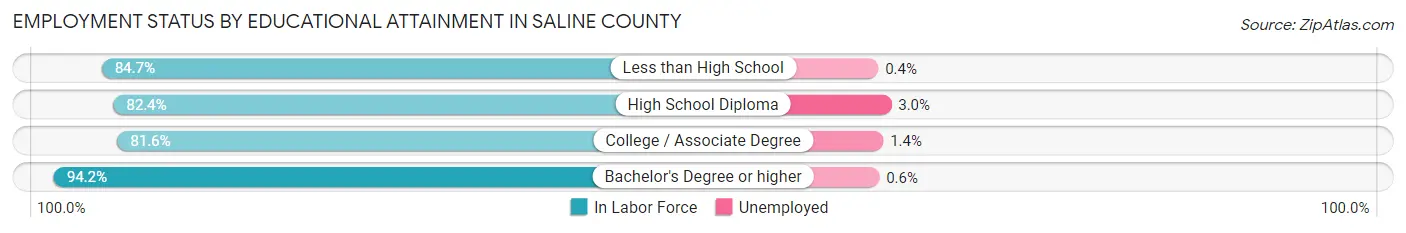
| Educational Attainment | In Labor Force | Unemployed |
| Less than High School | 1,359 (84.7%) | 6 (0.4%) |
| High School Diploma | 1,445 (82.4%) | 53 (3.0%) |
| College / Associate Degree | 1,672 (81.6%) | 29 (1.4%) |
| Bachelor's Degree or higher | 1,548 (94.2%) | 10 (0.6%) |
| Total | 6,021 (85.4%) | 99 (1.4%) |
Employment Occupations by Sex in Saline County
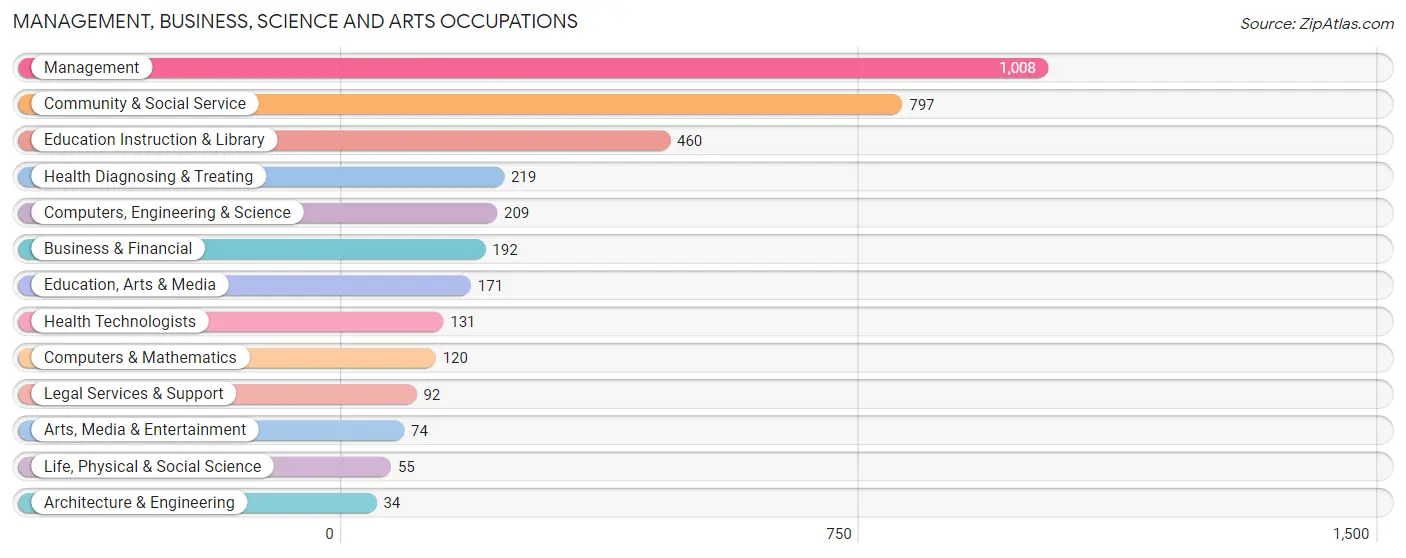
Management, Business, Science and Arts Occupations
The most common Management, Business, Science and Arts occupations in Saline County are Management (1,008 | 14.0%), Community & Social Service (797 | 11.1%), Education Instruction & Library (460 | 6.4%), Health Diagnosing & Treating (219 | 3.0%), and Computers, Engineering & Science (209 | 2.9%).
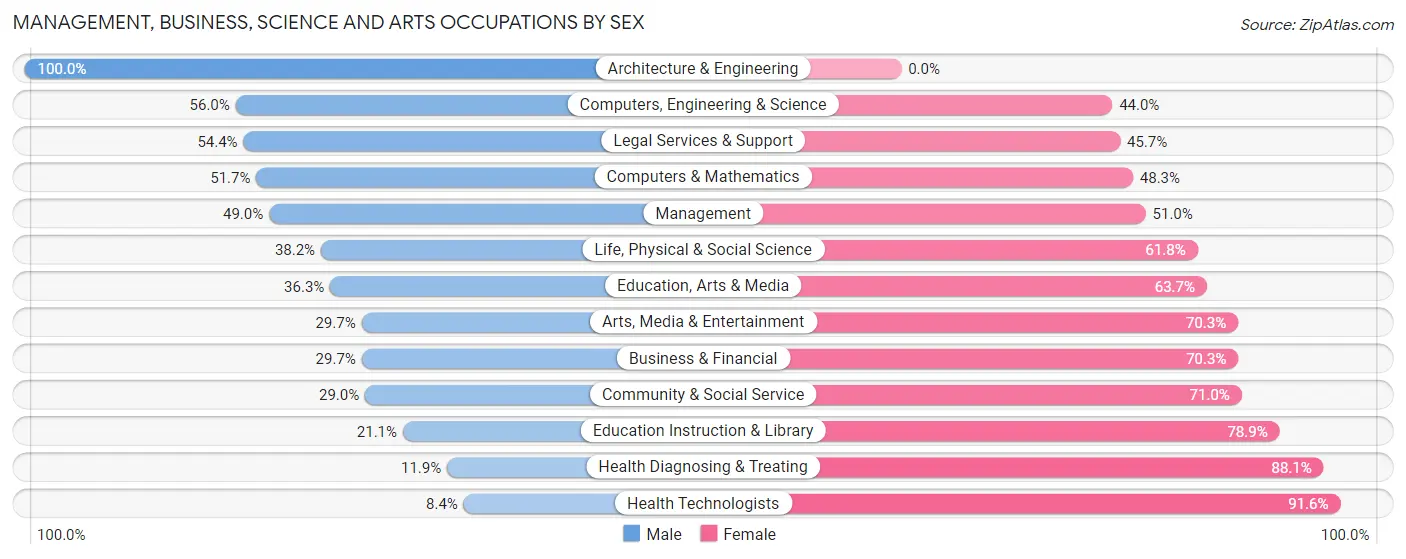
Management, Business, Science and Arts Occupations by Sex
Within the Management, Business, Science and Arts occupations in Saline County, the most male-oriented occupations are Architecture & Engineering (100.0%), Computers, Engineering & Science (56.0%), and Legal Services & Support (54.3%), while the most female-oriented occupations are Health Technologists (91.6%), Health Diagnosing & Treating (88.1%), and Education Instruction & Library (78.9%).
| Occupation | Male | Female |
| Management | 494 (49.0%) | 514 (51.0%) |
| Business & Financial | 57 (29.7%) | 135 (70.3%) |
| Computers, Engineering & Science | 117 (56.0%) | 92 (44.0%) |
| Computers & Mathematics | 62 (51.7%) | 58 (48.3%) |
| Architecture & Engineering | 34 (100.0%) | 0 (0.0%) |
| Life, Physical & Social Science | 21 (38.2%) | 34 (61.8%) |
| Community & Social Service | 231 (29.0%) | 566 (71.0%) |
| Education, Arts & Media | 62 (36.3%) | 109 (63.7%) |
| Legal Services & Support | 50 (54.3%) | 42 (45.7%) |
| Education Instruction & Library | 97 (21.1%) | 363 (78.9%) |
| Arts, Media & Entertainment | 22 (29.7%) | 52 (70.3%) |
| Health Diagnosing & Treating | 26 (11.9%) | 193 (88.1%) |
| Health Technologists | 11 (8.4%) | 120 (91.6%) |
| Total (Category) | 925 (38.1%) | 1,500 (61.9%) |
| Total (Overall) | 3,911 (54.3%) | 3,285 (45.7%) |
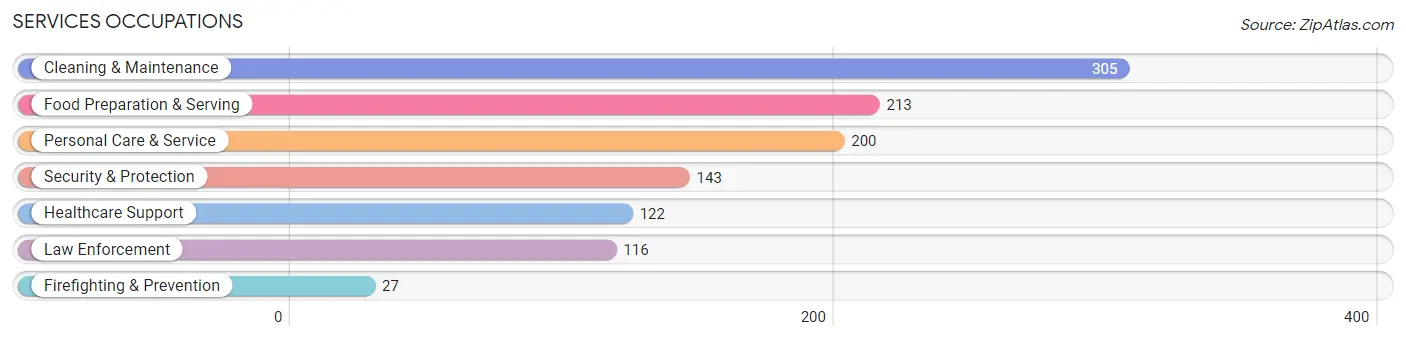
Services Occupations
The most common Services occupations in Saline County are Cleaning & Maintenance (305 | 4.2%), Food Preparation & Serving (213 | 3.0%), Personal Care & Service (200 | 2.8%), Security & Protection (143 | 2.0%), and Healthcare Support (122 | 1.7%).
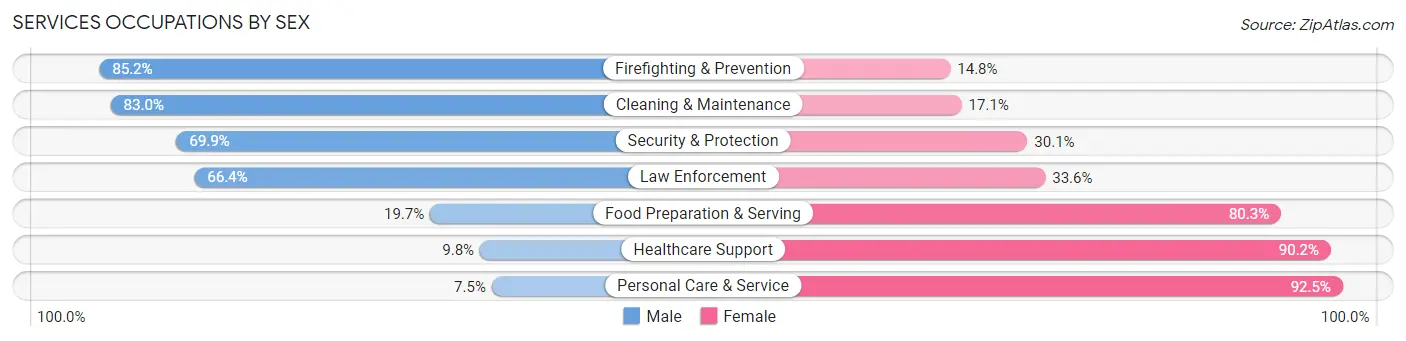
Services Occupations by Sex
Within the Services occupations in Saline County, the most male-oriented occupations are Firefighting & Prevention (85.2%), Cleaning & Maintenance (83.0%), and Security & Protection (69.9%), while the most female-oriented occupations are Personal Care & Service (92.5%), Healthcare Support (90.2%), and Food Preparation & Serving (80.3%).
| Occupation | Male | Female |
| Healthcare Support | 12 (9.8%) | 110 (90.2%) |
| Security & Protection | 100 (69.9%) | 43 (30.1%) |
| Firefighting & Prevention | 23 (85.2%) | 4 (14.8%) |
| Law Enforcement | 77 (66.4%) | 39 (33.6%) |
| Food Preparation & Serving | 42 (19.7%) | 171 (80.3%) |
| Cleaning & Maintenance | 253 (83.0%) | 52 (17.1%) |
| Personal Care & Service | 15 (7.5%) | 185 (92.5%) |
| Total (Category) | 422 (42.9%) | 561 (57.1%) |
| Total (Overall) | 3,911 (54.3%) | 3,285 (45.7%) |
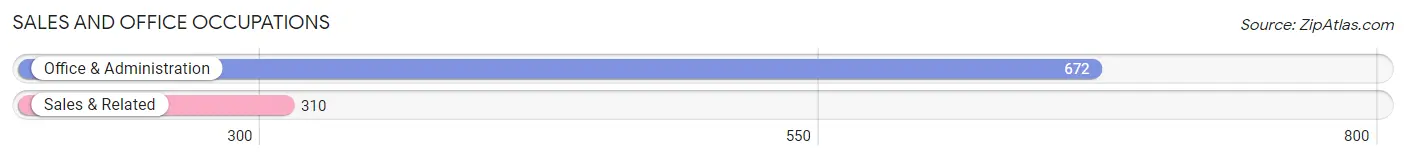
Sales and Office Occupations
The most common Sales and Office occupations in Saline County are Office & Administration (672 | 9.3%), and Sales & Related (310 | 4.3%).
Sales and Office Occupations by Sex
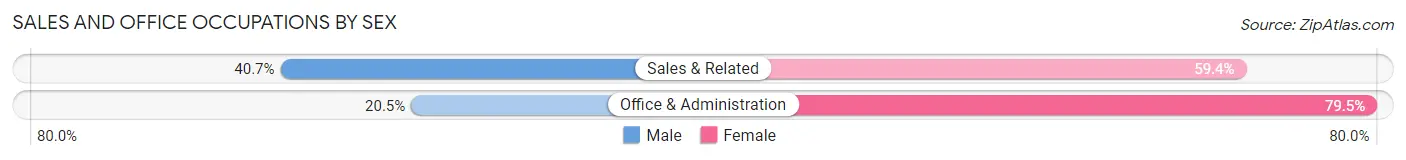
| Occupation | Male | Female |
| Sales & Related | 126 (40.6%) | 184 (59.4%) |
| Office & Administration | 138 (20.5%) | 534 (79.5%) |
| Total (Category) | 264 (26.9%) | 718 (73.1%) |
| Total (Overall) | 3,911 (54.3%) | 3,285 (45.7%) |
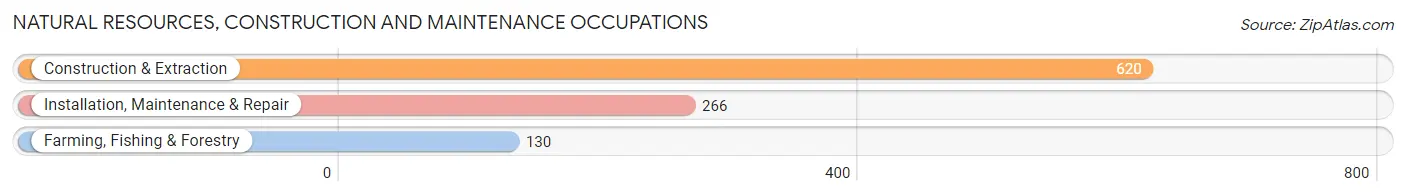
Natural Resources, Construction and Maintenance Occupations
The most common Natural Resources, Construction and Maintenance occupations in Saline County are Construction & Extraction (620 | 8.6%), Installation, Maintenance & Repair (266 | 3.7%), and Farming, Fishing & Forestry (130 | 1.8%).
Natural Resources, Construction and Maintenance Occupations by Sex
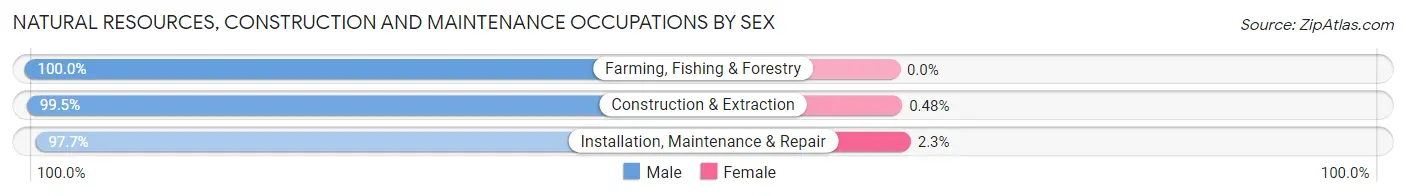
| Occupation | Male | Female |
| Farming, Fishing & Forestry | 130 (100.0%) | 0 (0.0%) |
| Construction & Extraction | 617 (99.5%) | 3 (0.5%) |
| Installation, Maintenance & Repair | 260 (97.7%) | 6 (2.3%) |
| Total (Category) | 1,007 (99.1%) | 9 (0.9%) |
| Total (Overall) | 3,911 (54.3%) | 3,285 (45.7%) |
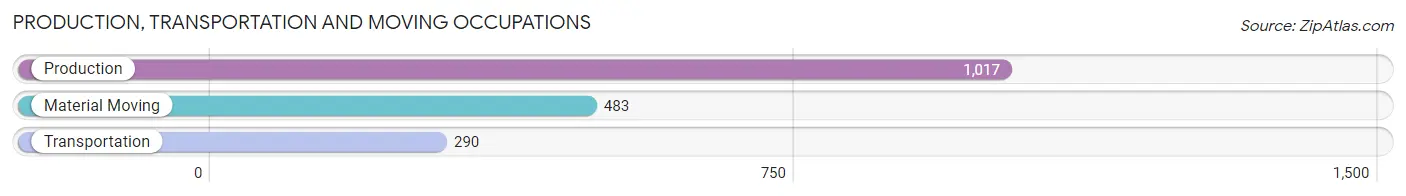
Production, Transportation and Moving Occupations
The most common Production, Transportation and Moving occupations in Saline County are Production (1,017 | 14.1%), Material Moving (483 | 6.7%), and Transportation (290 | 4.0%).
Production, Transportation and Moving Occupations by Sex
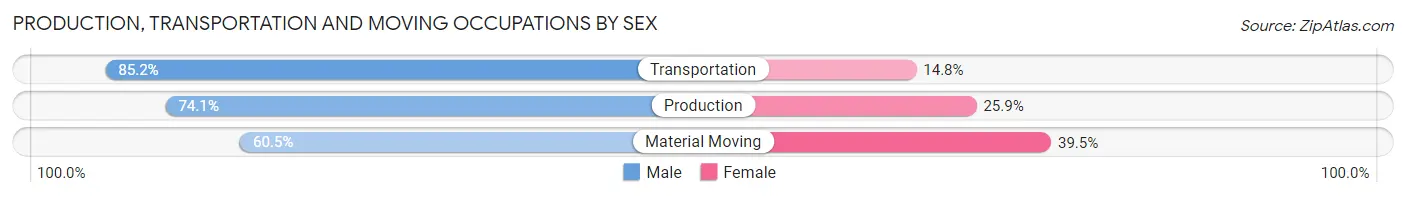
| Occupation | Male | Female |
| Production | 754 (74.1%) | 263 (25.9%) |
| Transportation | 247 (85.2%) | 43 (14.8%) |
| Material Moving | 292 (60.5%) | 191 (39.5%) |
| Total (Category) | 1,293 (72.2%) | 497 (27.8%) |
| Total (Overall) | 3,911 (54.3%) | 3,285 (45.7%) |
Employment Industries by Sex in Saline County
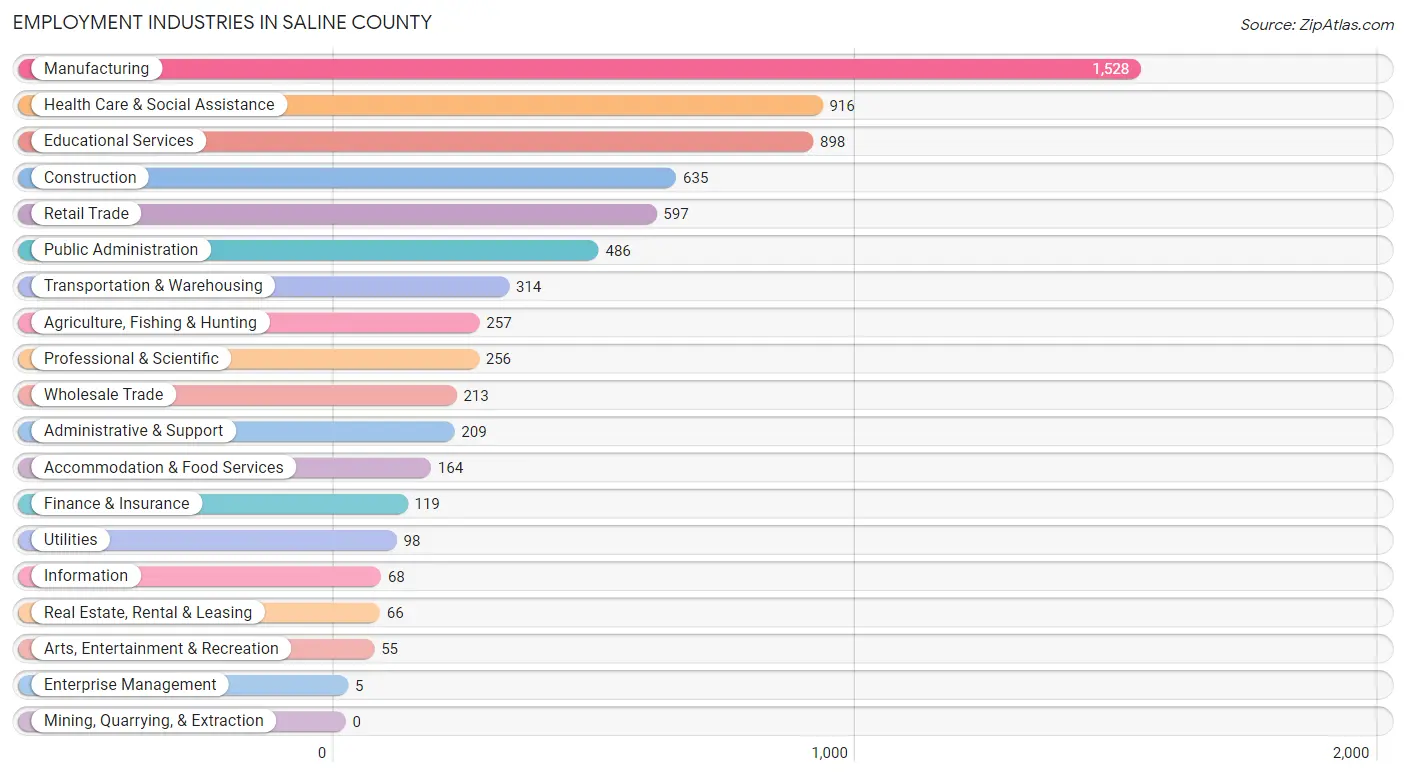
Employment Industries in Saline County
The major employment industries in Saline County include Manufacturing (1,528 | 21.2%), Health Care & Social Assistance (916 | 12.7%), Educational Services (898 | 12.5%), Construction (635 | 8.8%), and Retail Trade (597 | 8.3%).
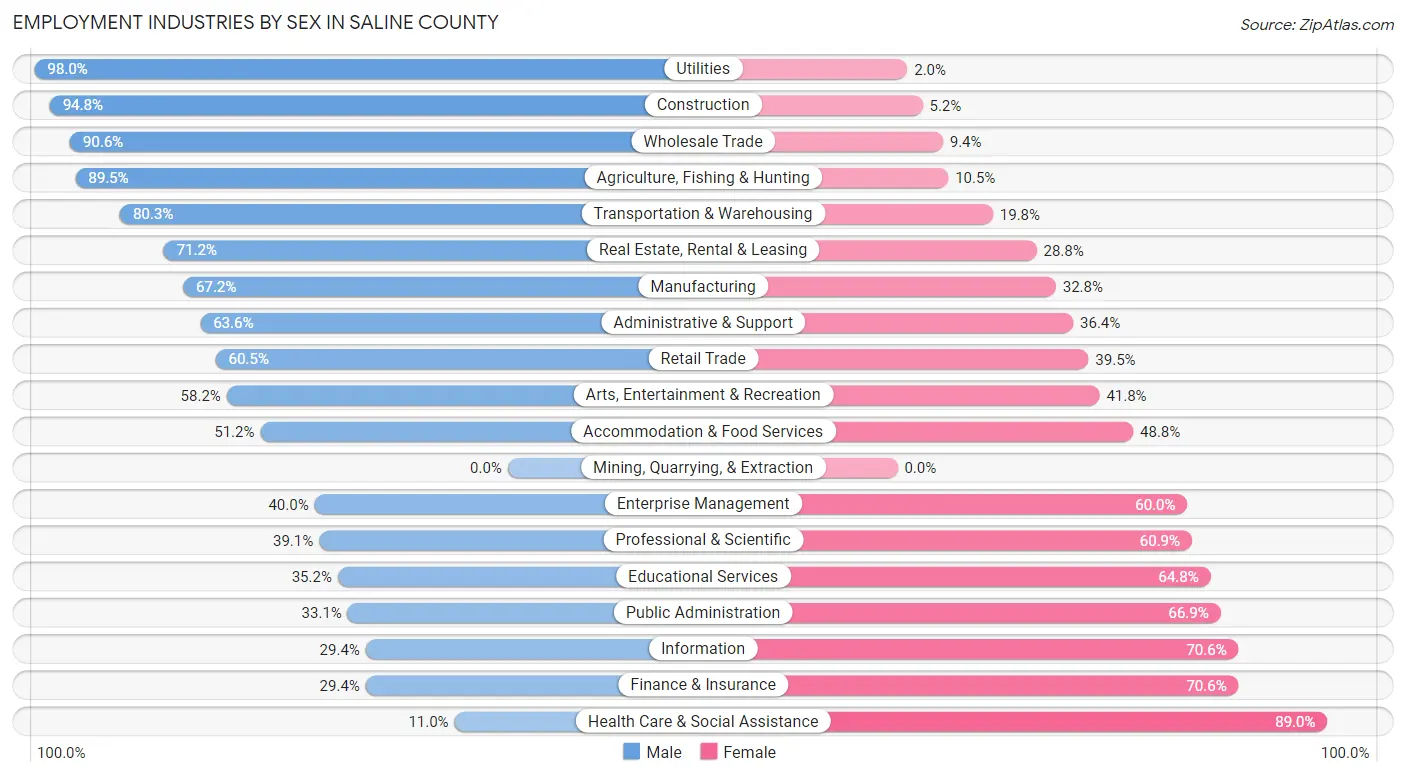
Employment Industries by Sex in Saline County
The Saline County industries that see more men than women are Utilities (98.0%), Construction (94.8%), and Wholesale Trade (90.6%), whereas the industries that tend to have a higher number of women are Health Care & Social Assistance (89.0%), Information (70.6%), and Finance & Insurance (70.6%).
| Industry | Male | Female |
| Agriculture, Fishing & Hunting | 230 (89.5%) | 27 (10.5%) |
| Mining, Quarrying, & Extraction | 0 (0.0%) | 0 (0.0%) |
| Construction | 602 (94.8%) | 33 (5.2%) |
| Manufacturing | 1,027 (67.2%) | 501 (32.8%) |
| Wholesale Trade | 193 (90.6%) | 20 (9.4%) |
| Retail Trade | 361 (60.5%) | 236 (39.5%) |
| Transportation & Warehousing | 252 (80.2%) | 62 (19.8%) |
| Utilities | 96 (98.0%) | 2 (2.0%) |
| Information | 20 (29.4%) | 48 (70.6%) |
| Finance & Insurance | 35 (29.4%) | 84 (70.6%) |
| Real Estate, Rental & Leasing | 47 (71.2%) | 19 (28.8%) |
| Professional & Scientific | 100 (39.1%) | 156 (60.9%) |
| Enterprise Management | 2 (40.0%) | 3 (60.0%) |
| Administrative & Support | 133 (63.6%) | 76 (36.4%) |
| Educational Services | 316 (35.2%) | 582 (64.8%) |
| Health Care & Social Assistance | 101 (11.0%) | 815 (89.0%) |
| Arts, Entertainment & Recreation | 32 (58.2%) | 23 (41.8%) |
| Accommodation & Food Services | 84 (51.2%) | 80 (48.8%) |
| Public Administration | 161 (33.1%) | 325 (66.9%) |
| Total | 3,911 (54.3%) | 3,285 (45.7%) |
Education in Saline County
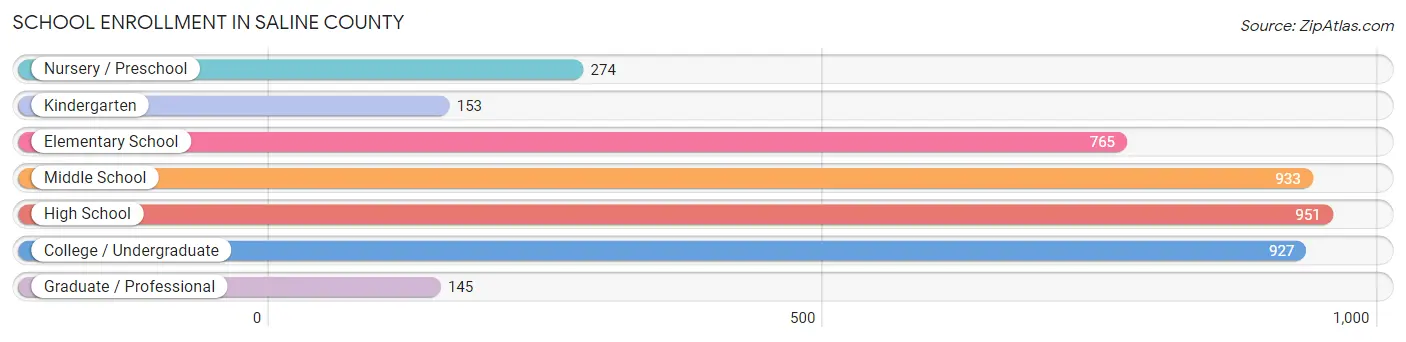
School Enrollment in Saline County
The most common levels of schooling among the 4,148 students in Saline County are high school (951 | 22.9%), middle school (933 | 22.5%), and college / undergraduate (927 | 22.4%).
| School Level | # Students | % Students |
| Nursery / Preschool | 274 | 6.6% |
| Kindergarten | 153 | 3.7% |
| Elementary School | 765 | 18.4% |
| Middle School | 933 | 22.5% |
| High School | 951 | 22.9% |
| College / Undergraduate | 927 | 22.4% |
| Graduate / Professional | 145 | 3.5% |
| Total | 4,148 | 100.0% |
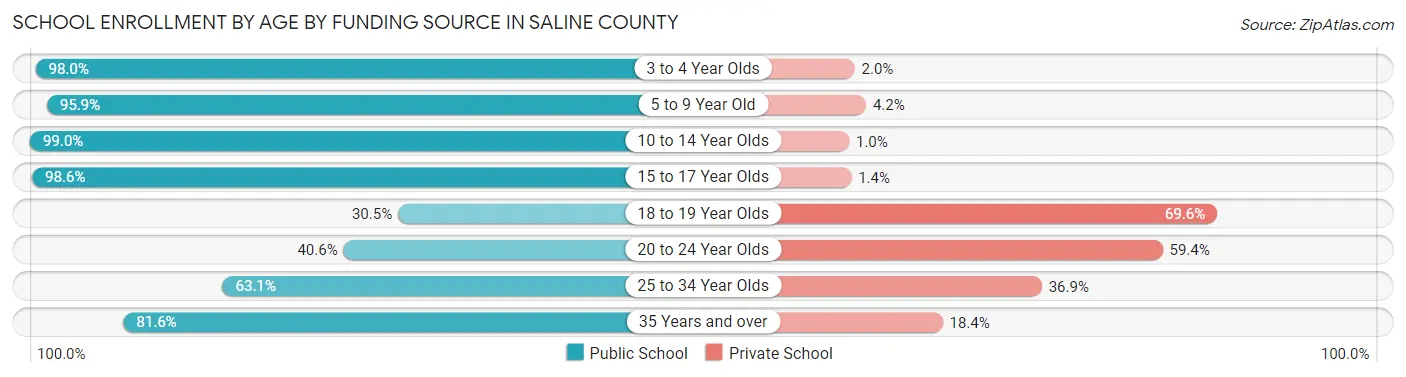
School Enrollment by Age by Funding Source in Saline County
Out of a total of 4,148 students who are enrolled in schools in Saline County, 772 (18.6%) attend a private institution, while the remaining 3,376 (81.4%) are enrolled in public schools. The age group of 18 to 19 year olds has the highest likelihood of being enrolled in private schools, with 370 (69.6% in the age bracket) enrolled. Conversely, the age group of 10 to 14 year olds has the lowest likelihood of being enrolled in a private school, with 1,185 (99.0% in the age bracket) attending a public institution.
| Age Bracket | Public School | Private School |
| 3 to 4 Year Olds | 192 (98.0%) | 4 (2.0%) |
| 5 to 9 Year Old | 786 (95.9%) | 34 (4.2%) |
| 10 to 14 Year Olds | 1,185 (99.0%) | 12 (1.0%) |
| 15 to 17 Year Olds | 635 (98.6%) | 9 (1.4%) |
| 18 to 19 Year Olds | 162 (30.4%) | 370 (69.6%) |
| 20 to 24 Year Olds | 177 (40.6%) | 259 (59.4%) |
| 25 to 34 Year Olds | 77 (63.1%) | 45 (36.9%) |
| 35 Years and over | 164 (81.6%) | 37 (18.4%) |
| Total | 3,376 (81.4%) | 772 (18.6%) |
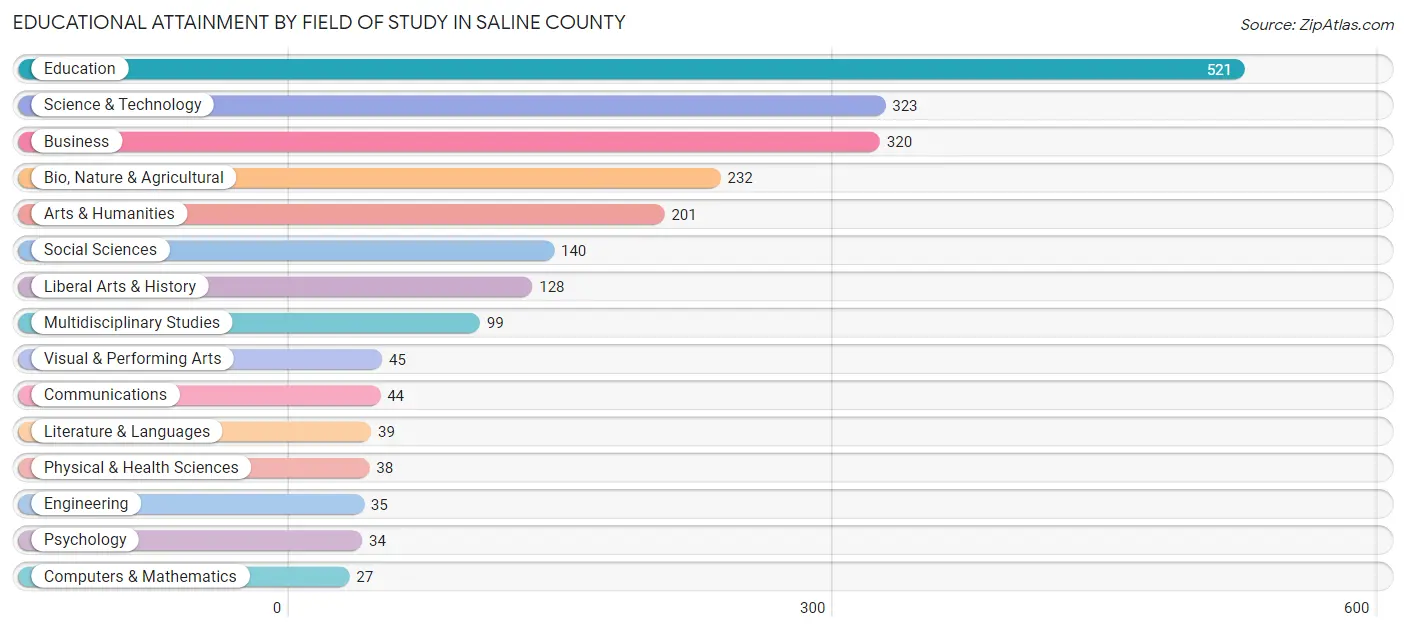
Educational Attainment by Field of Study in Saline County
Education (521 | 23.4%), science & technology (323 | 14.5%), business (320 | 14.4%), bio, nature & agricultural (232 | 10.4%), and arts & humanities (201 | 9.0%) are the most common fields of study among 2,226 individuals in Saline County who have obtained a bachelor's degree or higher.
| Field of Study | # Graduates | % Graduates |
| Computers & Mathematics | 27 | 1.2% |
| Bio, Nature & Agricultural | 232 | 10.4% |
| Physical & Health Sciences | 38 | 1.7% |
| Psychology | 34 | 1.5% |
| Social Sciences | 140 | 6.3% |
| Engineering | 35 | 1.6% |
| Multidisciplinary Studies | 99 | 4.4% |
| Science & Technology | 323 | 14.5% |
| Business | 320 | 14.4% |
| Education | 521 | 23.4% |
| Literature & Languages | 39 | 1.8% |
| Liberal Arts & History | 128 | 5.8% |
| Visual & Performing Arts | 45 | 2.0% |
| Communications | 44 | 2.0% |
| Arts & Humanities | 201 | 9.0% |
| Total | 2,226 | 100.0% |
Transportation & Commute in Saline County
Vehicle Availability by Sex in Saline County
The most prevalent vehicle ownership categories in Saline County are males with 3 vehicles (1,308, accounting for 34.9%) and females with 3 vehicles (912, making up 42.3%).
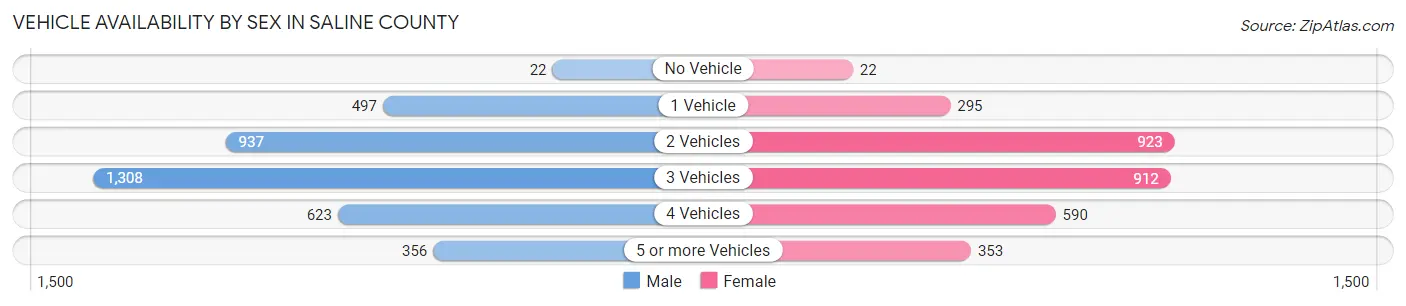
| Vehicles Available | Male | Female |
| No Vehicle | 22 (0.6%) | 22 (0.7%) |
| 1 Vehicle | 497 (13.3%) | 295 (9.5%) |
| 2 Vehicles | 937 (25.0%) | 923 (29.8%) |
| 3 Vehicles | 1,308 (34.9%) | 912 (29.5%) |
| 4 Vehicles | 623 (16.6%) | 590 (19.1%) |
| 5 or more Vehicles | 356 (9.5%) | 353 (11.4%) |
| Total | 3,743 (100.0%) | 3,095 (100.0%) |
Commute Time in Saline County
The most frequently occuring commute durations in Saline County are 5 to 9 minutes (1,628 commuters, 24.4%), 15 to 19 minutes (795 commuters, 11.9%), and 10 to 14 minutes (685 commuters, 10.3%).
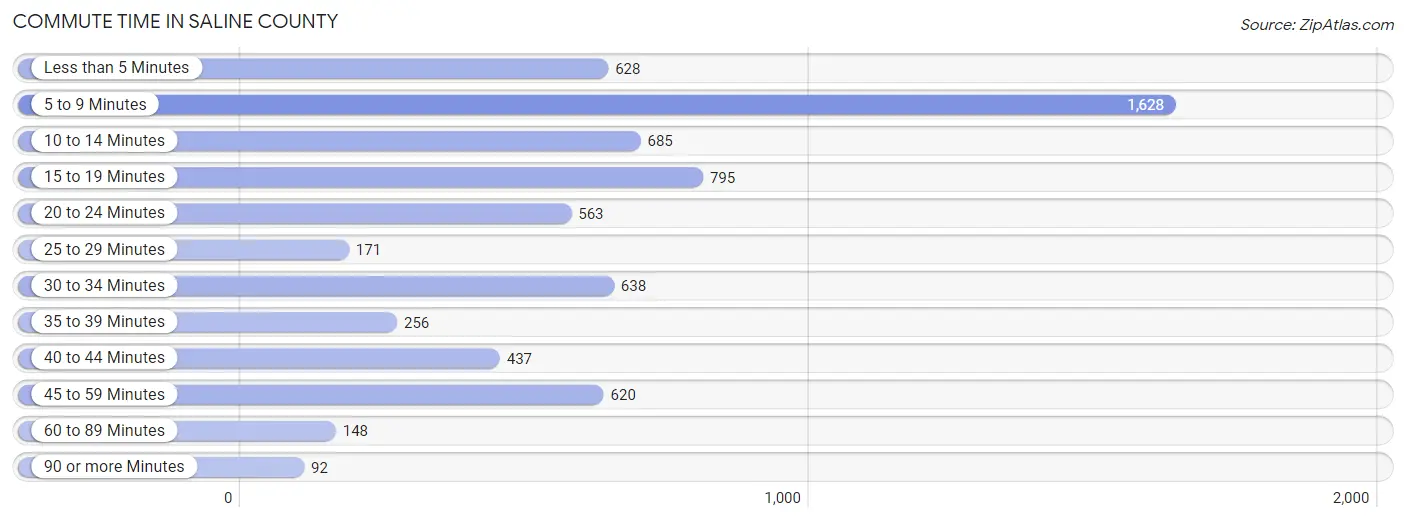
| Commute Time | # Commuters | % Commuters |
| Less than 5 Minutes | 628 | 9.4% |
| 5 to 9 Minutes | 1,628 | 24.4% |
| 10 to 14 Minutes | 685 | 10.3% |
| 15 to 19 Minutes | 795 | 11.9% |
| 20 to 24 Minutes | 563 | 8.5% |
| 25 to 29 Minutes | 171 | 2.6% |
| 30 to 34 Minutes | 638 | 9.6% |
| 35 to 39 Minutes | 256 | 3.8% |
| 40 to 44 Minutes | 437 | 6.6% |
| 45 to 59 Minutes | 620 | 9.3% |
| 60 to 89 Minutes | 148 | 2.2% |
| 90 or more Minutes | 92 | 1.4% |
Commute Time by Sex in Saline County
The most common commute times in Saline County are 5 to 9 minutes (758 commuters, 20.5%) for males and 5 to 9 minutes (870 commuters, 29.4%) for females.
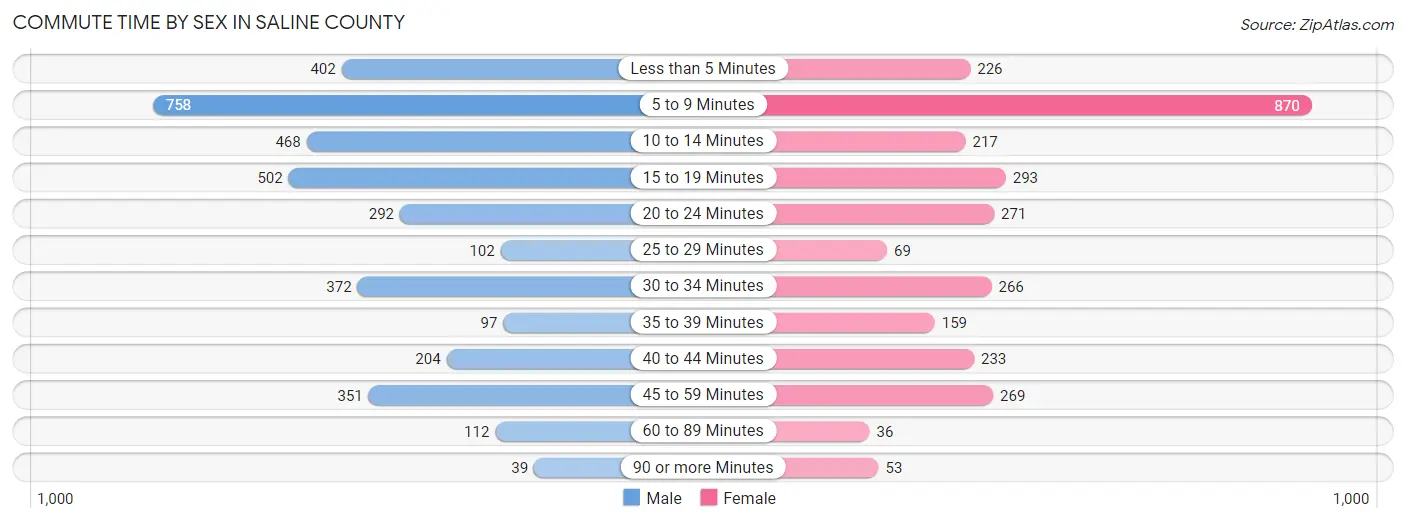
| Commute Time | Male | Female |
| Less than 5 Minutes | 402 (10.9%) | 226 (7.6%) |
| 5 to 9 Minutes | 758 (20.5%) | 870 (29.4%) |
| 10 to 14 Minutes | 468 (12.7%) | 217 (7.3%) |
| 15 to 19 Minutes | 502 (13.6%) | 293 (9.9%) |
| 20 to 24 Minutes | 292 (7.9%) | 271 (9.1%) |
| 25 to 29 Minutes | 102 (2.8%) | 69 (2.3%) |
| 30 to 34 Minutes | 372 (10.1%) | 266 (9.0%) |
| 35 to 39 Minutes | 97 (2.6%) | 159 (5.4%) |
| 40 to 44 Minutes | 204 (5.5%) | 233 (7.9%) |
| 45 to 59 Minutes | 351 (9.5%) | 269 (9.1%) |
| 60 to 89 Minutes | 112 (3.0%) | 36 (1.2%) |
| 90 or more Minutes | 39 (1.1%) | 53 (1.8%) |
Time of Departure to Work by Sex in Saline County
The most frequent times of departure to work in Saline County are 6:00 AM to 6:29 AM (606, 16.4%) for males and 7:00 AM to 7:29 AM (544, 18.4%) for females.
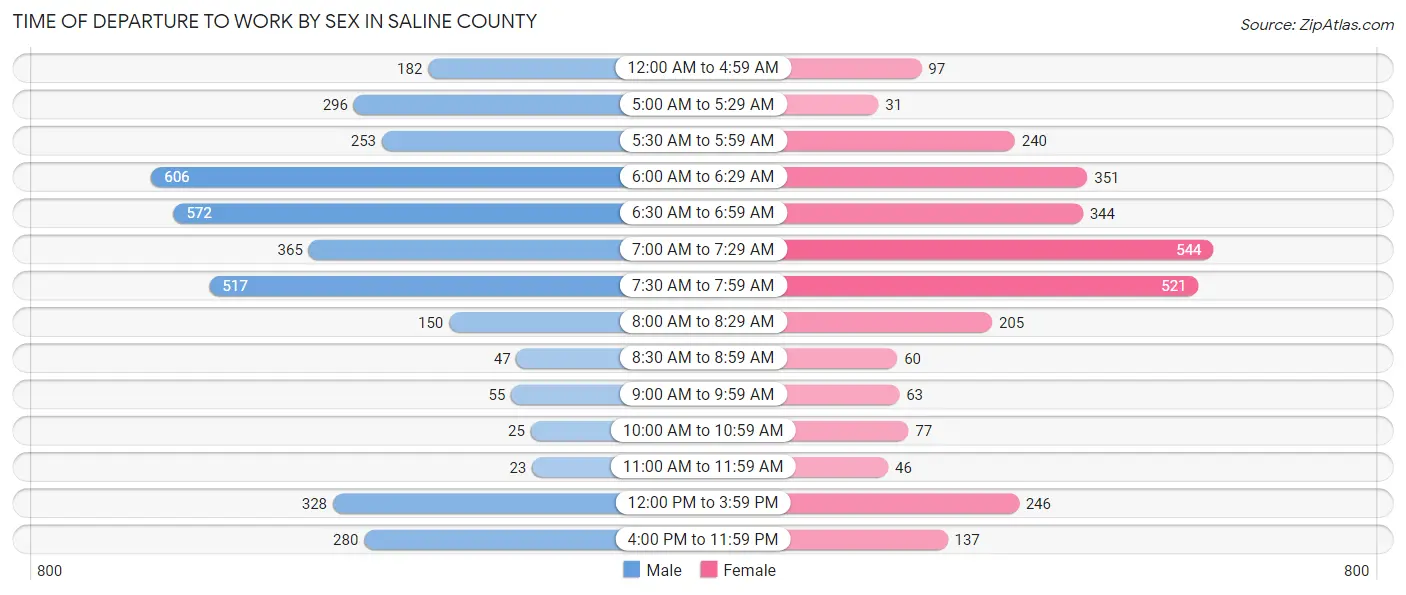
| Time of Departure | Male | Female |
| 12:00 AM to 4:59 AM | 182 (4.9%) | 97 (3.3%) |
| 5:00 AM to 5:29 AM | 296 (8.0%) | 31 (1.1%) |
| 5:30 AM to 5:59 AM | 253 (6.8%) | 240 (8.1%) |
| 6:00 AM to 6:29 AM | 606 (16.4%) | 351 (11.8%) |
| 6:30 AM to 6:59 AM | 572 (15.5%) | 344 (11.6%) |
| 7:00 AM to 7:29 AM | 365 (9.9%) | 544 (18.4%) |
| 7:30 AM to 7:59 AM | 517 (14.0%) | 521 (17.6%) |
| 8:00 AM to 8:29 AM | 150 (4.1%) | 205 (6.9%) |
| 8:30 AM to 8:59 AM | 47 (1.3%) | 60 (2.0%) |
| 9:00 AM to 9:59 AM | 55 (1.5%) | 63 (2.1%) |
| 10:00 AM to 10:59 AM | 25 (0.7%) | 77 (2.6%) |
| 11:00 AM to 11:59 AM | 23 (0.6%) | 46 (1.5%) |
| 12:00 PM to 3:59 PM | 328 (8.9%) | 246 (8.3%) |
| 4:00 PM to 11:59 PM | 280 (7.6%) | 137 (4.6%) |
| Total | 3,699 (100.0%) | 2,962 (100.0%) |
Housing Occupancy in Saline County
Occupancy by Ownership in Saline County
Of the total 5,137 dwellings in Saline County, owner-occupied units account for 3,789 (73.8%), while renter-occupied units make up 1,348 (26.2%).
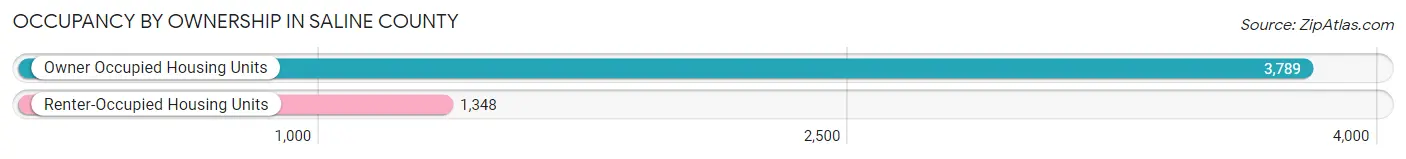
| Occupancy | # Housing Units | % Housing Units |
| Owner Occupied Housing Units | 3,789 | 73.8% |
| Renter-Occupied Housing Units | 1,348 | 26.2% |
| Total Occupied Housing Units | 5,137 | 100.0% |
Occupancy by Household Size in Saline County
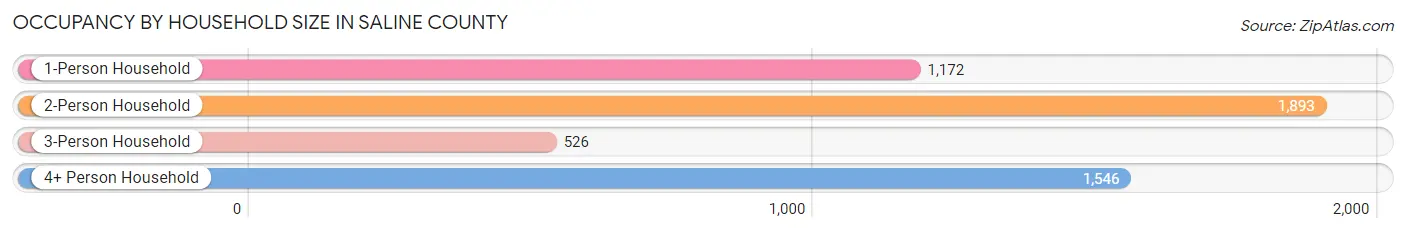
| Household Size | # Housing Units | % Housing Units |
| 1-Person Household | 1,172 | 22.8% |
| 2-Person Household | 1,893 | 36.8% |
| 3-Person Household | 526 | 10.2% |
| 4+ Person Household | 1,546 | 30.1% |
| Total Housing Units | 5,137 | 100.0% |
Occupancy by Ownership by Household Size in Saline County
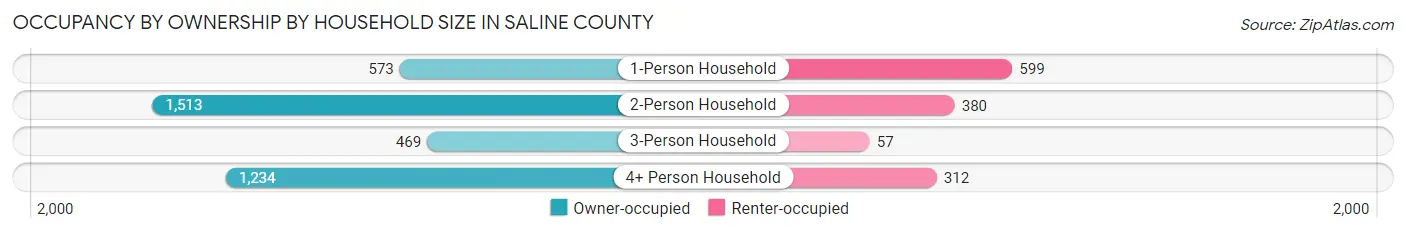
| Household Size | Owner-occupied | Renter-occupied |
| 1-Person Household | 573 (48.9%) | 599 (51.1%) |
| 2-Person Household | 1,513 (79.9%) | 380 (20.1%) |
| 3-Person Household | 469 (89.2%) | 57 (10.8%) |
| 4+ Person Household | 1,234 (79.8%) | 312 (20.2%) |
| Total Housing Units | 3,789 (73.8%) | 1,348 (26.2%) |
Occupancy by Educational Attainment in Saline County
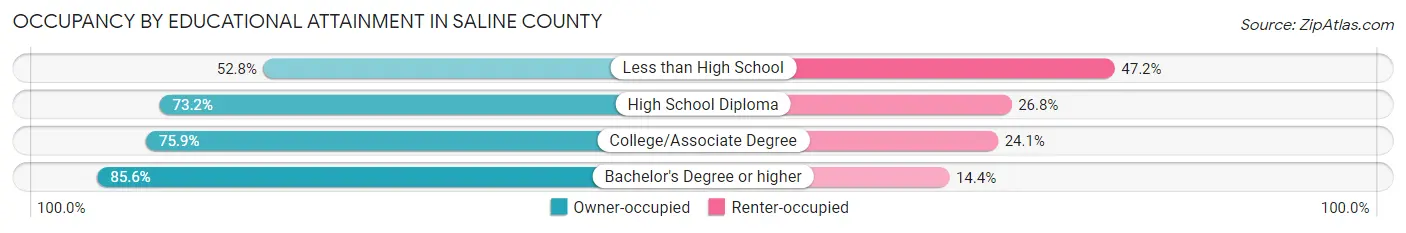
| Household Size | Owner-occupied | Renter-occupied |
| Less than High School | 456 (52.8%) | 408 (47.2%) |
| High School Diploma | 952 (73.2%) | 348 (26.8%) |
| College/Associate Degree | 1,279 (75.9%) | 406 (24.1%) |
| Bachelor's Degree or higher | 1,102 (85.6%) | 186 (14.4%) |
Occupancy by Age of Householder in Saline County
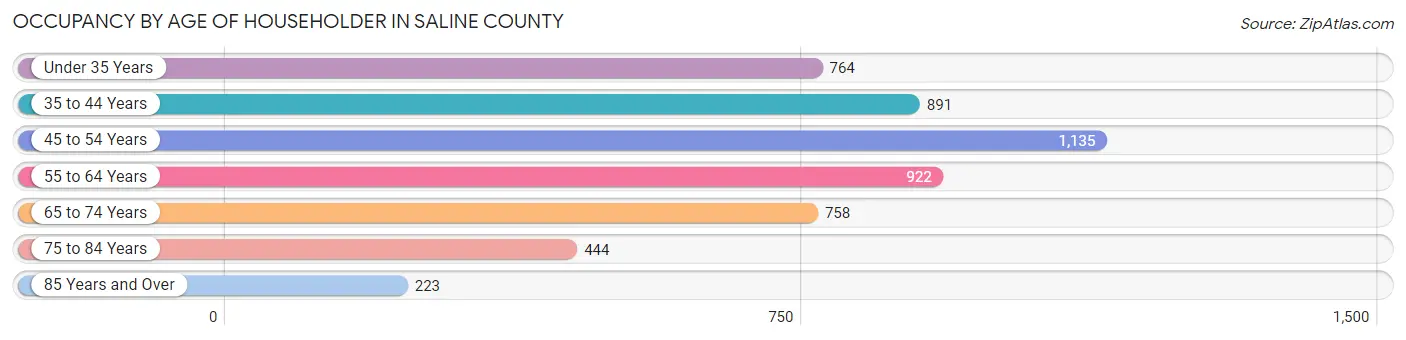
| Age Bracket | # Households | % Households |
| Under 35 Years | 764 | 14.9% |
| 35 to 44 Years | 891 | 17.3% |
| 45 to 54 Years | 1,135 | 22.1% |
| 55 to 64 Years | 922 | 17.9% |
| 65 to 74 Years | 758 | 14.8% |
| 75 to 84 Years | 444 | 8.6% |
| 85 Years and Over | 223 | 4.3% |
| Total | 5,137 | 100.0% |
Housing Finances in Saline County
Median Income by Occupancy in Saline County
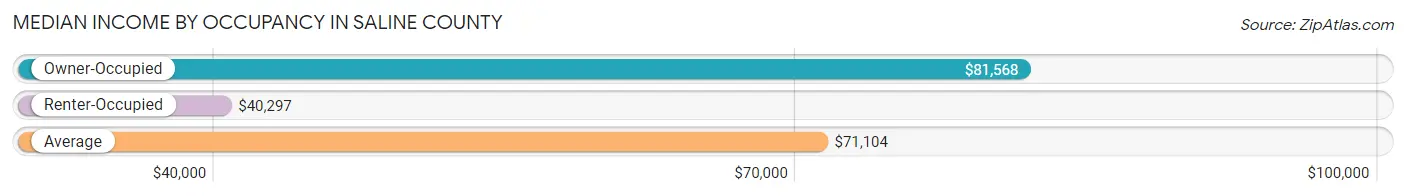
| Occupancy Type | # Households | Median Income |
| Owner-Occupied | 3,789 (73.8%) | $81,568 |
| Renter-Occupied | 1,348 (26.2%) | $40,297 |
| Average | 5,137 (100.0%) | $71,104 |
Occupancy by Householder Income Bracket in Saline County
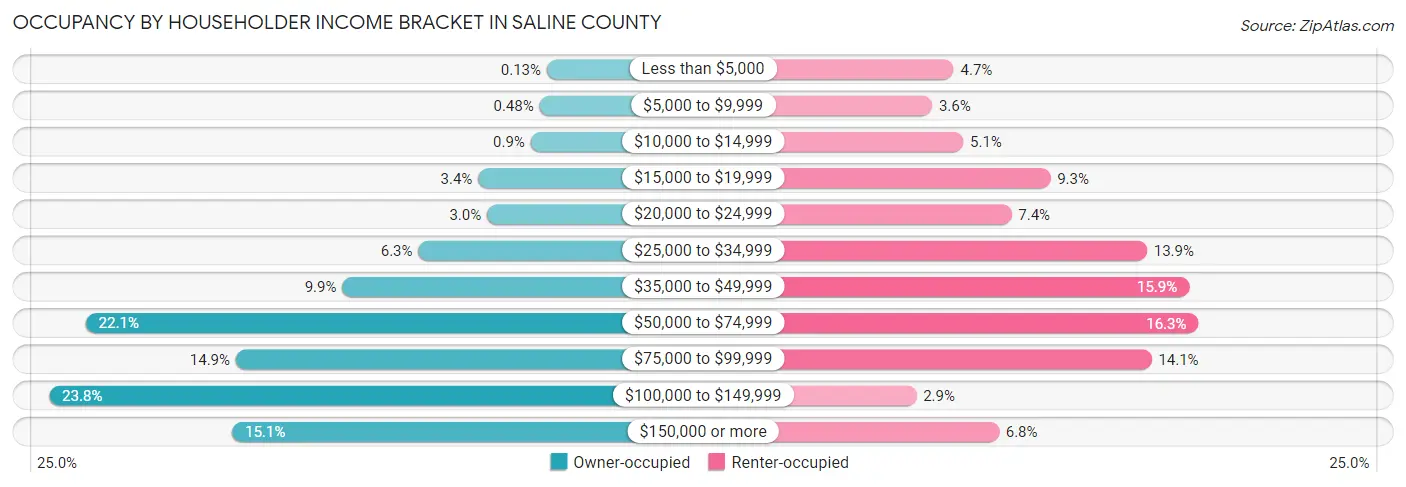
| Income Bracket | Owner-occupied | Renter-occupied |
| Less than $5,000 | 5 (0.1%) | 63 (4.7%) |
| $5,000 to $9,999 | 18 (0.5%) | 49 (3.6%) |
| $10,000 to $14,999 | 34 (0.9%) | 69 (5.1%) |
| $15,000 to $19,999 | 129 (3.4%) | 125 (9.3%) |
| $20,000 to $24,999 | 113 (3.0%) | 100 (7.4%) |
| $25,000 to $34,999 | 237 (6.2%) | 187 (13.9%) |
| $35,000 to $49,999 | 374 (9.9%) | 214 (15.9%) |
| $50,000 to $74,999 | 837 (22.1%) | 220 (16.3%) |
| $75,000 to $99,999 | 566 (14.9%) | 190 (14.1%) |
| $100,000 to $149,999 | 903 (23.8%) | 39 (2.9%) |
| $150,000 or more | 573 (15.1%) | 92 (6.8%) |
| Total | 3,789 (100.0%) | 1,348 (100.0%) |
Monthly Housing Cost Tiers in Saline County
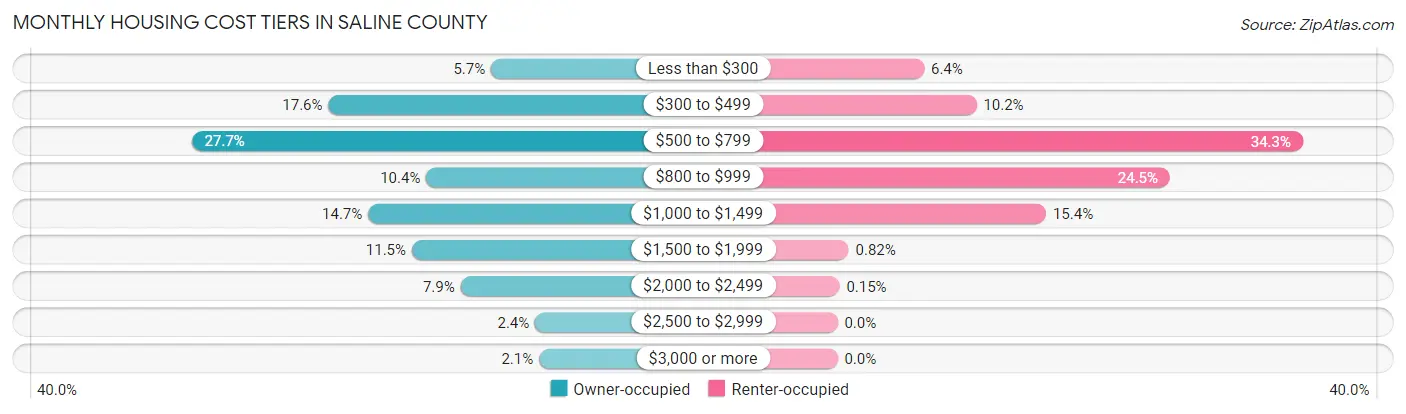
| Monthly Cost | Owner-occupied | Renter-occupied |
| Less than $300 | 214 (5.7%) | 86 (6.4%) |
| $300 to $499 | 668 (17.6%) | 138 (10.2%) |
| $500 to $799 | 1,050 (27.7%) | 462 (34.3%) |
| $800 to $999 | 395 (10.4%) | 330 (24.5%) |
| $1,000 to $1,499 | 557 (14.7%) | 207 (15.4%) |
| $1,500 to $1,999 | 435 (11.5%) | 11 (0.8%) |
| $2,000 to $2,499 | 299 (7.9%) | 2 (0.2%) |
| $2,500 to $2,999 | 91 (2.4%) | 0 (0.0%) |
| $3,000 or more | 80 (2.1%) | 0 (0.0%) |
| Total | 3,789 (100.0%) | 1,348 (100.0%) |
Physical Housing Characteristics in Saline County
Housing Structures in Saline County
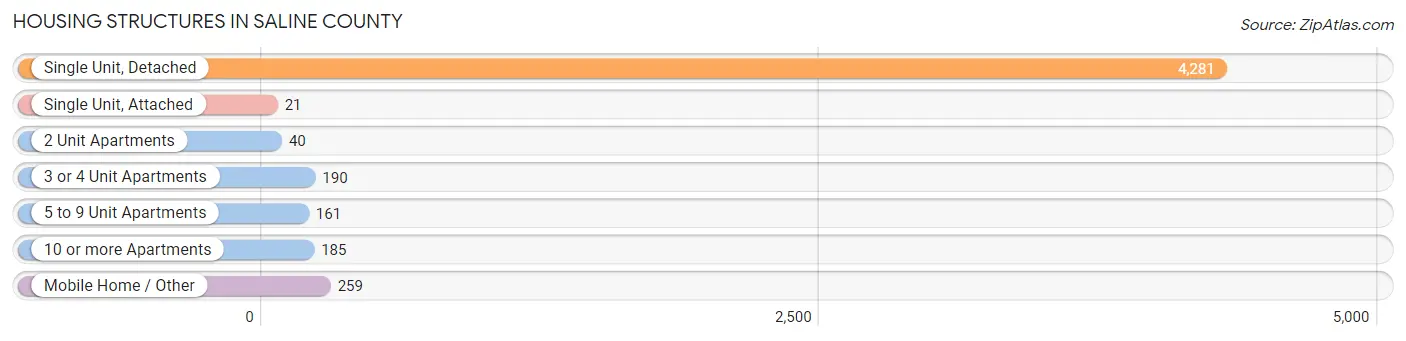
| Structure Type | # Housing Units | % Housing Units |
| Single Unit, Detached | 4,281 | 83.3% |
| Single Unit, Attached | 21 | 0.4% |
| 2 Unit Apartments | 40 | 0.8% |
| 3 or 4 Unit Apartments | 190 | 3.7% |
| 5 to 9 Unit Apartments | 161 | 3.1% |
| 10 or more Apartments | 185 | 3.6% |
| Mobile Home / Other | 259 | 5.0% |
| Total | 5,137 | 100.0% |
Housing Structures by Occupancy in Saline County
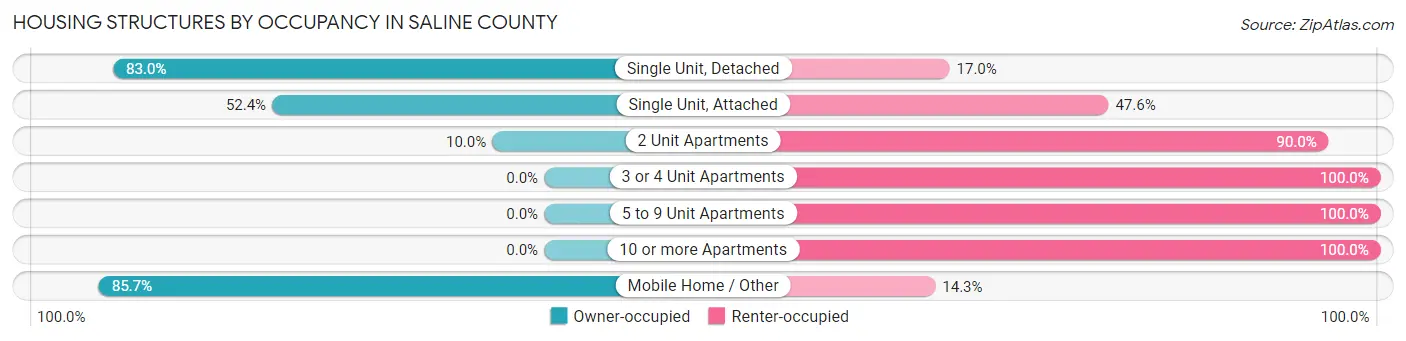
| Structure Type | Owner-occupied | Renter-occupied |
| Single Unit, Detached | 3,552 (83.0%) | 729 (17.0%) |
| Single Unit, Attached | 11 (52.4%) | 10 (47.6%) |
| 2 Unit Apartments | 4 (10.0%) | 36 (90.0%) |
| 3 or 4 Unit Apartments | 0 (0.0%) | 190 (100.0%) |
| 5 to 9 Unit Apartments | 0 (0.0%) | 161 (100.0%) |
| 10 or more Apartments | 0 (0.0%) | 185 (100.0%) |
| Mobile Home / Other | 222 (85.7%) | 37 (14.3%) |
| Total | 3,789 (73.8%) | 1,348 (26.2%) |
Housing Structures by Number of Rooms in Saline County
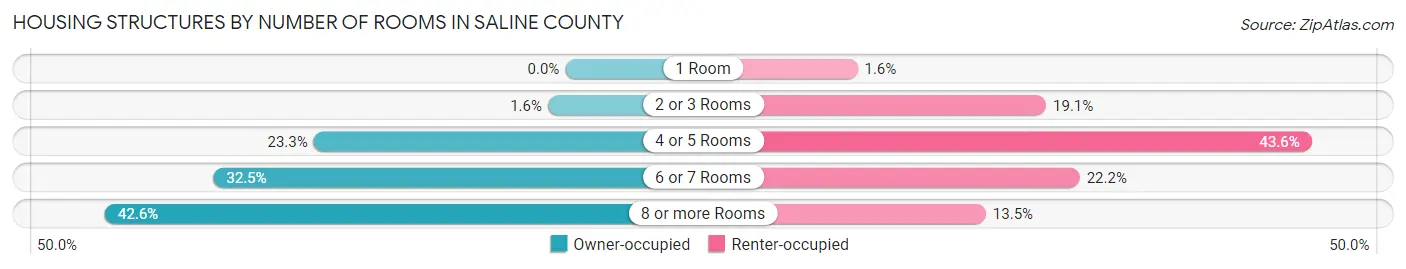
| Number of Rooms | Owner-occupied | Renter-occupied |
| 1 Room | 0 (0.0%) | 22 (1.6%) |
| 2 or 3 Rooms | 61 (1.6%) | 257 (19.1%) |
| 4 or 5 Rooms | 882 (23.3%) | 588 (43.6%) |
| 6 or 7 Rooms | 1,233 (32.5%) | 299 (22.2%) |
| 8 or more Rooms | 1,613 (42.6%) | 182 (13.5%) |
| Total | 3,789 (100.0%) | 1,348 (100.0%) |
Housing Structure by Heating Type in Saline County
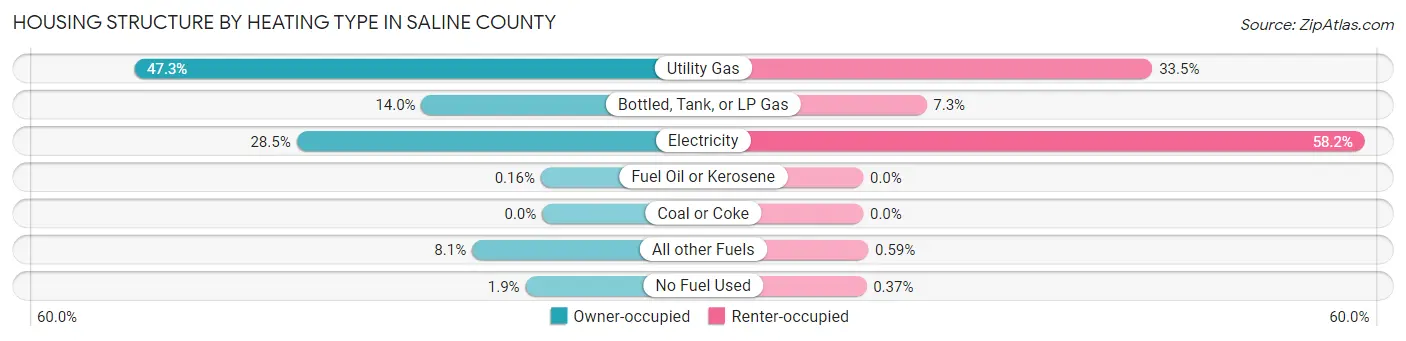
| Heating Type | Owner-occupied | Renter-occupied |
| Utility Gas | 1,793 (47.3%) | 452 (33.5%) |
| Bottled, Tank, or LP Gas | 530 (14.0%) | 99 (7.3%) |
| Electricity | 1,079 (28.5%) | 784 (58.2%) |
| Fuel Oil or Kerosene | 6 (0.2%) | 0 (0.0%) |
| Coal or Coke | 0 (0.0%) | 0 (0.0%) |
| All other Fuels | 308 (8.1%) | 8 (0.6%) |
| No Fuel Used | 73 (1.9%) | 5 (0.4%) |
| Total | 3,789 (100.0%) | 1,348 (100.0%) |
Household Vehicle Usage in Saline County
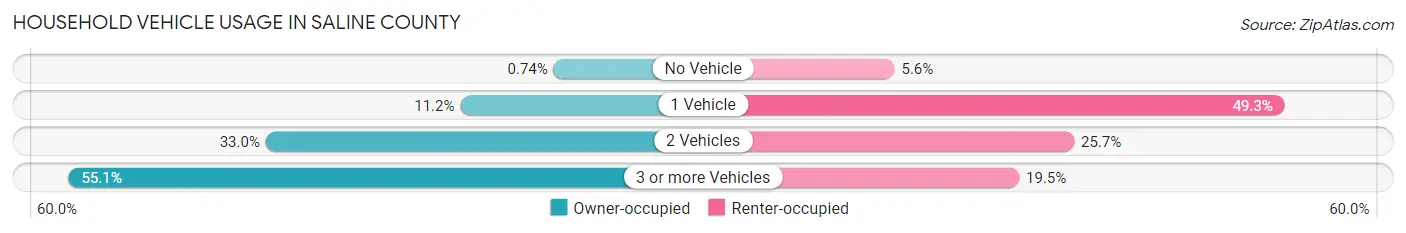
| Vehicles per Household | Owner-occupied | Renter-occupied |
| No Vehicle | 28 (0.7%) | 75 (5.6%) |
| 1 Vehicle | 424 (11.2%) | 664 (49.3%) |
| 2 Vehicles | 1,250 (33.0%) | 346 (25.7%) |
| 3 or more Vehicles | 2,087 (55.1%) | 263 (19.5%) |
| Total | 3,789 (100.0%) | 1,348 (100.0%) |
Real Estate & Mortgages in Saline County
Real Estate and Mortgage Overview in Saline County
| Characteristic | Without Mortgage | With Mortgage |
| Housing Units | 2,101 | 1,688 |
| Median Property Value | $119,800 | $194,800 |
| Median Household Income | $70,182 | $333 |
| Monthly Housing Costs | $543 | $80 |
| Real Estate Taxes | $1,941 | $52 |
Property Value by Mortgage Status in Saline County
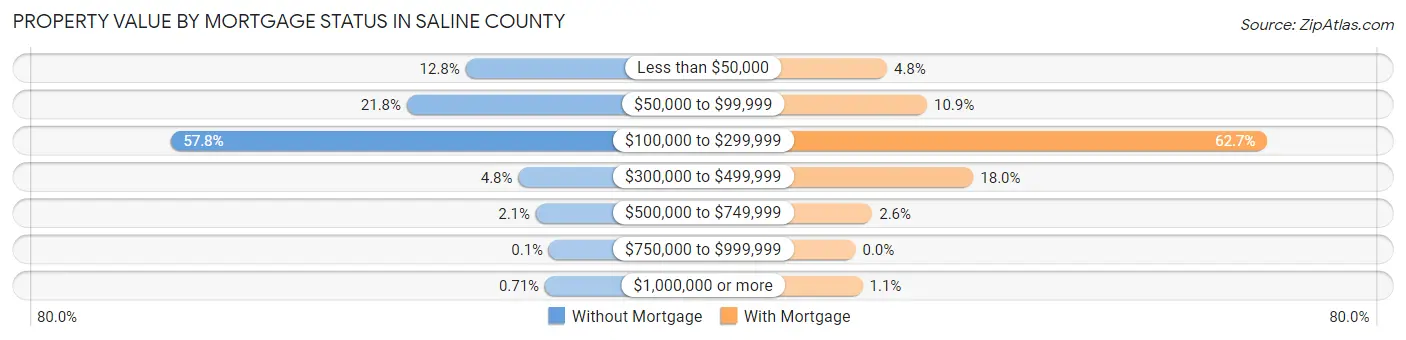
| Property Value | Without Mortgage | With Mortgage |
| Less than $50,000 | 269 (12.8%) | 81 (4.8%) |
| $50,000 to $99,999 | 457 (21.7%) | 184 (10.9%) |
| $100,000 to $299,999 | 1,214 (57.8%) | 1,059 (62.7%) |
| $300,000 to $499,999 | 100 (4.8%) | 303 (17.9%) |
| $500,000 to $749,999 | 44 (2.1%) | 43 (2.5%) |
| $750,000 to $999,999 | 2 (0.1%) | 0 (0.0%) |
| $1,000,000 or more | 15 (0.7%) | 18 (1.1%) |
| Total | 2,101 (100.0%) | 1,688 (100.0%) |
Household Income by Mortgage Status in Saline County
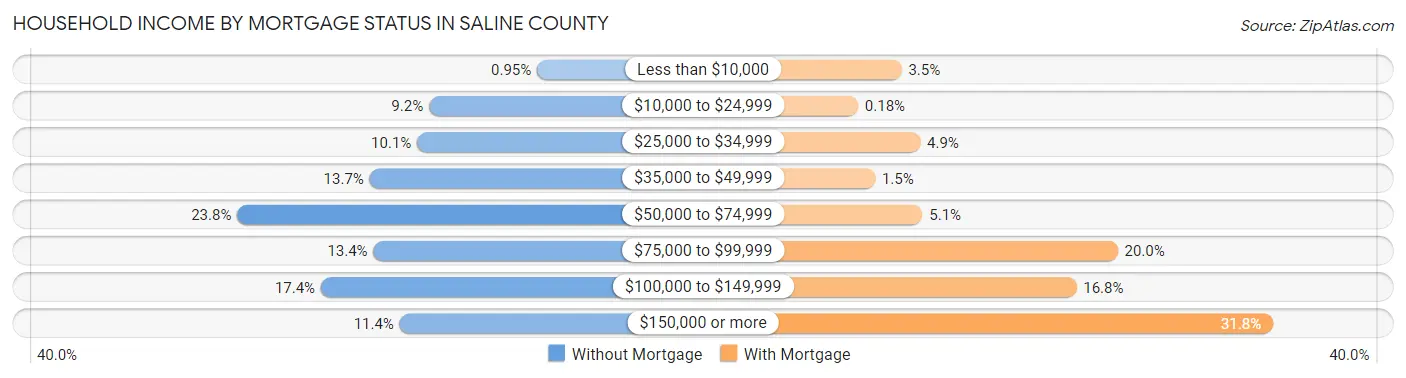
| Household Income | Without Mortgage | With Mortgage |
| Less than $10,000 | 20 (0.9%) | 59 (3.5%) |
| $10,000 to $24,999 | 193 (9.2%) | 3 (0.2%) |
| $25,000 to $34,999 | 212 (10.1%) | 83 (4.9%) |
| $35,000 to $49,999 | 288 (13.7%) | 25 (1.5%) |
| $50,000 to $74,999 | 500 (23.8%) | 86 (5.1%) |
| $75,000 to $99,999 | 282 (13.4%) | 337 (20.0%) |
| $100,000 to $149,999 | 366 (17.4%) | 284 (16.8%) |
| $150,000 or more | 240 (11.4%) | 537 (31.8%) |
| Total | 2,101 (100.0%) | 1,688 (100.0%) |
Property Value to Household Income Ratio in Saline County
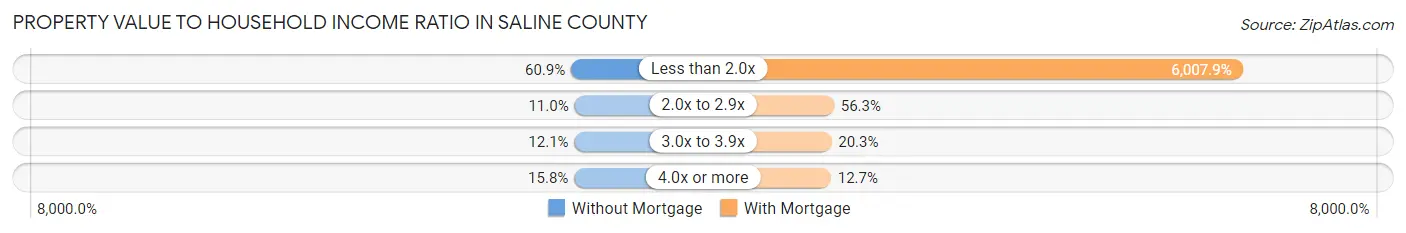
| Value-to-Income Ratio | Without Mortgage | With Mortgage |
| Less than 2.0x | 1,280 (60.9%) | 101,413 (6,007.9%) |
| 2.0x to 2.9x | 232 (11.0%) | 950 (56.3%) |
| 3.0x to 3.9x | 255 (12.1%) | 343 (20.3%) |
| 4.0x or more | 332 (15.8%) | 215 (12.7%) |
| Total | 2,101 (100.0%) | 1,688 (100.0%) |
Real Estate Taxes by Mortgage Status in Saline County
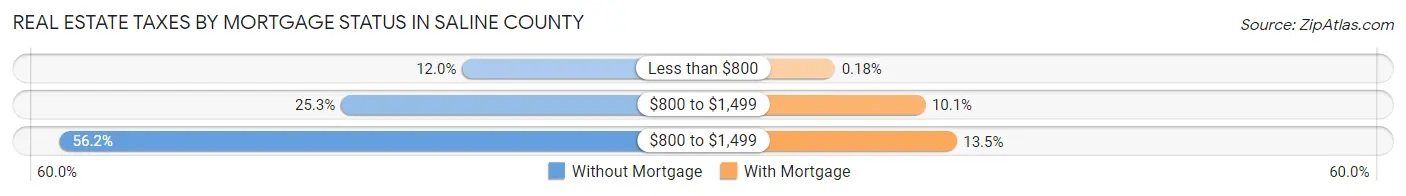
| Property Taxes | Without Mortgage | With Mortgage |
| Less than $800 | 253 (12.0%) | 3 (0.2%) |
| $800 to $1,499 | 532 (25.3%) | 170 (10.1%) |
| $800 to $1,499 | 1,180 (56.2%) | 228 (13.5%) |
| Total | 2,101 (100.0%) | 1,688 (100.0%) |
Health & Disability in Saline County
Health Insurance Coverage by Age in Saline County
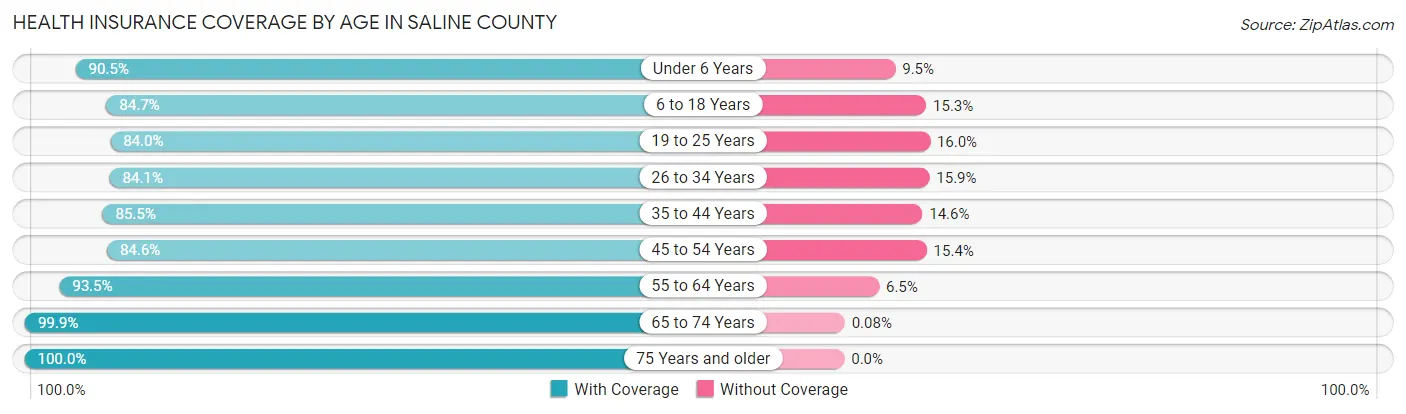
| Age Bracket | With Coverage | Without Coverage |
| Under 6 Years | 971 (90.5%) | 102 (9.5%) |
| 6 to 18 Years | 2,415 (84.7%) | 435 (15.3%) |
| 19 to 25 Years | 968 (84.0%) | 184 (16.0%) |
| 26 to 34 Years | 1,109 (84.1%) | 209 (15.9%) |
| 35 to 44 Years | 1,503 (85.5%) | 256 (14.5%) |
| 45 to 54 Years | 1,604 (84.6%) | 291 (15.4%) |
| 55 to 64 Years | 1,704 (93.5%) | 118 (6.5%) |
| 65 to 74 Years | 1,234 (99.9%) | 1 (0.1%) |
| 75 Years and older | 931 (100.0%) | 0 (0.0%) |
| Total | 12,439 (88.6%) | 1,596 (11.4%) |
Health Insurance Coverage by Citizenship Status in Saline County
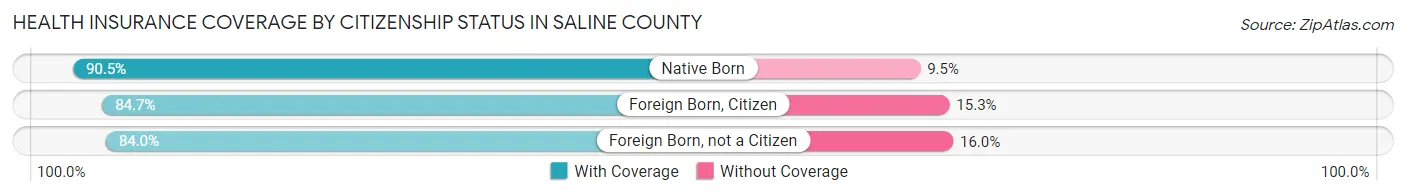
| Citizenship Status | With Coverage | Without Coverage |
| Native Born | 971 (90.5%) | 102 (9.5%) |
| Foreign Born, Citizen | 2,415 (84.7%) | 435 (15.3%) |
| Foreign Born, not a Citizen | 968 (84.0%) | 184 (16.0%) |
Health Insurance Coverage by Household Income in Saline County
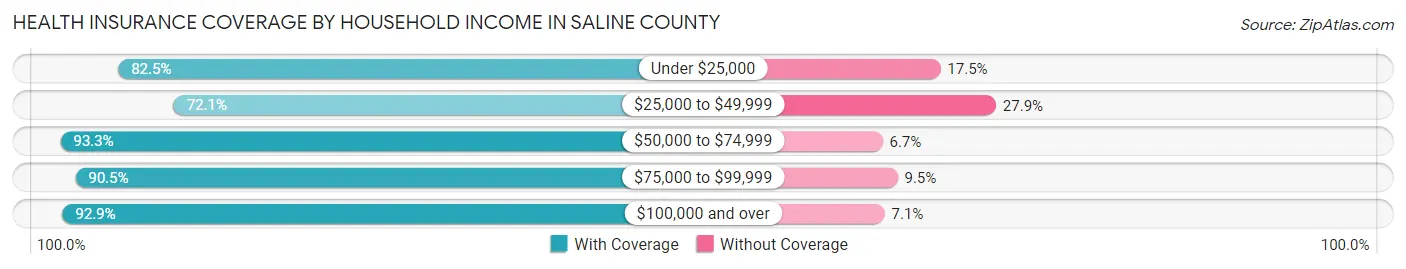
| Household Income | With Coverage | Without Coverage |
| Under $25,000 | 1,133 (82.5%) | 241 (17.5%) |
| $25,000 to $49,999 | 1,581 (72.1%) | 613 (27.9%) |
| $50,000 to $74,999 | 2,511 (93.3%) | 180 (6.7%) |
| $75,000 to $99,999 | 1,657 (90.5%) | 174 (9.5%) |
| $100,000 and over | 5,053 (92.9%) | 385 (7.1%) |
Public vs Private Health Insurance Coverage by Age in Saline County
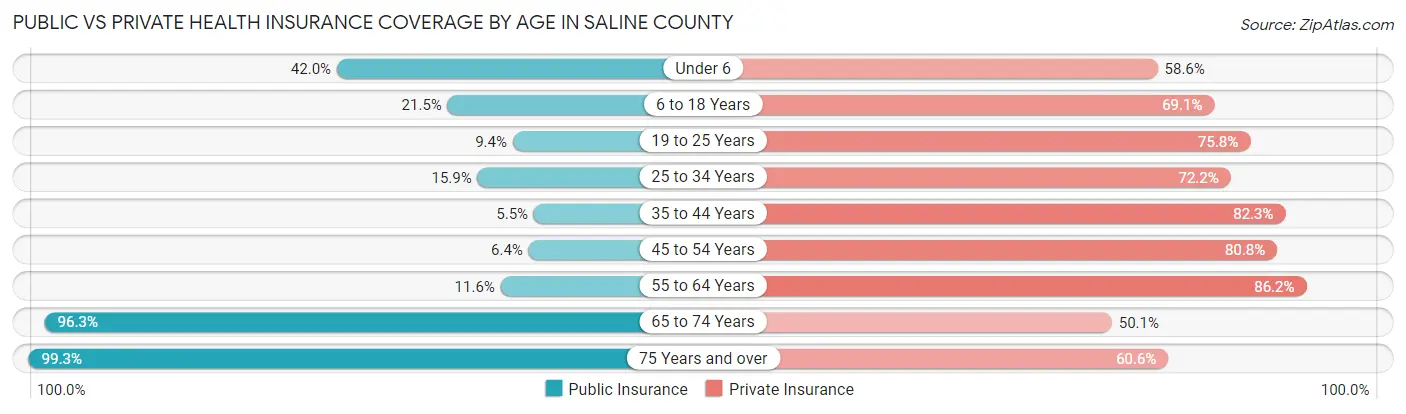
| Age Bracket | Public Insurance | Private Insurance |
| Under 6 | 451 (42.0%) | 629 (58.6%) |
| 6 to 18 Years | 612 (21.5%) | 1,970 (69.1%) |
| 19 to 25 Years | 108 (9.4%) | 873 (75.8%) |
| 25 to 34 Years | 210 (15.9%) | 951 (72.2%) |
| 35 to 44 Years | 96 (5.5%) | 1,448 (82.3%) |
| 45 to 54 Years | 122 (6.4%) | 1,531 (80.8%) |
| 55 to 64 Years | 212 (11.6%) | 1,571 (86.2%) |
| 65 to 74 Years | 1,189 (96.3%) | 619 (50.1%) |
| 75 Years and over | 924 (99.3%) | 564 (60.6%) |
| Total | 3,924 (28.0%) | 10,156 (72.4%) |
Disability Status by Sex by Age in Saline County
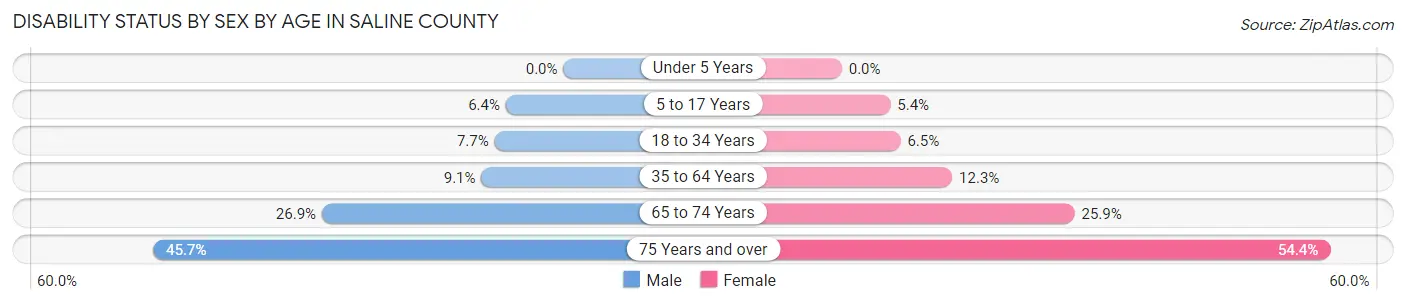
| Age Bracket | Male | Female |
| Under 5 Years | 0 (0.0%) | 0 (0.0%) |
| 5 to 17 Years | 88 (6.4%) | 73 (5.4%) |
| 18 to 34 Years | 109 (7.7%) | 84 (6.5%) |
| 35 to 64 Years | 266 (9.1%) | 315 (12.3%) |
| 65 to 74 Years | 164 (26.9%) | 162 (25.9%) |
| 75 Years and over | 180 (45.7%) | 292 (54.4%) |
Disability Class by Sex by Age in Saline County
Disability Class: Hearing Difficulty
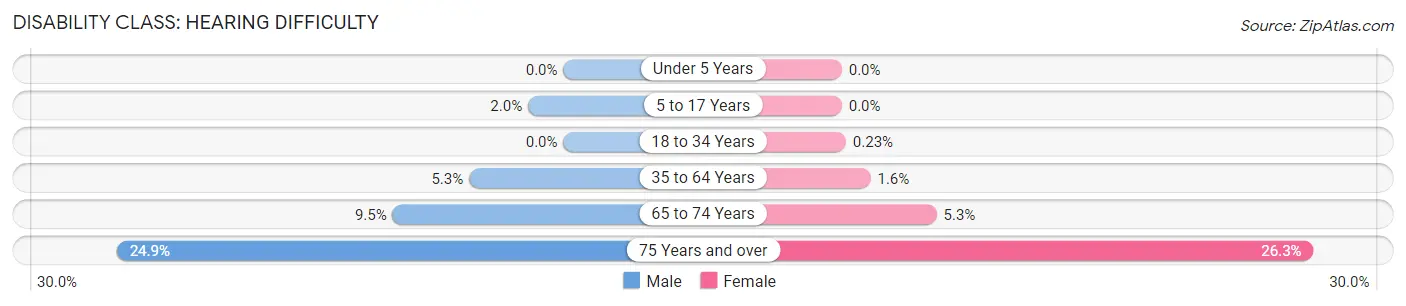
| Age Bracket | Male | Female |
| Under 5 Years | 0 (0.0%) | 0 (0.0%) |
| 5 to 17 Years | 27 (2.0%) | 0 (0.0%) |
| 18 to 34 Years | 0 (0.0%) | 3 (0.2%) |
| 35 to 64 Years | 153 (5.2%) | 41 (1.6%) |
| 65 to 74 Years | 58 (9.5%) | 33 (5.3%) |
| 75 Years and over | 98 (24.9%) | 141 (26.3%) |
Disability Class: Vision Difficulty
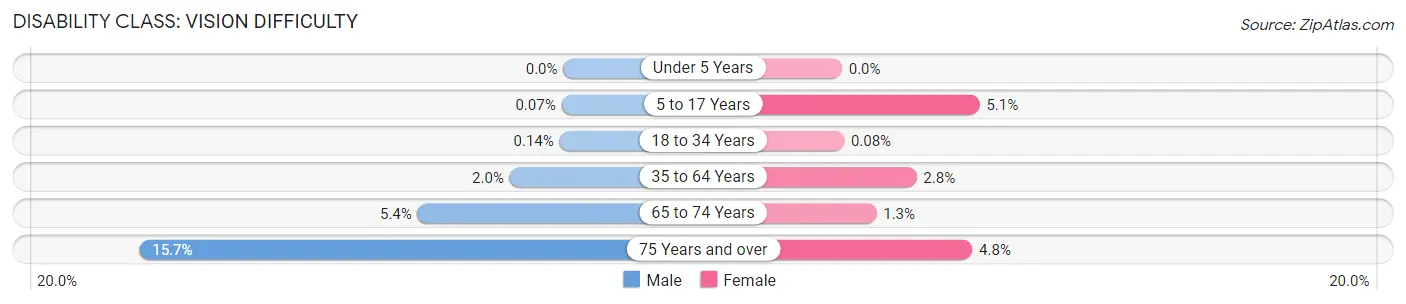
| Age Bracket | Male | Female |
| Under 5 Years | 0 (0.0%) | 0 (0.0%) |
| 5 to 17 Years | 1 (0.1%) | 69 (5.1%) |
| 18 to 34 Years | 2 (0.1%) | 1 (0.1%) |
| 35 to 64 Years | 58 (2.0%) | 71 (2.8%) |
| 65 to 74 Years | 33 (5.4%) | 8 (1.3%) |
| 75 Years and over | 62 (15.7%) | 26 (4.8%) |
Disability Class: Cognitive Difficulty
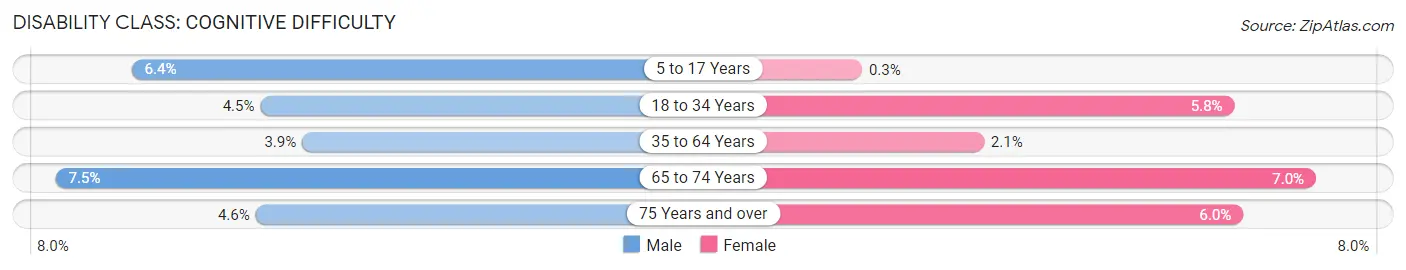
| Age Bracket | Male | Female |
| 5 to 17 Years | 88 (6.4%) | 4 (0.3%) |
| 18 to 34 Years | 64 (4.5%) | 75 (5.8%) |
| 35 to 64 Years | 113 (3.9%) | 54 (2.1%) |
| 65 to 74 Years | 46 (7.5%) | 44 (7.0%) |
| 75 Years and over | 18 (4.6%) | 32 (6.0%) |
Disability Class: Ambulatory Difficulty
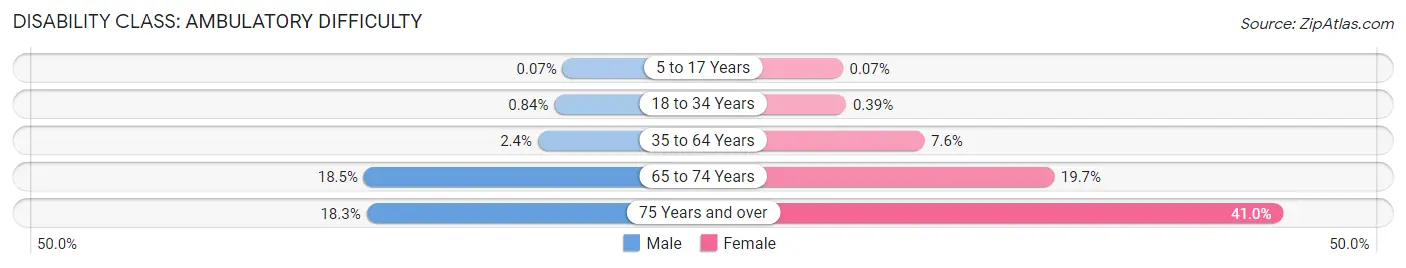
| Age Bracket | Male | Female |
| 5 to 17 Years | 1 (0.1%) | 1 (0.1%) |
| 18 to 34 Years | 12 (0.8%) | 5 (0.4%) |
| 35 to 64 Years | 69 (2.4%) | 196 (7.6%) |
| 65 to 74 Years | 113 (18.5%) | 123 (19.7%) |
| 75 Years and over | 72 (18.3%) | 220 (41.0%) |
Disability Class: Self-Care Difficulty
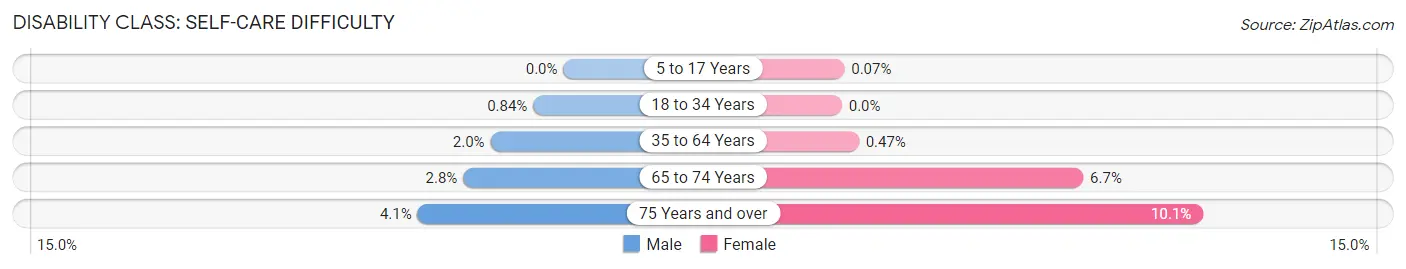
| Age Bracket | Male | Female |
| 5 to 17 Years | 0 (0.0%) | 1 (0.1%) |
| 18 to 34 Years | 12 (0.8%) | 0 (0.0%) |
| 35 to 64 Years | 59 (2.0%) | 12 (0.5%) |
| 65 to 74 Years | 17 (2.8%) | 42 (6.7%) |
| 75 Years and over | 16 (4.1%) | 54 (10.1%) |
Technology Access in Saline County
Computing Device Access in Saline County
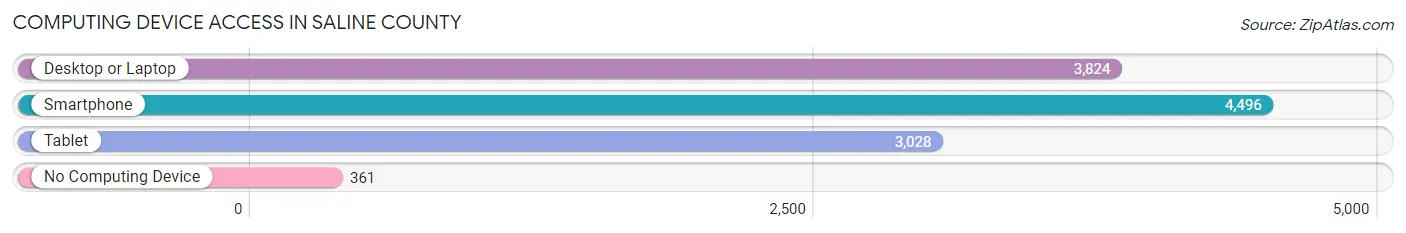
| Device Type | # Households | % Households |
| Desktop or Laptop | 3,824 | 74.4% |
| Smartphone | 4,496 | 87.5% |
| Tablet | 3,028 | 58.9% |
| No Computing Device | 361 | 7.0% |
| Total | 5,137 | 100.0% |
Internet Access in Saline County
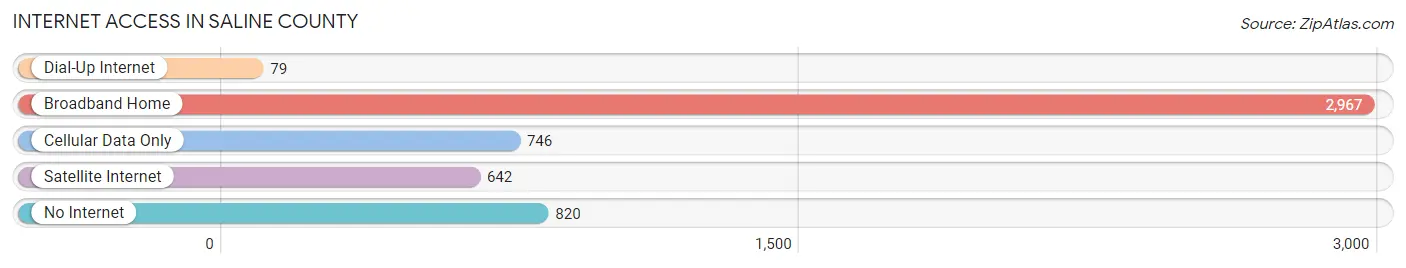
| Internet Type | # Households | % Households |
| Dial-Up Internet | 79 | 1.5% |
| Broadband Home | 2,967 | 57.8% |
| Cellular Data Only | 746 | 14.5% |
| Satellite Internet | 642 | 12.5% |
| No Internet | 820 | 16.0% |
| Total | 5,137 | 100.0% |
Saline County Summary
Saline County is located in the southeastern corner of Nebraska, and is bordered by the states of Kansas and Missouri. It is part of the Lincoln, NE Metropolitan Statistical Area. The county was established in 1855 and named for the saline springs that were found in the area. As of the 2010 census, the population was 14,200.
Geography
Saline County covers an area of 576 square miles, making it the second smallest county in Nebraska. The county is mostly flat, with some rolling hills in the western part. The Republican River flows through the county, and there are several small lakes and ponds scattered throughout. The county is mostly rural, with the majority of the population living in the small towns of Wilber, Crete, and Dorchester.
Climate
Saline County has a humid continental climate, with hot summers and cold winters. The average annual temperature is around 50°F, and the average annual precipitation is around 30 inches.
Demographics
As of the 2010 census, the population of Saline County was 14,200, with a population density of 24.7 people per square mile. The racial makeup of the county was 95.3% White, 0.7% African American, 0.4% Native American, 0.5% Asian, 0.1% Pacific Islander, 1.7% from other races, and 1.3% from two or more races. Hispanic or Latino of any race were 4.2% of the population.
Economy
The economy of Saline County is largely based on agriculture. The county is home to several large farms, and the main crops grown are corn, soybeans, and wheat. The county also has a thriving livestock industry, with cattle, hogs, and sheep being the main animals raised.
In addition to agriculture, Saline County also has a strong manufacturing sector. The county is home to several factories that produce a variety of products, including furniture, clothing, and automotive parts.
The county also has a growing tourism industry, with several attractions, such as the Wilber Czech Festival, the Crete Carousel, and the Dorchester State Historical Park.
Conclusion
Saline County is a rural county located in the southeastern corner of Nebraska. It is home to a diverse population, and the economy is largely based on agriculture and manufacturing. The county also has a growing tourism industry, with several attractions that draw visitors from all over the state.
Common Questions
What is the Total Population of Saline County?
Total Population of Saline County is 14,275.
What is the Total Male Population of Saline County?
Total Male Population of Saline County is 7,286.
What is the Total Female Population of Saline County?
Total Female Population of Saline County is 6,989.
What is the Ratio of Males per 100 Females in Saline County?
There are 104.25 Males per 100 Females in Saline County.
What is the Ratio of Females per 100 Males in Saline County?
There are 95.92 Females per 100 Males in Saline County.
What is the Median Population Age in Saline County?
Median Population Age in Saline County is 38.6 Years.
What is the Average Family Size in Saline County
Average Family Size in Saline County is 3.0 People.
What is the Average Household Size in Saline County
Average Household Size in Saline County is 2.6 People.
What is Per Capita Income in Saline County?
Per Capita income in Saline County is $32,563.
What is the Median Family Income in Saline County?
Median Family Income in Saline County is $83,048.
What is the Median Household income in Saline County?
Median Household Income in Saline County is $71,104.
What is Income or Wage Gap in Saline County?
Income or Wage Gap in Saline County is 31.7%.
Women in Saline County earn 68.3 cents for every dollar earned by a man.
What is Family Income Deficit in Saline County?
Family Income Deficit in Saline County is $8,532.
Families that are below poverty line in Saline County earn $8,532 less on average than the poverty threshold level.
What is Inequality or Gini Index in Saline County?
Inequality or Gini Index in Saline County is 0.41.
How Large is the Labor Force in Saline County?
There are 7,369 People in the Labor Forcein in Saline County.
What is the Percentage of People in the Labor Force in Saline County?
67.2% of People are in the Labor Force in Saline County.
What is the Unemployment Rate in Saline County?
Unemployment Rate in Saline County is 2.1%.