Hamilton County, NE
Hamilton County Overview
9,400
TOTAL POPULATION
4,738
MALE POPULATION
4,662
FEMALE POPULATION
101.63
MALES / 100 FEMALES
98.40
FEMALES / 100 MALES
41.3
MEDIAN AGE
3.1
AVG FAMILY SIZE
2.6
AVG HOUSEHOLD SIZE
$34,813
PER CAPITA INCOME
$90,913
AVG FAMILY INCOME
$73,254
AVG HOUSEHOLD INCOME
42.1%
WAGE / INCOME GAP [ % ]
57.9¢/ $1
WAGE / INCOME GAP [ $ ]
0.37
INEQUALITY / GINI INDEX
4,906
LABOR FORCE [ PEOPLE ]
66.9%
PERCENT IN LABOR FORCE
3.6%
UNEMPLOYMENT RATE
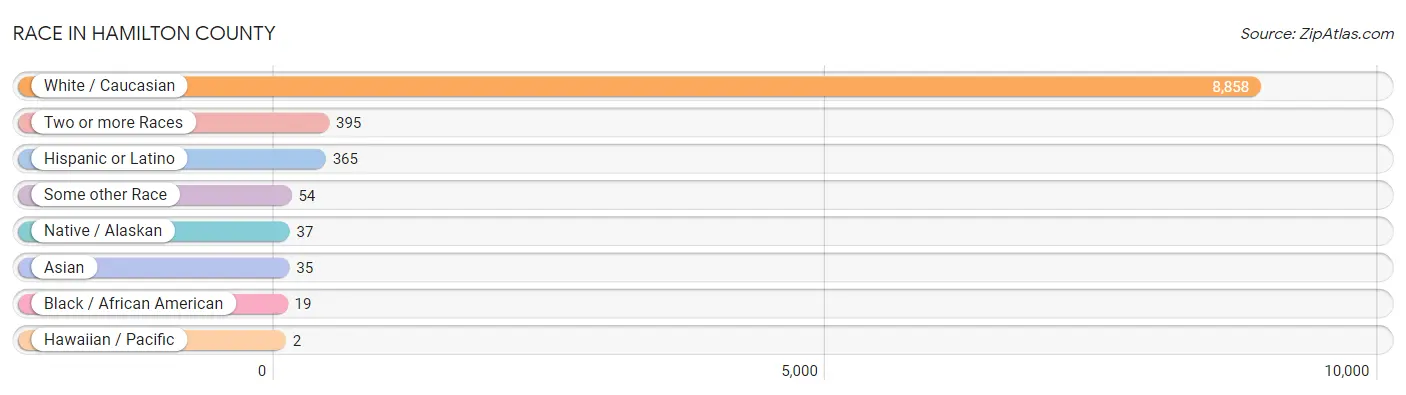
Race in Hamilton County
The most populous races in Hamilton County are White / Caucasian (8,858 | 94.2%), Two or more Races (395 | 4.2%), and Hispanic or Latino (365 | 3.9%).
| Race | # Population | % Population |
| Asian | 35 | 0.4% |
| Black / African American | 19 | 0.2% |
| Hawaiian / Pacific | 2 | 0.0% |
| Hispanic or Latino | 365 | 3.9% |
| Native / Alaskan | 37 | 0.4% |
| White / Caucasian | 8,858 | 94.2% |
| Two or more Races | 395 | 4.2% |
| Some other Race | 54 | 0.6% |
| Total | 9,400 | 100.0% |
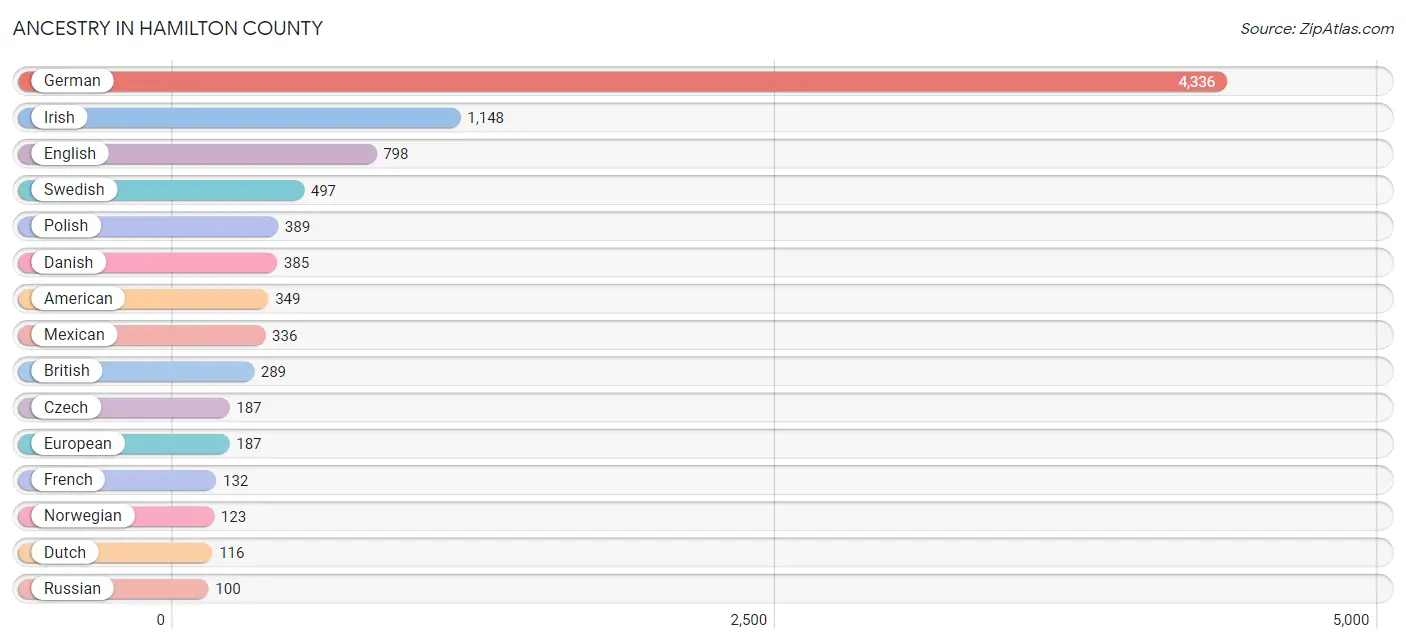
Ancestry in Hamilton County
The most populous ancestries reported in Hamilton County are German (4,336 | 46.1%), Irish (1,148 | 12.2%), English (798 | 8.5%), Swedish (497 | 5.3%), and Polish (389 | 4.1%), together accounting for 76.3% of all Hamilton County residents.
| Ancestry | # Population | % Population |
| American | 349 | 3.7% |
| Australian | 5 | 0.1% |
| Belgian | 10 | 0.1% |
| Bhutanese | 35 | 0.4% |
| British | 289 | 3.1% |
| Burmese | 5 | 0.1% |
| Celtic | 30 | 0.3% |
| Central American | 19 | 0.2% |
| Cherokee | 15 | 0.2% |
| Cheyenne | 14 | 0.2% |
| Comanche | 2 | 0.0% |
| Cuban | 1 | 0.0% |
| Czech | 187 | 2.0% |
| Czechoslovakian | 1 | 0.0% |
| Danish | 385 | 4.1% |
| Dutch | 116 | 1.2% |
| English | 798 | 8.5% |
| European | 187 | 2.0% |
| Finnish | 9 | 0.1% |
| French | 132 | 1.4% |
| French Canadian | 1 | 0.0% |
| German | 4,336 | 46.1% |
| Guatemalan | 12 | 0.1% |
| Haitian | 7 | 0.1% |
| Honduran | 7 | 0.1% |
| Hungarian | 3 | 0.0% |
| Irish | 1,148 | 12.2% |
| Italian | 78 | 0.8% |
| Mexican | 336 | 3.6% |
| Mexican American Indian | 4 | 0.0% |
| Norwegian | 123 | 1.3% |
| Pakistani | 1 | 0.0% |
| Pennsylvania German | 10 | 0.1% |
| Polish | 389 | 4.1% |
| Russian | 100 | 1.1% |
| Samoan | 2 | 0.0% |
| Scandinavian | 64 | 0.7% |
| Scotch-Irish | 49 | 0.5% |
| Scottish | 87 | 0.9% |
| Sioux | 37 | 0.4% |
| Slovak | 6 | 0.1% |
| Spaniard | 9 | 0.1% |
| Swedish | 497 | 5.3% |
| Swiss | 65 | 0.7% |
| Welsh | 95 | 1.0% | View All 45 Rows |
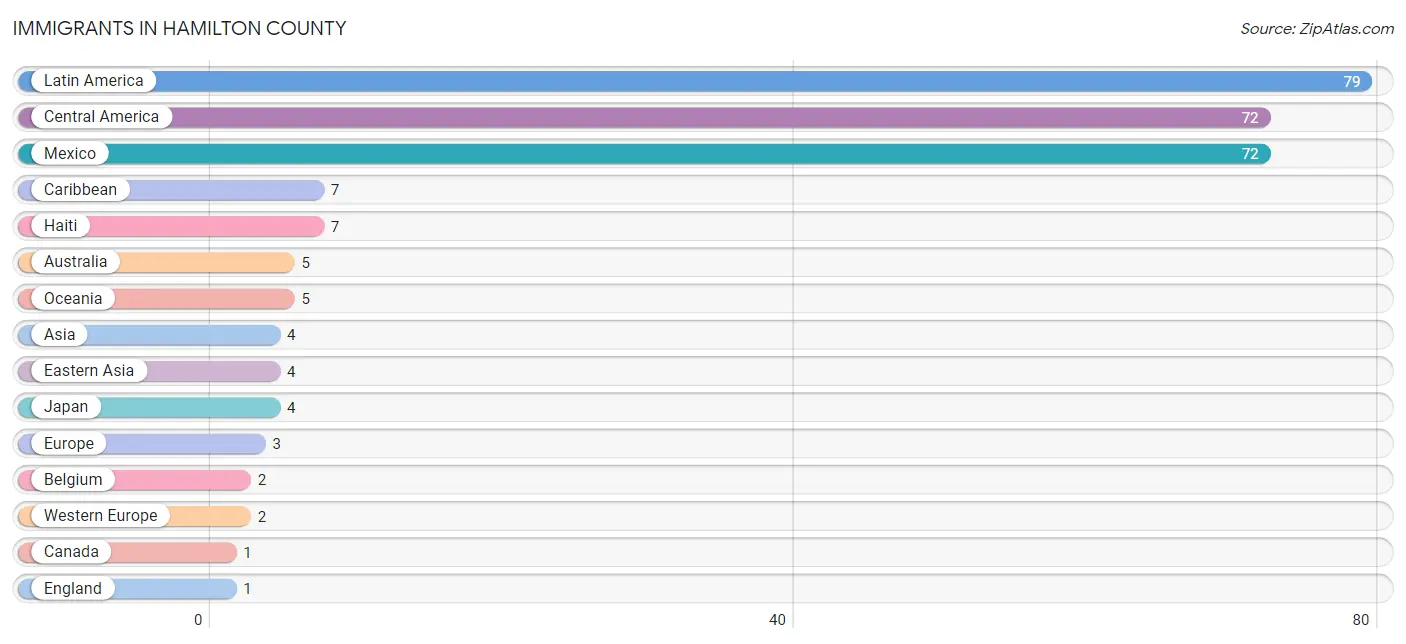
Immigrants in Hamilton County
The most numerous immigrant groups reported in Hamilton County came from Latin America (79 | 0.8%), Central America (72 | 0.8%), Mexico (72 | 0.8%), Caribbean (7 | 0.1%), and Haiti (7 | 0.1%), together accounting for 2.5% of all Hamilton County residents.
| Immigration Origin | # Population | % Population |
| Asia | 4 | 0.0% |
| Australia | 5 | 0.1% |
| Belgium | 2 | 0.0% |
| Canada | 1 | 0.0% |
| Caribbean | 7 | 0.1% |
| Central America | 72 | 0.8% |
| Eastern Asia | 4 | 0.0% |
| England | 1 | 0.0% |
| Europe | 3 | 0.0% |
| Haiti | 7 | 0.1% |
| Japan | 4 | 0.0% |
| Latin America | 79 | 0.8% |
| Mexico | 72 | 0.8% |
| Northern Europe | 1 | 0.0% |
| Oceania | 5 | 0.1% |
| Western Europe | 2 | 0.0% | View All 16 Rows |
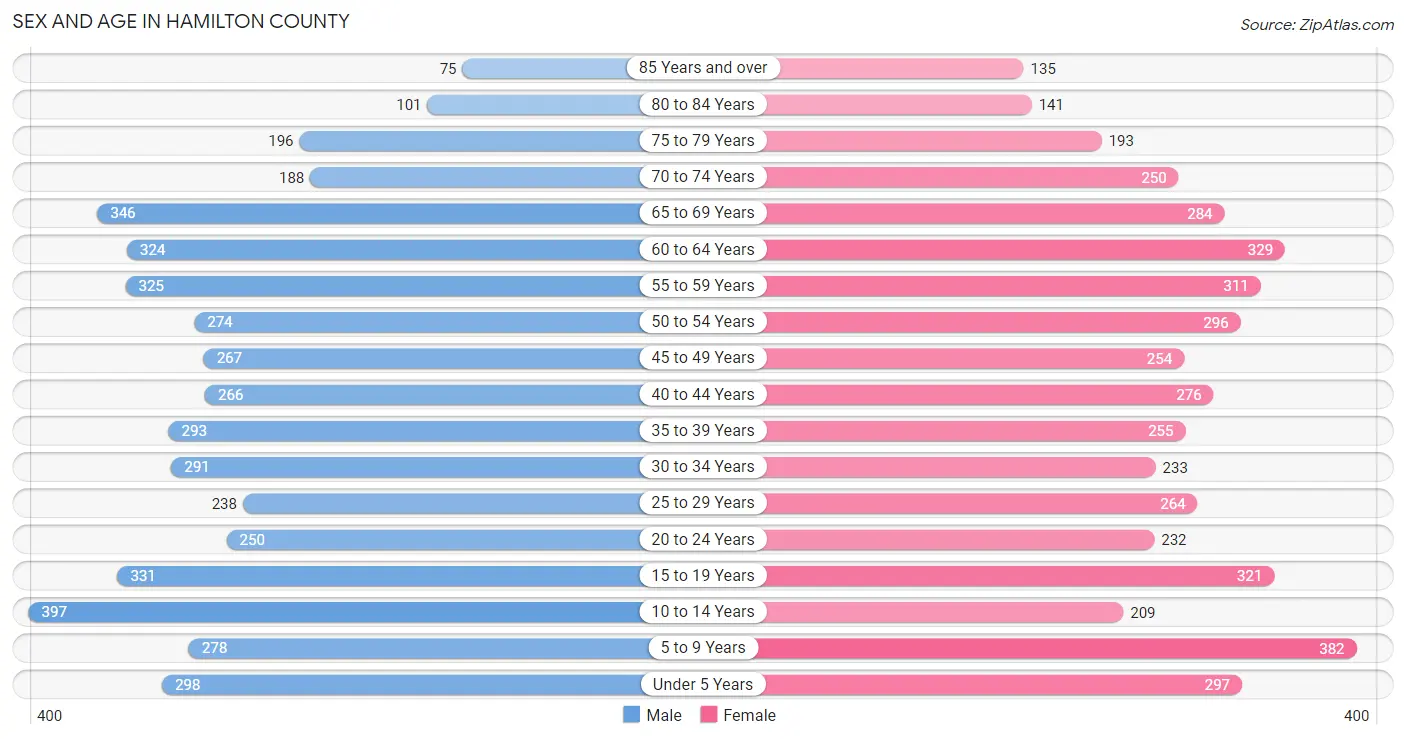
Sex and Age in Hamilton County
Sex and Age in Hamilton County
The most populous age groups in Hamilton County are 10 to 14 Years (397 | 8.4%) for men and 5 to 9 Years (382 | 8.2%) for women.
| Age Bracket | Male | Female |
| Under 5 Years | 298 (6.3%) | 297 (6.4%) |
| 5 to 9 Years | 278 (5.9%) | 382 (8.2%) |
| 10 to 14 Years | 397 (8.4%) | 209 (4.5%) |
| 15 to 19 Years | 331 (7.0%) | 321 (6.9%) |
| 20 to 24 Years | 250 (5.3%) | 232 (5.0%) |
| 25 to 29 Years | 238 (5.0%) | 264 (5.7%) |
| 30 to 34 Years | 291 (6.1%) | 233 (5.0%) |
| 35 to 39 Years | 293 (6.2%) | 255 (5.5%) |
| 40 to 44 Years | 266 (5.6%) | 276 (5.9%) |
| 45 to 49 Years | 267 (5.6%) | 254 (5.4%) |
| 50 to 54 Years | 274 (5.8%) | 296 (6.4%) |
| 55 to 59 Years | 325 (6.9%) | 311 (6.7%) |
| 60 to 64 Years | 324 (6.8%) | 329 (7.1%) |
| 65 to 69 Years | 346 (7.3%) | 284 (6.1%) |
| 70 to 74 Years | 188 (4.0%) | 250 (5.4%) |
| 75 to 79 Years | 196 (4.1%) | 193 (4.1%) |
| 80 to 84 Years | 101 (2.1%) | 141 (3.0%) |
| 85 Years and over | 75 (1.6%) | 135 (2.9%) |
| Total | 4,738 (100.0%) | 4,662 (100.0%) |
Families and Households in Hamilton County
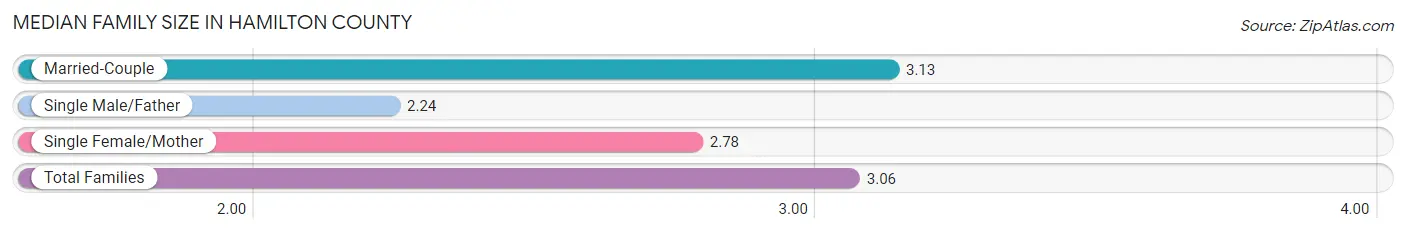
Median Family Size in Hamilton County
The median family size in Hamilton County is 3.06 persons per family, with married-couple families (2,275 | 85.7%) accounting for the largest median family size of 3.13 persons per family. On the other hand, single male/father families (70 | 2.6%) represent the smallest median family size with 2.24 persons per family.
| Family Type | # Families | Family Size |
| Married-Couple | 2,275 (85.7%) | 3.13 |
| Single Male/Father | 70 (2.6%) | 2.24 |
| Single Female/Mother | 310 (11.7%) | 2.78 |
| Total Families | 2,655 (100.0%) | 3.06 |
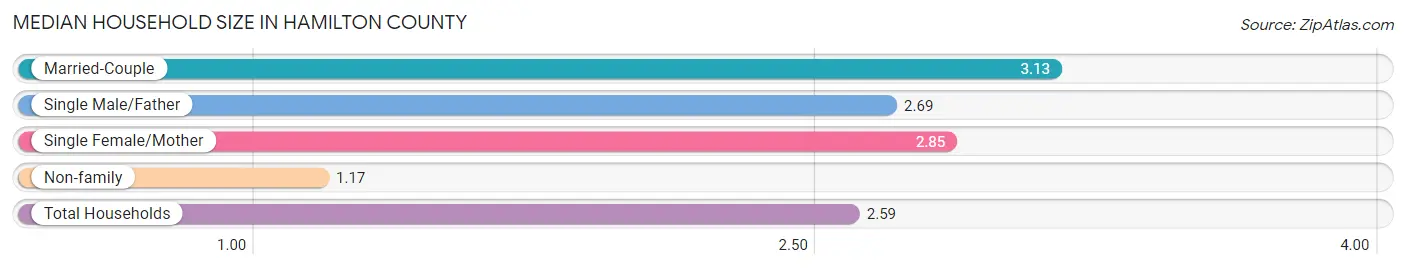
Median Household Size in Hamilton County
The median household size in Hamilton County is 2.59 persons per household, with married-couple households (2,275 | 63.6%) accounting for the largest median household size of 3.13 persons per household. non-family households (922 | 25.8%) represent the smallest median household size with 1.17 persons per household.
| Household Type | # Households | Household Size |
| Married-Couple | 2,275 (63.6%) | 3.13 |
| Single Male/Father | 70 (2.0%) | 2.69 |
| Single Female/Mother | 310 (8.7%) | 2.85 |
| Non-family | 922 (25.8%) | 1.17 |
| Total Households | 3,577 (100.0%) | 2.59 |
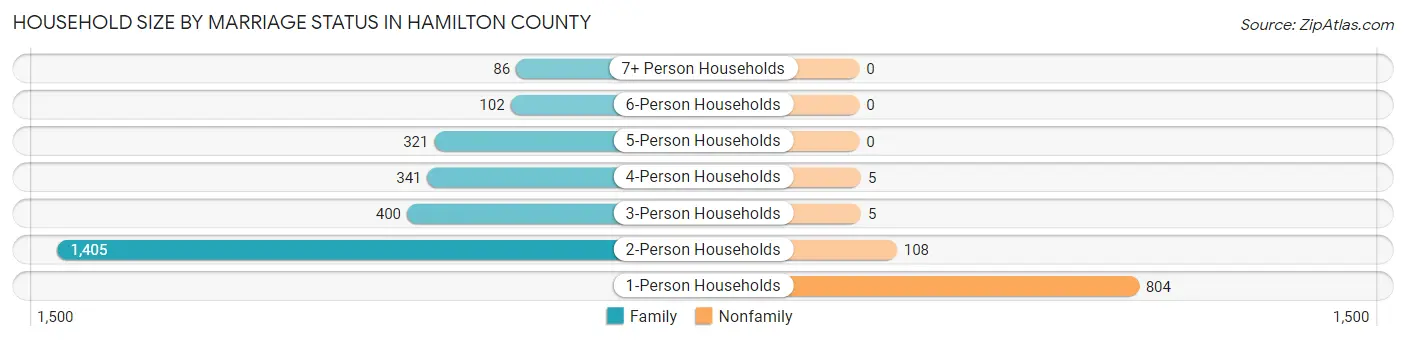
Household Size by Marriage Status in Hamilton County
Out of a total of 3,577 households in Hamilton County, 2,655 (74.2%) are family households, while 922 (25.8%) are nonfamily households. The most numerous type of family households are 2-person households, comprising 1,405, and the most common type of nonfamily households are 1-person households, comprising 804.
| Household Size | Family Households | Nonfamily Households |
| 1-Person Households | - | 804 (22.5%) |
| 2-Person Households | 1,405 (39.3%) | 108 (3.0%) |
| 3-Person Households | 400 (11.2%) | 5 (0.1%) |
| 4-Person Households | 341 (9.5%) | 5 (0.1%) |
| 5-Person Households | 321 (9.0%) | 0 (0.0%) |
| 6-Person Households | 102 (2.9%) | 0 (0.0%) |
| 7+ Person Households | 86 (2.4%) | 0 (0.0%) |
| Total | 2,655 (74.2%) | 922 (25.8%) |
Female Fertility in Hamilton County
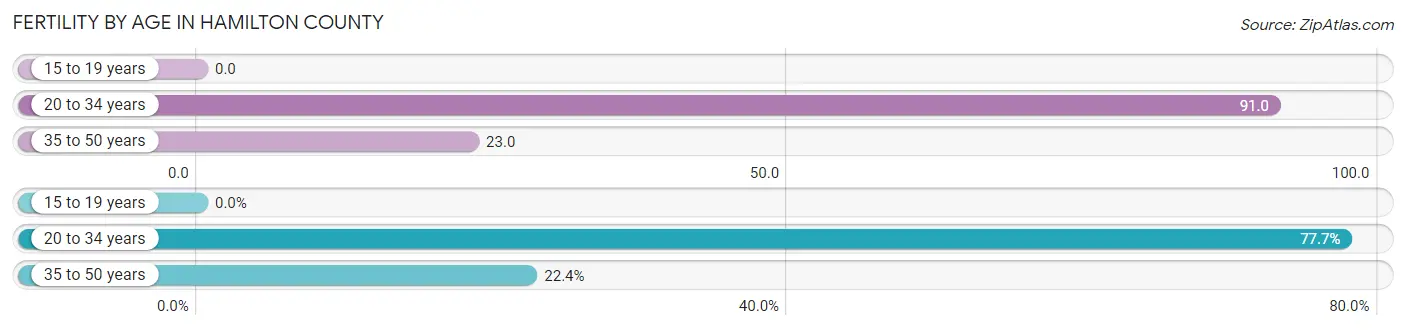
Fertility by Age in Hamilton County
Average fertility rate in Hamilton County is 45.0 births per 1,000 women. Women in the age bracket of 20 to 34 years have the highest fertility rate with 91.0 births per 1,000 women. Women in the age bracket of 20 to 34 years acount for 77.6% of all women with births.
| Age Bracket | Women with Births | Births / 1,000 Women |
| 15 to 19 years | 0 (0.0%) | 0.0 |
| 20 to 34 years | 66 (77.6%) | 91.0 |
| 35 to 50 years | 19 (22.4%) | 23.0 |
| Total | 85 (100.0%) | 45.0 |
Fertility by Age by Marriage Status in Hamilton County
98.8% of women with births (85) in Hamilton County are married. The highest percentage of unmarried women with births falls into 20 to 34 years age bracket with 1.5% of them unmarried at the time of birth, while the lowest percentage of unmarried women with births belong to 35 to 50 years age bracket with 0.0% of them unmarried.
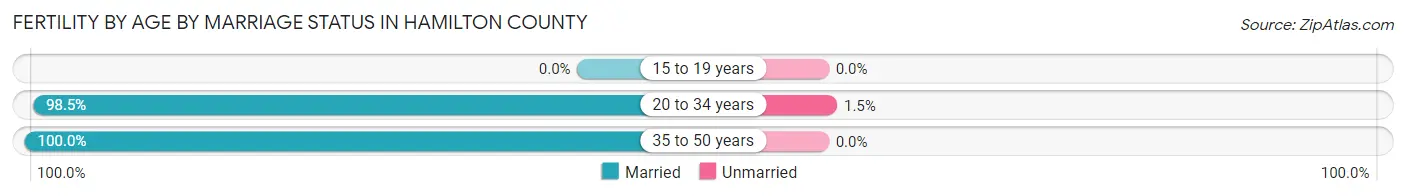
| Age Bracket | Married | Unmarried |
| 15 to 19 years | 0 (0.0%) | 0 (0.0%) |
| 20 to 34 years | 65 (98.5%) | 1 (1.5%) |
| 35 to 50 years | 19 (100.0%) | 0 (0.0%) |
| Total | 84 (98.8%) | 1 (1.2%) |
Fertility by Education in Hamilton County
Average fertility rate in Hamilton County is 45.0 births per 1,000 women. Women with the education attainment of bachelor's degree have the highest fertility rate of 101.0 births per 1,000 women, while women with the education attainment of less than high school have the lowest fertility at 4.0 births per 1,000 women. Women with the education attainment of college or associate's degree represent 49.4% of all women with births.
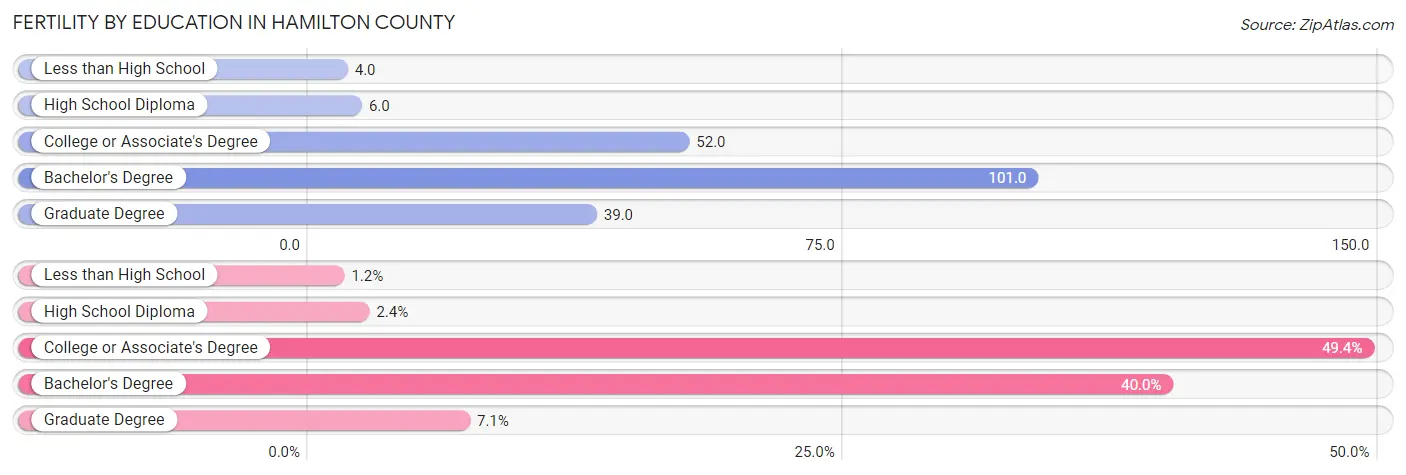
| Educational Attainment | Women with Births | Births / 1,000 Women |
| Less than High School | 1 (1.2%) | 4.0 |
| High School Diploma | 2 (2.4%) | 6.0 |
| College or Associate's Degree | 42 (49.4%) | 52.0 |
| Bachelor's Degree | 34 (40.0%) | 101.0 |
| Graduate Degree | 6 (7.1%) | 39.0 |
| Total | 85 (100.0%) | 45.0 |
Fertility by Education by Marriage Status in Hamilton County
1.2% of women with births in Hamilton County are unmarried. Women with the educational attainment of high school diploma are most likely to be married with 100.0% of them married at childbirth, while women with the educational attainment of less than high school are least likely to be married with 100.0% of them unmarried at childbirth.
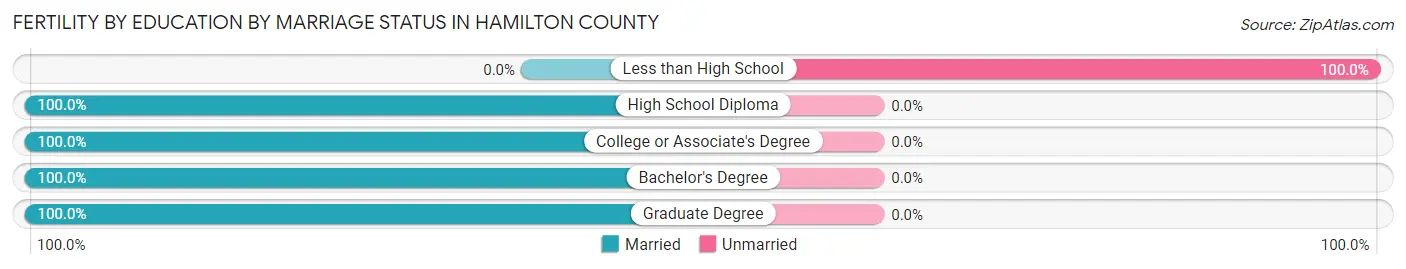
| Educational Attainment | Married | Unmarried |
| Less than High School | 0 (0.0%) | 1 (100.0%) |
| High School Diploma | 2 (100.0%) | 0 (0.0%) |
| College or Associate's Degree | 42 (100.0%) | 0 (0.0%) |
| Bachelor's Degree | 34 (100.0%) | 0 (0.0%) |
| Graduate Degree | 6 (100.0%) | 0 (0.0%) |
| Total | 84 (98.8%) | 1 (1.2%) |
Income in Hamilton County
Income Overview in Hamilton County
Per Capita Income in Hamilton County is $34,813, while median incomes of families and households are $90,913 and $73,254 respectively.
| Characteristic | Number | Measure |
| Per Capita Income | 9,400 | $34,813 |
| Median Family Income | 2,655 | $90,913 |
| Mean Family Income | 2,655 | $101,159 |
| Median Household Income | 3,577 | $73,254 |
| Mean Household Income | 3,577 | $89,045 |
| Income Deficit | 2,655 | $0 |
| Wage / Income Gap (%) | 9,400 | 42.11% |
| Wage / Income Gap ($) | 9,400 | 57.89¢ per $1 |
| Gini / Inequality Index | 9,400 | 0.37 |
Earnings by Sex in Hamilton County
Average Earnings in Hamilton County are $40,017, $51,522 for men and $29,825 for women, a difference of 42.1%.
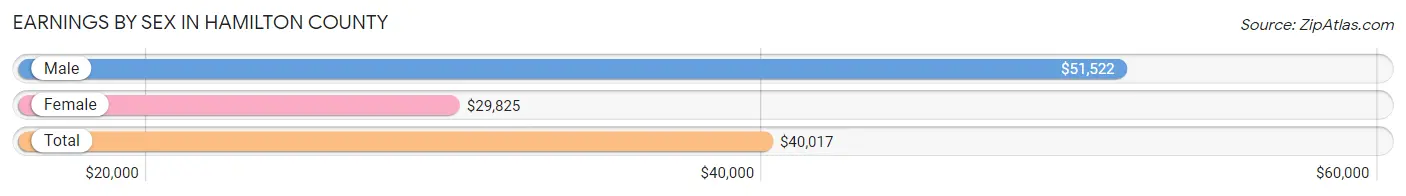
| Sex | Number | Average Earnings |
| Male | 2,743 (52.8%) | $51,522 |
| Female | 2,449 (47.2%) | $29,825 |
| Total | 5,192 (100.0%) | $40,017 |
Earnings by Sex by Income Bracket in Hamilton County
The most common earnings brackets in Hamilton County are $100,000+ for men (390 | 14.2%) and $25,000 to $29,999 for women (219 | 8.9%).
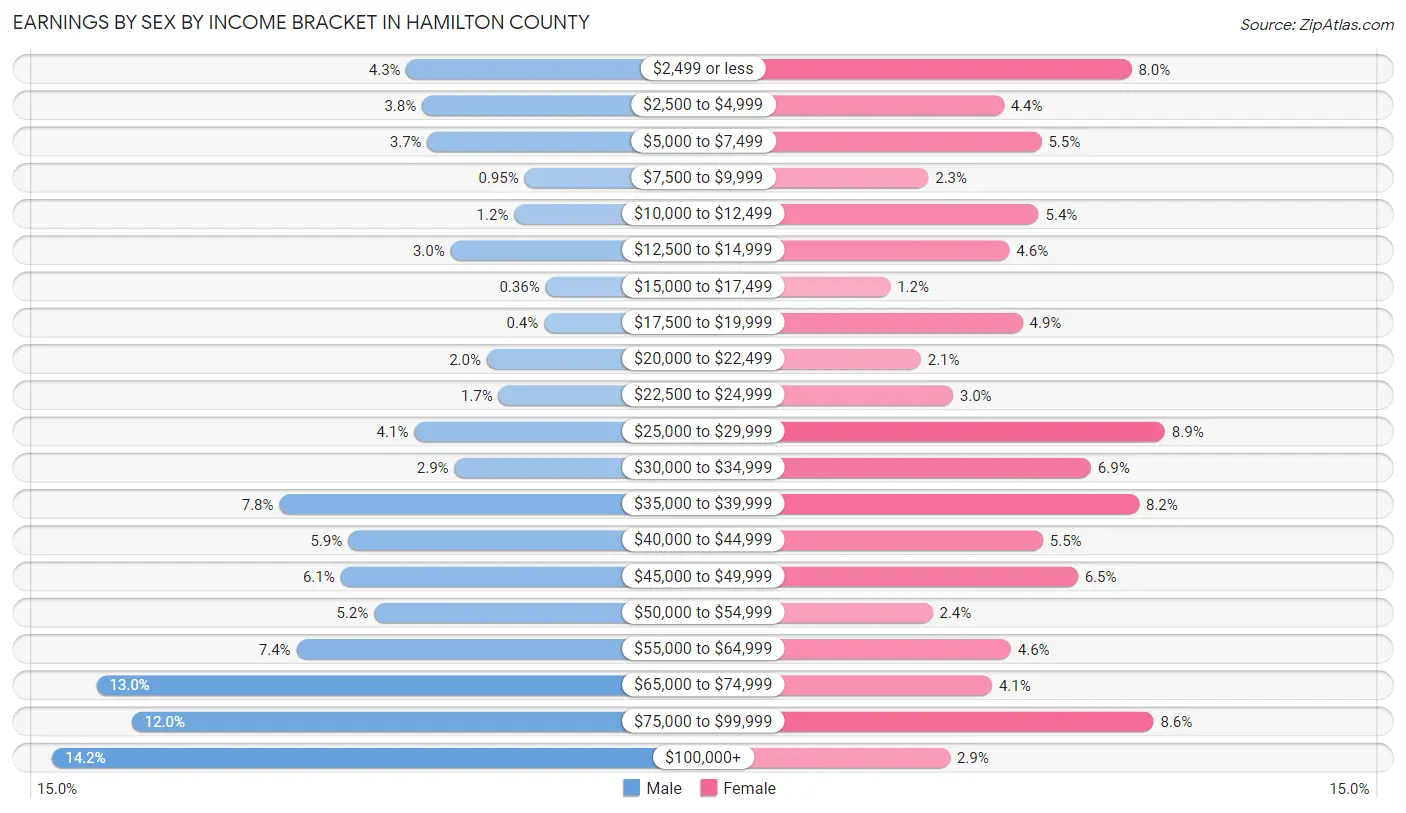
| Income | Male | Female |
| $2,499 or less | 117 (4.3%) | 196 (8.0%) |
| $2,500 to $4,999 | 105 (3.8%) | 108 (4.4%) |
| $5,000 to $7,499 | 101 (3.7%) | 134 (5.5%) |
| $7,500 to $9,999 | 26 (0.9%) | 56 (2.3%) |
| $10,000 to $12,499 | 34 (1.2%) | 132 (5.4%) |
| $12,500 to $14,999 | 83 (3.0%) | 112 (4.6%) |
| $15,000 to $17,499 | 10 (0.4%) | 30 (1.2%) |
| $17,500 to $19,999 | 11 (0.4%) | 121 (4.9%) |
| $20,000 to $22,499 | 55 (2.0%) | 51 (2.1%) |
| $22,500 to $24,999 | 46 (1.7%) | 73 (3.0%) |
| $25,000 to $29,999 | 111 (4.1%) | 219 (8.9%) |
| $30,000 to $34,999 | 80 (2.9%) | 168 (6.9%) |
| $35,000 to $39,999 | 215 (7.8%) | 201 (8.2%) |
| $40,000 to $44,999 | 162 (5.9%) | 135 (5.5%) |
| $45,000 to $49,999 | 168 (6.1%) | 159 (6.5%) |
| $50,000 to $54,999 | 142 (5.2%) | 59 (2.4%) |
| $55,000 to $64,999 | 202 (7.4%) | 113 (4.6%) |
| $65,000 to $74,999 | 356 (13.0%) | 100 (4.1%) |
| $75,000 to $99,999 | 329 (12.0%) | 211 (8.6%) |
| $100,000+ | 390 (14.2%) | 71 (2.9%) |
| Total | 2,743 (100.0%) | 2,449 (100.0%) |
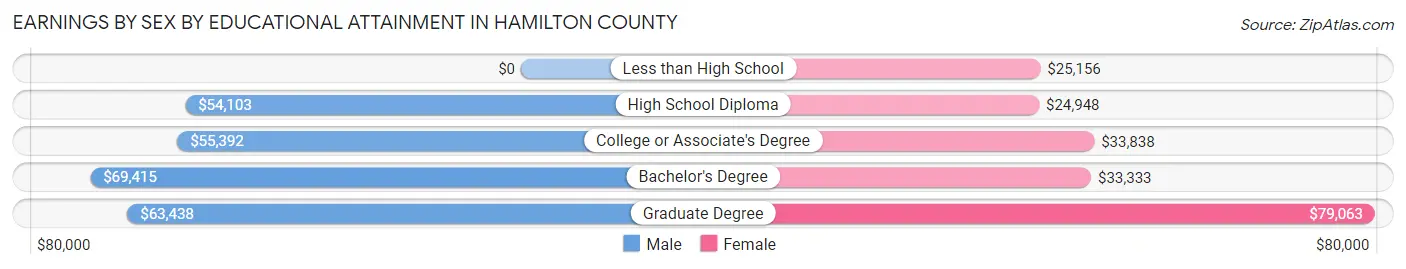
Earnings by Sex by Educational Attainment in Hamilton County
Average earnings in Hamilton County are $57,150 for men and $33,889 for women, a difference of 40.7%. Men with an educational attainment of bachelor's degree enjoy the highest average annual earnings of $69,415, while those with high school diploma education earn the least with $54,103. Women with an educational attainment of graduate degree earn the most with the average annual earnings of $79,063, while those with high school diploma education have the smallest earnings of $24,948.
| Educational Attainment | Male Income | Female Income |
| Less than High School | - | - |
| High School Diploma | $54,103 | $24,948 |
| College or Associate's Degree | $55,392 | $33,838 |
| Bachelor's Degree | $69,415 | $33,333 |
| Graduate Degree | $63,438 | $79,063 |
| Total | $57,150 | $33,889 |
Family Income in Hamilton County
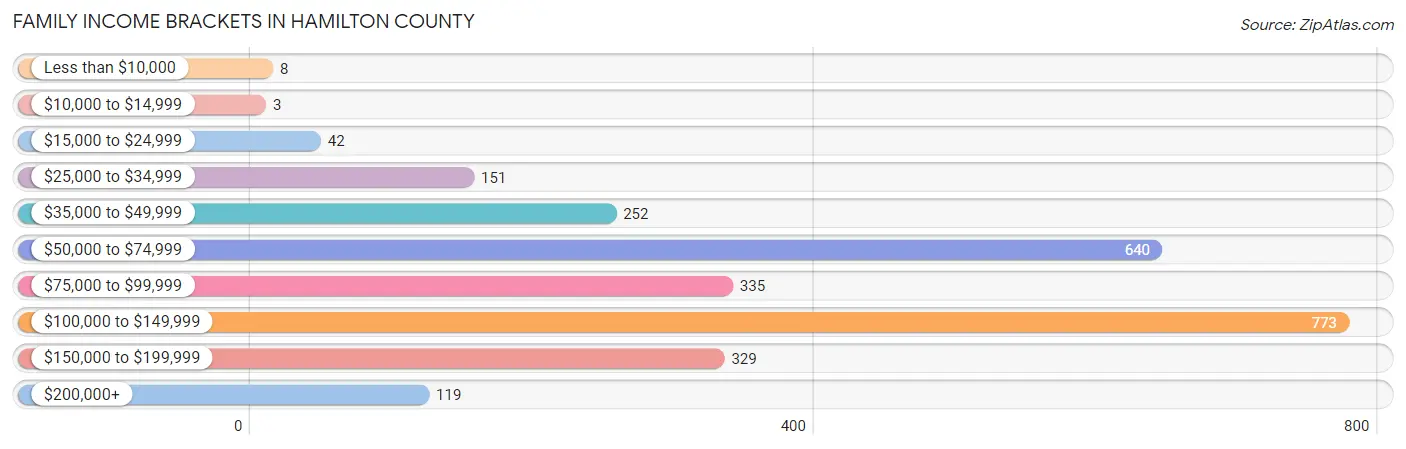
Family Income Brackets in Hamilton County
According to the Hamilton County family income data, there are 773 families falling into the $100,000 to $149,999 income range, which is the most common income bracket and makes up 29.1% of all families. Conversely, the $10,000 to $14,999 income bracket is the least frequent group with only 3 families (0.1%) belonging to this category.
| Income Bracket | # Families | % Families |
| Less than $10,000 | 8 | 0.3% |
| $10,000 to $14,999 | 3 | 0.1% |
| $15,000 to $24,999 | 42 | 1.6% |
| $25,000 to $34,999 | 151 | 5.7% |
| $35,000 to $49,999 | 252 | 9.5% |
| $50,000 to $74,999 | 640 | 24.1% |
| $75,000 to $99,999 | 335 | 12.6% |
| $100,000 to $149,999 | 773 | 29.1% |
| $150,000 to $199,999 | 329 | 12.4% |
| $200,000+ | 119 | 4.5% |
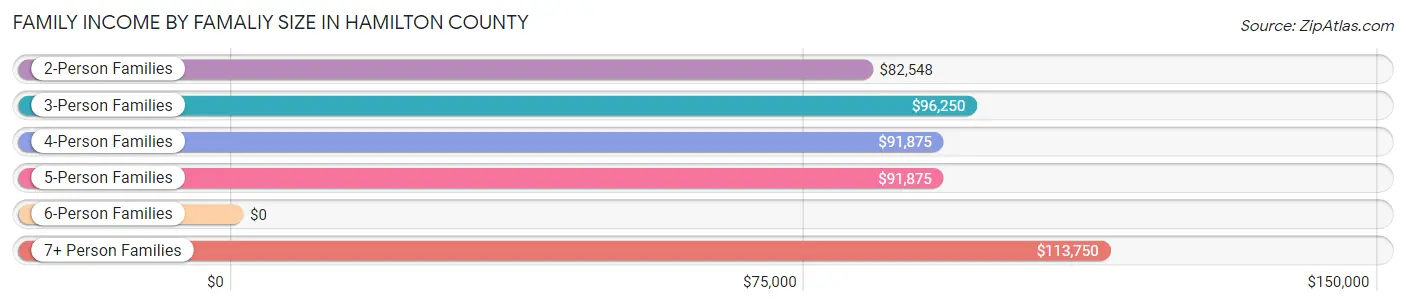
Family Income by Famaliy Size in Hamilton County
7+ person families (86 | 3.2%) account for the highest median family income in Hamilton County with $113,750 per family, while 2-person families (1,443 | 54.3%) have the highest median income of $41,274 per family member.
| Income Bracket | # Families | Median Income |
| 2-Person Families | 1,443 (54.3%) | $82,548 |
| 3-Person Families | 371 (14.0%) | $96,250 |
| 4-Person Families | 343 (12.9%) | $91,875 |
| 5-Person Families | 327 (12.3%) | $91,875 |
| 6-Person Families | 85 (3.2%) | $0 |
| 7+ Person Families | 86 (3.2%) | $113,750 |
| Total | 2,655 (100.0%) | $90,913 |
Family Income by Number of Earners in Hamilton County
The median family income in Hamilton County is $90,913, with families comprising 3+ earners (352) having the highest median family income of $121,875, while families with no earners (513) have the lowest median family income of $56,192, accounting for 13.3% and 19.3% of families, respectively.
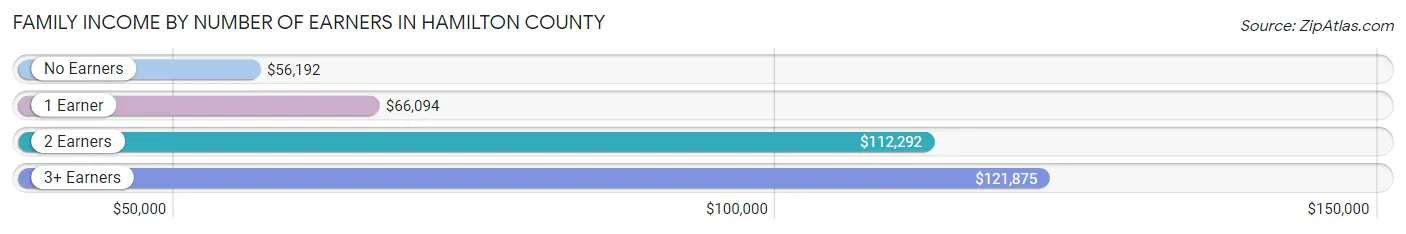
| Number of Earners | # Families | Median Income |
| No Earners | 513 (19.3%) | $56,192 |
| 1 Earner | 618 (23.3%) | $66,094 |
| 2 Earners | 1,172 (44.1%) | $112,292 |
| 3+ Earners | 352 (13.3%) | $121,875 |
| Total | 2,655 (100.0%) | $90,913 |
Household Income in Hamilton County
Household Income Brackets in Hamilton County
With 808 households falling in the category, the $100,000 to $149,999 income range is the most frequent in Hamilton County, accounting for 22.6% of all households. In contrast, only 43 households (1.2%) fall into the $10,000 to $14,999 income bracket, making it the least populous group.
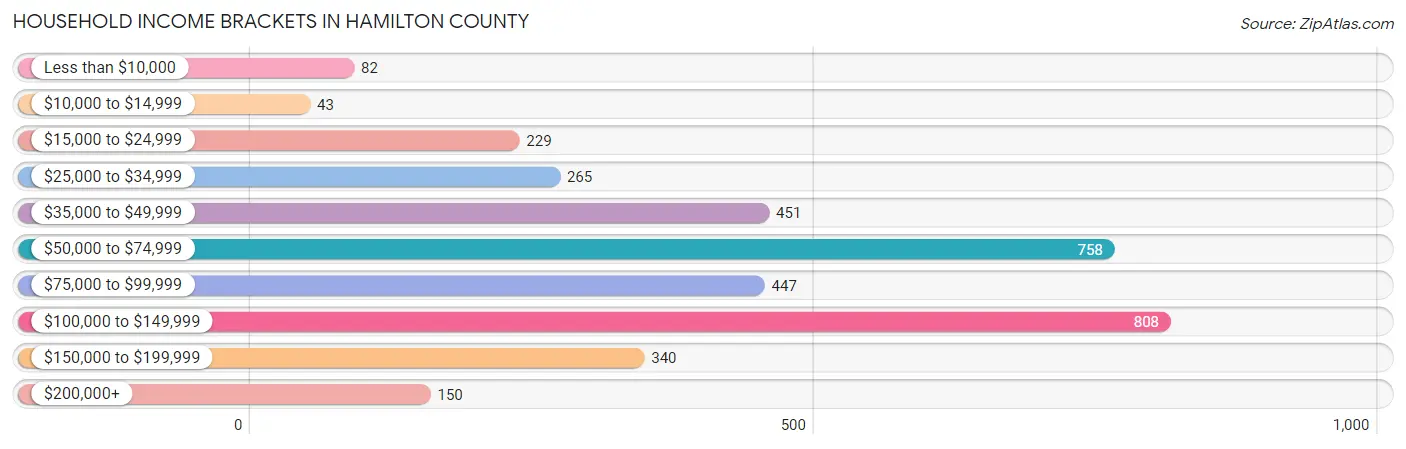
| Income Bracket | # Households | % Households |
| Less than $10,000 | 82 | 2.3% |
| $10,000 to $14,999 | 43 | 1.2% |
| $15,000 to $24,999 | 229 | 6.4% |
| $25,000 to $34,999 | 265 | 7.4% |
| $35,000 to $49,999 | 451 | 12.6% |
| $50,000 to $74,999 | 758 | 21.2% |
| $75,000 to $99,999 | 447 | 12.5% |
| $100,000 to $149,999 | 808 | 22.6% |
| $150,000 to $199,999 | 340 | 9.5% |
| $200,000+ | 150 | 4.2% |
Household Income by Householder Age in Hamilton County
The median household income in Hamilton County is $73,254, with the highest median household income of $98,309 found in the 45 to 64 years age bracket for the primary householder. A total of 1,283 households (35.9%) fall into this category. Meanwhile, the 65+ years age bracket for the primary householder has the lowest median household income of $50,966, with 1,167 households (32.6%) in this group.
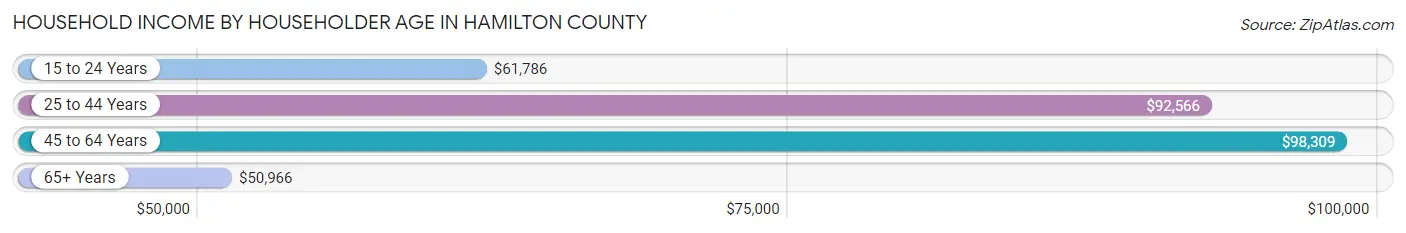
| Income Bracket | # Households | Median Income |
| 15 to 24 Years | 130 (3.6%) | $61,786 |
| 25 to 44 Years | 997 (27.9%) | $92,566 |
| 45 to 64 Years | 1,283 (35.9%) | $98,309 |
| 65+ Years | 1,167 (32.6%) | $50,966 |
| Total | 3,577 (100.0%) | $73,254 |
Poverty in Hamilton County
Income Below Poverty by Sex and Age in Hamilton County
With 4.1% poverty level for males and 7.0% for females among the residents of Hamilton County, 65 to 74 year old males and 15 year old females are the most vulnerable to poverty, with 68 males (12.9%) and 29 females (29.3%) in their respective age groups living below the poverty level.
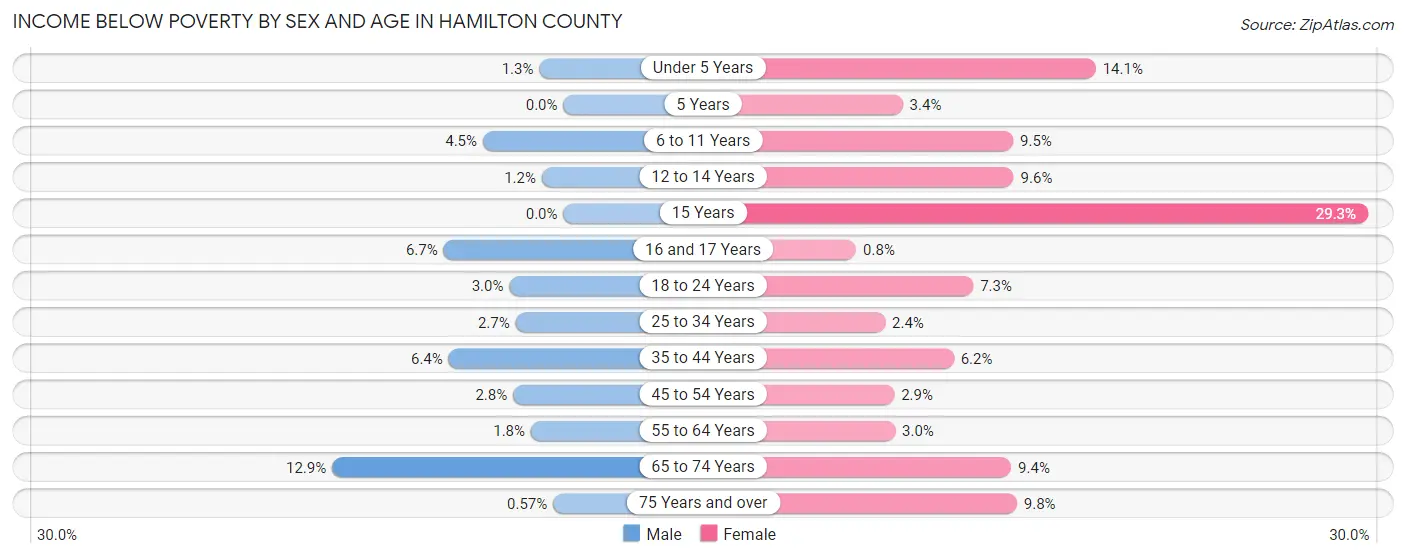
| Age Bracket | Male | Female |
| Under 5 Years | 4 (1.3%) | 42 (14.1%) |
| 5 Years | 0 (0.0%) | 2 (3.4%) |
| 6 to 11 Years | 20 (4.5%) | 39 (9.5%) |
| 12 to 14 Years | 2 (1.2%) | 11 (9.6%) |
| 15 Years | 0 (0.0%) | 29 (29.3%) |
| 16 and 17 Years | 7 (6.7%) | 1 (0.8%) |
| 18 to 24 Years | 11 (3.0%) | 24 (7.3%) |
| 25 to 34 Years | 14 (2.7%) | 12 (2.4%) |
| 35 to 44 Years | 35 (6.4%) | 33 (6.2%) |
| 45 to 54 Years | 15 (2.8%) | 16 (2.9%) |
| 55 to 64 Years | 11 (1.8%) | 19 (3.0%) |
| 65 to 74 Years | 68 (12.9%) | 50 (9.4%) |
| 75 Years and over | 2 (0.6%) | 43 (9.8%) |
| Total | 189 (4.1%) | 321 (7.0%) |
Income Above Poverty by Sex and Age in Hamilton County
According to the poverty statistics in Hamilton County, males aged 5 years and females aged 16 and 17 years are the age groups that are most secure financially, with 100.0% of males and 99.2% of females in these age groups living above the poverty line.
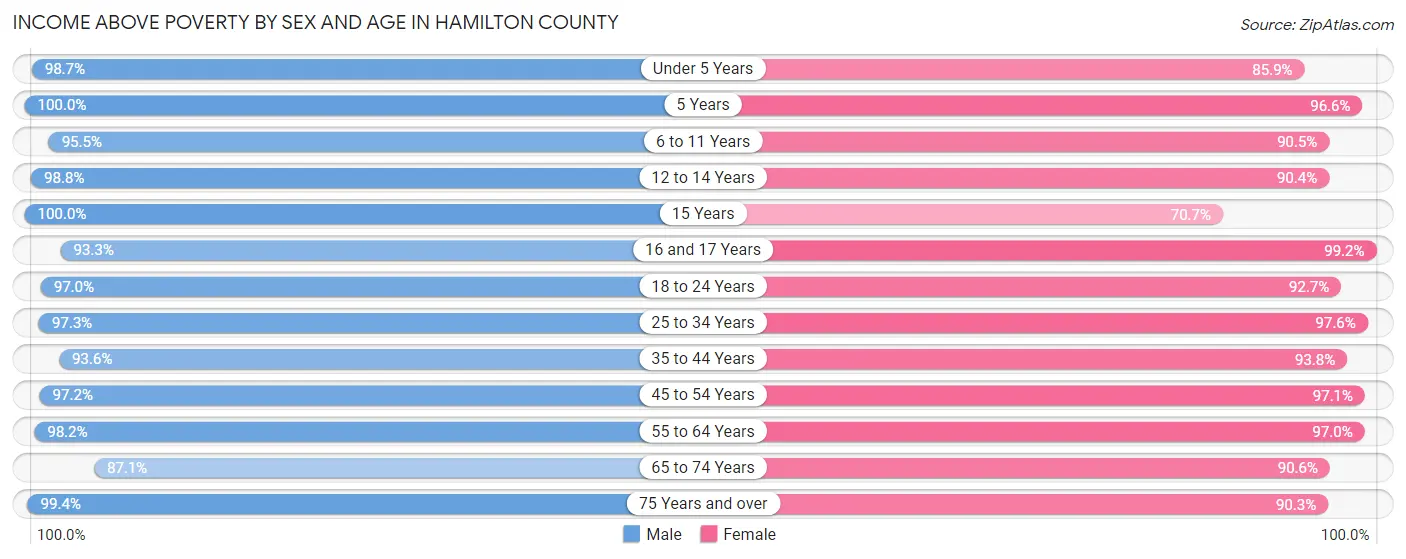
| Age Bracket | Male | Female |
| Under 5 Years | 294 (98.7%) | 255 (85.9%) |
| 5 Years | 53 (100.0%) | 57 (96.6%) |
| 6 to 11 Years | 426 (95.5%) | 370 (90.5%) |
| 12 to 14 Years | 164 (98.8%) | 104 (90.4%) |
| 15 Years | 107 (100.0%) | 70 (70.7%) |
| 16 and 17 Years | 98 (93.3%) | 124 (99.2%) |
| 18 to 24 Years | 355 (97.0%) | 304 (92.7%) |
| 25 to 34 Years | 513 (97.3%) | 485 (97.6%) |
| 35 to 44 Years | 513 (93.6%) | 497 (93.8%) |
| 45 to 54 Years | 520 (97.2%) | 532 (97.1%) |
| 55 to 64 Years | 598 (98.2%) | 621 (97.0%) |
| 65 to 74 Years | 460 (87.1%) | 480 (90.6%) |
| 75 Years and over | 349 (99.4%) | 398 (90.2%) |
| Total | 4,450 (95.9%) | 4,297 (93.0%) |
Income Below Poverty Among Married-Couple Families in Hamilton County
The poverty statistics for married-couple families in Hamilton County show that 2.8% or 64 of the total 2,275 families live below the poverty line. Families with 3 or 4 children have the highest poverty rate of 11.0%, comprising of 33 families. On the other hand, families with 5 or more children have the lowest poverty rate of 0.0%, which includes 0 families.
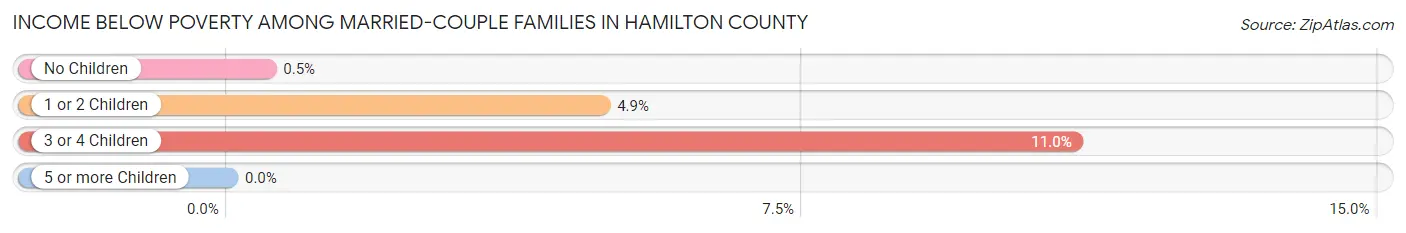
| Children | Above Poverty | Below Poverty |
| No Children | 1,391 (99.5%) | 7 (0.5%) |
| 1 or 2 Children | 470 (95.1%) | 24 (4.9%) |
| 3 or 4 Children | 266 (89.0%) | 33 (11.0%) |
| 5 or more Children | 84 (100.0%) | 0 (0.0%) |
| Total | 2,211 (97.2%) | 64 (2.8%) |
Income Below Poverty Among Single-Parent Households in Hamilton County
According to the poverty data in Hamilton County, 2.9% or 2 single-father households and 4.5% or 14 single-mother households are living below the poverty line. Among single-father households, those with 1 or 2 children have the highest poverty rate, with 2 households (3.3%) experiencing poverty. Likewise, among single-mother households, those with 1 or 2 children have the highest poverty rate, with 12 households (8.6%) falling below the poverty line.
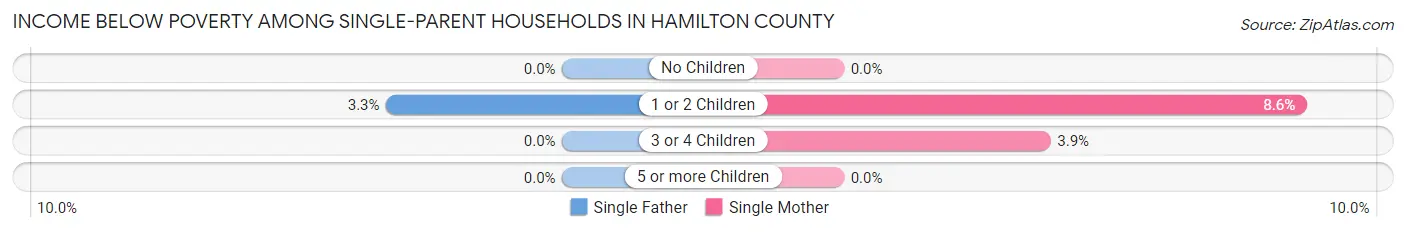
| Children | Single Father | Single Mother |
| No Children | 0 (0.0%) | 0 (0.0%) |
| 1 or 2 Children | 2 (3.3%) | 12 (8.6%) |
| 3 or 4 Children | 0 (0.0%) | 2 (3.8%) |
| 5 or more Children | 0 (0.0%) | 0 (0.0%) |
| Total | 2 (2.9%) | 14 (4.5%) |
Income Below Poverty Among Married-Couple vs Single-Parent Households in Hamilton County
The poverty data for Hamilton County shows that 64 of the married-couple family households (2.8%) and 16 of the single-parent households (4.2%) are living below the poverty level. Within the married-couple family households, those with 3 or 4 children have the highest poverty rate, with 33 households (11.0%) falling below the poverty line. Among the single-parent households, those with 1 or 2 children have the highest poverty rate, with 14 household (7.0%) living below poverty.

| Children | Married-Couple Families | Single-Parent Households |
| No Children | 7 (0.5%) | 0 (0.0%) |
| 1 or 2 Children | 24 (4.9%) | 14 (7.0%) |
| 3 or 4 Children | 33 (11.0%) | 2 (3.5%) |
| 5 or more Children | 0 (0.0%) | 0 (0.0%) |
| Total | 64 (2.8%) | 16 (4.2%) |
Employment Characteristics in Hamilton County
Employment by Class of Employer in Hamilton County
Among the 4,694 employed individuals in Hamilton County, private company employees (2,952 | 62.9%), local government employees (505 | 10.8%), and self-employed (not incorporated) (415 | 8.8%) make up the most common classes of employment.
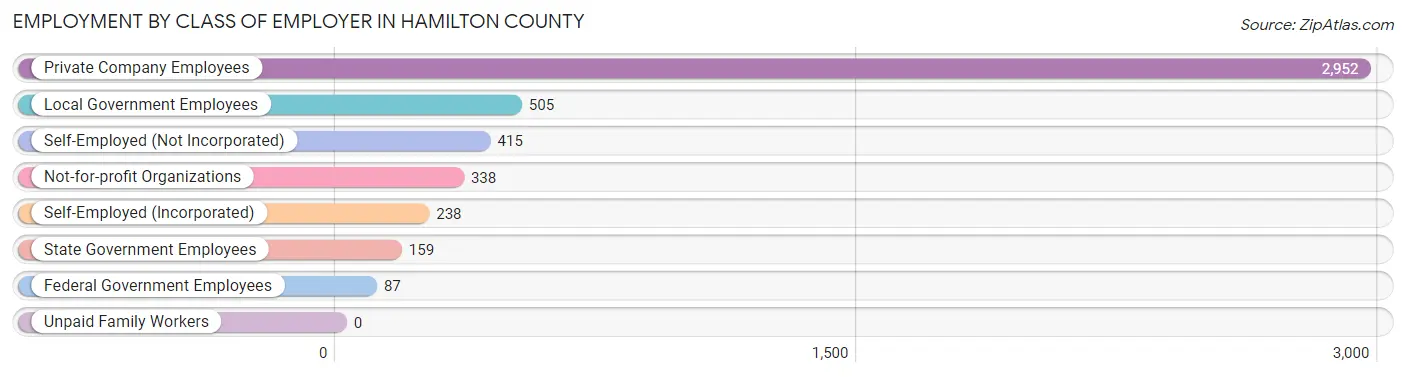
| Employer Class | # Employees | % Employees |
| Private Company Employees | 2,952 | 62.9% |
| Self-Employed (Incorporated) | 238 | 5.1% |
| Self-Employed (Not Incorporated) | 415 | 8.8% |
| Not-for-profit Organizations | 338 | 7.2% |
| Local Government Employees | 505 | 10.8% |
| State Government Employees | 159 | 3.4% |
| Federal Government Employees | 87 | 1.8% |
| Unpaid Family Workers | 0 | 0.0% |
| Total | 4,694 | 100.0% |
Employment Status by Age in Hamilton County
According to the labor force statistics for Hamilton County, out of the total population over 16 years of age (7,333), 66.9% or 4,906 individuals are in the labor force, with 3.6% or 177 of them unemployed. The age group with the highest labor force participation rate is 35 to 44 years, with 90.9% or 991 individuals in the labor force. Within the labor force, the 16 to 19 years age range has the highest percentage of unemployed individuals, with 11.6% or 32 of them being unemployed.
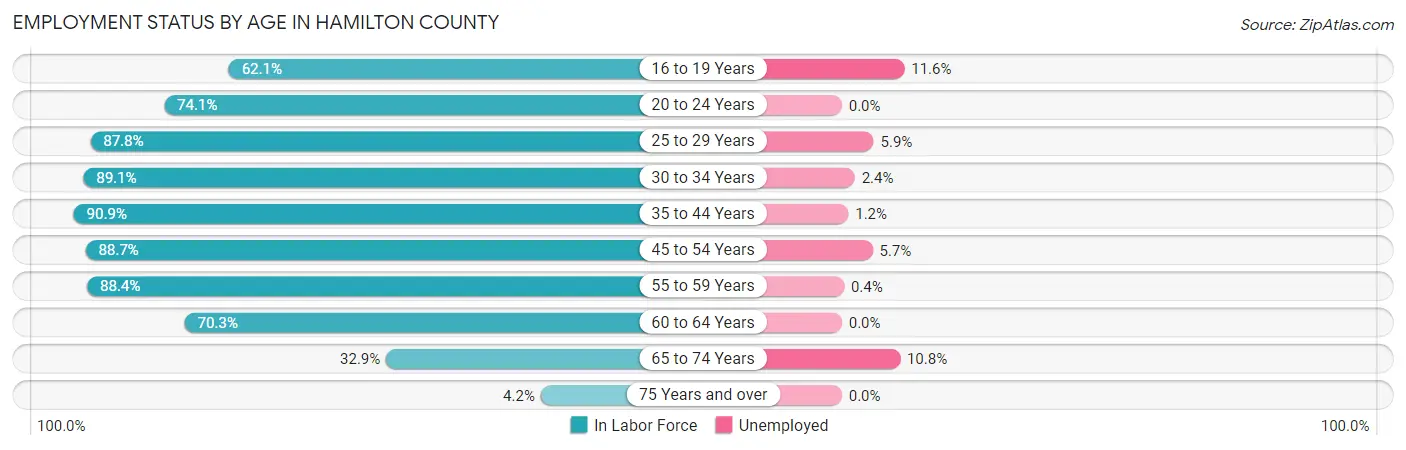
| Age Bracket | In Labor Force | Unemployed |
| 16 to 19 Years | 277 (62.1%) | 32 (11.6%) |
| 20 to 24 Years | 357 (74.1%) | 0 (0.0%) |
| 25 to 29 Years | 441 (87.8%) | 26 (5.9%) |
| 30 to 34 Years | 467 (89.1%) | 11 (2.4%) |
| 35 to 44 Years | 991 (90.9%) | 12 (1.2%) |
| 45 to 54 Years | 968 (88.7%) | 55 (5.7%) |
| 55 to 59 Years | 562 (88.4%) | 2 (0.4%) |
| 60 to 64 Years | 459 (70.3%) | 0 (0.0%) |
| 65 to 74 Years | 351 (32.9%) | 38 (10.8%) |
| 75 Years and over | 35 (4.2%) | 0 (0.0%) |
| Total | 4,906 (66.9%) | 177 (3.6%) |
Employment Status by Educational Attainment in Hamilton County
According to labor force statistics for Hamilton County, 86.5% of individuals (3,889) out of the total population between 25 and 64 years of age (4,496) are in the labor force, with 2.7% or 105 of them being unemployed. The group with the highest labor force participation rate are those with the educational attainment of bachelor's degree or higher, with 89.4% or 1,149 individuals in the labor force. Within the labor force, individuals with less than high school education have the highest percentage of unemployment, with 6.5% or 5 of them being unemployed.
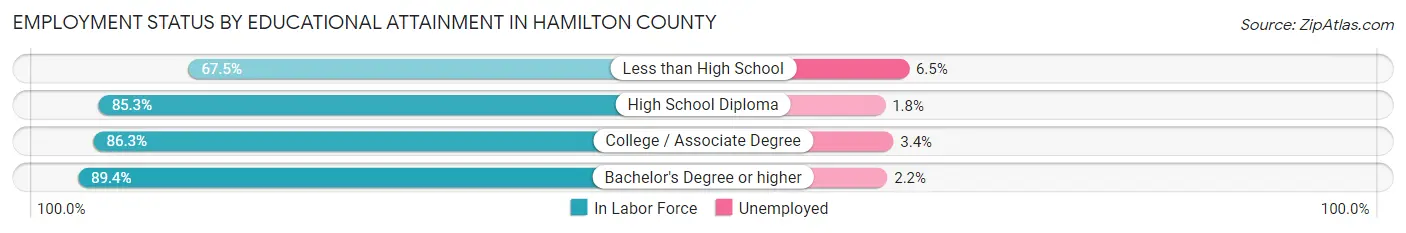
| Educational Attainment | In Labor Force | Unemployed |
| Less than High School | 77 (67.5%) | 7 (6.5%) |
| High School Diploma | 935 (85.3%) | 20 (1.8%) |
| College / Associate Degree | 1,727 (86.3%) | 68 (3.4%) |
| Bachelor's Degree or higher | 1,149 (89.4%) | 28 (2.2%) |
| Total | 3,889 (86.5%) | 121 (2.7%) |
Employment Occupations by Sex in Hamilton County
Management, Business, Science and Arts Occupations
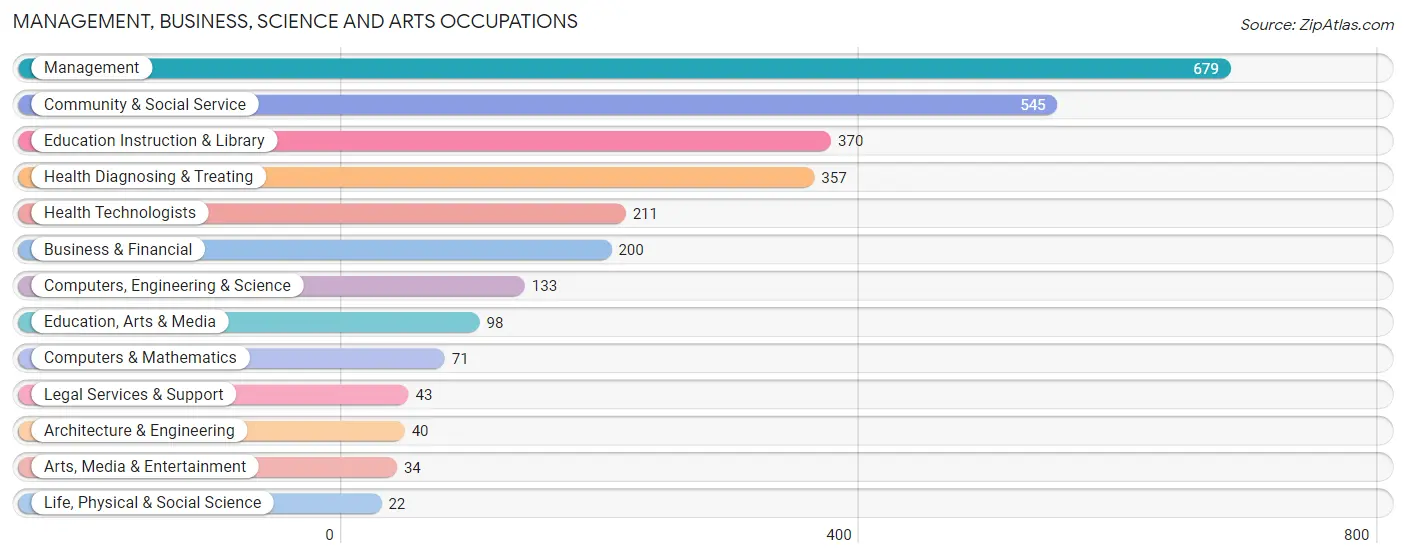
The most common Management, Business, Science and Arts occupations in Hamilton County are Management (679 | 14.4%), Community & Social Service (545 | 11.5%), Education Instruction & Library (370 | 7.8%), Health Diagnosing & Treating (357 | 7.6%), and Health Technologists (211 | 4.5%).
Management, Business, Science and Arts Occupations by Sex
Within the Management, Business, Science and Arts occupations in Hamilton County, the most male-oriented occupations are Computers & Mathematics (74.7%), Management (72.8%), and Computers, Engineering & Science (66.2%), while the most female-oriented occupations are Health Technologists (91.9%), Health Diagnosing & Treating (91.0%), and Education Instruction & Library (78.6%).
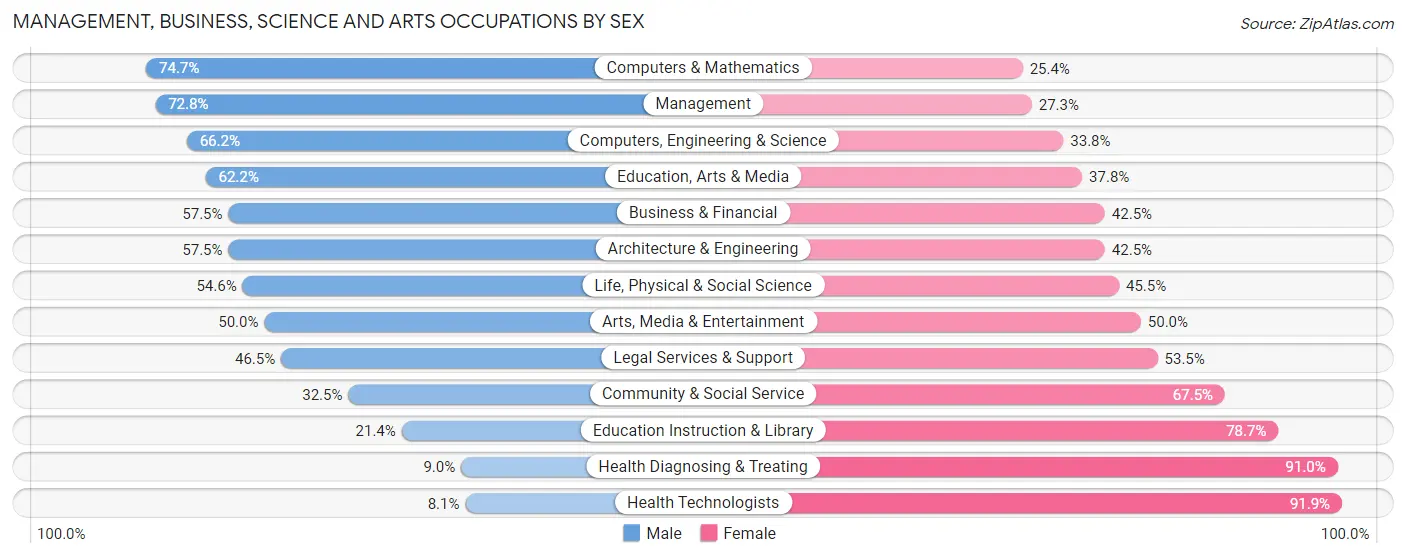
| Occupation | Male | Female |
| Management | 494 (72.8%) | 185 (27.3%) |
| Business & Financial | 115 (57.5%) | 85 (42.5%) |
| Computers, Engineering & Science | 88 (66.2%) | 45 (33.8%) |
| Computers & Mathematics | 53 (74.7%) | 18 (25.4%) |
| Architecture & Engineering | 23 (57.5%) | 17 (42.5%) |
| Life, Physical & Social Science | 12 (54.5%) | 10 (45.5%) |
| Community & Social Service | 177 (32.5%) | 368 (67.5%) |
| Education, Arts & Media | 61 (62.2%) | 37 (37.8%) |
| Legal Services & Support | 20 (46.5%) | 23 (53.5%) |
| Education Instruction & Library | 79 (21.3%) | 291 (78.6%) |
| Arts, Media & Entertainment | 17 (50.0%) | 17 (50.0%) |
| Health Diagnosing & Treating | 32 (9.0%) | 325 (91.0%) |
| Health Technologists | 17 (8.1%) | 194 (91.9%) |
| Total (Category) | 906 (47.3%) | 1,008 (52.7%) |
| Total (Overall) | 2,499 (52.9%) | 2,222 (47.1%) |
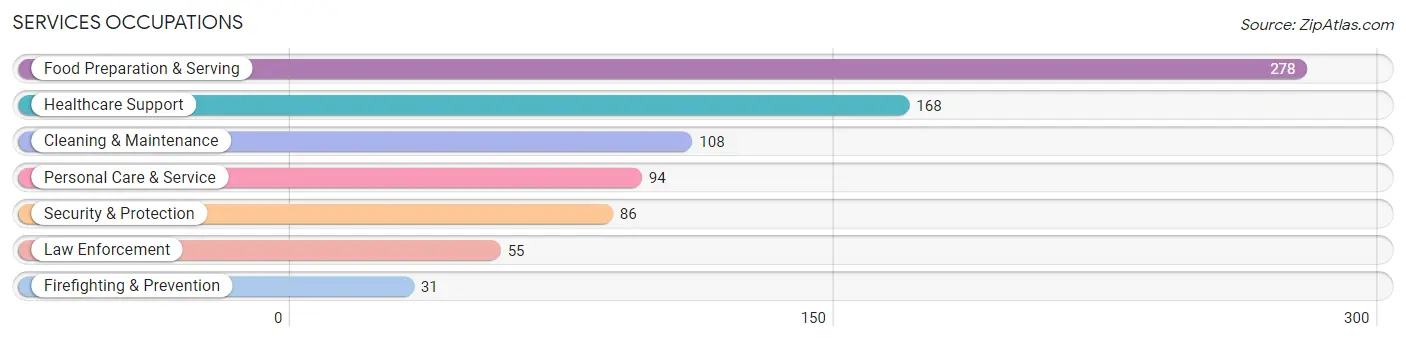
Services Occupations
The most common Services occupations in Hamilton County are Food Preparation & Serving (278 | 5.9%), Healthcare Support (168 | 3.6%), Cleaning & Maintenance (108 | 2.3%), Personal Care & Service (94 | 2.0%), and Security & Protection (86 | 1.8%).
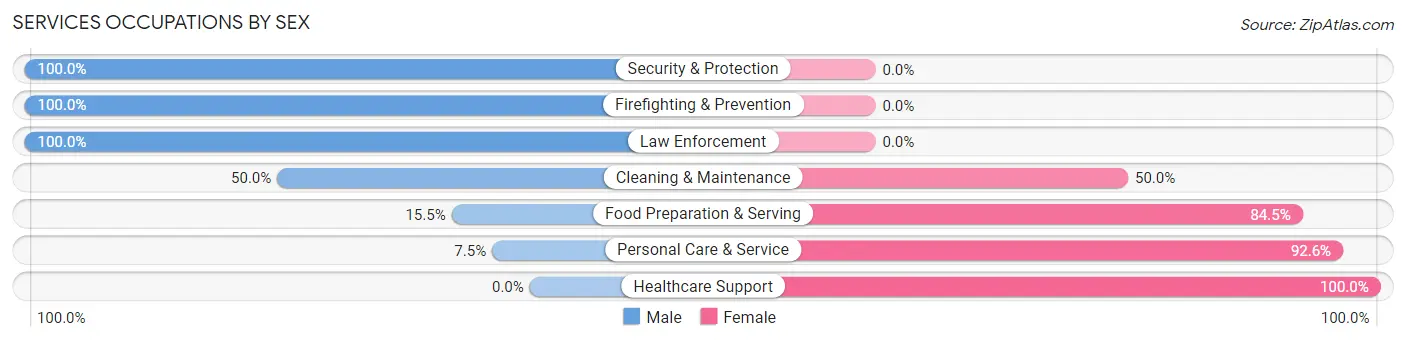
Services Occupations by Sex
Within the Services occupations in Hamilton County, the most male-oriented occupations are Security & Protection (100.0%), Firefighting & Prevention (100.0%), and Law Enforcement (100.0%), while the most female-oriented occupations are Healthcare Support (100.0%), Personal Care & Service (92.5%), and Food Preparation & Serving (84.5%).
| Occupation | Male | Female |
| Healthcare Support | 0 (0.0%) | 168 (100.0%) |
| Security & Protection | 86 (100.0%) | 0 (0.0%) |
| Firefighting & Prevention | 31 (100.0%) | 0 (0.0%) |
| Law Enforcement | 55 (100.0%) | 0 (0.0%) |
| Food Preparation & Serving | 43 (15.5%) | 235 (84.5%) |
| Cleaning & Maintenance | 54 (50.0%) | 54 (50.0%) |
| Personal Care & Service | 7 (7.4%) | 87 (92.5%) |
| Total (Category) | 190 (25.9%) | 544 (74.1%) |
| Total (Overall) | 2,499 (52.9%) | 2,222 (47.1%) |
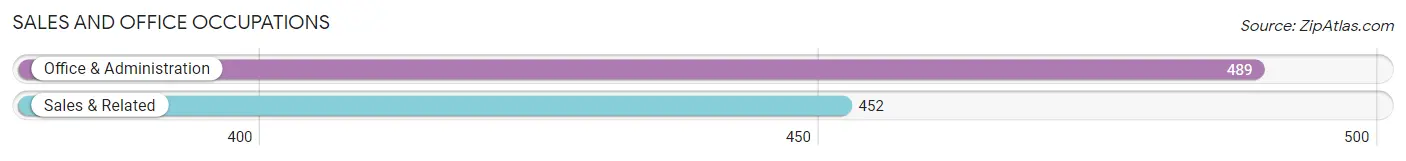
Sales and Office Occupations
The most common Sales and Office occupations in Hamilton County are Office & Administration (489 | 10.4%), and Sales & Related (452 | 9.6%).
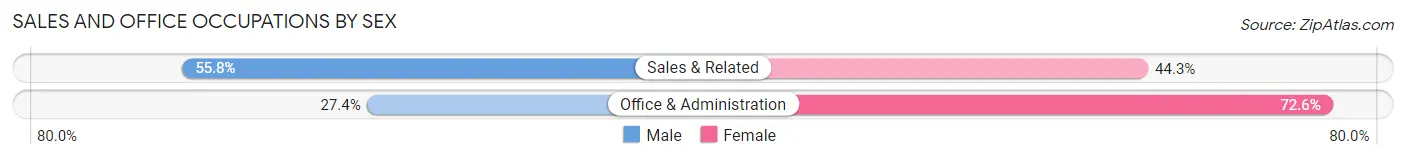
Sales and Office Occupations by Sex
| Occupation | Male | Female |
| Sales & Related | 252 (55.7%) | 200 (44.3%) |
| Office & Administration | 134 (27.4%) | 355 (72.6%) |
| Total (Category) | 386 (41.0%) | 555 (59.0%) |
| Total (Overall) | 2,499 (52.9%) | 2,222 (47.1%) |
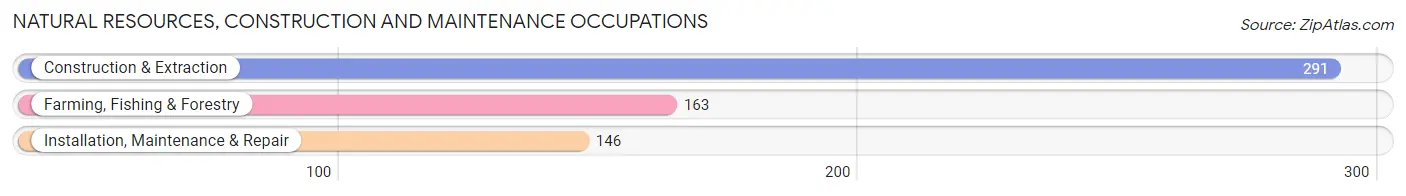
Natural Resources, Construction and Maintenance Occupations
The most common Natural Resources, Construction and Maintenance occupations in Hamilton County are Construction & Extraction (291 | 6.2%), Farming, Fishing & Forestry (163 | 3.5%), and Installation, Maintenance & Repair (146 | 3.1%).
Natural Resources, Construction and Maintenance Occupations by Sex
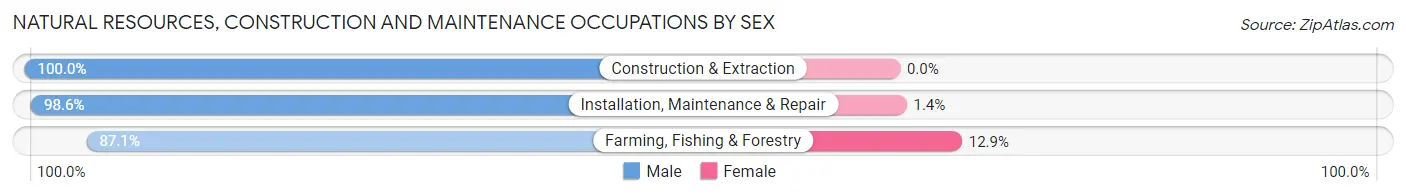
| Occupation | Male | Female |
| Farming, Fishing & Forestry | 142 (87.1%) | 21 (12.9%) |
| Construction & Extraction | 291 (100.0%) | 0 (0.0%) |
| Installation, Maintenance & Repair | 144 (98.6%) | 2 (1.4%) |
| Total (Category) | 577 (96.2%) | 23 (3.8%) |
| Total (Overall) | 2,499 (52.9%) | 2,222 (47.1%) |
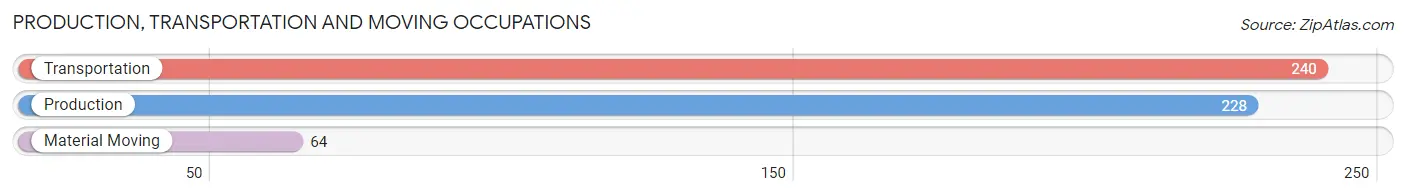
Production, Transportation and Moving Occupations
The most common Production, Transportation and Moving occupations in Hamilton County are Transportation (240 | 5.1%), Production (228 | 4.8%), and Material Moving (64 | 1.4%).
Production, Transportation and Moving Occupations by Sex
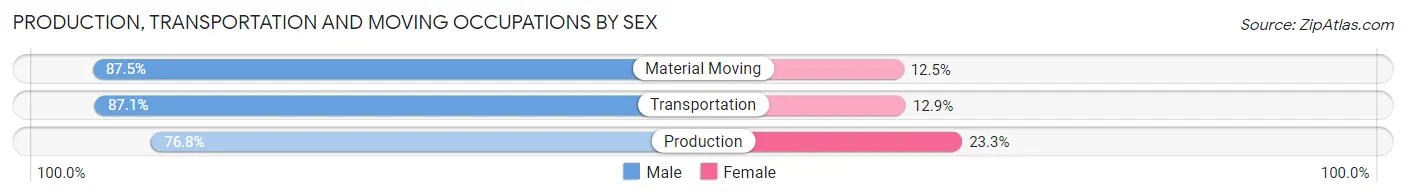
| Occupation | Male | Female |
| Production | 175 (76.7%) | 53 (23.3%) |
| Transportation | 209 (87.1%) | 31 (12.9%) |
| Material Moving | 56 (87.5%) | 8 (12.5%) |
| Total (Category) | 440 (82.7%) | 92 (17.3%) |
| Total (Overall) | 2,499 (52.9%) | 2,222 (47.1%) |
Employment Industries by Sex in Hamilton County
Employment Industries in Hamilton County
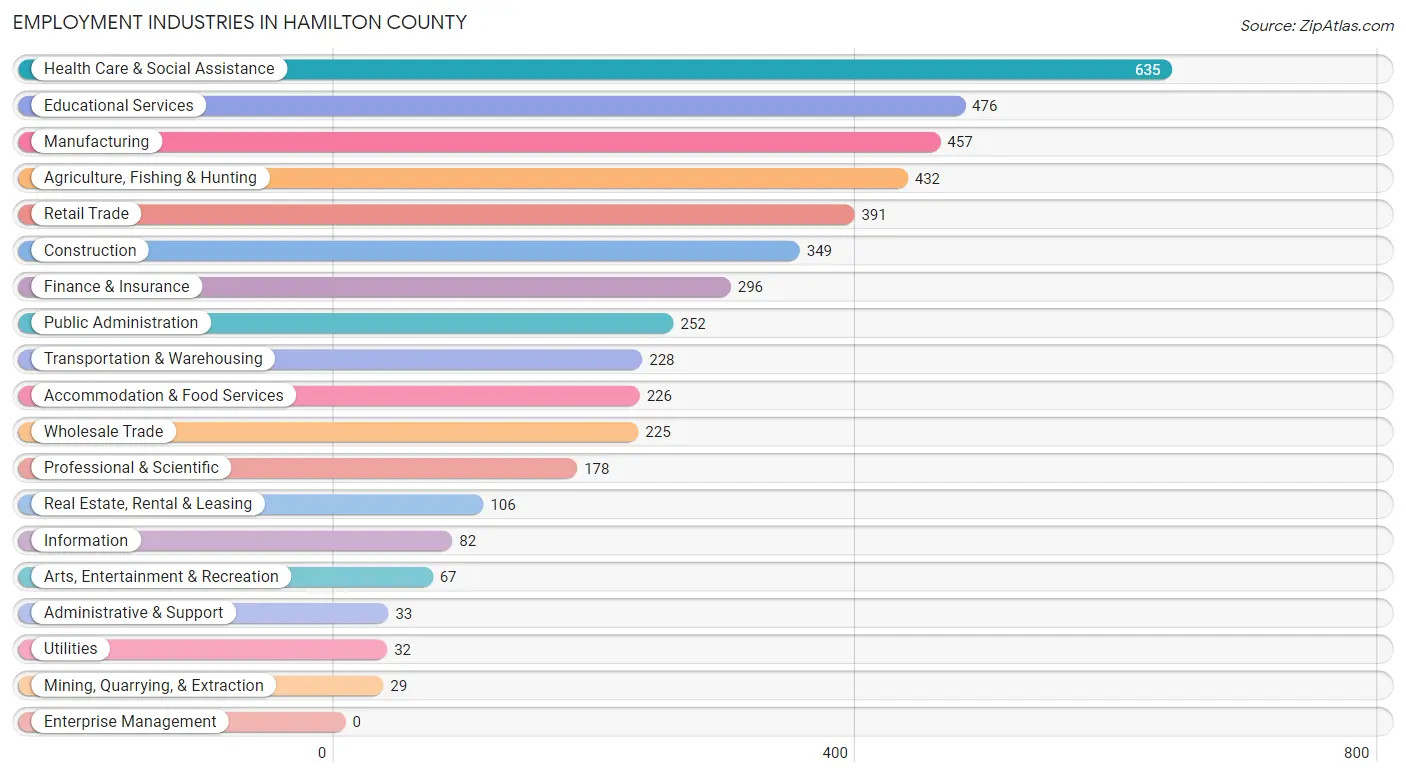
The major employment industries in Hamilton County include Health Care & Social Assistance (635 | 13.5%), Educational Services (476 | 10.1%), Manufacturing (457 | 9.7%), Agriculture, Fishing & Hunting (432 | 9.1%), and Retail Trade (391 | 8.3%).
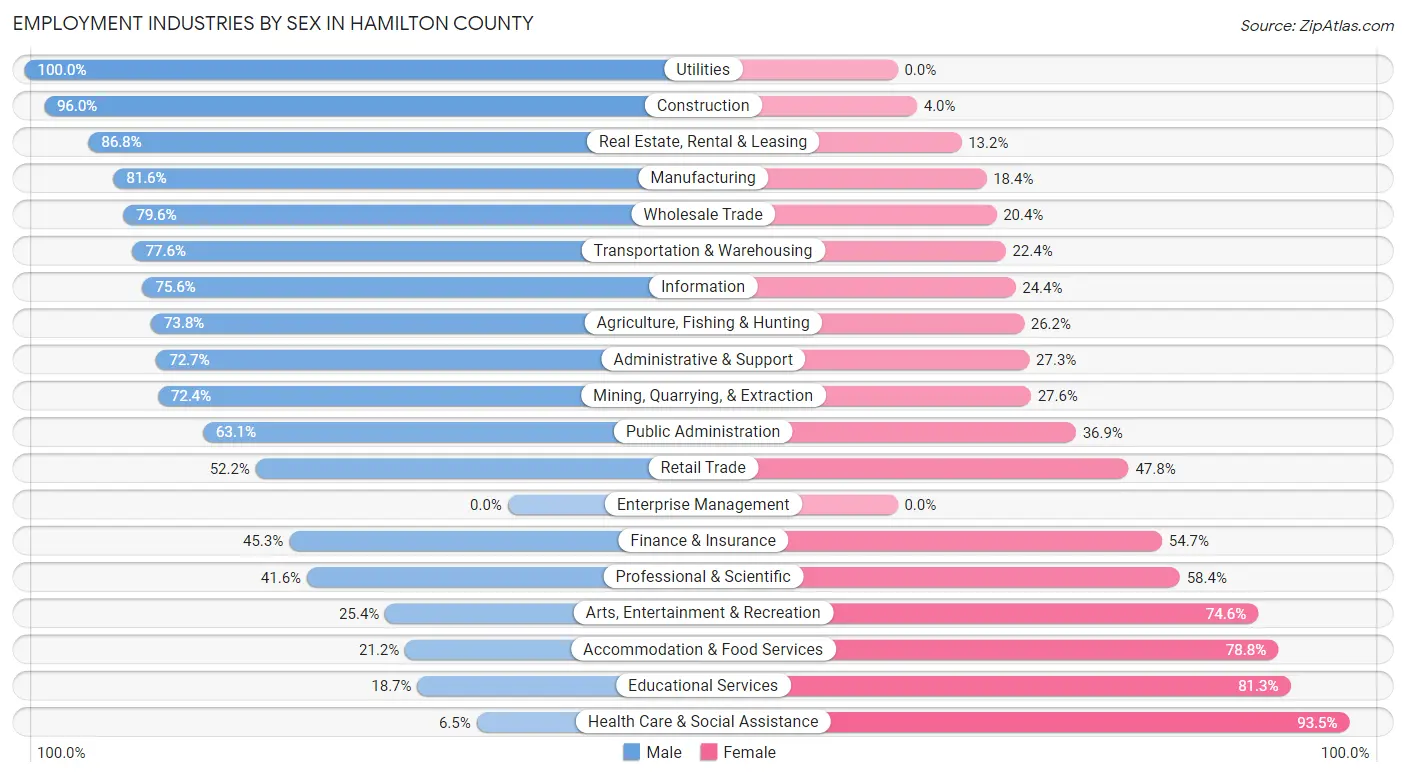
Employment Industries by Sex in Hamilton County
The Hamilton County industries that see more men than women are Utilities (100.0%), Construction (96.0%), and Real Estate, Rental & Leasing (86.8%), whereas the industries that tend to have a higher number of women are Health Care & Social Assistance (93.5%), Educational Services (81.3%), and Accommodation & Food Services (78.8%).
| Industry | Male | Female |
| Agriculture, Fishing & Hunting | 319 (73.8%) | 113 (26.2%) |
| Mining, Quarrying, & Extraction | 21 (72.4%) | 8 (27.6%) |
| Construction | 335 (96.0%) | 14 (4.0%) |
| Manufacturing | 373 (81.6%) | 84 (18.4%) |
| Wholesale Trade | 179 (79.6%) | 46 (20.4%) |
| Retail Trade | 204 (52.2%) | 187 (47.8%) |
| Transportation & Warehousing | 177 (77.6%) | 51 (22.4%) |
| Utilities | 32 (100.0%) | 0 (0.0%) |
| Information | 62 (75.6%) | 20 (24.4%) |
| Finance & Insurance | 134 (45.3%) | 162 (54.7%) |
| Real Estate, Rental & Leasing | 92 (86.8%) | 14 (13.2%) |
| Professional & Scientific | 74 (41.6%) | 104 (58.4%) |
| Enterprise Management | 0 (0.0%) | 0 (0.0%) |
| Administrative & Support | 24 (72.7%) | 9 (27.3%) |
| Educational Services | 89 (18.7%) | 387 (81.3%) |
| Health Care & Social Assistance | 41 (6.5%) | 594 (93.5%) |
| Arts, Entertainment & Recreation | 17 (25.4%) | 50 (74.6%) |
| Accommodation & Food Services | 48 (21.2%) | 178 (78.8%) |
| Public Administration | 159 (63.1%) | 93 (36.9%) |
| Total | 2,499 (52.9%) | 2,222 (47.1%) |
Education in Hamilton County
School Enrollment in Hamilton County
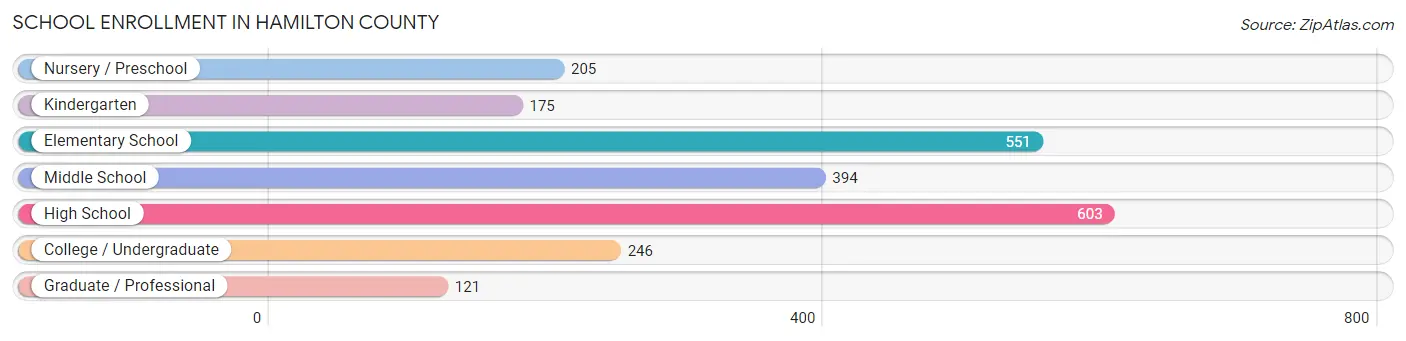
The most common levels of schooling among the 2,295 students in Hamilton County are high school (603 | 26.3%), elementary school (551 | 24.0%), and middle school (394 | 17.2%).
| School Level | # Students | % Students |
| Nursery / Preschool | 205 | 8.9% |
| Kindergarten | 175 | 7.6% |
| Elementary School | 551 | 24.0% |
| Middle School | 394 | 17.2% |
| High School | 603 | 26.3% |
| College / Undergraduate | 246 | 10.7% |
| Graduate / Professional | 121 | 5.3% |
| Total | 2,295 | 100.0% |
School Enrollment by Age by Funding Source in Hamilton County
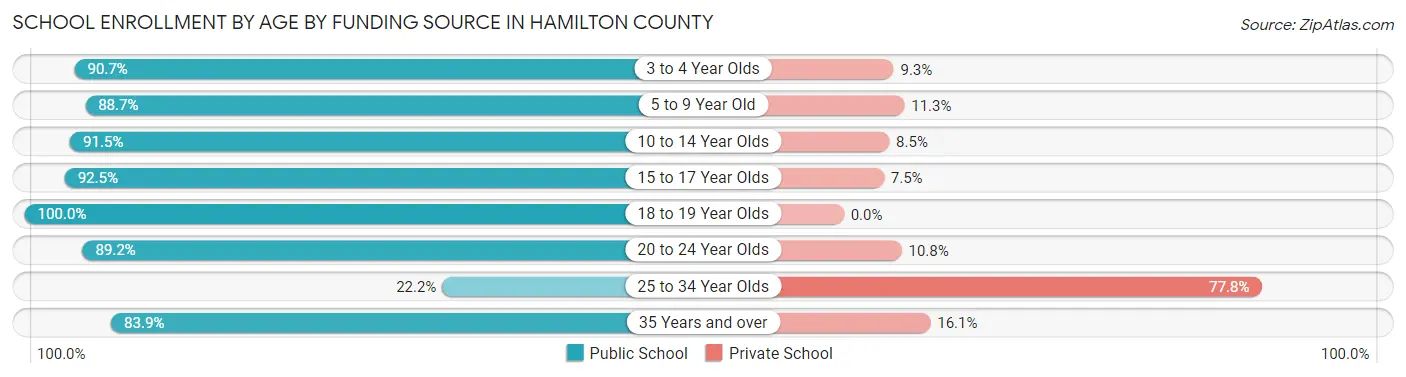
Out of a total of 2,295 students who are enrolled in schools in Hamilton County, 262 (11.4%) attend a private institution, while the remaining 2,033 (88.6%) are enrolled in public schools. The age group of 25 to 34 year olds has the highest likelihood of being enrolled in private schools, with 63 (77.8% in the age bracket) enrolled. Conversely, the age group of 18 to 19 year olds has the lowest likelihood of being enrolled in a private school, with 149 (100.0% in the age bracket) attending a public institution.
| Age Bracket | Public School | Private School |
| 3 to 4 Year Olds | 127 (90.7%) | 13 (9.3%) |
| 5 to 9 Year Old | 558 (88.7%) | 71 (11.3%) |
| 10 to 14 Year Olds | 551 (91.5%) | 51 (8.5%) |
| 15 to 17 Year Olds | 396 (92.5%) | 32 (7.5%) |
| 18 to 19 Year Olds | 149 (100.0%) | 0 (0.0%) |
| 20 to 24 Year Olds | 182 (89.2%) | 22 (10.8%) |
| 25 to 34 Year Olds | 18 (22.2%) | 63 (77.8%) |
| 35 Years and over | 52 (83.9%) | 10 (16.1%) |
| Total | 2,033 (88.6%) | 262 (11.4%) |
Educational Attainment by Field of Study in Hamilton County
Education (432 | 25.4%), business (324 | 19.1%), science & technology (206 | 12.1%), bio, nature & agricultural (197 | 11.6%), and arts & humanities (118 | 6.9%) are the most common fields of study among 1,701 individuals in Hamilton County who have obtained a bachelor's degree or higher.
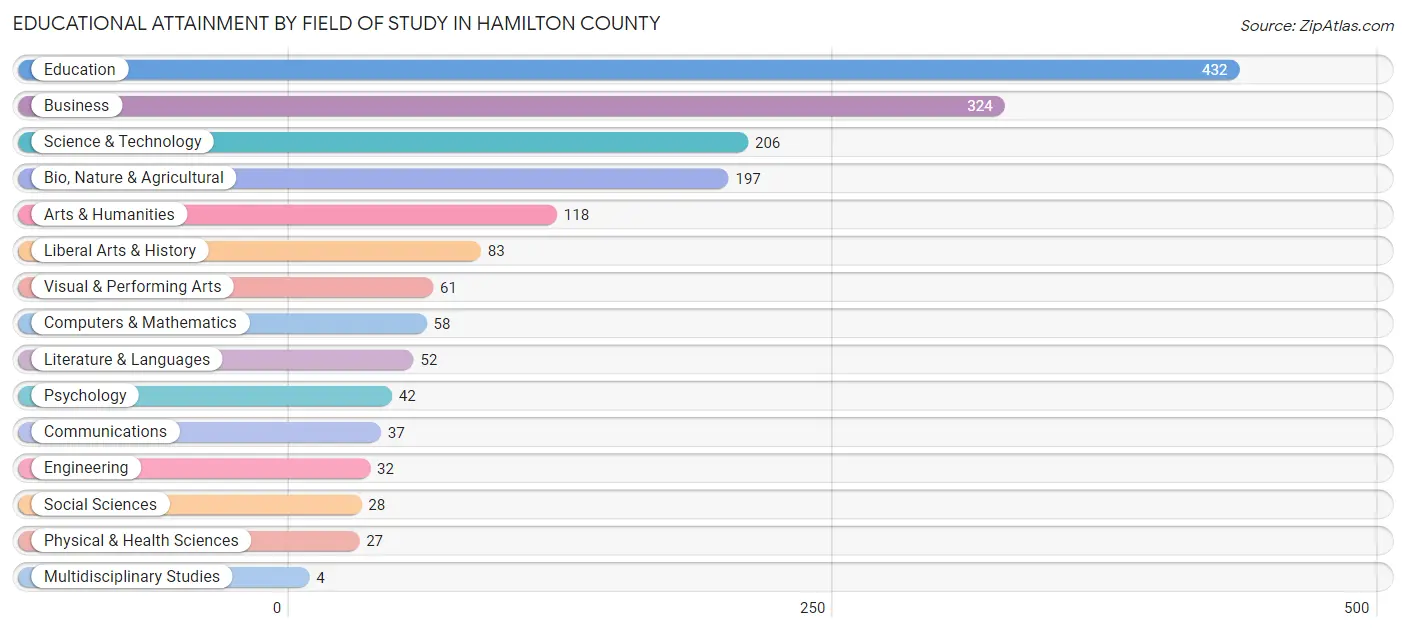
| Field of Study | # Graduates | % Graduates |
| Computers & Mathematics | 58 | 3.4% |
| Bio, Nature & Agricultural | 197 | 11.6% |
| Physical & Health Sciences | 27 | 1.6% |
| Psychology | 42 | 2.5% |
| Social Sciences | 28 | 1.7% |
| Engineering | 32 | 1.9% |
| Multidisciplinary Studies | 4 | 0.2% |
| Science & Technology | 206 | 12.1% |
| Business | 324 | 19.1% |
| Education | 432 | 25.4% |
| Literature & Languages | 52 | 3.1% |
| Liberal Arts & History | 83 | 4.9% |
| Visual & Performing Arts | 61 | 3.6% |
| Communications | 37 | 2.2% |
| Arts & Humanities | 118 | 6.9% |
| Total | 1,701 | 100.0% |
Transportation & Commute in Hamilton County
Vehicle Availability by Sex in Hamilton County
The most prevalent vehicle ownership categories in Hamilton County are males with 2 vehicles (838, accounting for 33.8%) and females with 2 vehicles (791, making up 37.9%).
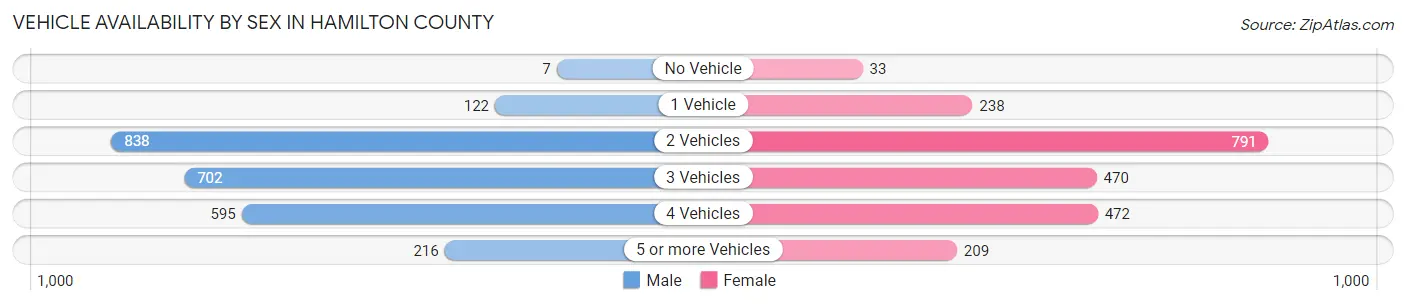
| Vehicles Available | Male | Female |
| No Vehicle | 7 (0.3%) | 33 (1.5%) |
| 1 Vehicle | 122 (4.9%) | 238 (10.7%) |
| 2 Vehicles | 838 (33.8%) | 791 (35.7%) |
| 3 Vehicles | 702 (28.3%) | 470 (21.2%) |
| 4 Vehicles | 595 (24.0%) | 472 (21.3%) |
| 5 or more Vehicles | 216 (8.7%) | 209 (9.4%) |
| Total | 2,480 (100.0%) | 2,213 (100.0%) |
Commute Time in Hamilton County
The most frequently occuring commute durations in Hamilton County are 5 to 9 minutes (927 commuters, 21.5%), 20 to 24 minutes (537 commuters, 12.4%), and 10 to 14 minutes (514 commuters, 11.9%).
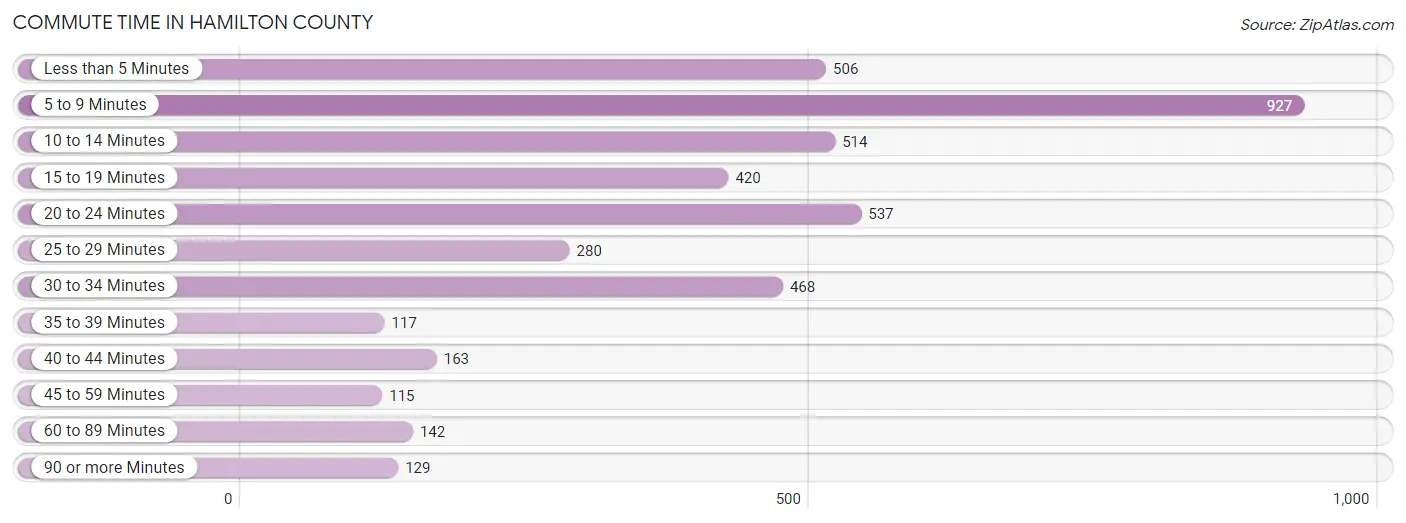
| Commute Time | # Commuters | % Commuters |
| Less than 5 Minutes | 506 | 11.7% |
| 5 to 9 Minutes | 927 | 21.5% |
| 10 to 14 Minutes | 514 | 11.9% |
| 15 to 19 Minutes | 420 | 9.7% |
| 20 to 24 Minutes | 537 | 12.4% |
| 25 to 29 Minutes | 280 | 6.5% |
| 30 to 34 Minutes | 468 | 10.8% |
| 35 to 39 Minutes | 117 | 2.7% |
| 40 to 44 Minutes | 163 | 3.8% |
| 45 to 59 Minutes | 115 | 2.7% |
| 60 to 89 Minutes | 142 | 3.3% |
| 90 or more Minutes | 129 | 3.0% |
Commute Time by Sex in Hamilton County
The most common commute times in Hamilton County are 5 to 9 minutes (367 commuters, 15.9%) for males and 5 to 9 minutes (560 commuters, 27.8%) for females.
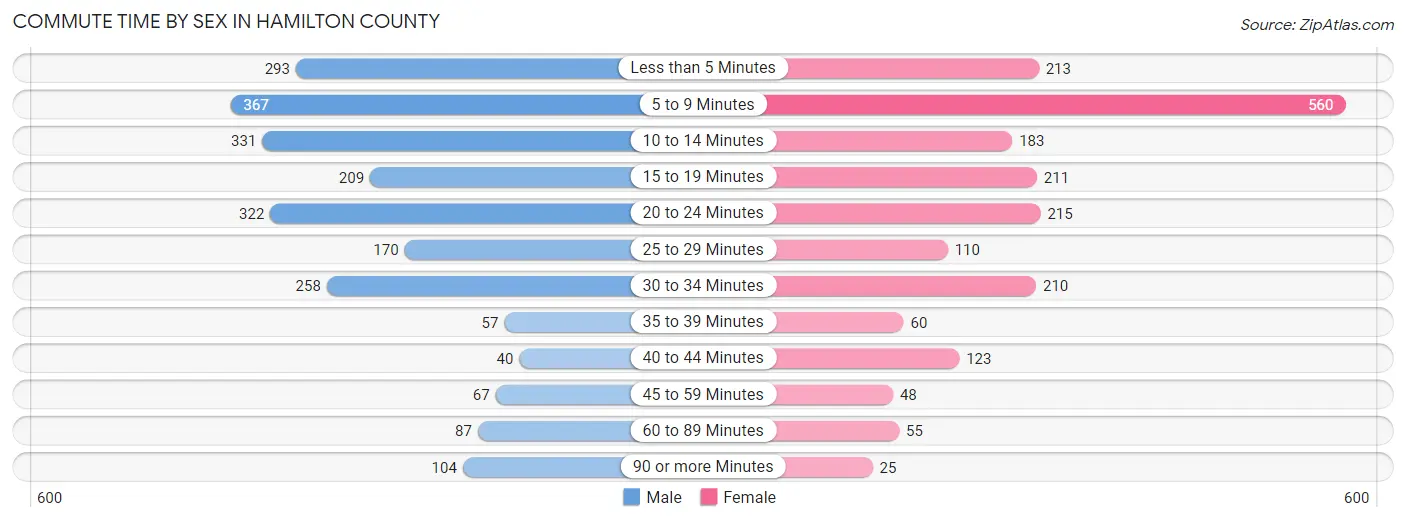
| Commute Time | Male | Female |
| Less than 5 Minutes | 293 (12.7%) | 213 (10.6%) |
| 5 to 9 Minutes | 367 (15.9%) | 560 (27.8%) |
| 10 to 14 Minutes | 331 (14.4%) | 183 (9.1%) |
| 15 to 19 Minutes | 209 (9.1%) | 211 (10.5%) |
| 20 to 24 Minutes | 322 (14.0%) | 215 (10.7%) |
| 25 to 29 Minutes | 170 (7.4%) | 110 (5.5%) |
| 30 to 34 Minutes | 258 (11.2%) | 210 (10.4%) |
| 35 to 39 Minutes | 57 (2.5%) | 60 (3.0%) |
| 40 to 44 Minutes | 40 (1.7%) | 123 (6.1%) |
| 45 to 59 Minutes | 67 (2.9%) | 48 (2.4%) |
| 60 to 89 Minutes | 87 (3.8%) | 55 (2.7%) |
| 90 or more Minutes | 104 (4.5%) | 25 (1.2%) |
Time of Departure to Work by Sex in Hamilton County
The most frequent times of departure to work in Hamilton County are 7:00 AM to 7:29 AM (488, 21.2%) for males and 7:30 AM to 7:59 AM (476, 23.6%) for females.
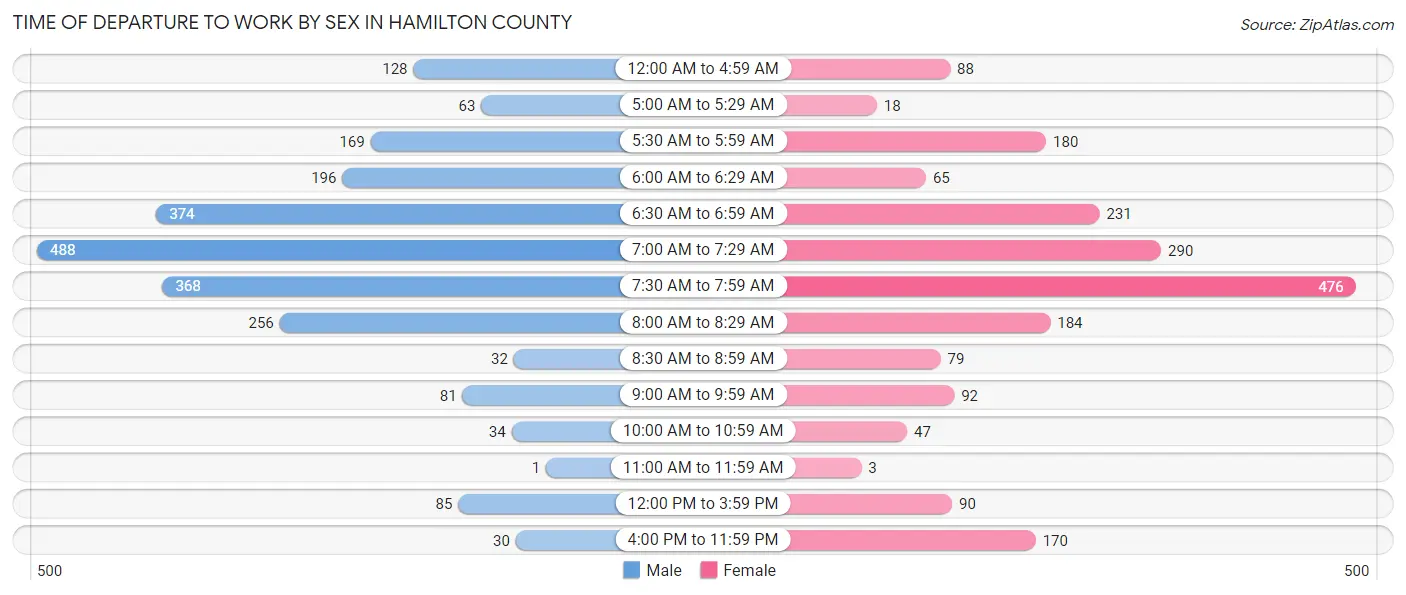
| Time of Departure | Male | Female |
| 12:00 AM to 4:59 AM | 128 (5.6%) | 88 (4.4%) |
| 5:00 AM to 5:29 AM | 63 (2.7%) | 18 (0.9%) |
| 5:30 AM to 5:59 AM | 169 (7.3%) | 180 (8.9%) |
| 6:00 AM to 6:29 AM | 196 (8.5%) | 65 (3.2%) |
| 6:30 AM to 6:59 AM | 374 (16.2%) | 231 (11.5%) |
| 7:00 AM to 7:29 AM | 488 (21.2%) | 290 (14.4%) |
| 7:30 AM to 7:59 AM | 368 (16.0%) | 476 (23.6%) |
| 8:00 AM to 8:29 AM | 256 (11.1%) | 184 (9.1%) |
| 8:30 AM to 8:59 AM | 32 (1.4%) | 79 (3.9%) |
| 9:00 AM to 9:59 AM | 81 (3.5%) | 92 (4.6%) |
| 10:00 AM to 10:59 AM | 34 (1.5%) | 47 (2.3%) |
| 11:00 AM to 11:59 AM | 1 (0.0%) | 3 (0.2%) |
| 12:00 PM to 3:59 PM | 85 (3.7%) | 90 (4.5%) |
| 4:00 PM to 11:59 PM | 30 (1.3%) | 170 (8.5%) |
| Total | 2,305 (100.0%) | 2,013 (100.0%) |
Housing Occupancy in Hamilton County
Occupancy by Ownership in Hamilton County
Of the total 3,577 dwellings in Hamilton County, owner-occupied units account for 2,897 (81.0%), while renter-occupied units make up 680 (19.0%).
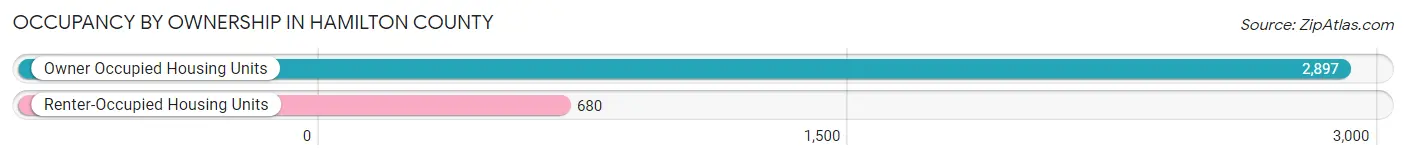
| Occupancy | # Housing Units | % Housing Units |
| Owner Occupied Housing Units | 2,897 | 81.0% |
| Renter-Occupied Housing Units | 680 | 19.0% |
| Total Occupied Housing Units | 3,577 | 100.0% |
Occupancy by Household Size in Hamilton County
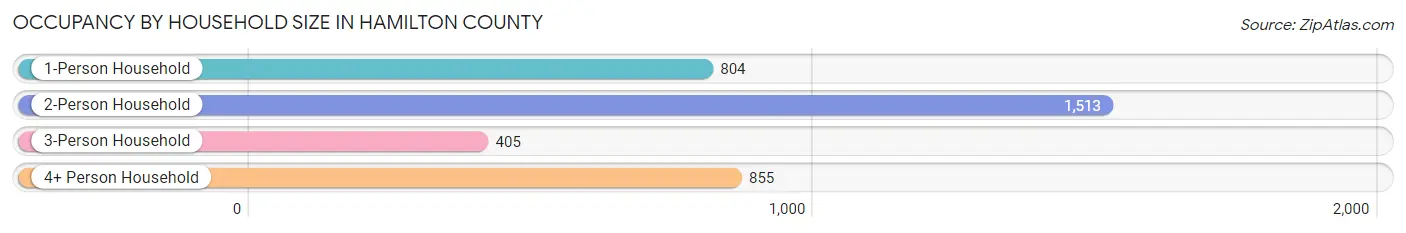
| Household Size | # Housing Units | % Housing Units |
| 1-Person Household | 804 | 22.5% |
| 2-Person Household | 1,513 | 42.3% |
| 3-Person Household | 405 | 11.3% |
| 4+ Person Household | 855 | 23.9% |
| Total Housing Units | 3,577 | 100.0% |
Occupancy by Ownership by Household Size in Hamilton County
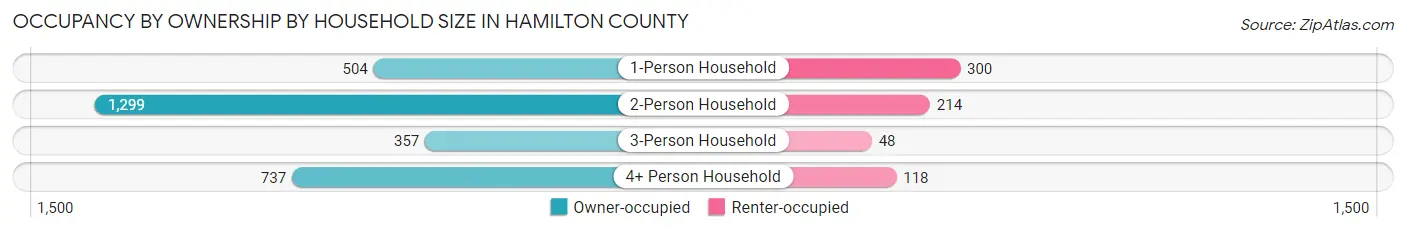
| Household Size | Owner-occupied | Renter-occupied |
| 1-Person Household | 504 (62.7%) | 300 (37.3%) |
| 2-Person Household | 1,299 (85.9%) | 214 (14.1%) |
| 3-Person Household | 357 (88.1%) | 48 (11.8%) |
| 4+ Person Household | 737 (86.2%) | 118 (13.8%) |
| Total Housing Units | 2,897 (81.0%) | 680 (19.0%) |
Occupancy by Educational Attainment in Hamilton County
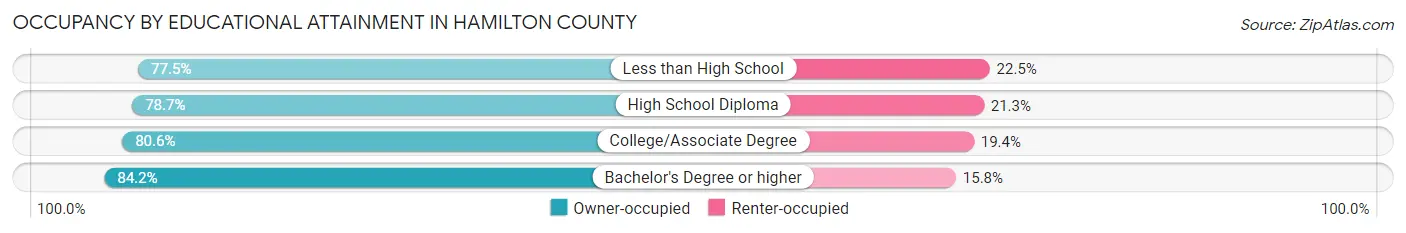
| Household Size | Owner-occupied | Renter-occupied |
| Less than High School | 62 (77.5%) | 18 (22.5%) |
| High School Diploma | 737 (78.7%) | 200 (21.3%) |
| College/Associate Degree | 1,304 (80.6%) | 313 (19.4%) |
| Bachelor's Degree or higher | 794 (84.2%) | 149 (15.8%) |
Occupancy by Age of Householder in Hamilton County
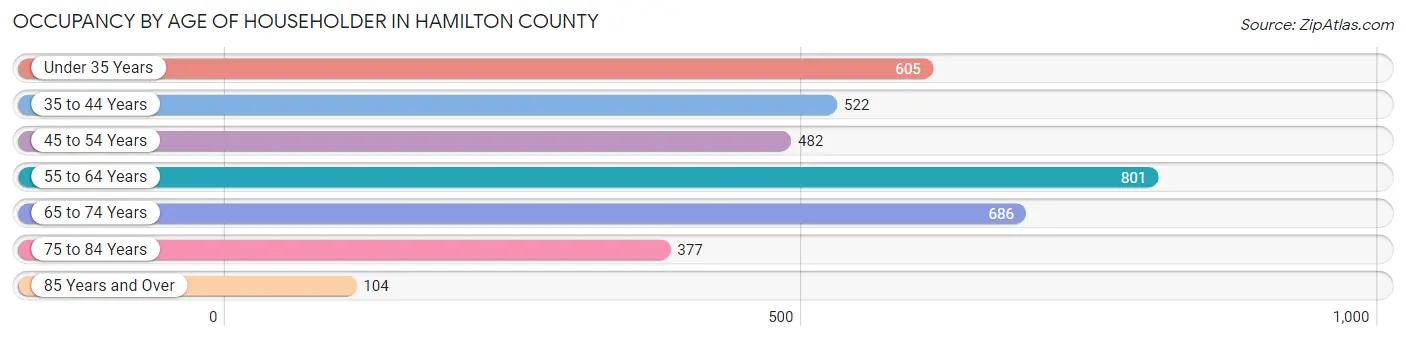
| Age Bracket | # Households | % Households |
| Under 35 Years | 605 | 16.9% |
| 35 to 44 Years | 522 | 14.6% |
| 45 to 54 Years | 482 | 13.5% |
| 55 to 64 Years | 801 | 22.4% |
| 65 to 74 Years | 686 | 19.2% |
| 75 to 84 Years | 377 | 10.5% |
| 85 Years and Over | 104 | 2.9% |
| Total | 3,577 | 100.0% |
Housing Finances in Hamilton County
Median Income by Occupancy in Hamilton County
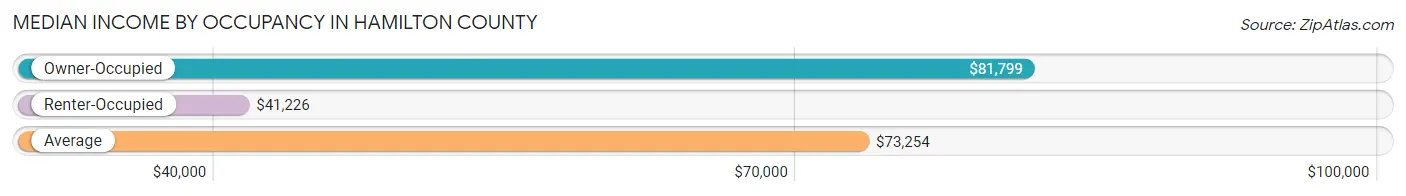
| Occupancy Type | # Households | Median Income |
| Owner-Occupied | 2,897 (81.0%) | $81,799 |
| Renter-Occupied | 680 (19.0%) | $41,226 |
| Average | 3,577 (100.0%) | $73,254 |
Occupancy by Householder Income Bracket in Hamilton County
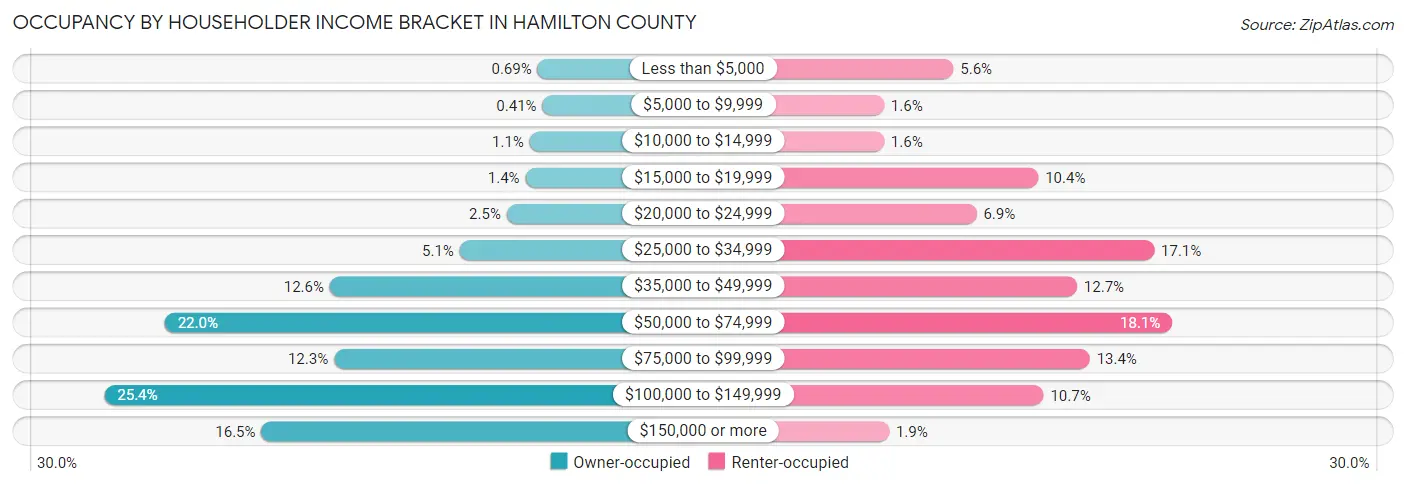
| Income Bracket | Owner-occupied | Renter-occupied |
| Less than $5,000 | 20 (0.7%) | 38 (5.6%) |
| $5,000 to $9,999 | 12 (0.4%) | 11 (1.6%) |
| $10,000 to $14,999 | 33 (1.1%) | 11 (1.6%) |
| $15,000 to $19,999 | 40 (1.4%) | 71 (10.4%) |
| $20,000 to $24,999 | 71 (2.5%) | 47 (6.9%) |
| $25,000 to $34,999 | 149 (5.1%) | 116 (17.1%) |
| $35,000 to $49,999 | 364 (12.6%) | 86 (12.7%) |
| $50,000 to $74,999 | 637 (22.0%) | 123 (18.1%) |
| $75,000 to $99,999 | 357 (12.3%) | 91 (13.4%) |
| $100,000 to $149,999 | 737 (25.4%) | 73 (10.7%) |
| $150,000 or more | 477 (16.5%) | 13 (1.9%) |
| Total | 2,897 (100.0%) | 680 (100.0%) |
Monthly Housing Cost Tiers in Hamilton County
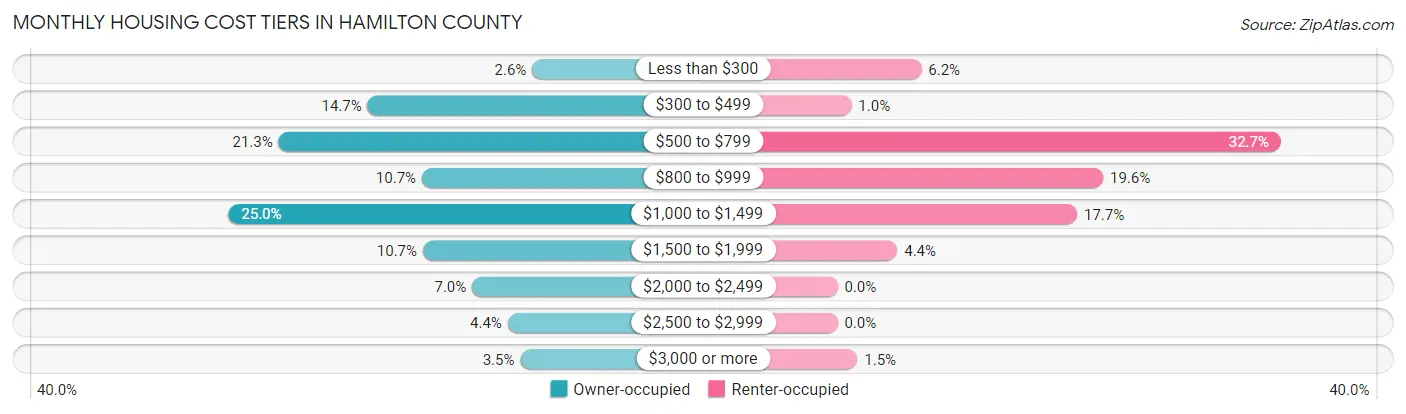
| Monthly Cost | Owner-occupied | Renter-occupied |
| Less than $300 | 76 (2.6%) | 42 (6.2%) |
| $300 to $499 | 427 (14.7%) | 7 (1.0%) |
| $500 to $799 | 617 (21.3%) | 222 (32.7%) |
| $800 to $999 | 311 (10.7%) | 133 (19.6%) |
| $1,000 to $1,499 | 724 (25.0%) | 120 (17.6%) |
| $1,500 to $1,999 | 309 (10.7%) | 30 (4.4%) |
| $2,000 to $2,499 | 204 (7.0%) | 0 (0.0%) |
| $2,500 to $2,999 | 128 (4.4%) | 0 (0.0%) |
| $3,000 or more | 101 (3.5%) | 10 (1.5%) |
| Total | 2,897 (100.0%) | 680 (100.0%) |
Physical Housing Characteristics in Hamilton County
Housing Structures in Hamilton County
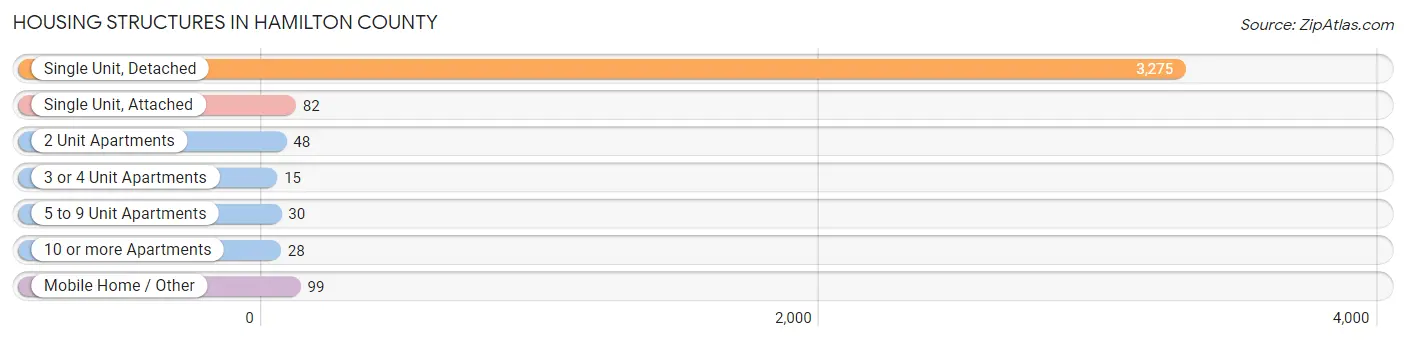
| Structure Type | # Housing Units | % Housing Units |
| Single Unit, Detached | 3,275 | 91.6% |
| Single Unit, Attached | 82 | 2.3% |
| 2 Unit Apartments | 48 | 1.3% |
| 3 or 4 Unit Apartments | 15 | 0.4% |
| 5 to 9 Unit Apartments | 30 | 0.8% |
| 10 or more Apartments | 28 | 0.8% |
| Mobile Home / Other | 99 | 2.8% |
| Total | 3,577 | 100.0% |
Housing Structures by Occupancy in Hamilton County
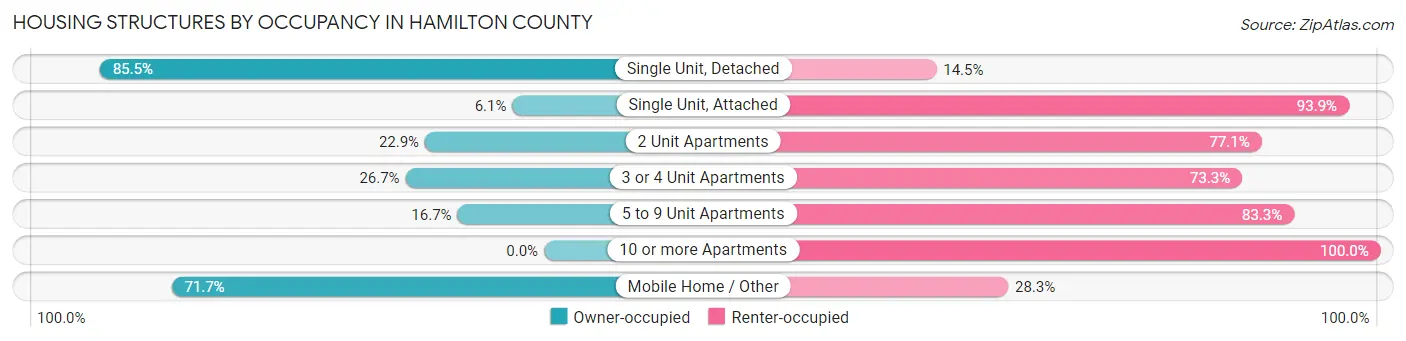
| Structure Type | Owner-occupied | Renter-occupied |
| Single Unit, Detached | 2,801 (85.5%) | 474 (14.5%) |
| Single Unit, Attached | 5 (6.1%) | 77 (93.9%) |
| 2 Unit Apartments | 11 (22.9%) | 37 (77.1%) |
| 3 or 4 Unit Apartments | 4 (26.7%) | 11 (73.3%) |
| 5 to 9 Unit Apartments | 5 (16.7%) | 25 (83.3%) |
| 10 or more Apartments | 0 (0.0%) | 28 (100.0%) |
| Mobile Home / Other | 71 (71.7%) | 28 (28.3%) |
| Total | 2,897 (81.0%) | 680 (19.0%) |
Housing Structures by Number of Rooms in Hamilton County
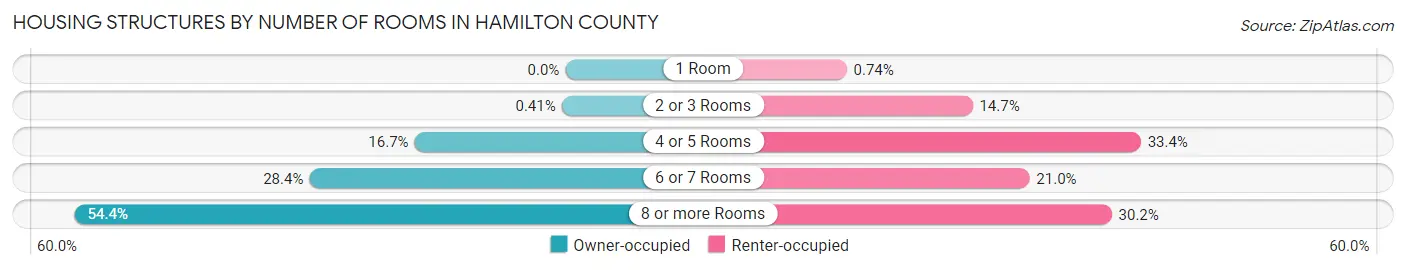
| Number of Rooms | Owner-occupied | Renter-occupied |
| 1 Room | 0 (0.0%) | 5 (0.7%) |
| 2 or 3 Rooms | 12 (0.4%) | 100 (14.7%) |
| 4 or 5 Rooms | 485 (16.7%) | 227 (33.4%) |
| 6 or 7 Rooms | 823 (28.4%) | 143 (21.0%) |
| 8 or more Rooms | 1,577 (54.4%) | 205 (30.1%) |
| Total | 2,897 (100.0%) | 680 (100.0%) |
Housing Structure by Heating Type in Hamilton County
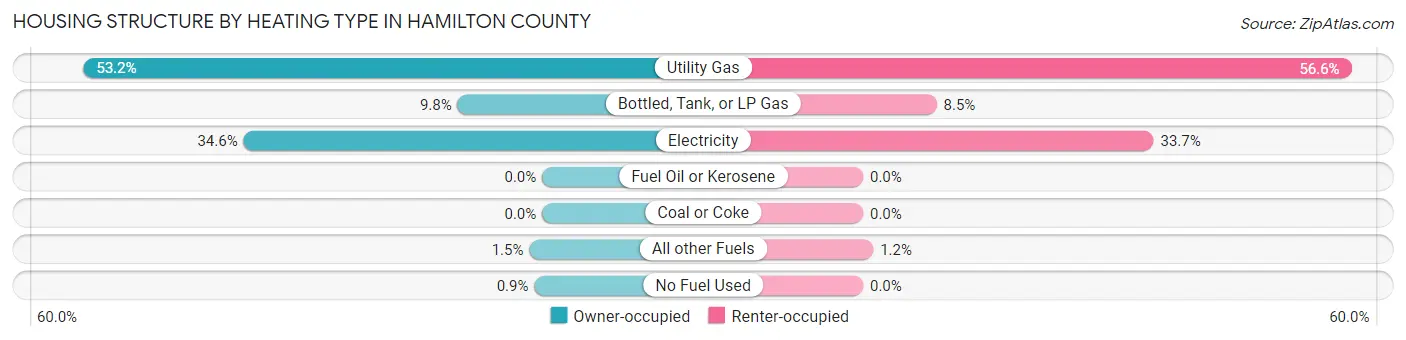
| Heating Type | Owner-occupied | Renter-occupied |
| Utility Gas | 1,541 (53.2%) | 385 (56.6%) |
| Bottled, Tank, or LP Gas | 284 (9.8%) | 58 (8.5%) |
| Electricity | 1,003 (34.6%) | 229 (33.7%) |
| Fuel Oil or Kerosene | 0 (0.0%) | 0 (0.0%) |
| Coal or Coke | 0 (0.0%) | 0 (0.0%) |
| All other Fuels | 43 (1.5%) | 8 (1.2%) |
| No Fuel Used | 26 (0.9%) | 0 (0.0%) |
| Total | 2,897 (100.0%) | 680 (100.0%) |
Household Vehicle Usage in Hamilton County
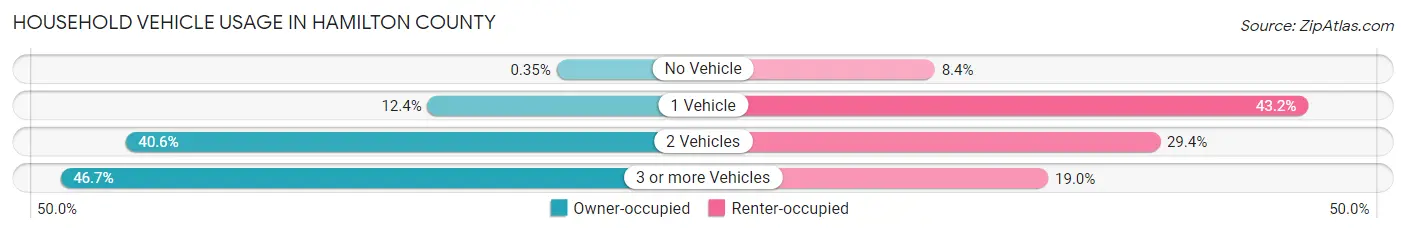
| Vehicles per Household | Owner-occupied | Renter-occupied |
| No Vehicle | 10 (0.4%) | 57 (8.4%) |
| 1 Vehicle | 359 (12.4%) | 294 (43.2%) |
| 2 Vehicles | 1,176 (40.6%) | 200 (29.4%) |
| 3 or more Vehicles | 1,352 (46.7%) | 129 (19.0%) |
| Total | 2,897 (100.0%) | 680 (100.0%) |
Real Estate & Mortgages in Hamilton County
Real Estate and Mortgage Overview in Hamilton County
| Characteristic | Without Mortgage | With Mortgage |
| Housing Units | 1,136 | 1,761 |
| Median Property Value | $200,000 | $202,300 |
| Median Household Income | $70,219 | $360 |
| Monthly Housing Costs | $531 | $101 |
| Real Estate Taxes | $1,959 | $34 |
Property Value by Mortgage Status in Hamilton County
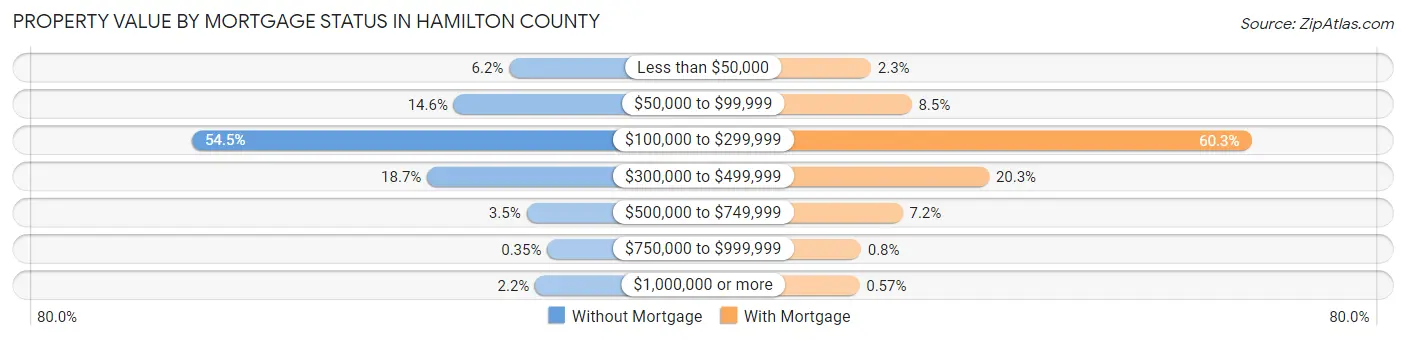
| Property Value | Without Mortgage | With Mortgage |
| Less than $50,000 | 70 (6.2%) | 41 (2.3%) |
| $50,000 to $99,999 | 166 (14.6%) | 150 (8.5%) |
| $100,000 to $299,999 | 619 (54.5%) | 1,062 (60.3%) |
| $300,000 to $499,999 | 212 (18.7%) | 358 (20.3%) |
| $500,000 to $749,999 | 40 (3.5%) | 126 (7.2%) |
| $750,000 to $999,999 | 4 (0.4%) | 14 (0.8%) |
| $1,000,000 or more | 25 (2.2%) | 10 (0.6%) |
| Total | 1,136 (100.0%) | 1,761 (100.0%) |
Household Income by Mortgage Status in Hamilton County
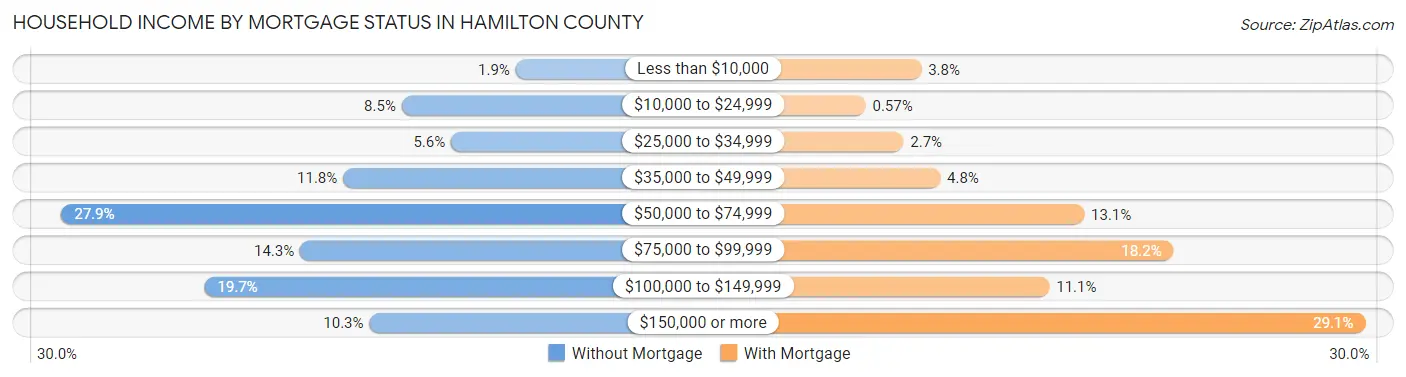
| Household Income | Without Mortgage | With Mortgage |
| Less than $10,000 | 22 (1.9%) | 66 (3.7%) |
| $10,000 to $24,999 | 96 (8.5%) | 10 (0.6%) |
| $25,000 to $34,999 | 64 (5.6%) | 48 (2.7%) |
| $35,000 to $49,999 | 134 (11.8%) | 85 (4.8%) |
| $50,000 to $74,999 | 317 (27.9%) | 230 (13.1%) |
| $75,000 to $99,999 | 162 (14.3%) | 320 (18.2%) |
| $100,000 to $149,999 | 224 (19.7%) | 195 (11.1%) |
| $150,000 or more | 117 (10.3%) | 513 (29.1%) |
| Total | 1,136 (100.0%) | 1,761 (100.0%) |
Property Value to Household Income Ratio in Hamilton County
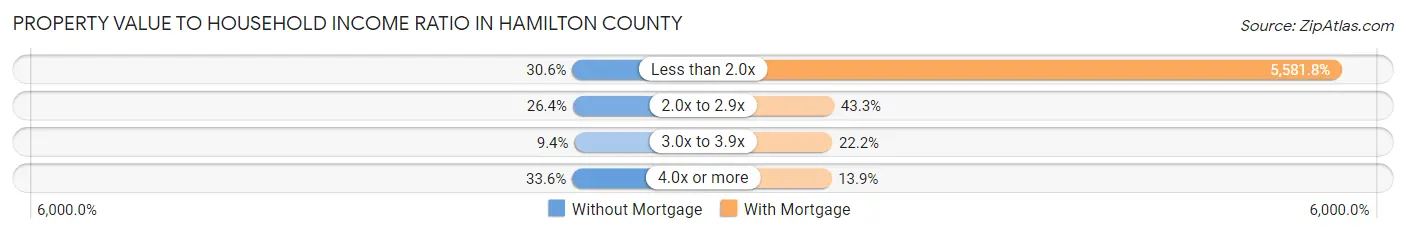
| Value-to-Income Ratio | Without Mortgage | With Mortgage |
| Less than 2.0x | 347 (30.5%) | 98,295 (5,581.8%) |
| 2.0x to 2.9x | 300 (26.4%) | 762 (43.3%) |
| 3.0x to 3.9x | 107 (9.4%) | 391 (22.2%) |
| 4.0x or more | 382 (33.6%) | 245 (13.9%) |
| Total | 1,136 (100.0%) | 1,761 (100.0%) |
Real Estate Taxes by Mortgage Status in Hamilton County
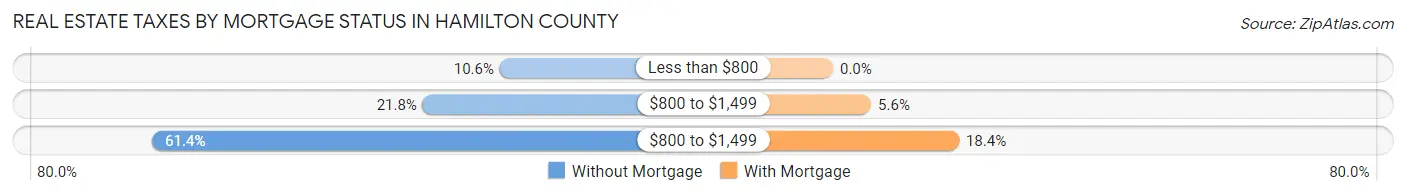
| Property Taxes | Without Mortgage | With Mortgage |
| Less than $800 | 120 (10.6%) | 0 (0.0%) |
| $800 to $1,499 | 248 (21.8%) | 98 (5.6%) |
| $800 to $1,499 | 697 (61.4%) | 324 (18.4%) |
| Total | 1,136 (100.0%) | 1,761 (100.0%) |
Health & Disability in Hamilton County
Health Insurance Coverage by Age in Hamilton County
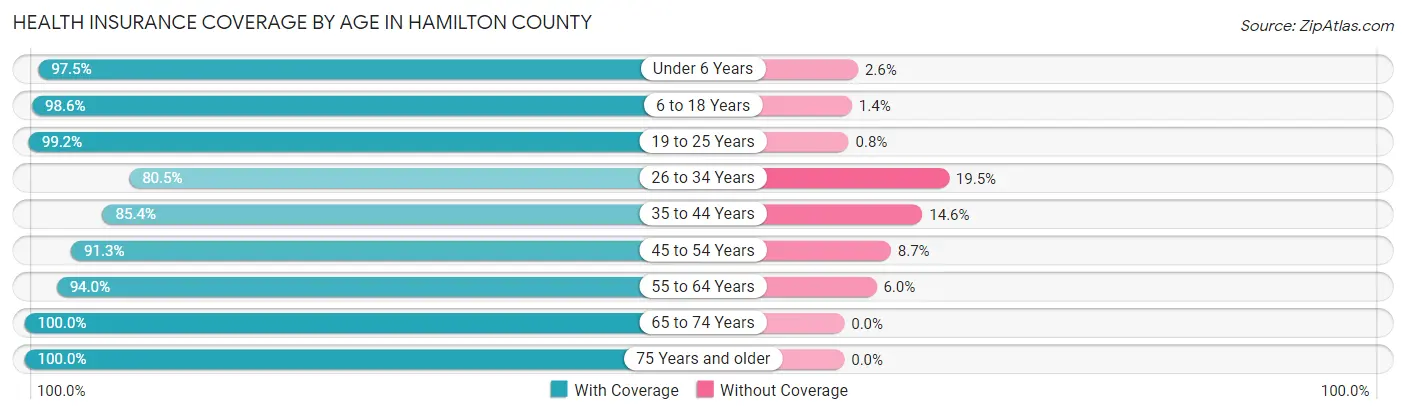
| Age Bracket | With Coverage | Without Coverage |
| Under 6 Years | 689 (97.5%) | 18 (2.5%) |
| 6 to 18 Years | 1,665 (98.6%) | 24 (1.4%) |
| 19 to 25 Years | 740 (99.2%) | 6 (0.8%) |
| 26 to 34 Years | 693 (80.5%) | 168 (19.5%) |
| 35 to 44 Years | 921 (85.4%) | 157 (14.6%) |
| 45 to 54 Years | 989 (91.3%) | 94 (8.7%) |
| 55 to 64 Years | 1,174 (94.0%) | 75 (6.0%) |
| 65 to 74 Years | 1,058 (100.0%) | 0 (0.0%) |
| 75 Years and older | 792 (100.0%) | 0 (0.0%) |
| Total | 8,721 (94.2%) | 542 (5.9%) |
Health Insurance Coverage by Citizenship Status in Hamilton County
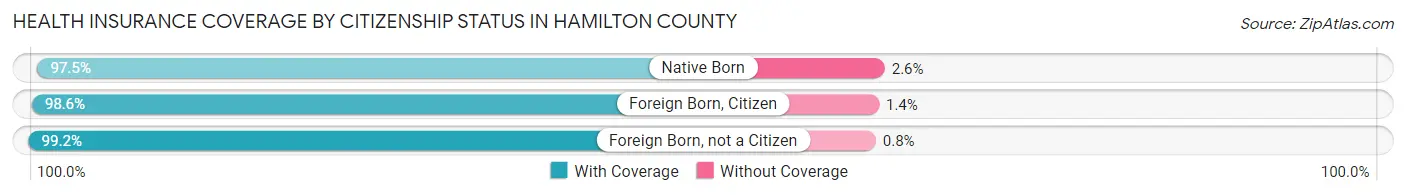
| Citizenship Status | With Coverage | Without Coverage |
| Native Born | 689 (97.5%) | 18 (2.5%) |
| Foreign Born, Citizen | 1,665 (98.6%) | 24 (1.4%) |
| Foreign Born, not a Citizen | 740 (99.2%) | 6 (0.8%) |
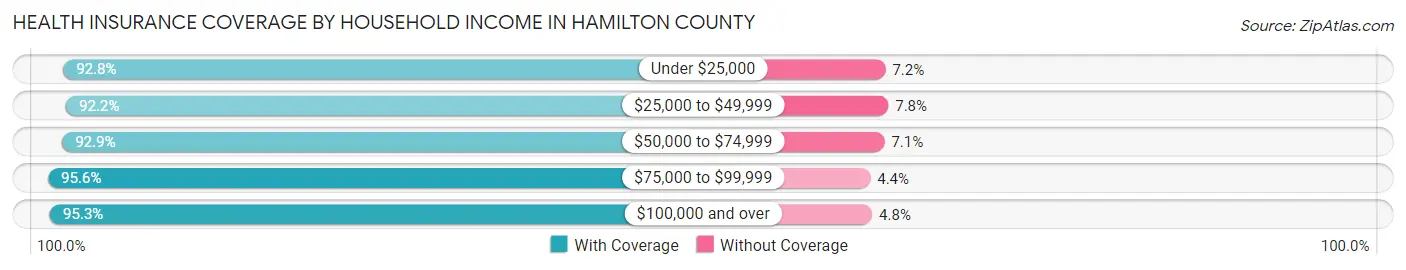
Health Insurance Coverage by Household Income in Hamilton County
| Household Income | With Coverage | Without Coverage |
| Under $25,000 | 397 (92.8%) | 31 (7.2%) |
| $25,000 to $49,999 | 1,400 (92.2%) | 118 (7.8%) |
| $50,000 to $74,999 | 1,921 (92.9%) | 146 (7.1%) |
| $75,000 to $99,999 | 1,173 (95.6%) | 54 (4.4%) |
| $100,000 and over | 3,828 (95.3%) | 191 (4.8%) |
Public vs Private Health Insurance Coverage by Age in Hamilton County
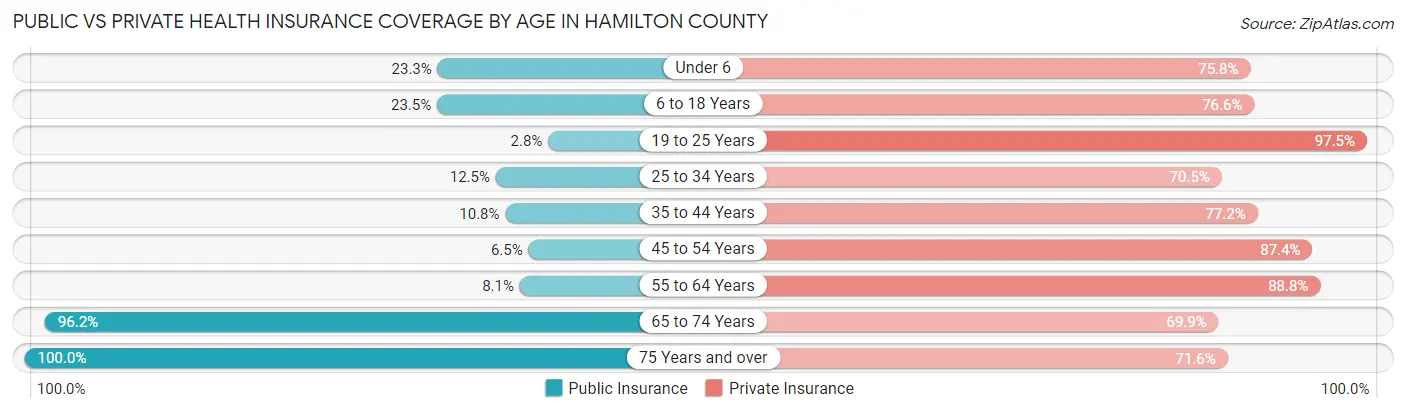
| Age Bracket | Public Insurance | Private Insurance |
| Under 6 | 165 (23.3%) | 536 (75.8%) |
| 6 to 18 Years | 396 (23.4%) | 1,293 (76.5%) |
| 19 to 25 Years | 21 (2.8%) | 727 (97.5%) |
| 25 to 34 Years | 108 (12.5%) | 607 (70.5%) |
| 35 to 44 Years | 116 (10.8%) | 832 (77.2%) |
| 45 to 54 Years | 70 (6.5%) | 946 (87.4%) |
| 55 to 64 Years | 101 (8.1%) | 1,109 (88.8%) |
| 65 to 74 Years | 1,018 (96.2%) | 740 (69.9%) |
| 75 Years and over | 792 (100.0%) | 567 (71.6%) |
| Total | 2,787 (30.1%) | 7,357 (79.4%) |
Disability Status by Sex by Age in Hamilton County
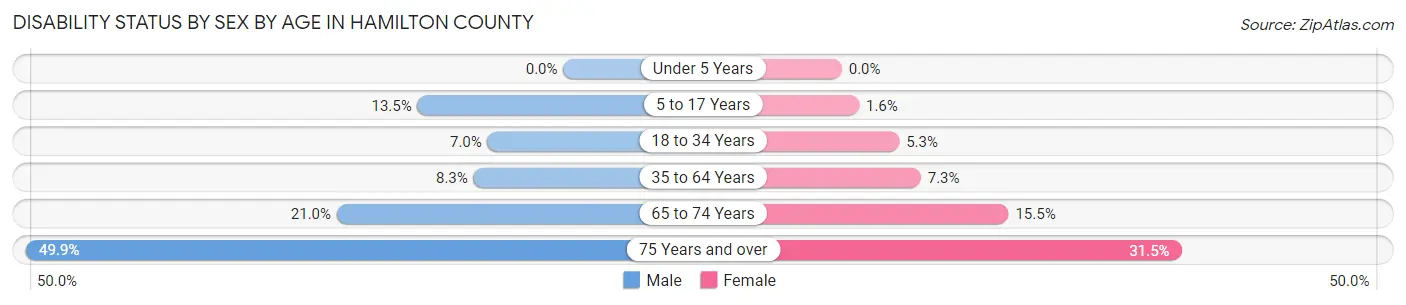
| Age Bracket | Male | Female |
| Under 5 Years | 0 (0.0%) | 0 (0.0%) |
| 5 to 17 Years | 120 (13.5%) | 13 (1.6%) |
| 18 to 34 Years | 62 (7.0%) | 44 (5.3%) |
| 35 to 64 Years | 141 (8.3%) | 126 (7.3%) |
| 65 to 74 Years | 111 (21.0%) | 82 (15.5%) |
| 75 Years and over | 175 (49.9%) | 139 (31.5%) |
Disability Class by Sex by Age in Hamilton County
Disability Class: Hearing Difficulty
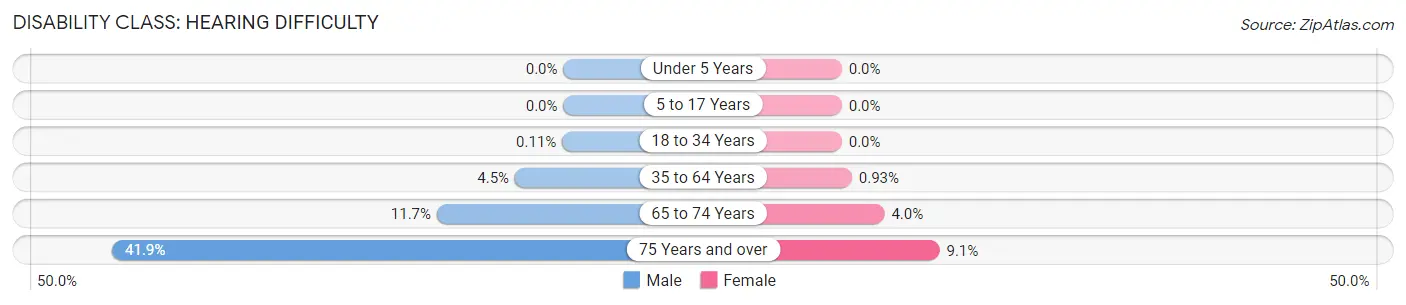
| Age Bracket | Male | Female |
| Under 5 Years | 0 (0.0%) | 0 (0.0%) |
| 5 to 17 Years | 0 (0.0%) | 0 (0.0%) |
| 18 to 34 Years | 1 (0.1%) | 0 (0.0%) |
| 35 to 64 Years | 76 (4.5%) | 16 (0.9%) |
| 65 to 74 Years | 62 (11.7%) | 21 (4.0%) |
| 75 Years and over | 147 (41.9%) | 40 (9.1%) |
Disability Class: Vision Difficulty
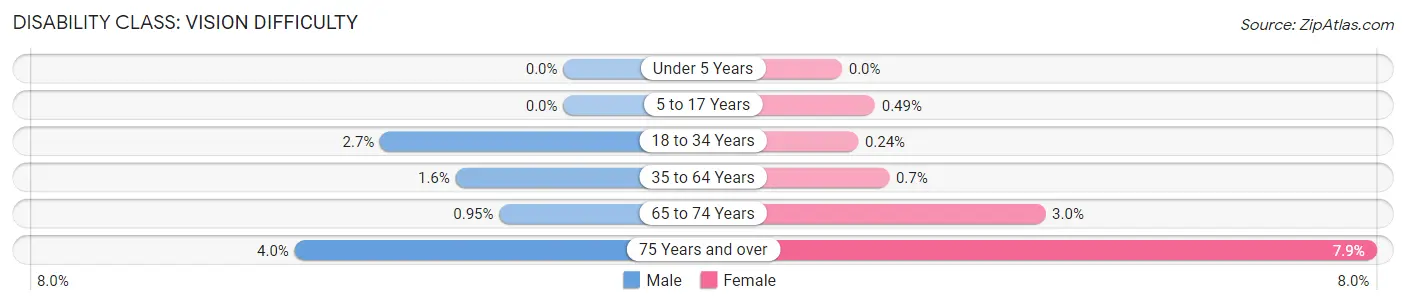
| Age Bracket | Male | Female |
| Under 5 Years | 0 (0.0%) | 0 (0.0%) |
| 5 to 17 Years | 0 (0.0%) | 4 (0.5%) |
| 18 to 34 Years | 24 (2.7%) | 2 (0.2%) |
| 35 to 64 Years | 27 (1.6%) | 12 (0.7%) |
| 65 to 74 Years | 5 (0.9%) | 16 (3.0%) |
| 75 Years and over | 14 (4.0%) | 35 (7.9%) |
Disability Class: Cognitive Difficulty
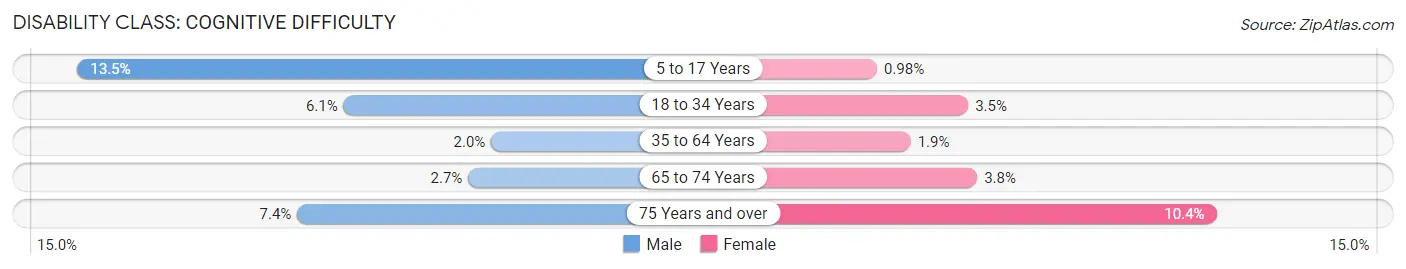
| Age Bracket | Male | Female |
| 5 to 17 Years | 120 (13.5%) | 8 (1.0%) |
| 18 to 34 Years | 54 (6.1%) | 29 (3.5%) |
| 35 to 64 Years | 34 (2.0%) | 33 (1.9%) |
| 65 to 74 Years | 14 (2.6%) | 20 (3.8%) |
| 75 Years and over | 26 (7.4%) | 46 (10.4%) |
Disability Class: Ambulatory Difficulty
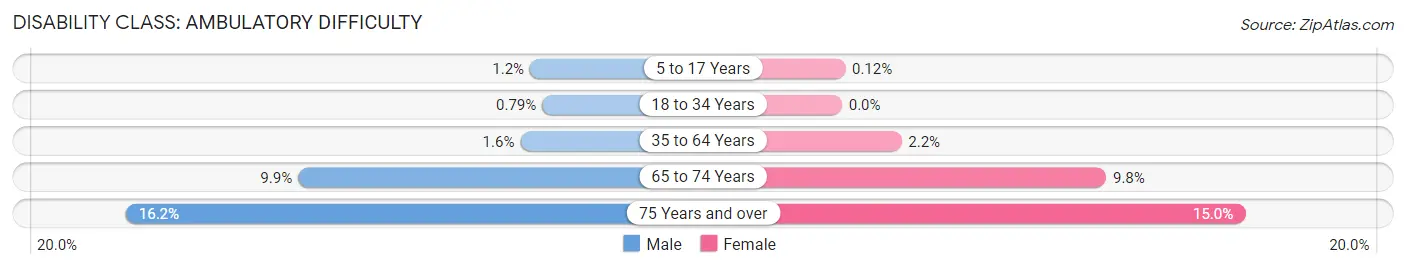
| Age Bracket | Male | Female |
| 5 to 17 Years | 11 (1.2%) | 1 (0.1%) |
| 18 to 34 Years | 7 (0.8%) | 0 (0.0%) |
| 35 to 64 Years | 27 (1.6%) | 38 (2.2%) |
| 65 to 74 Years | 52 (9.9%) | 52 (9.8%) |
| 75 Years and over | 57 (16.2%) | 66 (15.0%) |
Disability Class: Self-Care Difficulty
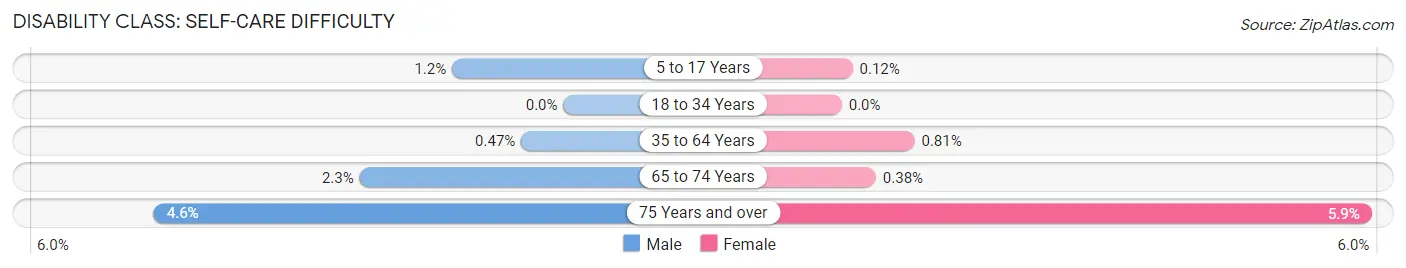
| Age Bracket | Male | Female |
| 5 to 17 Years | 11 (1.2%) | 1 (0.1%) |
| 18 to 34 Years | 0 (0.0%) | 0 (0.0%) |
| 35 to 64 Years | 8 (0.5%) | 14 (0.8%) |
| 65 to 74 Years | 12 (2.3%) | 2 (0.4%) |
| 75 Years and over | 16 (4.6%) | 26 (5.9%) |
Technology Access in Hamilton County
Computing Device Access in Hamilton County
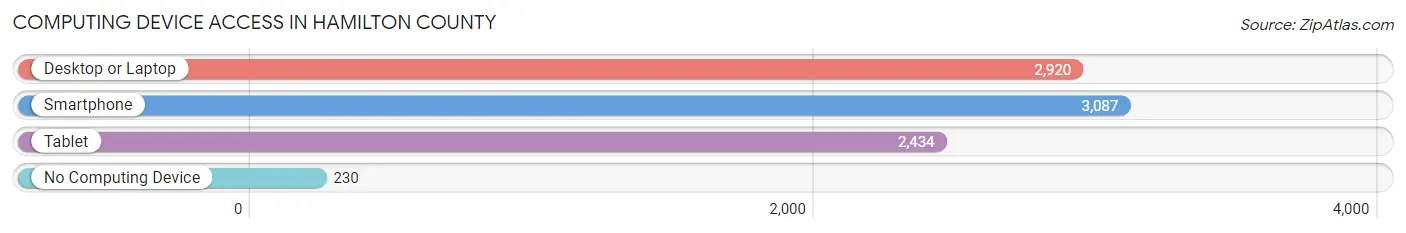
| Device Type | # Households | % Households |
| Desktop or Laptop | 2,920 | 81.6% |
| Smartphone | 3,087 | 86.3% |
| Tablet | 2,434 | 68.0% |
| No Computing Device | 230 | 6.4% |
| Total | 3,577 | 100.0% |
Internet Access in Hamilton County
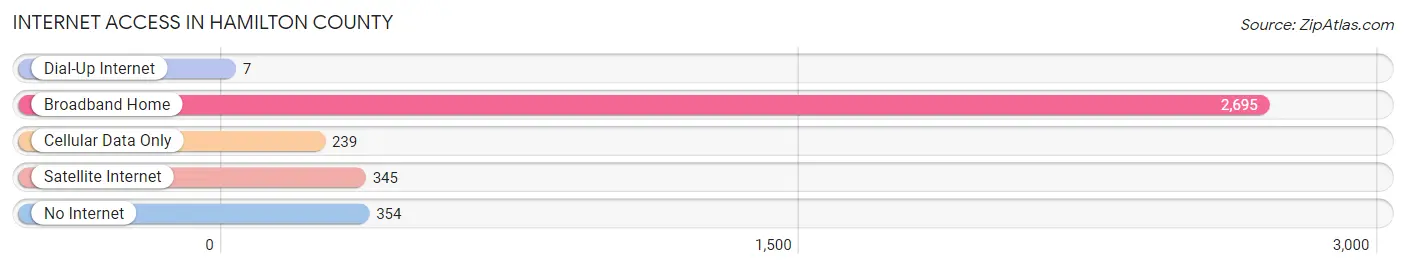
| Internet Type | # Households | % Households |
| Dial-Up Internet | 7 | 0.2% |
| Broadband Home | 2,695 | 75.3% |
| Cellular Data Only | 239 | 6.7% |
| Satellite Internet | 345 | 9.6% |
| No Internet | 354 | 9.9% |
| Total | 3,577 | 100.0% |
Hamilton County Summary
Hamilton County is located in the state of Nebraska in the Midwestern United States. It is bordered by Hall, Merrick, and Howard counties to the north, Platte and Buffalo counties to the east, Kearney and Phelps counties to the south, and Greeley and Wheeler counties to the west. The county seat is Aurora, and the largest city is Grand Island. The county was named after Alexander Hamilton, the first Secretary of the Treasury.
History
The area that is now Hamilton County was first inhabited by the Pawnee and Otoe tribes. The first white settlers arrived in the area in the late 1840s, and the county was officially established in 1856. The county was named after Alexander Hamilton, the first Secretary of the Treasury.
The first railroad line in the county was built in 1867, connecting Grand Island to Aurora. This line was later extended to Kearney and eventually to Denver. The railroad helped to spur economic growth in the county, and by the early 1900s, the county was home to several small towns and villages.
In the early 20th century, the county experienced a population boom as immigrants from Europe and other parts of the United States moved to the area. This influx of people helped to spur economic growth in the county, and by the mid-20th century, the county was home to several large industries, including a sugar beet processing plant, a meat packing plant, and a dairy.
Geography
Hamilton County is located in the central part of Nebraska. It is bordered by Hall, Merrick, and Howard counties to the north, Platte and Buffalo counties to the east, Kearney and Phelps counties to the south, and Greeley and Wheeler counties to the west. The county has a total area of 845 square miles, of which 843 square miles is land and 2 square miles is water.
The county is mostly flat, with some rolling hills in the northern and western parts. The Platte River runs through the county, and there are several small lakes and ponds scattered throughout the area. The county is home to several state parks, including Grand Island State Recreation Area, Platte River State Park, and Hamilton County State Wildlife Management Area.
Economy
The economy of Hamilton County is largely based on agriculture. The county is home to several large farms, and the main crops grown in the area are corn, soybeans, wheat, and hay. The county is also home to several large food processing plants, including a sugar beet processing plant, a meat packing plant, and a dairy.
The county is also home to several manufacturing companies, including a plastics manufacturer, a metal fabrication plant, and a machine shop. The county is also home to several retail stores, restaurants, and other businesses.
Demographics
As of the 2010 census, the population of Hamilton County was 35,766. The racial makeup of the county was 92.3% White, 0.7% African American, 0.4% Native American, 0.7% Asian, 0.1% Pacific Islander, 4.2% from other races, and 1.6% from two or more races. Hispanic or Latino of any race were 8.2% of the population.
The median income for a household in the county was $45,945, and the median income for a family was $54,945. The per capita income for the county was $21,945. About 8.2% of families and 11.2% of the population were below the poverty line, including 15.2% of those under age 18 and 8.2% of those age 65 or over.
Common Questions
What is the Total Population of Hamilton County?
Total Population of Hamilton County is 9,400.
What is the Total Male Population of Hamilton County?
Total Male Population of Hamilton County is 4,738.
What is the Total Female Population of Hamilton County?
Total Female Population of Hamilton County is 4,662.
What is the Ratio of Males per 100 Females in Hamilton County?
There are 101.63 Males per 100 Females in Hamilton County.
What is the Ratio of Females per 100 Males in Hamilton County?
There are 98.40 Females per 100 Males in Hamilton County.
What is the Median Population Age in Hamilton County?
Median Population Age in Hamilton County is 41.3 Years.
What is the Average Family Size in Hamilton County
Average Family Size in Hamilton County is 3.1 People.
What is the Average Household Size in Hamilton County
Average Household Size in Hamilton County is 2.6 People.
What is Per Capita Income in Hamilton County?
Per Capita income in Hamilton County is $34,813.
What is the Median Family Income in Hamilton County?
Median Family Income in Hamilton County is $90,913.
What is the Median Household income in Hamilton County?
Median Household Income in Hamilton County is $73,254.
What is Income or Wage Gap in Hamilton County?
Income or Wage Gap in Hamilton County is 42.1%.
Women in Hamilton County earn 57.9 cents for every dollar earned by a man.
What is Inequality or Gini Index in Hamilton County?
Inequality or Gini Index in Hamilton County is 0.37.
How Large is the Labor Force in Hamilton County?
There are 4,906 People in the Labor Forcein in Hamilton County.
What is the Percentage of People in the Labor Force in Hamilton County?
66.9% of People are in the Labor Force in Hamilton County.
What is the Unemployment Rate in Hamilton County?
Unemployment Rate in Hamilton County is 3.6%.