Dawson County, NE
Dawson County Map
Dawson County Overview
24,037
TOTAL POPULATION
12,528
MALE POPULATION
11,509
FEMALE POPULATION
108.85
MALES / 100 FEMALES
91.87
FEMALES / 100 MALES
35.9
MEDIAN AGE
3.2
AVG FAMILY SIZE
2.7
AVG HOUSEHOLD SIZE
$34,648
PER CAPITA INCOME
$77,492
AVG FAMILY INCOME
$67,462
AVG HOUSEHOLD INCOME
29.2%
WAGE / INCOME GAP [ % ]
70.8¢/ $1
WAGE / INCOME GAP [ $ ]
$10,347
FAMILY INCOME DEFICIT
0.43
INEQUALITY / GINI INDEX
12,669
LABOR FORCE [ PEOPLE ]
69.5%
PERCENT IN LABOR FORCE
2.1%
UNEMPLOYMENT RATE
Dawson County Area Codes
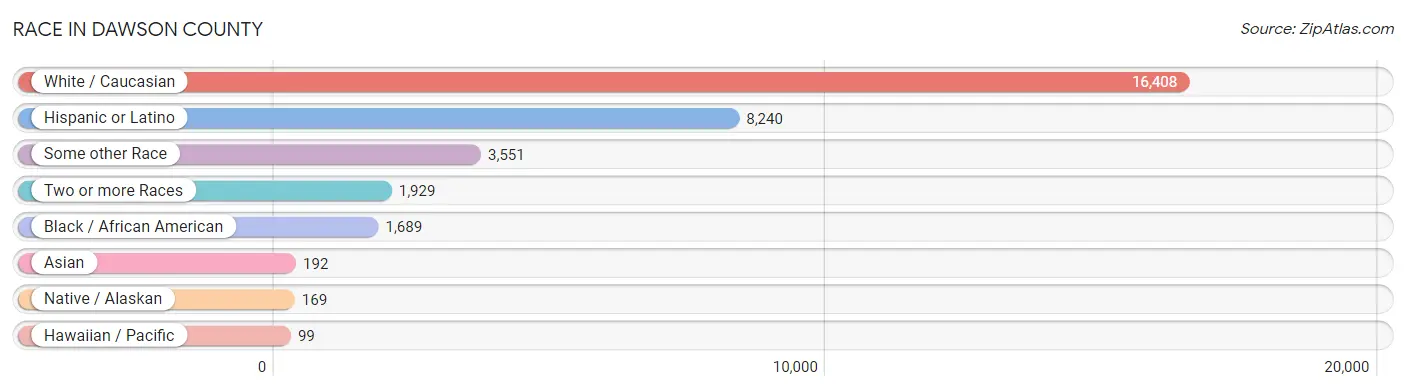
Race in Dawson County
The most populous races in Dawson County are White / Caucasian (16,408 | 68.3%), Hispanic or Latino (8,240 | 34.3%), and Some other Race (3,551 | 14.8%).
| Race | # Population | % Population |
| Asian | 192 | 0.8% |
| Black / African American | 1,689 | 7.0% |
| Hawaiian / Pacific | 99 | 0.4% |
| Hispanic or Latino | 8,240 | 34.3% |
| Native / Alaskan | 169 | 0.7% |
| White / Caucasian | 16,408 | 68.3% |
| Two or more Races | 1,929 | 8.0% |
| Some other Race | 3,551 | 14.8% |
| Total | 24,037 | 100.0% |
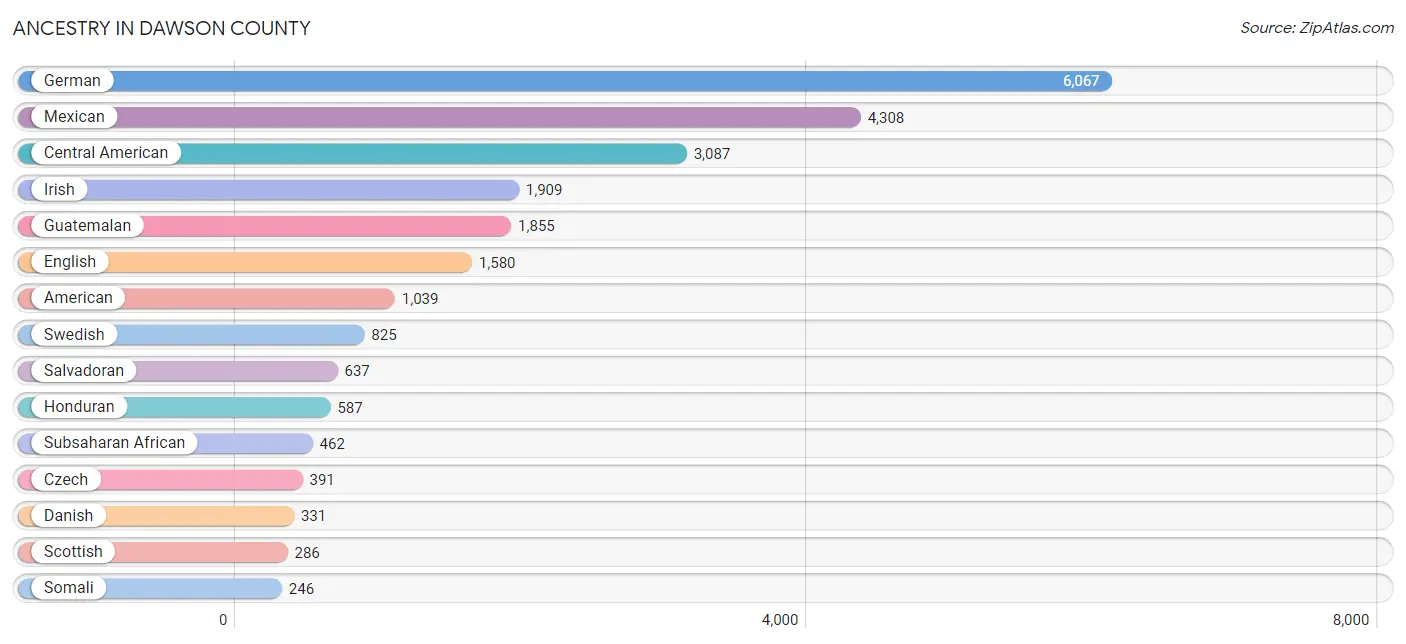
Ancestry in Dawson County
The most populous ancestries reported in Dawson County are German (6,067 | 25.2%), Mexican (4,308 | 17.9%), Central American (3,087 | 12.8%), Irish (1,909 | 7.9%), and Guatemalan (1,855 | 7.7%), together accounting for 71.7% of all Dawson County residents.
| Ancestry | # Population | % Population |
| African | 120 | 0.5% |
| American | 1,039 | 4.3% |
| Arab | 56 | 0.2% |
| Argentinean | 99 | 0.4% |
| Austrian | 4 | 0.0% |
| Belgian | 33 | 0.1% |
| Bhutanese | 16 | 0.1% |
| British | 57 | 0.2% |
| Burmese | 32 | 0.1% |
| Cambodian | 36 | 0.2% |
| Canadian | 68 | 0.3% |
| Celtic | 4 | 0.0% |
| Central American | 3,087 | 12.8% |
| Central American Indian | 37 | 0.2% |
| Cherokee | 15 | 0.1% |
| Cheyenne | 5 | 0.0% |
| Colombian | 35 | 0.2% |
| Cuban | 193 | 0.8% |
| Czech | 391 | 1.6% |
| Czechoslovakian | 32 | 0.1% |
| Danish | 331 | 1.4% |
| Dutch | 215 | 0.9% |
| Eastern European | 2 | 0.0% |
| English | 1,580 | 6.6% |
| European | 145 | 0.6% |
| French | 232 | 1.0% |
| French Canadian | 12 | 0.1% |
| German | 6,067 | 25.2% |
| German Russian | 4 | 0.0% |
| Greek | 5 | 0.0% |
| Guamanian / Chamorro | 62 | 0.3% |
| Guatemalan | 1,855 | 7.7% |
| Honduran | 587 | 2.4% |
| Hungarian | 15 | 0.1% |
| Indian (Asian) | 19 | 0.1% |
| Irish | 1,909 | 7.9% |
| Italian | 99 | 0.4% |
| Jamaican | 2 | 0.0% |
| Kenyan | 51 | 0.2% |
| Korean | 193 | 0.8% |
| Lebanese | 56 | 0.2% |
| Mexican | 4,308 | 17.9% |
| Mexican American Indian | 61 | 0.3% |
| Native Hawaiian | 37 | 0.2% |
| Nicaraguan | 8 | 0.0% |
| Nigerian | 8 | 0.0% |
| Northern European | 68 | 0.3% |
| Norwegian | 170 | 0.7% |
| Paiute | 6 | 0.0% |
| Pennsylvania German | 12 | 0.1% |
| Polish | 233 | 1.0% |
| Russian | 26 | 0.1% |
| Salvadoran | 637 | 2.6% |
| Scandinavian | 43 | 0.2% |
| Scotch-Irish | 57 | 0.2% |
| Scottish | 286 | 1.2% |
| Sioux | 69 | 0.3% |
| Somali | 246 | 1.0% |
| South American | 134 | 0.6% |
| Spaniard | 43 | 0.2% |
| Sri Lankan | 47 | 0.2% |
| Subsaharan African | 462 | 1.9% |
| Sudanese | 37 | 0.2% |
| Swedish | 825 | 3.4% |
| Swiss | 27 | 0.1% |
| Turkish | 7 | 0.0% |
| Ukrainian | 8 | 0.0% |
| Welsh | 181 | 0.7% | View All 68 Rows |
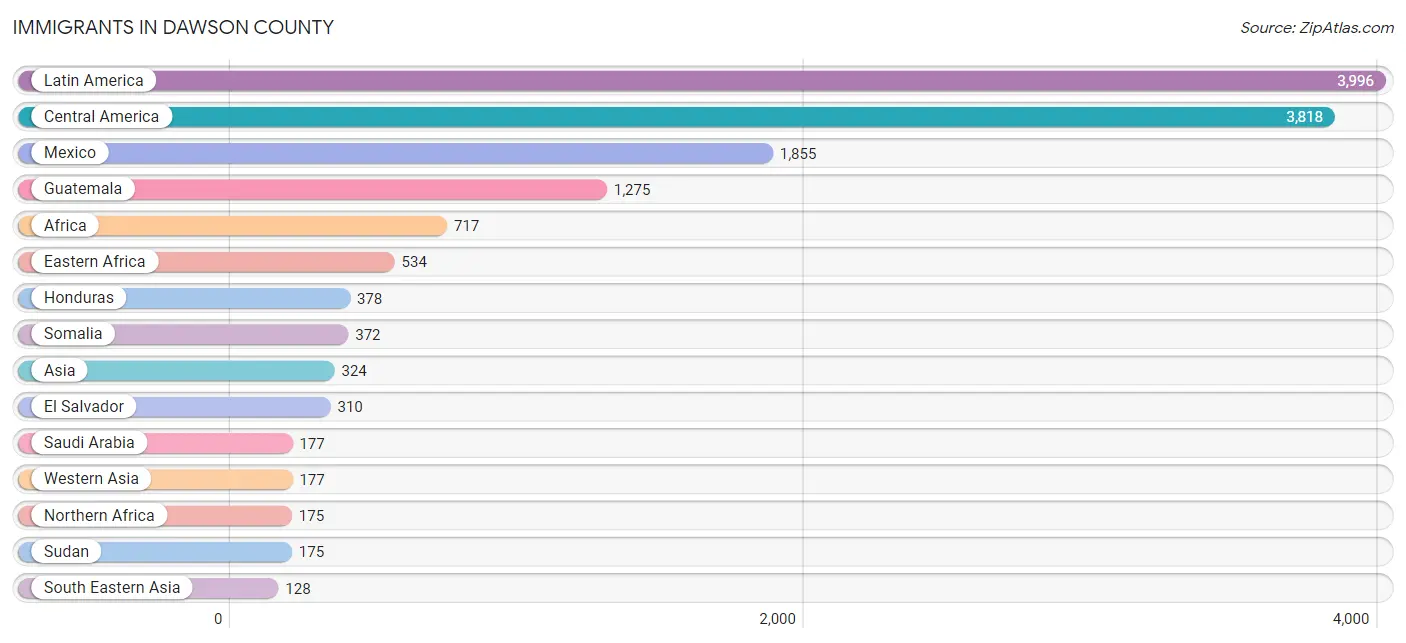
Immigrants in Dawson County
The most numerous immigrant groups reported in Dawson County came from Latin America (3,996 | 16.6%), Central America (3,818 | 15.9%), Mexico (1,855 | 7.7%), Guatemala (1,275 | 5.3%), and Africa (717 | 3.0%), together accounting for 48.5% of all Dawson County residents.
| Immigration Origin | # Population | % Population |
| Africa | 717 | 3.0% |
| Asia | 324 | 1.3% |
| Australia | 6 | 0.0% |
| Belgium | 5 | 0.0% |
| Brazil | 18 | 0.1% |
| Canada | 13 | 0.1% |
| Caribbean | 125 | 0.5% |
| Central America | 3,818 | 15.9% |
| Colombia | 35 | 0.2% |
| Cuba | 123 | 0.5% |
| Eastern Africa | 534 | 2.2% |
| Eastern Asia | 16 | 0.1% |
| El Salvador | 310 | 1.3% |
| England | 11 | 0.1% |
| Ethiopia | 100 | 0.4% |
| Europe | 58 | 0.2% |
| Germany | 11 | 0.1% |
| Guatemala | 1,275 | 5.3% |
| Honduras | 378 | 1.6% |
| India | 3 | 0.0% |
| Jamaica | 2 | 0.0% |
| Kenya | 62 | 0.3% |
| Korea | 16 | 0.1% |
| Latin America | 3,996 | 16.6% |
| Mexico | 1,855 | 7.7% |
| Netherlands | 9 | 0.0% |
| Nigeria | 8 | 0.0% |
| Northern Africa | 175 | 0.7% |
| Northern Europe | 11 | 0.1% |
| Oceania | 6 | 0.0% |
| Philippines | 68 | 0.3% |
| Saudi Arabia | 177 | 0.7% |
| Somalia | 372 | 1.5% |
| South America | 53 | 0.2% |
| South Central Asia | 3 | 0.0% |
| South Eastern Asia | 128 | 0.5% |
| Southern Europe | 22 | 0.1% |
| Spain | 22 | 0.1% |
| Sudan | 175 | 0.7% |
| Vietnam | 60 | 0.3% |
| Western Africa | 8 | 0.0% |
| Western Asia | 177 | 0.7% |
| Western Europe | 25 | 0.1% | View All 43 Rows |
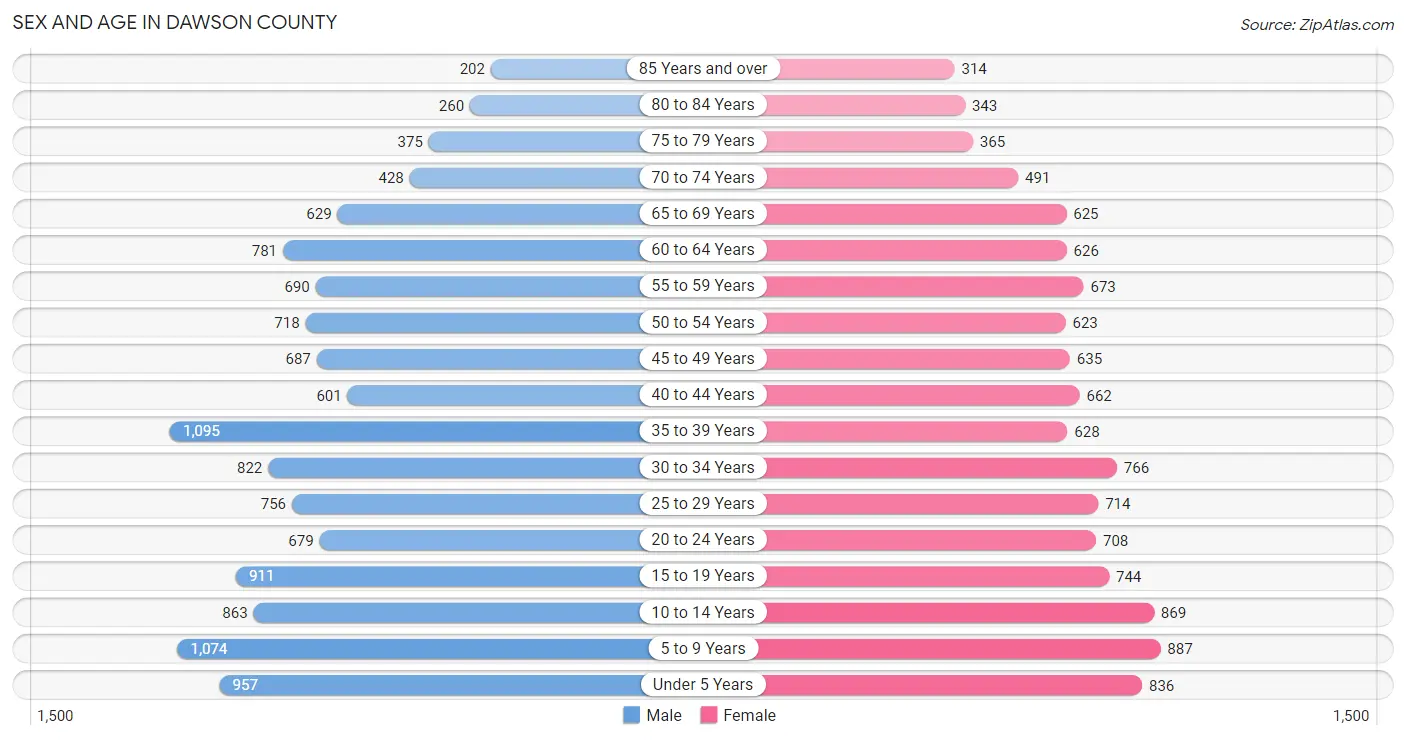
Sex and Age in Dawson County
Sex and Age in Dawson County
The most populous age groups in Dawson County are 35 to 39 Years (1,095 | 8.7%) for men and 5 to 9 Years (887 | 7.7%) for women.
| Age Bracket | Male | Female |
| Under 5 Years | 957 (7.6%) | 836 (7.3%) |
| 5 to 9 Years | 1,074 (8.6%) | 887 (7.7%) |
| 10 to 14 Years | 863 (6.9%) | 869 (7.5%) |
| 15 to 19 Years | 911 (7.3%) | 744 (6.5%) |
| 20 to 24 Years | 679 (5.4%) | 708 (6.1%) |
| 25 to 29 Years | 756 (6.0%) | 714 (6.2%) |
| 30 to 34 Years | 822 (6.6%) | 766 (6.7%) |
| 35 to 39 Years | 1,095 (8.7%) | 628 (5.5%) |
| 40 to 44 Years | 601 (4.8%) | 662 (5.8%) |
| 45 to 49 Years | 687 (5.5%) | 635 (5.5%) |
| 50 to 54 Years | 718 (5.7%) | 623 (5.4%) |
| 55 to 59 Years | 690 (5.5%) | 673 (5.9%) |
| 60 to 64 Years | 781 (6.2%) | 626 (5.4%) |
| 65 to 69 Years | 629 (5.0%) | 625 (5.4%) |
| 70 to 74 Years | 428 (3.4%) | 491 (4.3%) |
| 75 to 79 Years | 375 (3.0%) | 365 (3.2%) |
| 80 to 84 Years | 260 (2.1%) | 343 (3.0%) |
| 85 Years and over | 202 (1.6%) | 314 (2.7%) |
| Total | 12,528 (100.0%) | 11,509 (100.0%) |
Families and Households in Dawson County
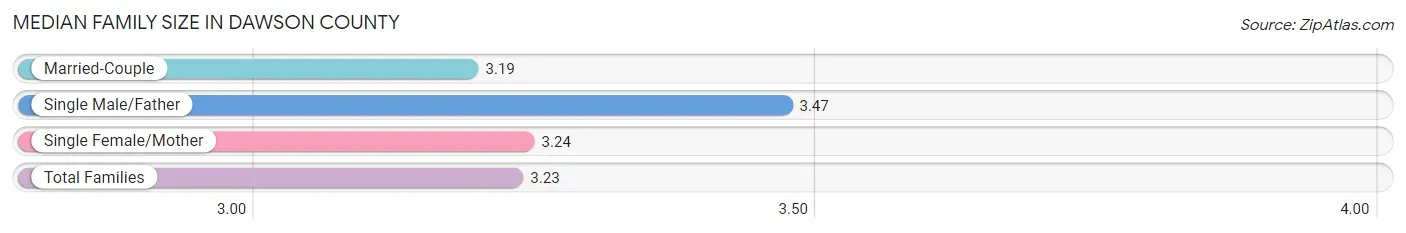
Median Family Size in Dawson County
The median family size in Dawson County is 3.23 persons per family, with single male/father families (564 | 9.1%) accounting for the largest median family size of 3.47 persons per family. On the other hand, married-couple families (4,683 | 75.7%) represent the smallest median family size with 3.19 persons per family.
| Family Type | # Families | Family Size |
| Married-Couple | 4,683 (75.7%) | 3.19 |
| Single Male/Father | 564 (9.1%) | 3.47 |
| Single Female/Mother | 936 (15.1%) | 3.24 |
| Total Families | 6,183 (100.0%) | 3.23 |
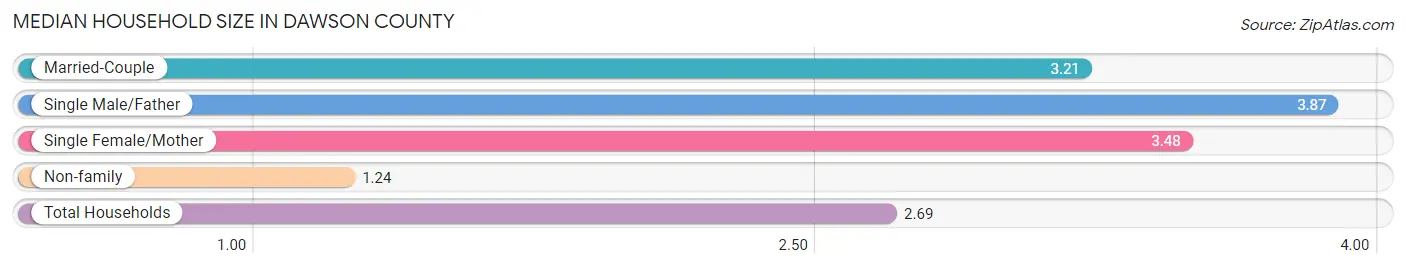
Median Household Size in Dawson County
The median household size in Dawson County is 2.69 persons per household, with single male/father households (564 | 6.4%) accounting for the largest median household size of 3.87 persons per household. non-family households (2,627 | 29.8%) represent the smallest median household size with 1.24 persons per household.
| Household Type | # Households | Household Size |
| Married-Couple | 4,683 (53.2%) | 3.21 |
| Single Male/Father | 564 (6.4%) | 3.87 |
| Single Female/Mother | 936 (10.6%) | 3.48 |
| Non-family | 2,627 (29.8%) | 1.24 |
| Total Households | 8,810 (100.0%) | 2.69 |
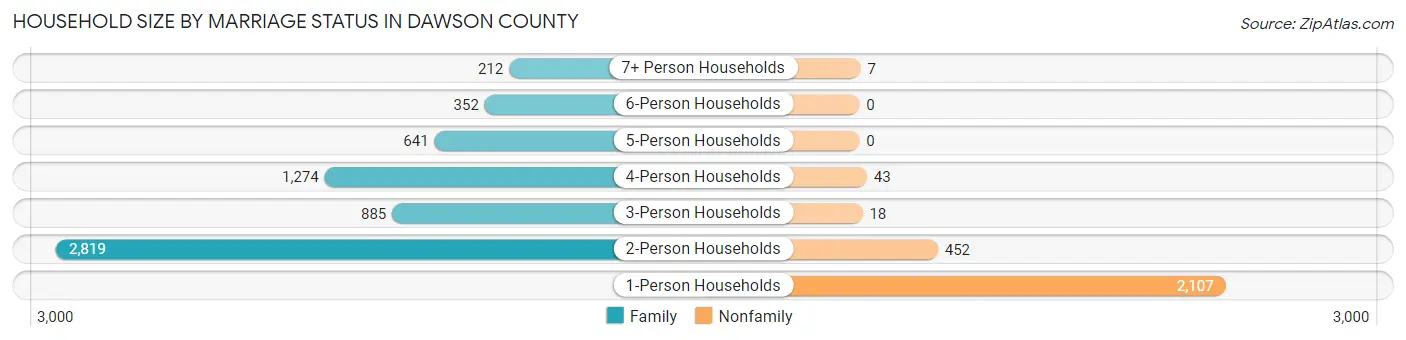
Household Size by Marriage Status in Dawson County
Out of a total of 8,810 households in Dawson County, 6,183 (70.2%) are family households, while 2,627 (29.8%) are nonfamily households. The most numerous type of family households are 2-person households, comprising 2,819, and the most common type of nonfamily households are 1-person households, comprising 2,107.
| Household Size | Family Households | Nonfamily Households |
| 1-Person Households | - | 2,107 (23.9%) |
| 2-Person Households | 2,819 (32.0%) | 452 (5.1%) |
| 3-Person Households | 885 (10.1%) | 18 (0.2%) |
| 4-Person Households | 1,274 (14.5%) | 43 (0.5%) |
| 5-Person Households | 641 (7.3%) | 0 (0.0%) |
| 6-Person Households | 352 (4.0%) | 0 (0.0%) |
| 7+ Person Households | 212 (2.4%) | 7 (0.1%) |
| Total | 6,183 (70.2%) | 2,627 (29.8%) |
Female Fertility in Dawson County
Fertility by Age in Dawson County
Average fertility rate in Dawson County is 74.0 births per 1,000 women. Women in the age bracket of 20 to 34 years have the highest fertility rate with 127.0 births per 1,000 women. Women in the age bracket of 20 to 34 years acount for 75.7% of all women with births.
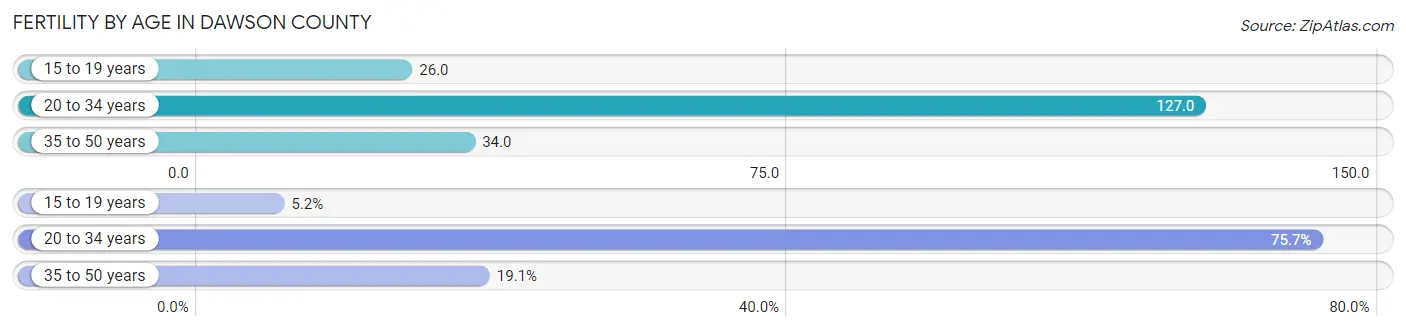
| Age Bracket | Women with Births | Births / 1,000 Women |
| 15 to 19 years | 19 (5.2%) | 26.0 |
| 20 to 34 years | 277 (75.7%) | 127.0 |
| 35 to 50 years | 70 (19.1%) | 34.0 |
| Total | 366 (100.0%) | 74.0 |
Fertility by Age by Marriage Status in Dawson County
73.2% of women with births (366) in Dawson County are married. The highest percentage of unmarried women with births falls into 15 to 19 years age bracket with 100.0% of them unmarried at the time of birth, while the lowest percentage of unmarried women with births belong to 35 to 50 years age bracket with 7.1% of them unmarried.
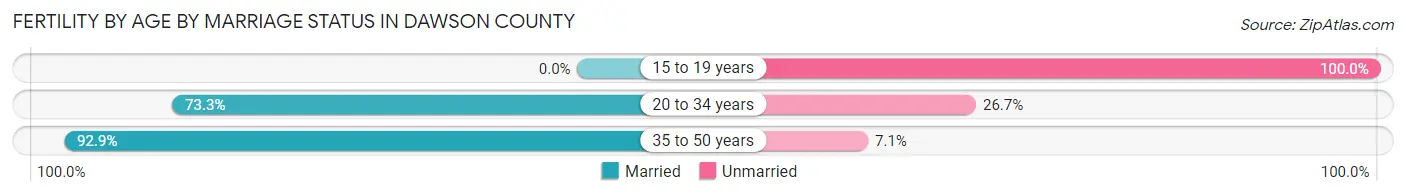
| Age Bracket | Married | Unmarried |
| 15 to 19 years | 0 (0.0%) | 19 (100.0%) |
| 20 to 34 years | 203 (73.3%) | 74 (26.7%) |
| 35 to 50 years | 65 (92.9%) | 5 (7.1%) |
| Total | 268 (73.2%) | 98 (26.8%) |
Fertility by Education in Dawson County
Average fertility rate in Dawson County is 74.0 births per 1,000 women. Women with the education attainment of bachelor's degree have the highest fertility rate of 119.0 births per 1,000 women, while women with the education attainment of college or associate's degree have the lowest fertility at 52.0 births per 1,000 women. Women with the education attainment of less than high school represent 33.1% of all women with births.
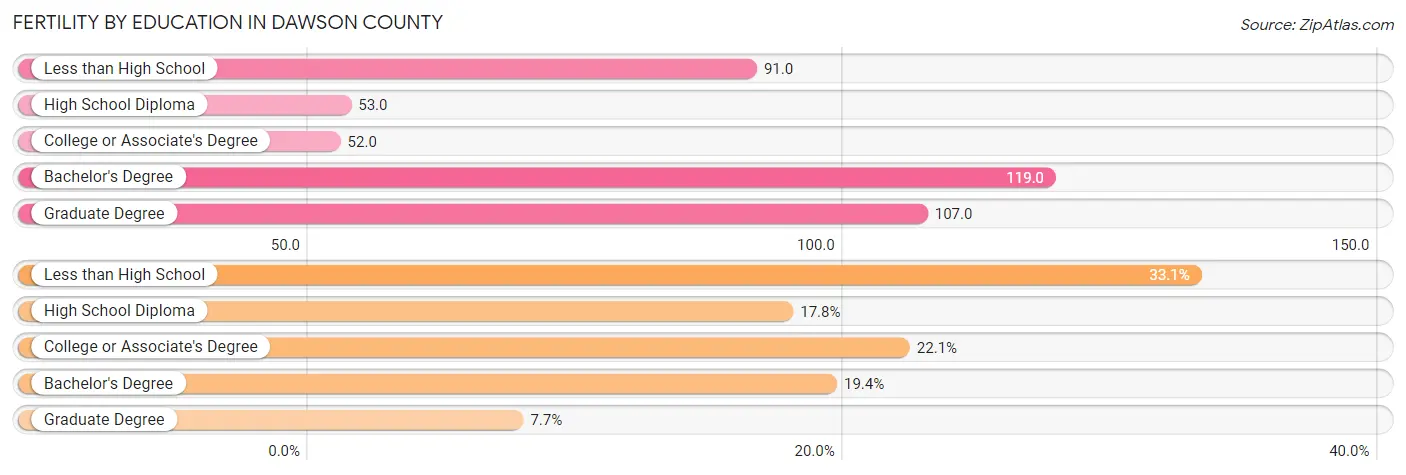
| Educational Attainment | Women with Births | Births / 1,000 Women |
| Less than High School | 121 (33.1%) | 91.0 |
| High School Diploma | 65 (17.8%) | 53.0 |
| College or Associate's Degree | 81 (22.1%) | 52.0 |
| Bachelor's Degree | 71 (19.4%) | 119.0 |
| Graduate Degree | 28 (7.6%) | 107.0 |
| Total | 366 (100.0%) | 74.0 |
Fertility by Education by Marriage Status in Dawson County
26.8% of women with births in Dawson County are unmarried. Women with the educational attainment of bachelor's degree are most likely to be married with 97.2% of them married at childbirth, while women with the educational attainment of graduate degree are least likely to be married with 92.9% of them unmarried at childbirth.
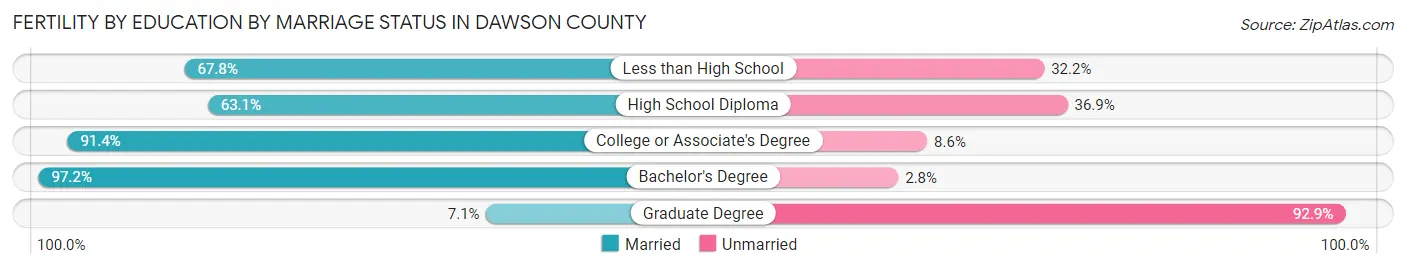
| Educational Attainment | Married | Unmarried |
| Less than High School | 82 (67.8%) | 39 (32.2%) |
| High School Diploma | 41 (63.1%) | 24 (36.9%) |
| College or Associate's Degree | 74 (91.4%) | 7 (8.6%) |
| Bachelor's Degree | 69 (97.2%) | 2 (2.8%) |
| Graduate Degree | 2 (7.1%) | 26 (92.9%) |
| Total | 268 (73.2%) | 98 (26.8%) |
Income in Dawson County
Income Overview in Dawson County
Per Capita Income in Dawson County is $34,648, while median incomes of families and households are $77,492 and $67,462 respectively.
| Characteristic | Number | Measure |
| Per Capita Income | 24,037 | $34,648 |
| Median Family Income | 6,183 | $77,492 |
| Mean Family Income | 6,183 | $98,267 |
| Median Household Income | 8,810 | $67,462 |
| Mean Household Income | 8,810 | $83,671 |
| Income Deficit | 6,183 | $10,347 |
| Wage / Income Gap (%) | 24,037 | 29.17% |
| Wage / Income Gap ($) | 24,037 | 70.83¢ per $1 |
| Gini / Inequality Index | 24,037 | 0.43 |
Earnings by Sex in Dawson County
Average Earnings in Dawson County are $38,951, $43,616 for men and $30,894 for women, a difference of 29.2%.
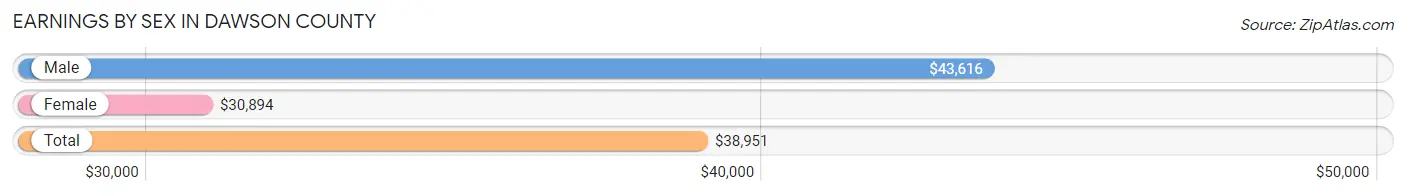
| Sex | Number | Average Earnings |
| Male | 7,539 (56.3%) | $43,616 |
| Female | 5,857 (43.7%) | $30,894 |
| Total | 13,396 (100.0%) | $38,951 |
Earnings by Sex by Income Bracket in Dawson County
The most common earnings brackets in Dawson County are $55,000 to $64,999 for men (825 | 10.9%) and $40,000 to $44,999 for women (521 | 8.9%).
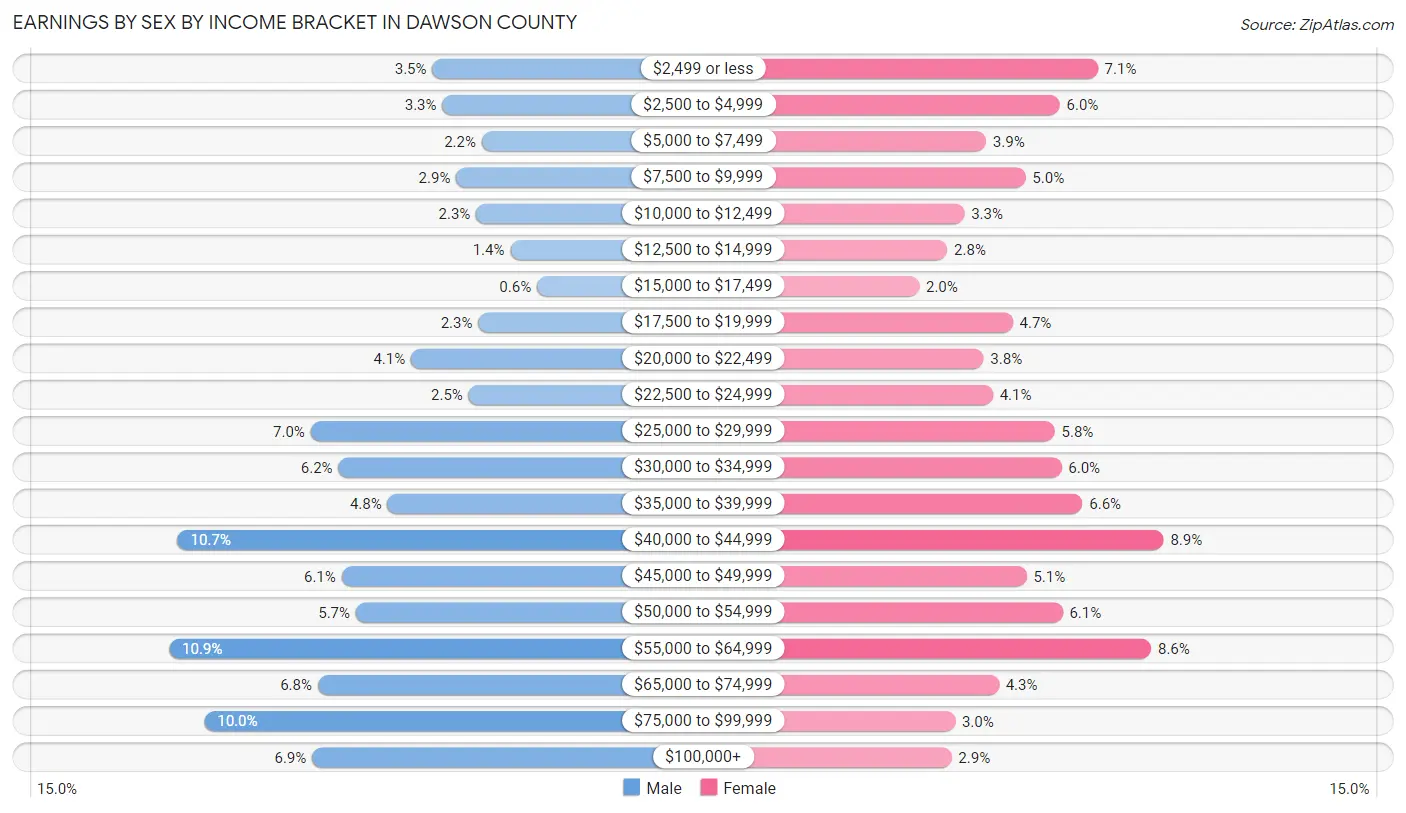
| Income | Male | Female |
| $2,499 or less | 267 (3.5%) | 413 (7.0%) |
| $2,500 to $4,999 | 246 (3.3%) | 350 (6.0%) |
| $5,000 to $7,499 | 162 (2.1%) | 229 (3.9%) |
| $7,500 to $9,999 | 216 (2.9%) | 294 (5.0%) |
| $10,000 to $12,499 | 174 (2.3%) | 193 (3.3%) |
| $12,500 to $14,999 | 102 (1.3%) | 165 (2.8%) |
| $15,000 to $17,499 | 45 (0.6%) | 119 (2.0%) |
| $17,500 to $19,999 | 170 (2.2%) | 273 (4.7%) |
| $20,000 to $22,499 | 312 (4.1%) | 225 (3.8%) |
| $22,500 to $24,999 | 190 (2.5%) | 240 (4.1%) |
| $25,000 to $29,999 | 525 (7.0%) | 342 (5.8%) |
| $30,000 to $34,999 | 466 (6.2%) | 353 (6.0%) |
| $35,000 to $39,999 | 362 (4.8%) | 388 (6.6%) |
| $40,000 to $44,999 | 807 (10.7%) | 521 (8.9%) |
| $45,000 to $49,999 | 459 (6.1%) | 296 (5.1%) |
| $50,000 to $54,999 | 429 (5.7%) | 355 (6.1%) |
| $55,000 to $64,999 | 825 (10.9%) | 501 (8.6%) |
| $65,000 to $74,999 | 510 (6.8%) | 250 (4.3%) |
| $75,000 to $99,999 | 750 (10.0%) | 178 (3.0%) |
| $100,000+ | 522 (6.9%) | 172 (2.9%) |
| Total | 7,539 (100.0%) | 5,857 (100.0%) |
Earnings by Sex by Educational Attainment in Dawson County
Average earnings in Dawson County are $45,511 for men and $35,519 for women, a difference of 22.0%. Men with an educational attainment of graduate degree enjoy the highest average annual earnings of $70,833, while those with less than high school education earn the least with $39,857. Women with an educational attainment of graduate degree earn the most with the average annual earnings of $46,385, while those with less than high school education have the smallest earnings of $24,447.
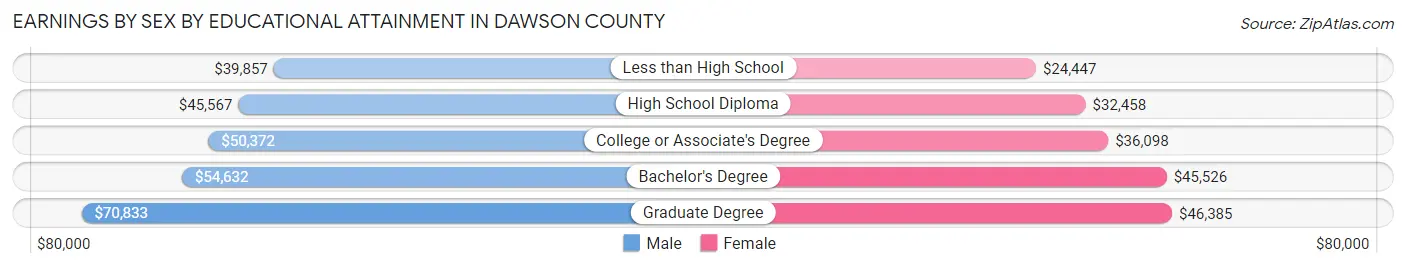
| Educational Attainment | Male Income | Female Income |
| Less than High School | $39,857 | $24,447 |
| High School Diploma | $45,567 | $32,458 |
| College or Associate's Degree | $50,372 | $36,098 |
| Bachelor's Degree | $54,632 | $45,526 |
| Graduate Degree | $70,833 | $46,385 |
| Total | $45,511 | $35,519 |
Family Income in Dawson County
Family Income Brackets in Dawson County
According to the Dawson County family income data, there are 1,478 families falling into the $50,000 to $74,999 income range, which is the most common income bracket and makes up 23.9% of all families. Conversely, the less than $10,000 income bracket is the least frequent group with only 105 families (1.7%) belonging to this category.
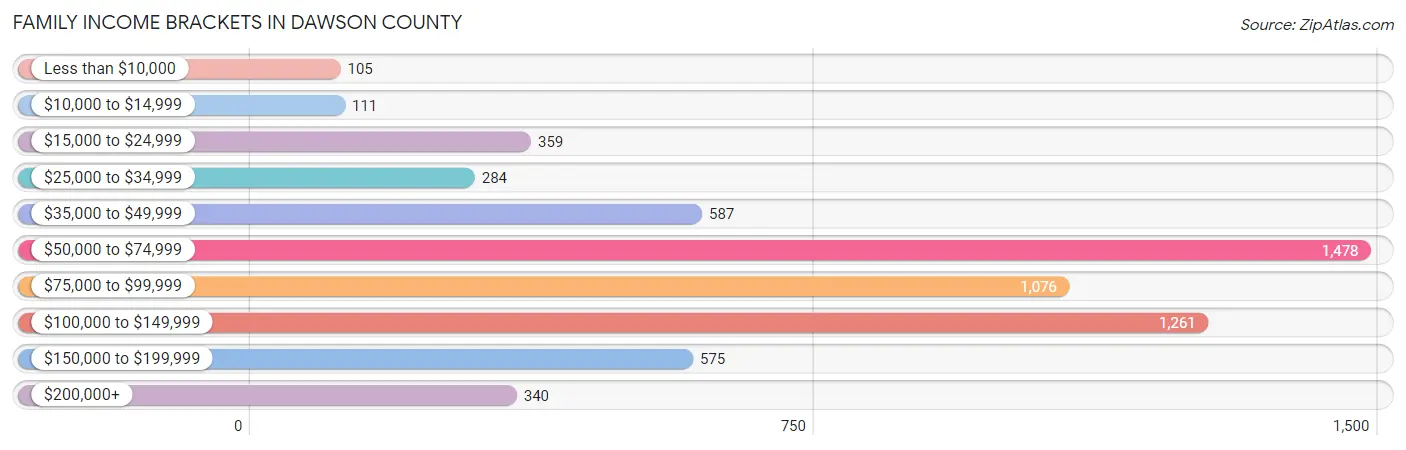
| Income Bracket | # Families | % Families |
| Less than $10,000 | 105 | 1.7% |
| $10,000 to $14,999 | 111 | 1.8% |
| $15,000 to $24,999 | 359 | 5.8% |
| $25,000 to $34,999 | 284 | 4.6% |
| $35,000 to $49,999 | 587 | 9.5% |
| $50,000 to $74,999 | 1,478 | 23.9% |
| $75,000 to $99,999 | 1,076 | 17.4% |
| $100,000 to $149,999 | 1,261 | 20.4% |
| $150,000 to $199,999 | 575 | 9.3% |
| $200,000+ | 340 | 5.5% |
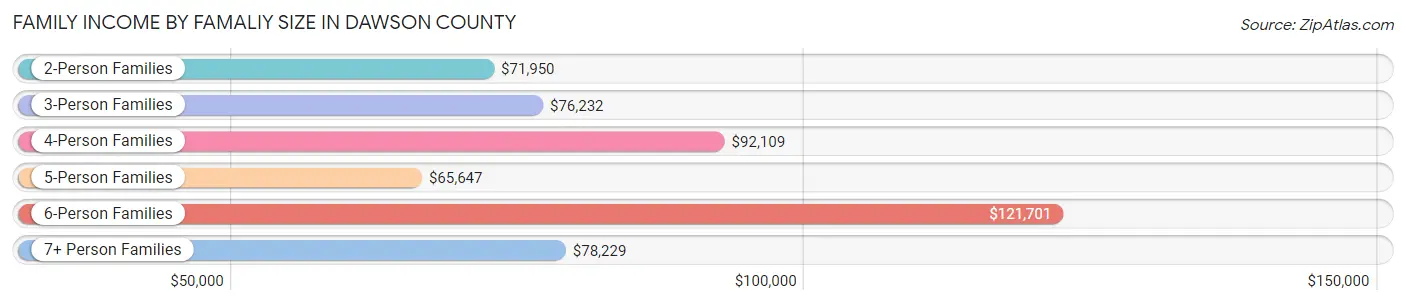
Family Income by Famaliy Size in Dawson County
6-person families (233 | 3.8%) account for the highest median family income in Dawson County with $121,701 per family, while 2-person families (2,882 | 46.6%) have the highest median income of $35,975 per family member.
| Income Bracket | # Families | Median Income |
| 2-Person Families | 2,882 (46.6%) | $71,950 |
| 3-Person Families | 950 (15.4%) | $76,232 |
| 4-Person Families | 1,336 (21.6%) | $92,109 |
| 5-Person Families | 577 (9.3%) | $65,647 |
| 6-Person Families | 233 (3.8%) | $121,701 |
| 7+ Person Families | 205 (3.3%) | $78,229 |
| Total | 6,183 (100.0%) | $77,492 |
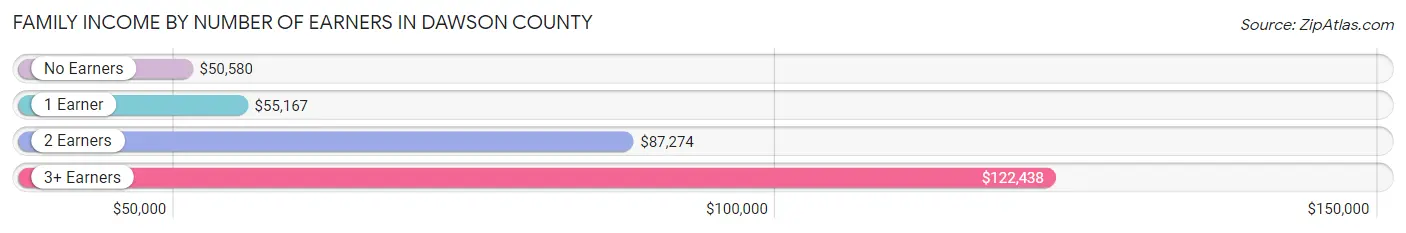
Family Income by Number of Earners in Dawson County
The median family income in Dawson County is $77,492, with families comprising 3+ earners (1,026) having the highest median family income of $122,438, while families with no earners (517) have the lowest median family income of $50,580, accounting for 16.6% and 8.4% of families, respectively.
| Number of Earners | # Families | Median Income |
| No Earners | 517 (8.4%) | $50,580 |
| 1 Earner | 1,761 (28.5%) | $55,167 |
| 2 Earners | 2,879 (46.6%) | $87,274 |
| 3+ Earners | 1,026 (16.6%) | $122,438 |
| Total | 6,183 (100.0%) | $77,492 |
Household Income in Dawson County
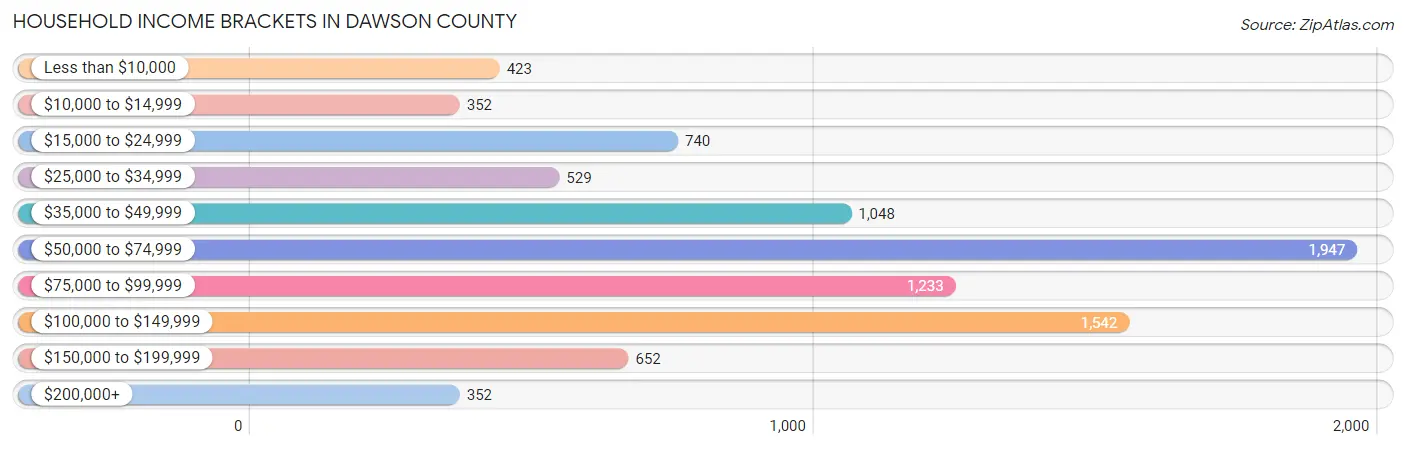
Household Income Brackets in Dawson County
With 1,947 households falling in the category, the $50,000 to $74,999 income range is the most frequent in Dawson County, accounting for 22.1% of all households. In contrast, only 352 households (4.0%) fall into the $10,000 to $14,999 income bracket, making it the least populous group.
| Income Bracket | # Households | % Households |
| Less than $10,000 | 423 | 4.8% |
| $10,000 to $14,999 | 352 | 4.0% |
| $15,000 to $24,999 | 740 | 8.4% |
| $25,000 to $34,999 | 529 | 6.0% |
| $35,000 to $49,999 | 1,048 | 11.9% |
| $50,000 to $74,999 | 1,947 | 22.1% |
| $75,000 to $99,999 | 1,233 | 14.0% |
| $100,000 to $149,999 | 1,542 | 17.5% |
| $150,000 to $199,999 | 652 | 7.4% |
| $200,000+ | 352 | 4.0% |
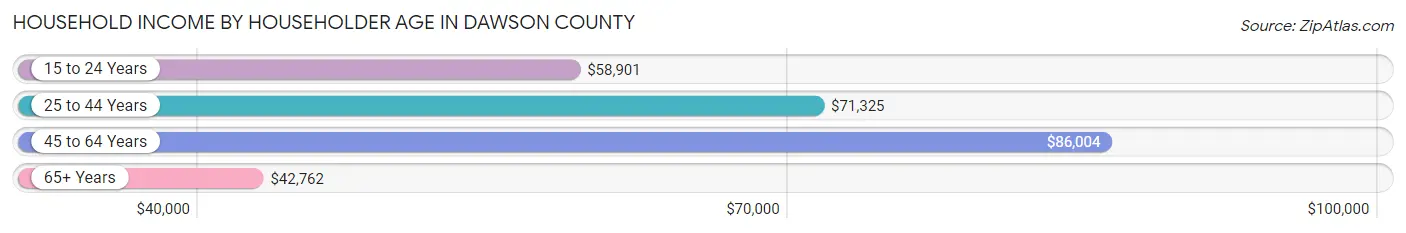
Household Income by Householder Age in Dawson County
The median household income in Dawson County is $67,462, with the highest median household income of $86,004 found in the 45 to 64 years age bracket for the primary householder. A total of 2,971 households (33.7%) fall into this category. Meanwhile, the 65+ years age bracket for the primary householder has the lowest median household income of $42,762, with 2,449 households (27.8%) in this group.
| Income Bracket | # Households | Median Income |
| 15 to 24 Years | 537 (6.1%) | $58,901 |
| 25 to 44 Years | 2,853 (32.4%) | $71,325 |
| 45 to 64 Years | 2,971 (33.7%) | $86,004 |
| 65+ Years | 2,449 (27.8%) | $42,762 |
| Total | 8,810 (100.0%) | $67,462 |
Poverty in Dawson County
Income Below Poverty by Sex and Age in Dawson County
With 12.7% poverty level for males and 15.9% for females among the residents of Dawson County, 6 to 11 year old males and 5 year old females are the most vulnerable to poverty, with 454 males (32.7%) and 76 females (27.4%) in their respective age groups living below the poverty level.
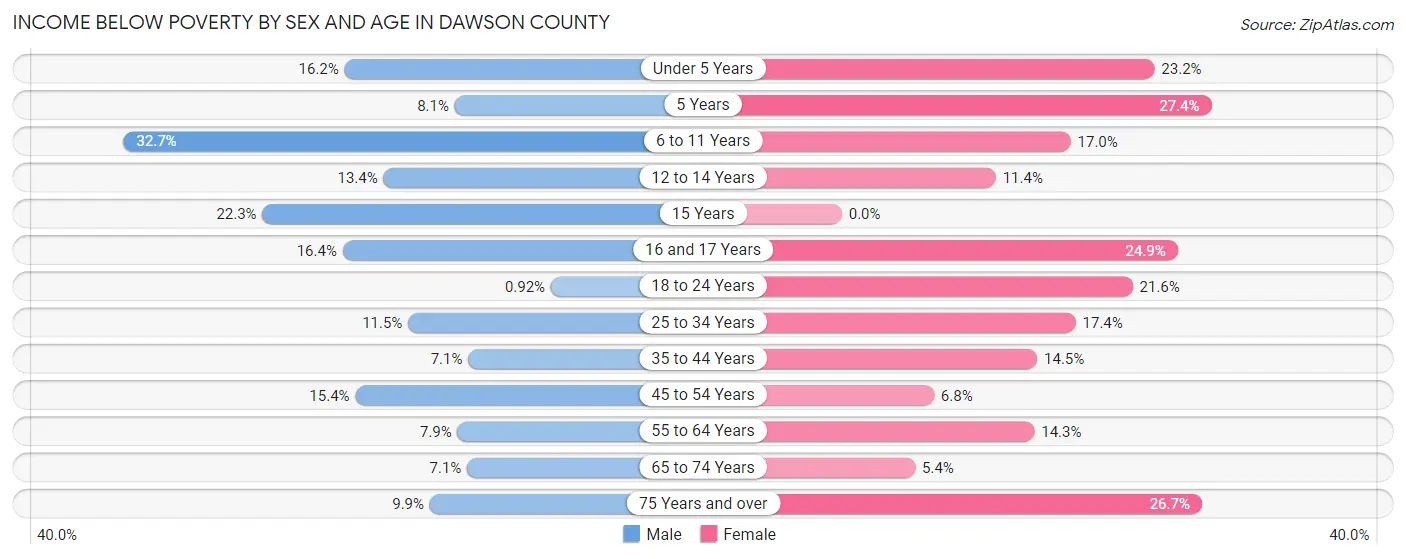
| Age Bracket | Male | Female |
| Under 5 Years | 153 (16.2%) | 194 (23.2%) |
| 5 Years | 10 (8.1%) | 76 (27.4%) |
| 6 to 11 Years | 454 (32.7%) | 151 (17.0%) |
| 12 to 14 Years | 51 (13.4%) | 67 (11.4%) |
| 15 Years | 44 (22.3%) | 0 (0.0%) |
| 16 and 17 Years | 66 (16.4%) | 86 (24.9%) |
| 18 to 24 Years | 9 (0.9%) | 212 (21.6%) |
| 25 to 34 Years | 180 (11.5%) | 257 (17.4%) |
| 35 to 44 Years | 119 (7.1%) | 187 (14.5%) |
| 45 to 54 Years | 210 (15.4%) | 86 (6.8%) |
| 55 to 64 Years | 115 (7.9%) | 184 (14.3%) |
| 65 to 74 Years | 75 (7.1%) | 60 (5.4%) |
| 75 Years and over | 80 (9.9%) | 252 (26.7%) |
| Total | 1,566 (12.7%) | 1,812 (15.9%) |
Income Above Poverty by Sex and Age in Dawson County
According to the poverty statistics in Dawson County, males aged 18 to 24 years and females aged 15 years are the age groups that are most secure financially, with 99.1% of males and 100.0% of females in these age groups living above the poverty line.
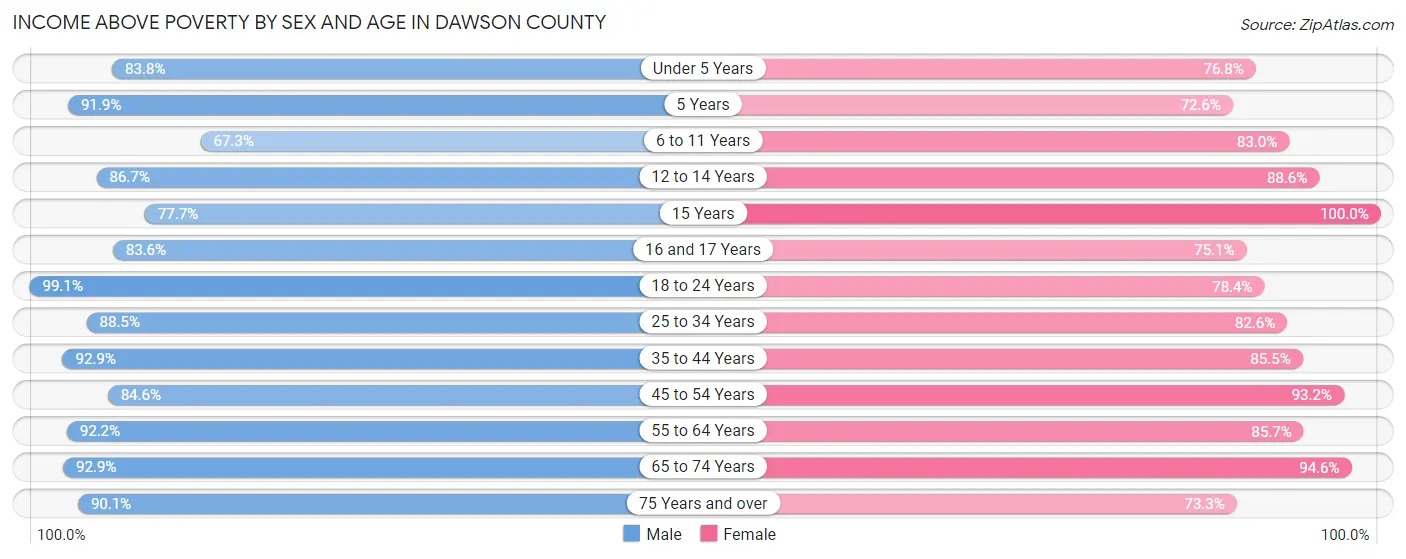
| Age Bracket | Male | Female |
| Under 5 Years | 789 (83.8%) | 642 (76.8%) |
| 5 Years | 114 (91.9%) | 201 (72.6%) |
| 6 to 11 Years | 936 (67.3%) | 738 (83.0%) |
| 12 to 14 Years | 331 (86.7%) | 519 (88.6%) |
| 15 Years | 153 (77.7%) | 125 (100.0%) |
| 16 and 17 Years | 337 (83.6%) | 259 (75.1%) |
| 18 to 24 Years | 968 (99.1%) | 770 (78.4%) |
| 25 to 34 Years | 1,383 (88.5%) | 1,223 (82.6%) |
| 35 to 44 Years | 1,567 (92.9%) | 1,103 (85.5%) |
| 45 to 54 Years | 1,150 (84.6%) | 1,172 (93.2%) |
| 55 to 64 Years | 1,350 (92.1%) | 1,104 (85.7%) |
| 65 to 74 Years | 975 (92.9%) | 1,043 (94.6%) |
| 75 Years and over | 727 (90.1%) | 691 (73.3%) |
| Total | 10,780 (87.3%) | 9,590 (84.1%) |
Income Below Poverty Among Married-Couple Families in Dawson County
The poverty statistics for married-couple families in Dawson County show that 6.5% or 306 of the total 4,683 families live below the poverty line. Families with 5 or more children have the highest poverty rate of 58.8%, comprising of 47 families. On the other hand, families with no children have the lowest poverty rate of 3.6%, which includes 93 families.
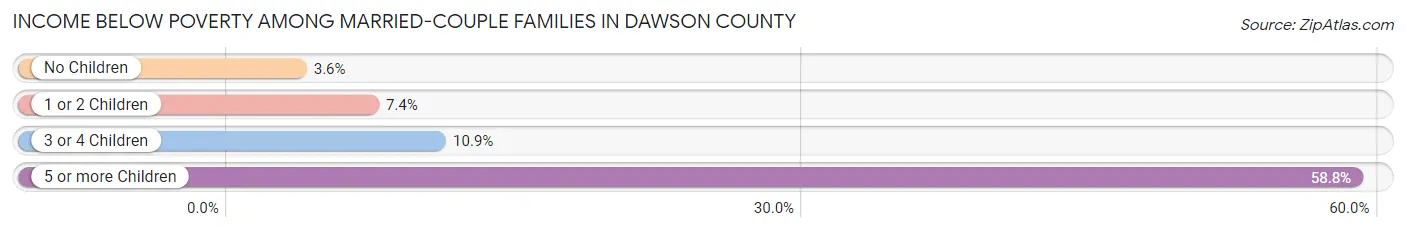
| Children | Above Poverty | Below Poverty |
| No Children | 2,495 (96.4%) | 93 (3.6%) |
| 1 or 2 Children | 1,398 (92.6%) | 111 (7.4%) |
| 3 or 4 Children | 451 (89.1%) | 55 (10.9%) |
| 5 or more Children | 33 (41.2%) | 47 (58.8%) |
| Total | 4,377 (93.5%) | 306 (6.5%) |
Income Below Poverty Among Single-Parent Households in Dawson County
According to the poverty data in Dawson County, 15.2% or 86 single-father households and 19.4% or 182 single-mother households are living below the poverty line. Among single-father households, those with 5 or more children have the highest poverty rate, with 44 households (100.0%) experiencing poverty. Likewise, among single-mother households, those with 3 or 4 children have the highest poverty rate, with 29 households (35.8%) falling below the poverty line.
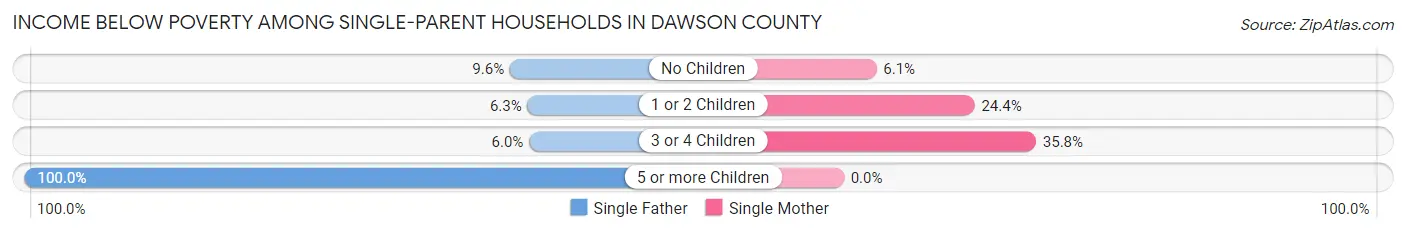
| Children | Single Father | Single Mother |
| No Children | 28 (9.6%) | 18 (6.1%) |
| 1 or 2 Children | 6 (6.3%) | 135 (24.4%) |
| 3 or 4 Children | 8 (6.0%) | 29 (35.8%) |
| 5 or more Children | 44 (100.0%) | 0 (0.0%) |
| Total | 86 (15.2%) | 182 (19.4%) |
Income Below Poverty Among Married-Couple vs Single-Parent Households in Dawson County
The poverty data for Dawson County shows that 306 of the married-couple family households (6.5%) and 268 of the single-parent households (17.9%) are living below the poverty level. Within the married-couple family households, those with 5 or more children have the highest poverty rate, with 47 households (58.8%) falling below the poverty line. Among the single-parent households, those with 5 or more children have the highest poverty rate, with 44 household (89.8%) living below poverty.
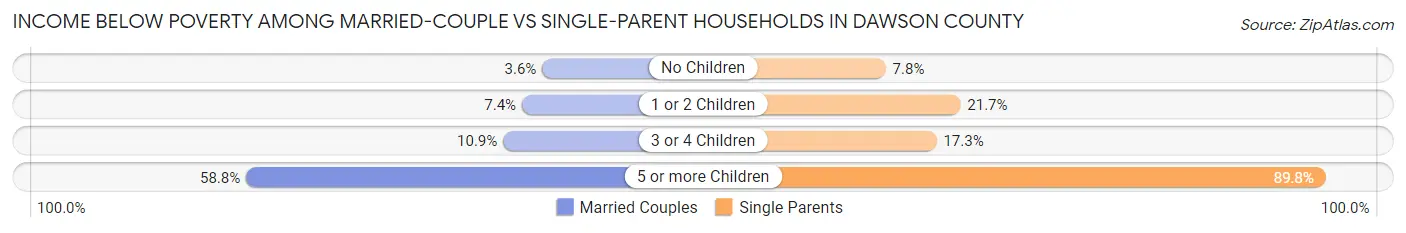
| Children | Married-Couple Families | Single-Parent Households |
| No Children | 93 (3.6%) | 46 (7.8%) |
| 1 or 2 Children | 111 (7.4%) | 141 (21.7%) |
| 3 or 4 Children | 55 (10.9%) | 37 (17.3%) |
| 5 or more Children | 47 (58.8%) | 44 (89.8%) |
| Total | 306 (6.5%) | 268 (17.9%) |
Employment Characteristics in Dawson County
Employment by Class of Employer in Dawson County
Among the 12,263 employed individuals in Dawson County, private company employees (8,605 | 70.2%), local government employees (1,114 | 9.1%), and not-for-profit organizations (746 | 6.1%) make up the most common classes of employment.
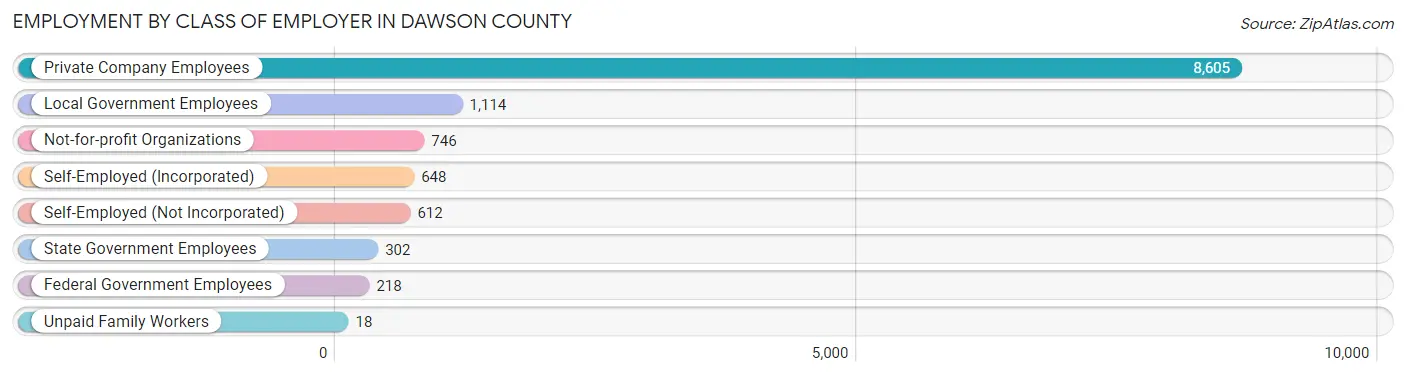
| Employer Class | # Employees | % Employees |
| Private Company Employees | 8,605 | 70.2% |
| Self-Employed (Incorporated) | 648 | 5.3% |
| Self-Employed (Not Incorporated) | 612 | 5.0% |
| Not-for-profit Organizations | 746 | 6.1% |
| Local Government Employees | 1,114 | 9.1% |
| State Government Employees | 302 | 2.5% |
| Federal Government Employees | 218 | 1.8% |
| Unpaid Family Workers | 18 | 0.2% |
| Total | 12,263 | 100.0% |
Employment Status by Age in Dawson County
According to the labor force statistics for Dawson County, out of the total population over 16 years of age (18,229), 69.5% or 12,669 individuals are in the labor force, with 2.1% or 266 of them unemployed. The age group with the highest labor force participation rate is 35 to 44 years, with 89.1% or 2,661 individuals in the labor force. Within the labor force, the 16 to 19 years age range has the highest percentage of unemployed individuals, with 9.2% or 70 of them being unemployed.
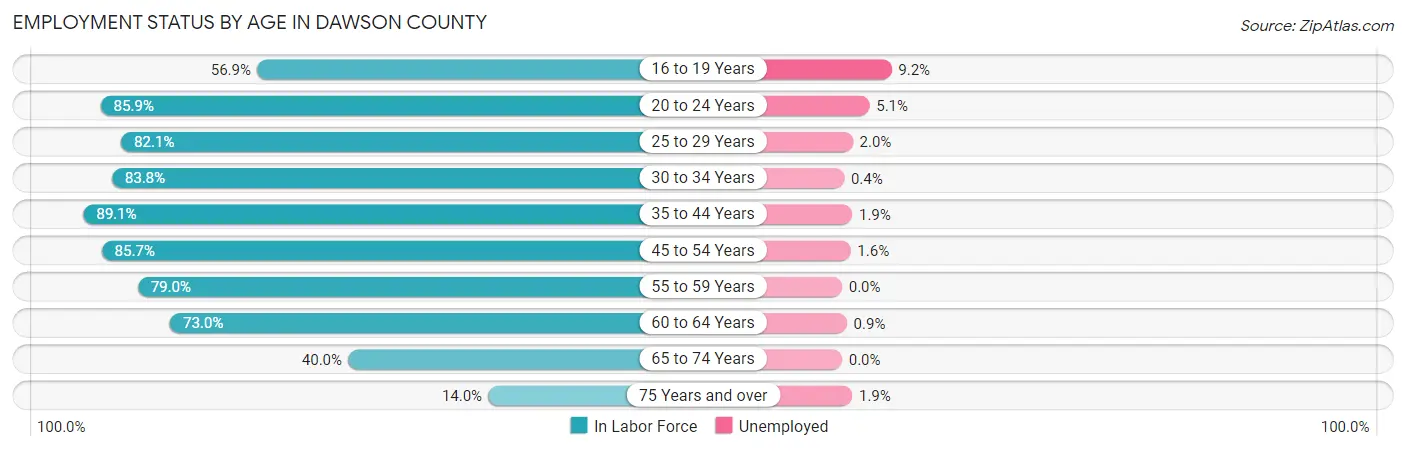
| Age Bracket | In Labor Force | Unemployed |
| 16 to 19 Years | 758 (56.9%) | 70 (9.2%) |
| 20 to 24 Years | 1,191 (85.9%) | 61 (5.1%) |
| 25 to 29 Years | 1,207 (82.1%) | 24 (2.0%) |
| 30 to 34 Years | 1,331 (83.8%) | 5 (0.4%) |
| 35 to 44 Years | 2,661 (89.1%) | 51 (1.9%) |
| 45 to 54 Years | 2,282 (85.7%) | 37 (1.6%) |
| 55 to 59 Years | 1,077 (79.0%) | 0 (0.0%) |
| 60 to 64 Years | 1,027 (73.0%) | 9 (0.9%) |
| 65 to 74 Years | 869 (40.0%) | 0 (0.0%) |
| 75 Years and over | 260 (14.0%) | 5 (1.9%) |
| Total | 12,669 (69.5%) | 266 (2.1%) |
Employment Status by Educational Attainment in Dawson County
According to labor force statistics for Dawson County, 83.5% of individuals (9,583) out of the total population between 25 and 64 years of age (11,477) are in the labor force, with 1.3% or 125 of them being unemployed. The group with the highest labor force participation rate are those with the educational attainment of college / associate degree, with 88.3% or 3,142 individuals in the labor force. Within the labor force, individuals with high school diploma education have the highest percentage of unemployment, with 2.0% or 52 of them being unemployed.
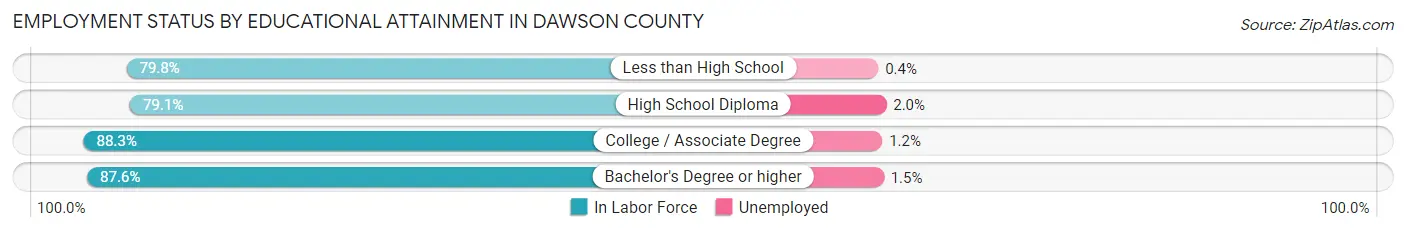
| Educational Attainment | In Labor Force | Unemployed |
| Less than High School | 2,141 (79.8%) | 11 (0.4%) |
| High School Diploma | 2,622 (79.1%) | 66 (2.0%) |
| College / Associate Degree | 3,142 (88.3%) | 43 (1.2%) |
| Bachelor's Degree or higher | 1,683 (87.6%) | 29 (1.5%) |
| Total | 9,583 (83.5%) | 149 (1.3%) |
Employment Occupations by Sex in Dawson County
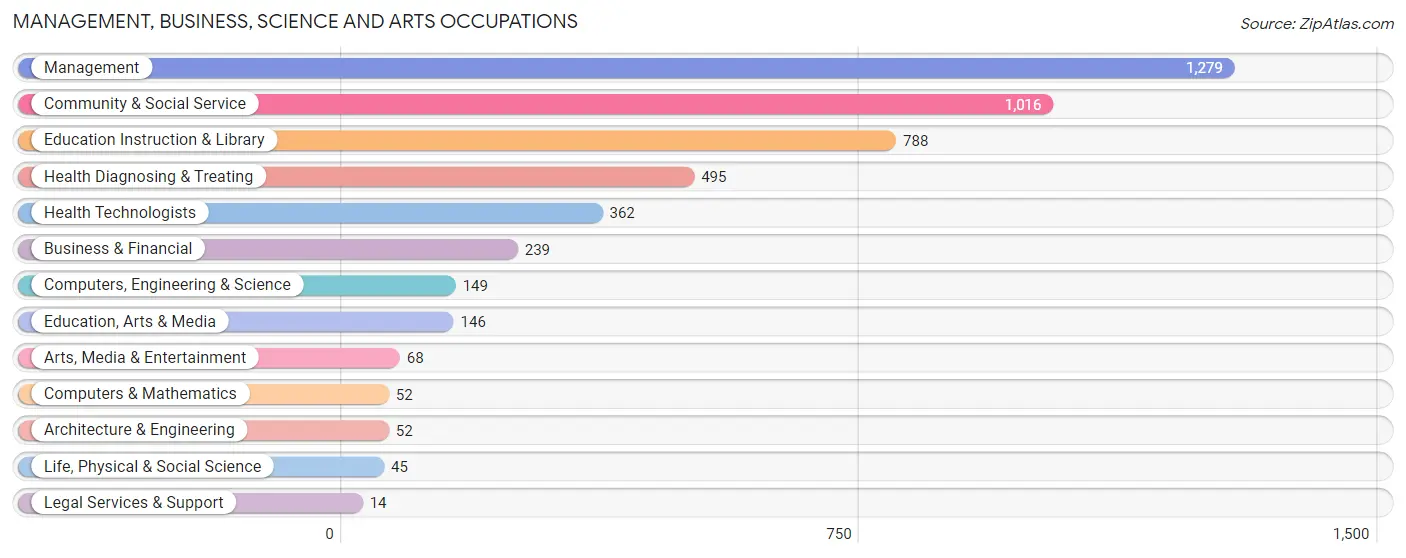
Management, Business, Science and Arts Occupations
The most common Management, Business, Science and Arts occupations in Dawson County are Management (1,279 | 10.3%), Community & Social Service (1,016 | 8.2%), Education Instruction & Library (788 | 6.4%), Health Diagnosing & Treating (495 | 4.0%), and Health Technologists (362 | 2.9%).
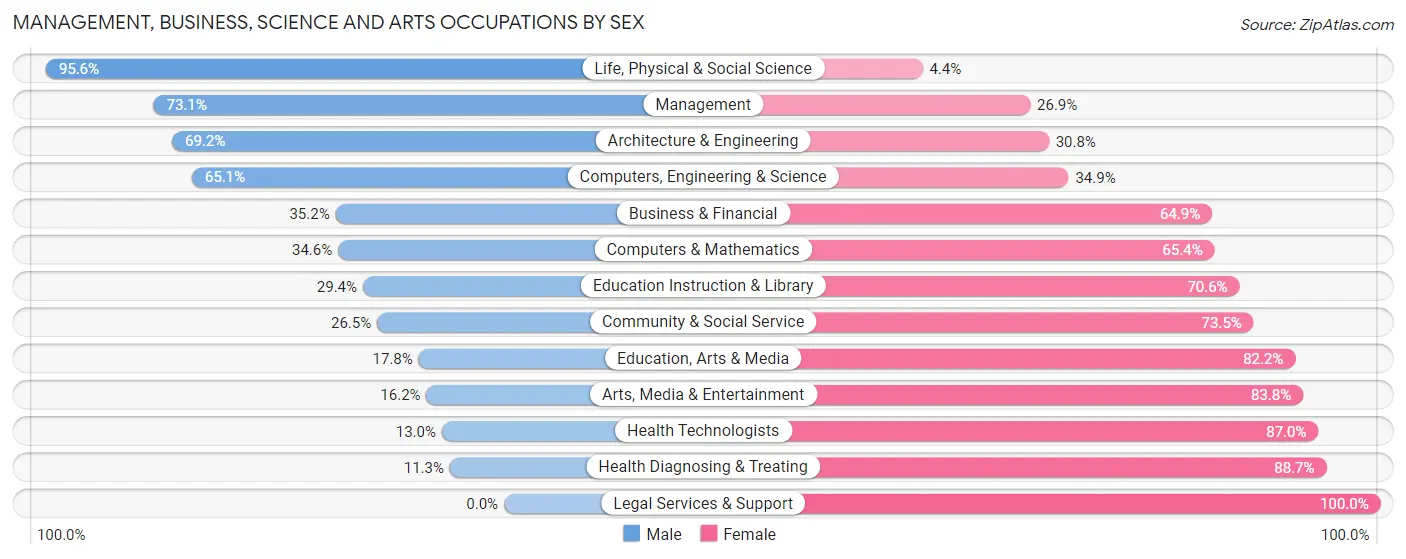
Management, Business, Science and Arts Occupations by Sex
Within the Management, Business, Science and Arts occupations in Dawson County, the most male-oriented occupations are Life, Physical & Social Science (95.6%), Management (73.1%), and Architecture & Engineering (69.2%), while the most female-oriented occupations are Legal Services & Support (100.0%), Health Diagnosing & Treating (88.7%), and Health Technologists (87.0%).
| Occupation | Male | Female |
| Management | 935 (73.1%) | 344 (26.9%) |
| Business & Financial | 84 (35.1%) | 155 (64.8%) |
| Computers, Engineering & Science | 97 (65.1%) | 52 (34.9%) |
| Computers & Mathematics | 18 (34.6%) | 34 (65.4%) |
| Architecture & Engineering | 36 (69.2%) | 16 (30.8%) |
| Life, Physical & Social Science | 43 (95.6%) | 2 (4.4%) |
| Community & Social Service | 269 (26.5%) | 747 (73.5%) |
| Education, Arts & Media | 26 (17.8%) | 120 (82.2%) |
| Legal Services & Support | 0 (0.0%) | 14 (100.0%) |
| Education Instruction & Library | 232 (29.4%) | 556 (70.6%) |
| Arts, Media & Entertainment | 11 (16.2%) | 57 (83.8%) |
| Health Diagnosing & Treating | 56 (11.3%) | 439 (88.7%) |
| Health Technologists | 47 (13.0%) | 315 (87.0%) |
| Total (Category) | 1,441 (45.3%) | 1,737 (54.7%) |
| Total (Overall) | 6,958 (56.2%) | 5,428 (43.8%) |
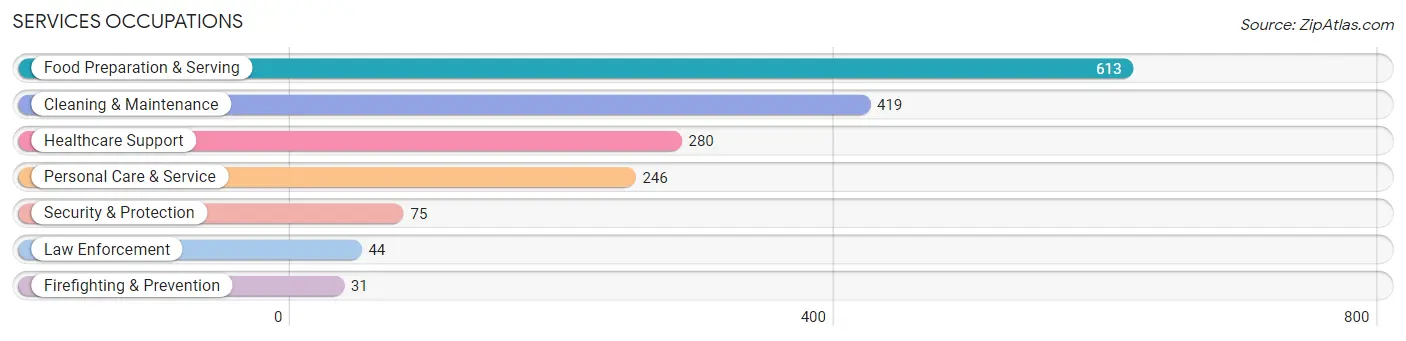
Services Occupations
The most common Services occupations in Dawson County are Food Preparation & Serving (613 | 5.0%), Cleaning & Maintenance (419 | 3.4%), Healthcare Support (280 | 2.3%), Personal Care & Service (246 | 2.0%), and Security & Protection (75 | 0.6%).
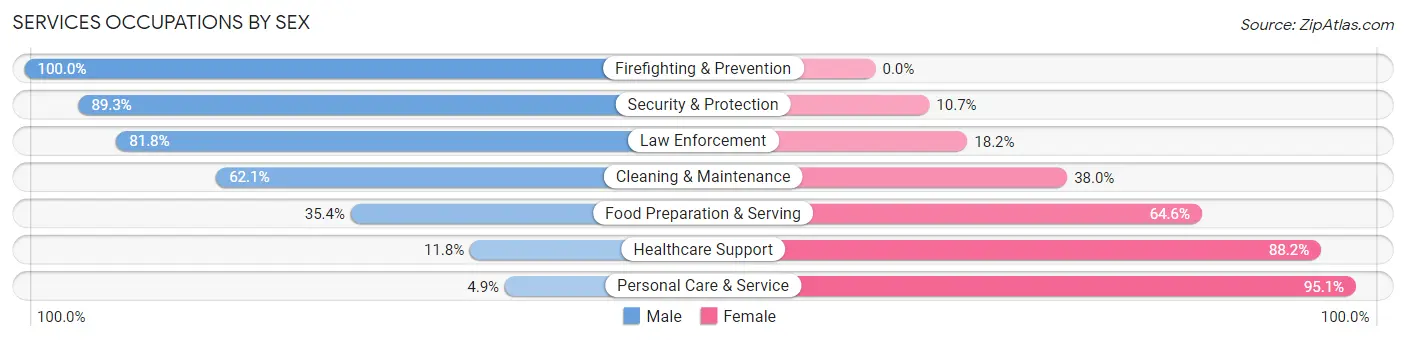
Services Occupations by Sex
Within the Services occupations in Dawson County, the most male-oriented occupations are Firefighting & Prevention (100.0%), Security & Protection (89.3%), and Law Enforcement (81.8%), while the most female-oriented occupations are Personal Care & Service (95.1%), Healthcare Support (88.2%), and Food Preparation & Serving (64.6%).
| Occupation | Male | Female |
| Healthcare Support | 33 (11.8%) | 247 (88.2%) |
| Security & Protection | 67 (89.3%) | 8 (10.7%) |
| Firefighting & Prevention | 31 (100.0%) | 0 (0.0%) |
| Law Enforcement | 36 (81.8%) | 8 (18.2%) |
| Food Preparation & Serving | 217 (35.4%) | 396 (64.6%) |
| Cleaning & Maintenance | 260 (62.1%) | 159 (38.0%) |
| Personal Care & Service | 12 (4.9%) | 234 (95.1%) |
| Total (Category) | 589 (36.1%) | 1,044 (63.9%) |
| Total (Overall) | 6,958 (56.2%) | 5,428 (43.8%) |
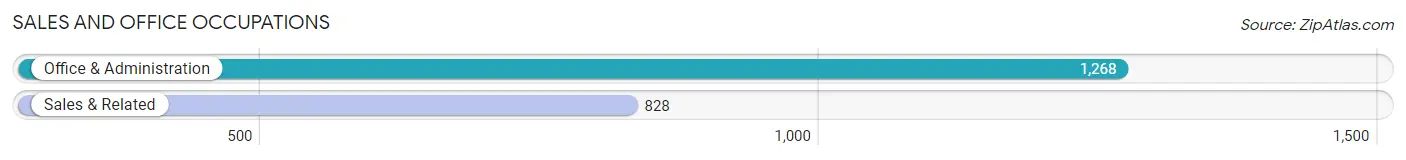
Sales and Office Occupations
The most common Sales and Office occupations in Dawson County are Office & Administration (1,268 | 10.2%), and Sales & Related (828 | 6.7%).
Sales and Office Occupations by Sex
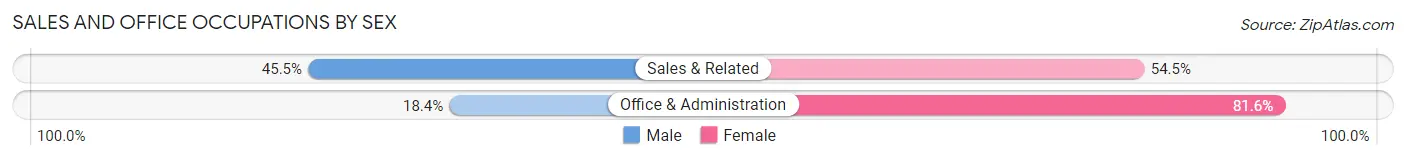
| Occupation | Male | Female |
| Sales & Related | 377 (45.5%) | 451 (54.5%) |
| Office & Administration | 233 (18.4%) | 1,035 (81.6%) |
| Total (Category) | 610 (29.1%) | 1,486 (70.9%) |
| Total (Overall) | 6,958 (56.2%) | 5,428 (43.8%) |
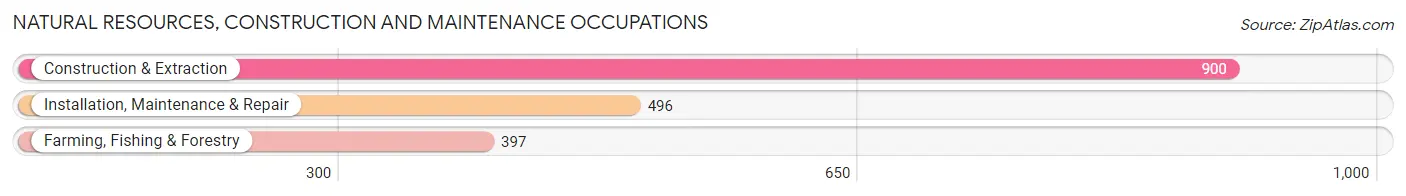
Natural Resources, Construction and Maintenance Occupations
The most common Natural Resources, Construction and Maintenance occupations in Dawson County are Construction & Extraction (900 | 7.3%), Installation, Maintenance & Repair (496 | 4.0%), and Farming, Fishing & Forestry (397 | 3.2%).
Natural Resources, Construction and Maintenance Occupations by Sex
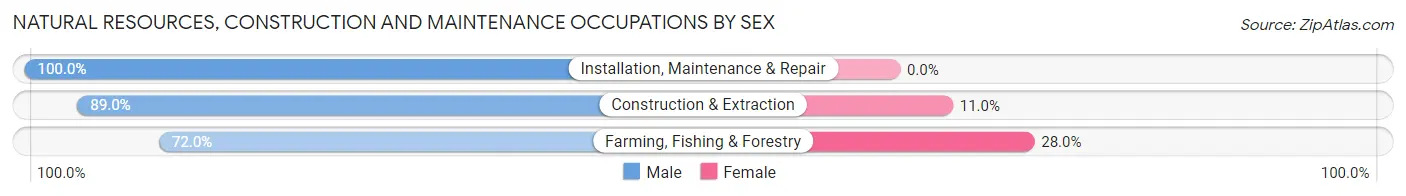
| Occupation | Male | Female |
| Farming, Fishing & Forestry | 286 (72.0%) | 111 (28.0%) |
| Construction & Extraction | 801 (89.0%) | 99 (11.0%) |
| Installation, Maintenance & Repair | 496 (100.0%) | 0 (0.0%) |
| Total (Category) | 1,583 (88.3%) | 210 (11.7%) |
| Total (Overall) | 6,958 (56.2%) | 5,428 (43.8%) |
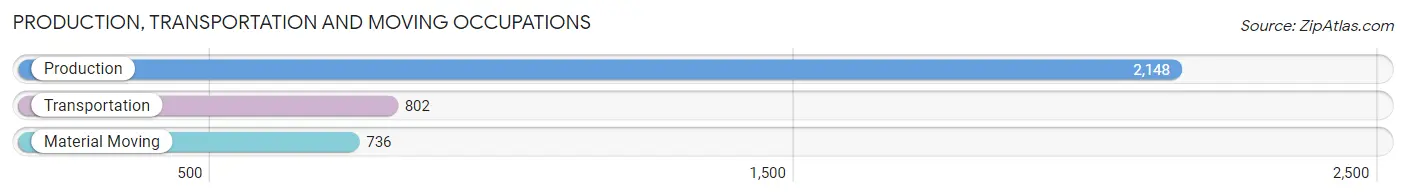
Production, Transportation and Moving Occupations
The most common Production, Transportation and Moving occupations in Dawson County are Production (2,148 | 17.3%), Transportation (802 | 6.5%), and Material Moving (736 | 5.9%).
Production, Transportation and Moving Occupations by Sex
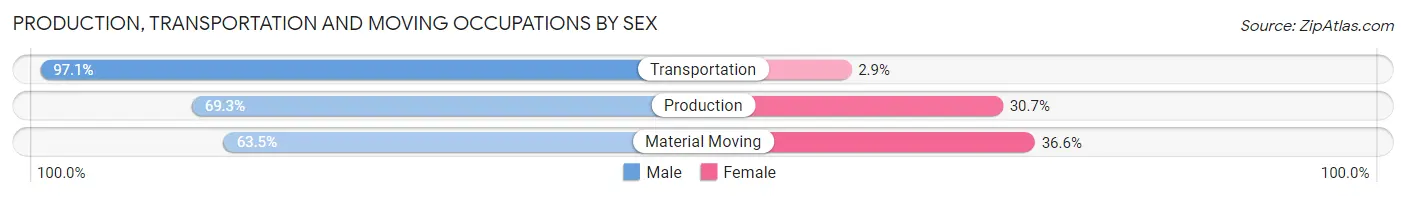
| Occupation | Male | Female |
| Production | 1,489 (69.3%) | 659 (30.7%) |
| Transportation | 779 (97.1%) | 23 (2.9%) |
| Material Moving | 467 (63.4%) | 269 (36.5%) |
| Total (Category) | 2,735 (74.2%) | 951 (25.8%) |
| Total (Overall) | 6,958 (56.2%) | 5,428 (43.8%) |
Employment Industries by Sex in Dawson County
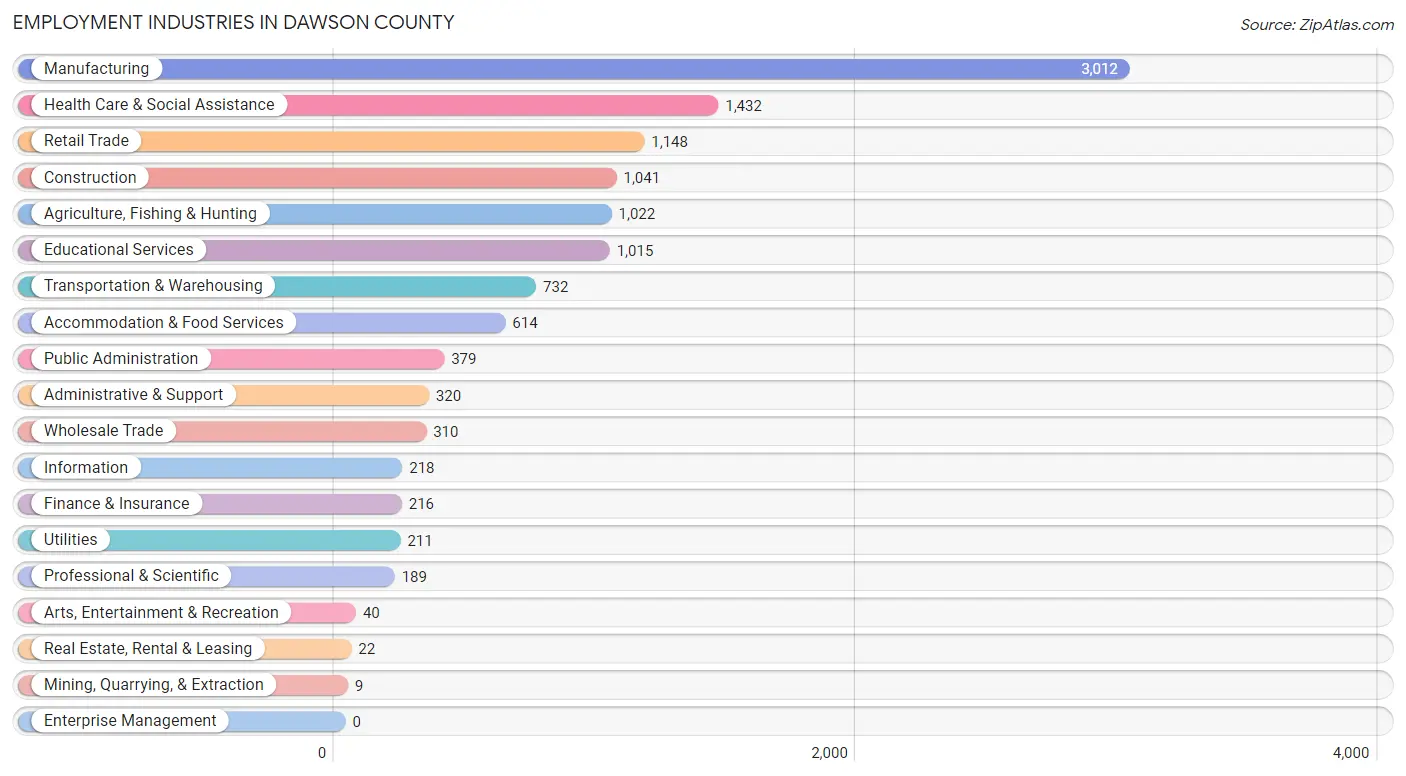
Employment Industries in Dawson County
The major employment industries in Dawson County include Manufacturing (3,012 | 24.3%), Health Care & Social Assistance (1,432 | 11.6%), Retail Trade (1,148 | 9.3%), Construction (1,041 | 8.4%), and Agriculture, Fishing & Hunting (1,022 | 8.3%).
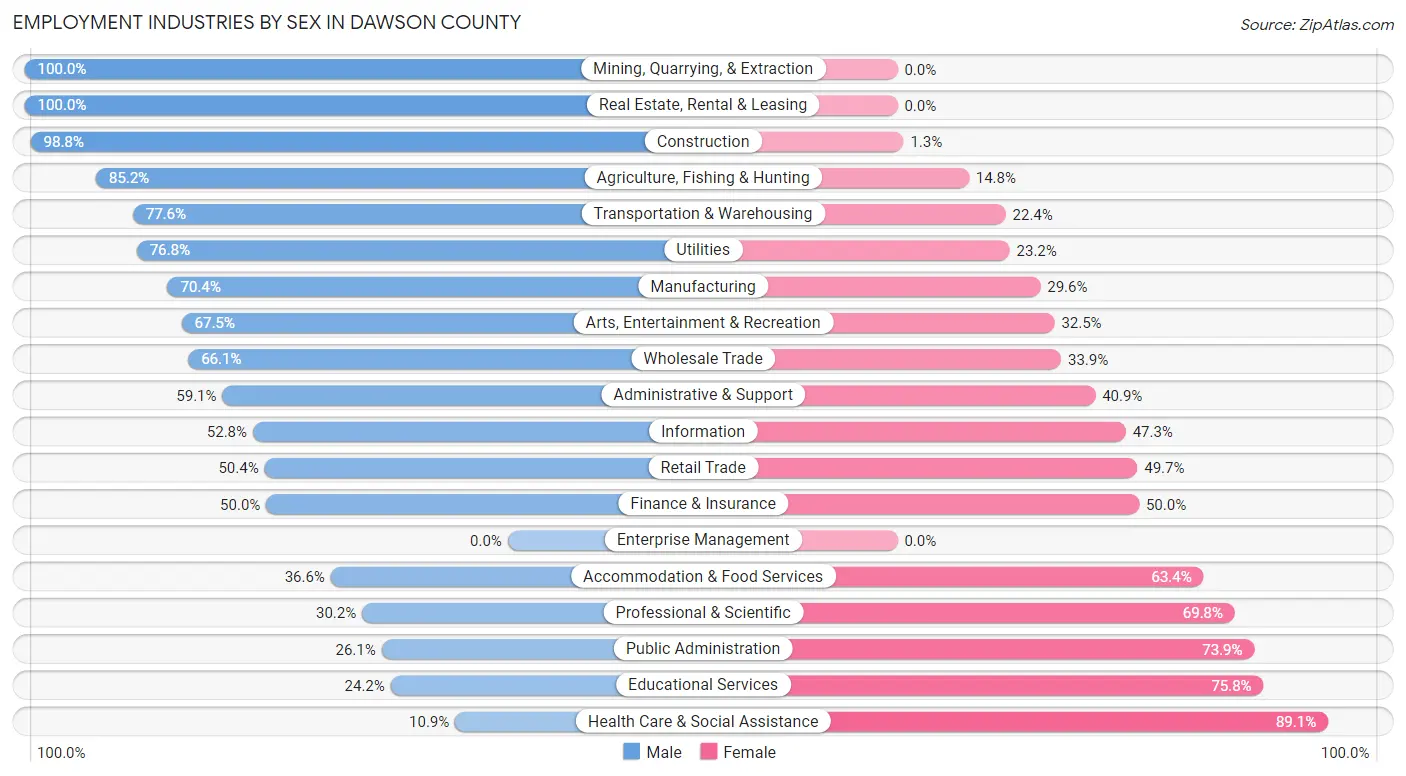
Employment Industries by Sex in Dawson County
The Dawson County industries that see more men than women are Mining, Quarrying, & Extraction (100.0%), Real Estate, Rental & Leasing (100.0%), and Construction (98.8%), whereas the industries that tend to have a higher number of women are Health Care & Social Assistance (89.1%), Educational Services (75.8%), and Public Administration (73.9%).
| Industry | Male | Female |
| Agriculture, Fishing & Hunting | 871 (85.2%) | 151 (14.8%) |
| Mining, Quarrying, & Extraction | 9 (100.0%) | 0 (0.0%) |
| Construction | 1,028 (98.8%) | 13 (1.3%) |
| Manufacturing | 2,121 (70.4%) | 891 (29.6%) |
| Wholesale Trade | 205 (66.1%) | 105 (33.9%) |
| Retail Trade | 578 (50.3%) | 570 (49.6%) |
| Transportation & Warehousing | 568 (77.6%) | 164 (22.4%) |
| Utilities | 162 (76.8%) | 49 (23.2%) |
| Information | 115 (52.7%) | 103 (47.2%) |
| Finance & Insurance | 108 (50.0%) | 108 (50.0%) |
| Real Estate, Rental & Leasing | 22 (100.0%) | 0 (0.0%) |
| Professional & Scientific | 57 (30.2%) | 132 (69.8%) |
| Enterprise Management | 0 (0.0%) | 0 (0.0%) |
| Administrative & Support | 189 (59.1%) | 131 (40.9%) |
| Educational Services | 246 (24.2%) | 769 (75.8%) |
| Health Care & Social Assistance | 156 (10.9%) | 1,276 (89.1%) |
| Arts, Entertainment & Recreation | 27 (67.5%) | 13 (32.5%) |
| Accommodation & Food Services | 225 (36.6%) | 389 (63.4%) |
| Public Administration | 99 (26.1%) | 280 (73.9%) |
| Total | 6,958 (56.2%) | 5,428 (43.8%) |
Education in Dawson County
School Enrollment in Dawson County
The most common levels of schooling among the 6,175 students in Dawson County are high school (1,460 | 23.6%), middle school (1,395 | 22.6%), and elementary school (1,381 | 22.4%).
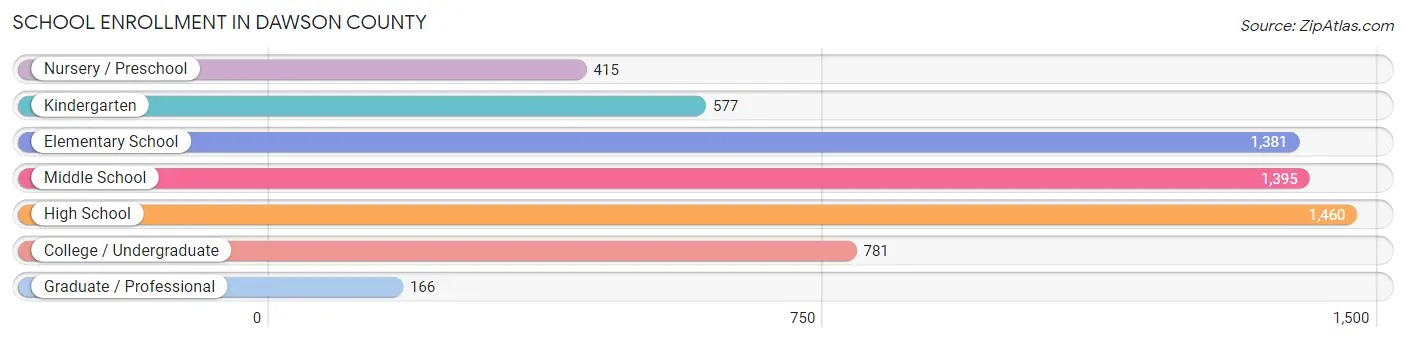
| School Level | # Students | % Students |
| Nursery / Preschool | 415 | 6.7% |
| Kindergarten | 577 | 9.3% |
| Elementary School | 1,381 | 22.4% |
| Middle School | 1,395 | 22.6% |
| High School | 1,460 | 23.6% |
| College / Undergraduate | 781 | 12.7% |
| Graduate / Professional | 166 | 2.7% |
| Total | 6,175 | 100.0% |
School Enrollment by Age by Funding Source in Dawson County
Out of a total of 6,175 students who are enrolled in schools in Dawson County, 290 (4.7%) attend a private institution, while the remaining 5,885 (95.3%) are enrolled in public schools. The age group of 35 years and over has the highest likelihood of being enrolled in private schools, with 47 (14.1% in the age bracket) enrolled. Conversely, the age group of 18 to 19 year olds has the lowest likelihood of being enrolled in a private school, with 365 (100.0% in the age bracket) attending a public institution.
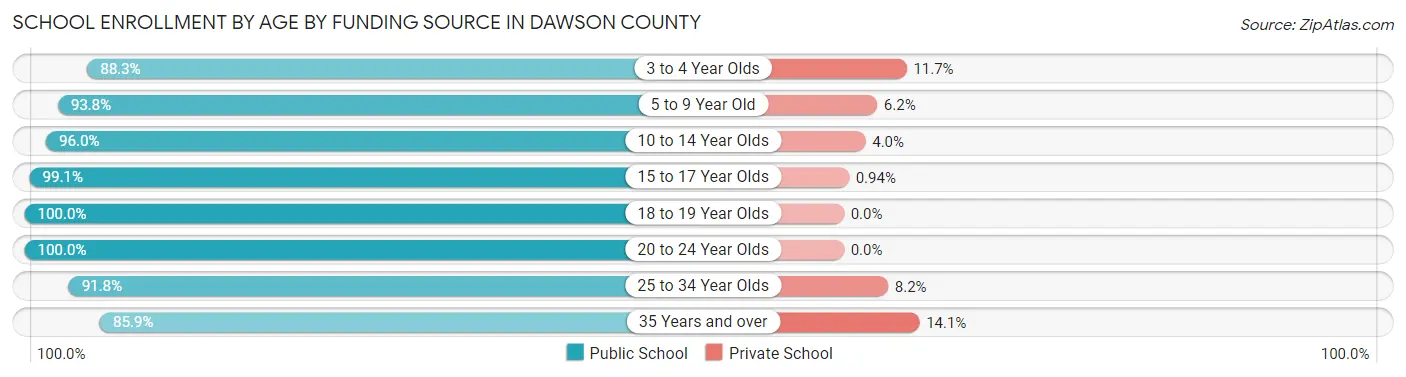
| Age Bracket | Public School | Private School |
| 3 to 4 Year Olds | 204 (88.3%) | 27 (11.7%) |
| 5 to 9 Year Old | 1,802 (93.8%) | 119 (6.2%) |
| 10 to 14 Year Olds | 1,598 (96.0%) | 67 (4.0%) |
| 15 to 17 Year Olds | 1,056 (99.1%) | 10 (0.9%) |
| 18 to 19 Year Olds | 365 (100.0%) | 0 (0.0%) |
| 20 to 24 Year Olds | 362 (100.0%) | 0 (0.0%) |
| 25 to 34 Year Olds | 212 (91.8%) | 19 (8.2%) |
| 35 Years and over | 287 (85.9%) | 47 (14.1%) |
| Total | 5,885 (95.3%) | 290 (4.7%) |
Educational Attainment by Field of Study in Dawson County
Education (815 | 30.5%), business (498 | 18.6%), science & technology (321 | 12.0%), bio, nature & agricultural (222 | 8.3%), and psychology (148 | 5.5%) are the most common fields of study among 2,676 individuals in Dawson County who have obtained a bachelor's degree or higher.
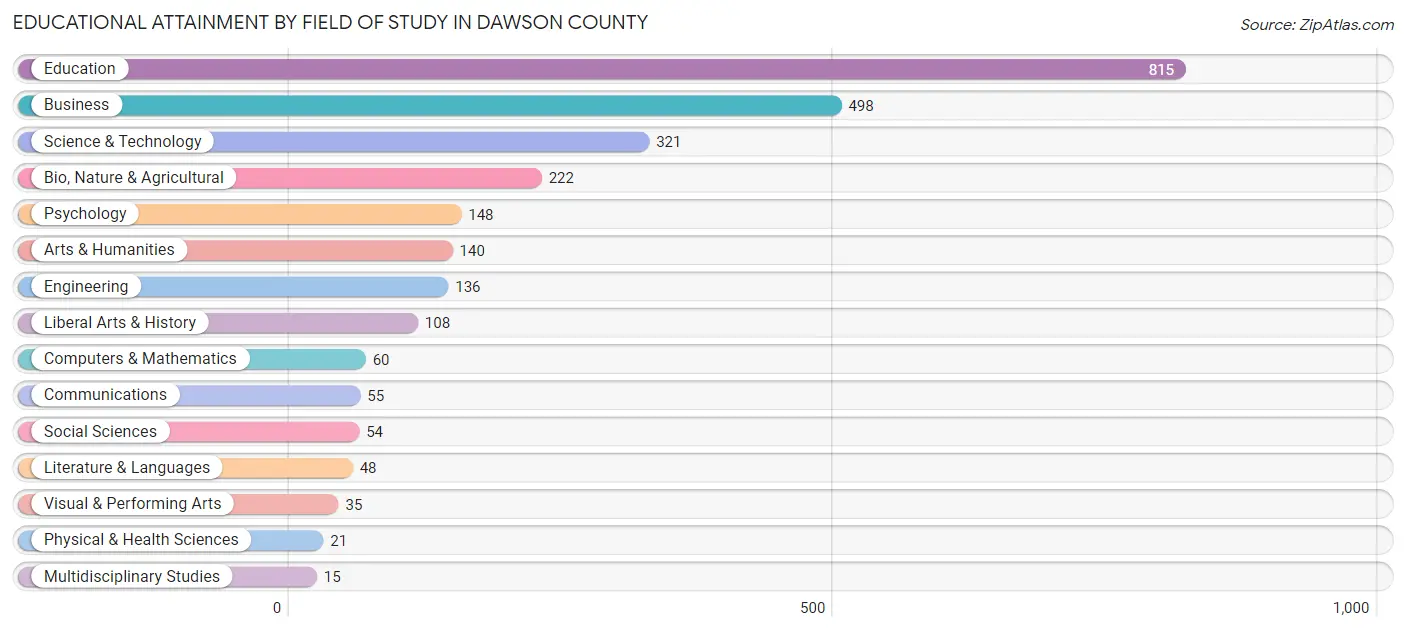
| Field of Study | # Graduates | % Graduates |
| Computers & Mathematics | 60 | 2.2% |
| Bio, Nature & Agricultural | 222 | 8.3% |
| Physical & Health Sciences | 21 | 0.8% |
| Psychology | 148 | 5.5% |
| Social Sciences | 54 | 2.0% |
| Engineering | 136 | 5.1% |
| Multidisciplinary Studies | 15 | 0.6% |
| Science & Technology | 321 | 12.0% |
| Business | 498 | 18.6% |
| Education | 815 | 30.5% |
| Literature & Languages | 48 | 1.8% |
| Liberal Arts & History | 108 | 4.0% |
| Visual & Performing Arts | 35 | 1.3% |
| Communications | 55 | 2.1% |
| Arts & Humanities | 140 | 5.2% |
| Total | 2,676 | 100.0% |
Transportation & Commute in Dawson County
Vehicle Availability by Sex in Dawson County
The most prevalent vehicle ownership categories in Dawson County are males with 2 vehicles (2,512, accounting for 36.5%) and females with 2 vehicles (1,920, making up 46.9%).
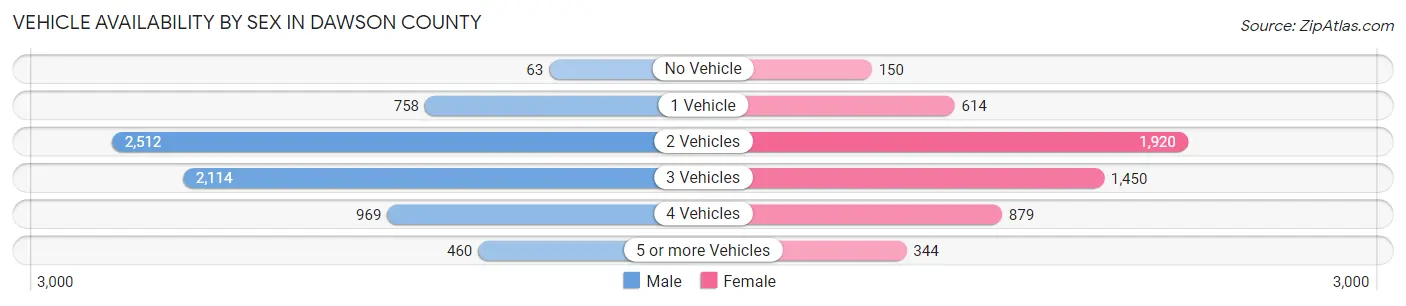
| Vehicles Available | Male | Female |
| No Vehicle | 63 (0.9%) | 150 (2.8%) |
| 1 Vehicle | 758 (11.0%) | 614 (11.5%) |
| 2 Vehicles | 2,512 (36.5%) | 1,920 (35.8%) |
| 3 Vehicles | 2,114 (30.7%) | 1,450 (27.1%) |
| 4 Vehicles | 969 (14.1%) | 879 (16.4%) |
| 5 or more Vehicles | 460 (6.7%) | 344 (6.4%) |
| Total | 6,876 (100.0%) | 5,357 (100.0%) |
Commute Time in Dawson County
The most frequently occuring commute durations in Dawson County are 5 to 9 minutes (3,790 commuters, 31.5%), 10 to 14 minutes (1,835 commuters, 15.3%), and 15 to 19 minutes (1,487 commuters, 12.4%).
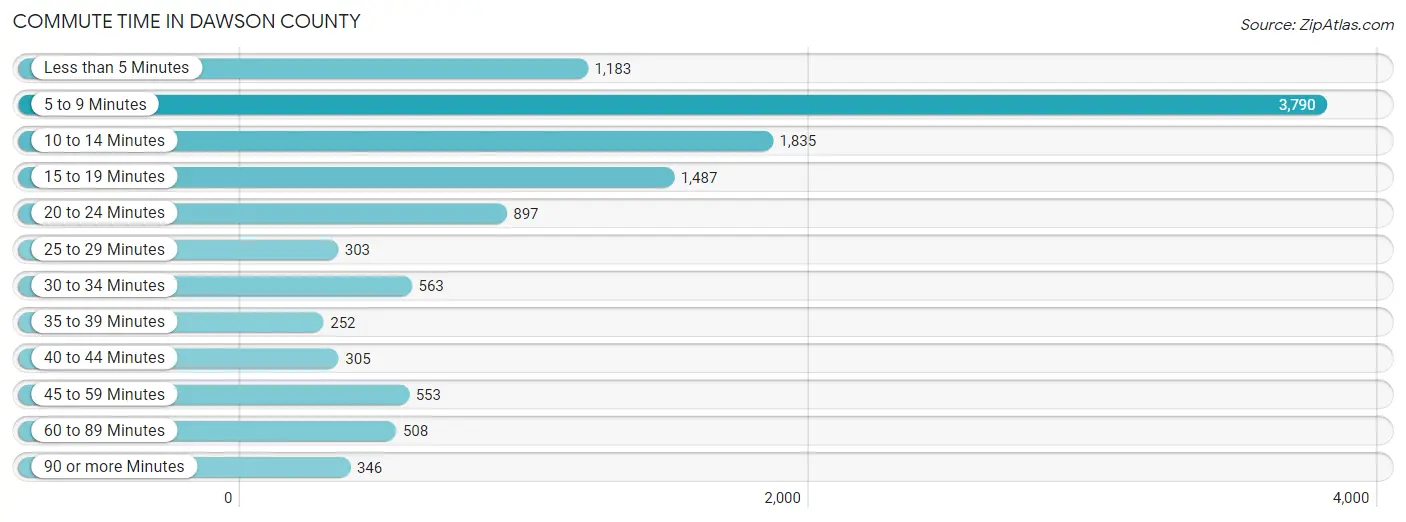
| Commute Time | # Commuters | % Commuters |
| Less than 5 Minutes | 1,183 | 9.8% |
| 5 to 9 Minutes | 3,790 | 31.5% |
| 10 to 14 Minutes | 1,835 | 15.3% |
| 15 to 19 Minutes | 1,487 | 12.4% |
| 20 to 24 Minutes | 897 | 7.5% |
| 25 to 29 Minutes | 303 | 2.5% |
| 30 to 34 Minutes | 563 | 4.7% |
| 35 to 39 Minutes | 252 | 2.1% |
| 40 to 44 Minutes | 305 | 2.5% |
| 45 to 59 Minutes | 553 | 4.6% |
| 60 to 89 Minutes | 508 | 4.2% |
| 90 or more Minutes | 346 | 2.9% |
Commute Time by Sex in Dawson County
The most common commute times in Dawson County are 5 to 9 minutes (1,914 commuters, 28.2%) for males and 5 to 9 minutes (1,876 commuters, 35.8%) for females.
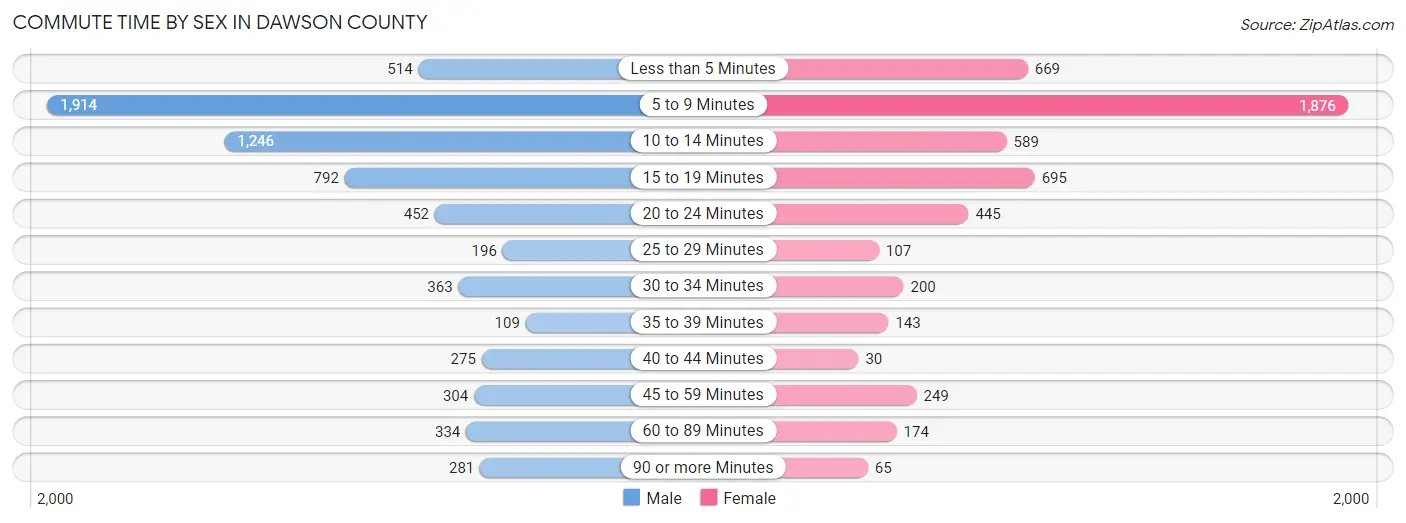
| Commute Time | Male | Female |
| Less than 5 Minutes | 514 (7.6%) | 669 (12.8%) |
| 5 to 9 Minutes | 1,914 (28.2%) | 1,876 (35.8%) |
| 10 to 14 Minutes | 1,246 (18.4%) | 589 (11.2%) |
| 15 to 19 Minutes | 792 (11.7%) | 695 (13.3%) |
| 20 to 24 Minutes | 452 (6.7%) | 445 (8.5%) |
| 25 to 29 Minutes | 196 (2.9%) | 107 (2.0%) |
| 30 to 34 Minutes | 363 (5.3%) | 200 (3.8%) |
| 35 to 39 Minutes | 109 (1.6%) | 143 (2.7%) |
| 40 to 44 Minutes | 275 (4.1%) | 30 (0.6%) |
| 45 to 59 Minutes | 304 (4.5%) | 249 (4.8%) |
| 60 to 89 Minutes | 334 (4.9%) | 174 (3.3%) |
| 90 or more Minutes | 281 (4.1%) | 65 (1.2%) |
Time of Departure to Work by Sex in Dawson County
The most frequent times of departure to work in Dawson County are 12:00 PM to 3:59 PM (1,136, 16.8%) for males and 7:30 AM to 7:59 AM (1,087, 20.7%) for females.
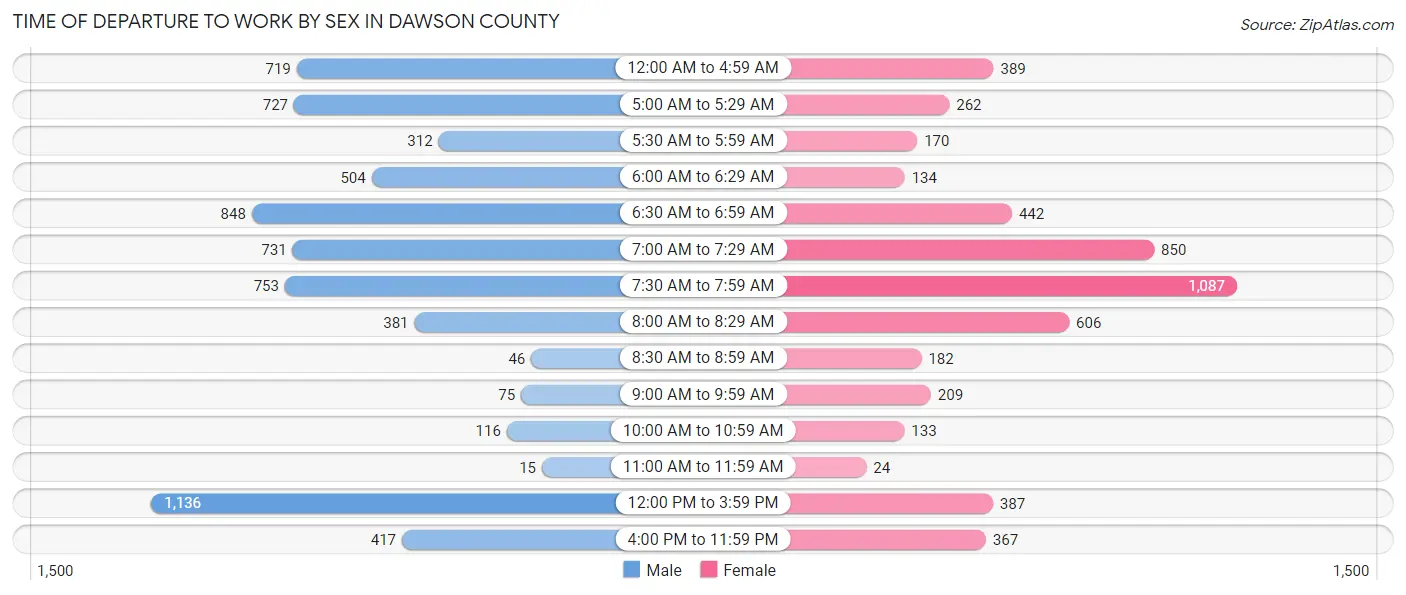
| Time of Departure | Male | Female |
| 12:00 AM to 4:59 AM | 719 (10.6%) | 389 (7.4%) |
| 5:00 AM to 5:29 AM | 727 (10.7%) | 262 (5.0%) |
| 5:30 AM to 5:59 AM | 312 (4.6%) | 170 (3.2%) |
| 6:00 AM to 6:29 AM | 504 (7.4%) | 134 (2.6%) |
| 6:30 AM to 6:59 AM | 848 (12.5%) | 442 (8.4%) |
| 7:00 AM to 7:29 AM | 731 (10.8%) | 850 (16.2%) |
| 7:30 AM to 7:59 AM | 753 (11.1%) | 1,087 (20.7%) |
| 8:00 AM to 8:29 AM | 381 (5.6%) | 606 (11.6%) |
| 8:30 AM to 8:59 AM | 46 (0.7%) | 182 (3.5%) |
| 9:00 AM to 9:59 AM | 75 (1.1%) | 209 (4.0%) |
| 10:00 AM to 10:59 AM | 116 (1.7%) | 133 (2.5%) |
| 11:00 AM to 11:59 AM | 15 (0.2%) | 24 (0.5%) |
| 12:00 PM to 3:59 PM | 1,136 (16.8%) | 387 (7.4%) |
| 4:00 PM to 11:59 PM | 417 (6.1%) | 367 (7.0%) |
| Total | 6,780 (100.0%) | 5,242 (100.0%) |
Housing Occupancy in Dawson County
Occupancy by Ownership in Dawson County
Of the total 8,810 dwellings in Dawson County, owner-occupied units account for 5,908 (67.1%), while renter-occupied units make up 2,902 (32.9%).
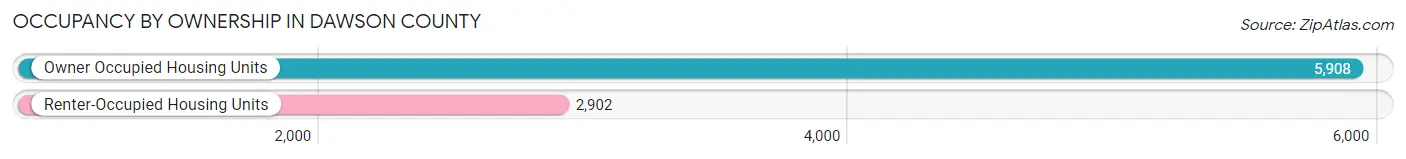
| Occupancy | # Housing Units | % Housing Units |
| Owner Occupied Housing Units | 5,908 | 67.1% |
| Renter-Occupied Housing Units | 2,902 | 32.9% |
| Total Occupied Housing Units | 8,810 | 100.0% |
Occupancy by Household Size in Dawson County
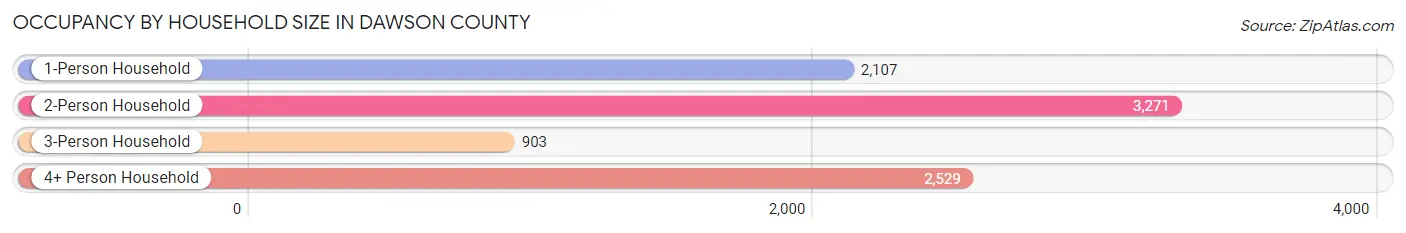
| Household Size | # Housing Units | % Housing Units |
| 1-Person Household | 2,107 | 23.9% |
| 2-Person Household | 3,271 | 37.1% |
| 3-Person Household | 903 | 10.2% |
| 4+ Person Household | 2,529 | 28.7% |
| Total Housing Units | 8,810 | 100.0% |
Occupancy by Ownership by Household Size in Dawson County
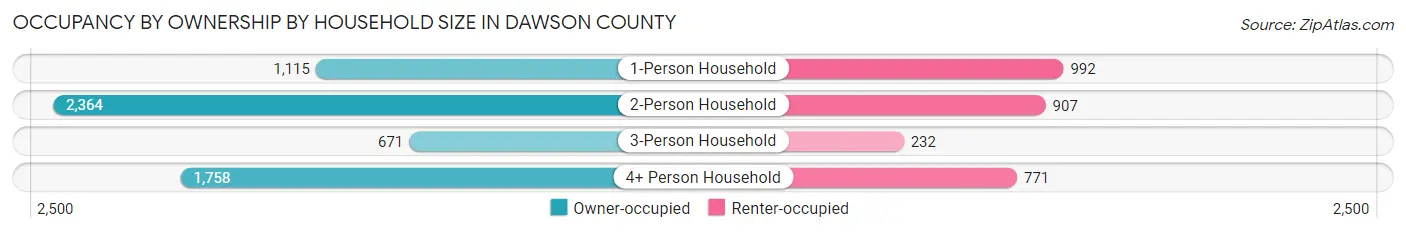
| Household Size | Owner-occupied | Renter-occupied |
| 1-Person Household | 1,115 (52.9%) | 992 (47.1%) |
| 2-Person Household | 2,364 (72.3%) | 907 (27.7%) |
| 3-Person Household | 671 (74.3%) | 232 (25.7%) |
| 4+ Person Household | 1,758 (69.5%) | 771 (30.5%) |
| Total Housing Units | 5,908 (67.1%) | 2,902 (32.9%) |
Occupancy by Educational Attainment in Dawson County
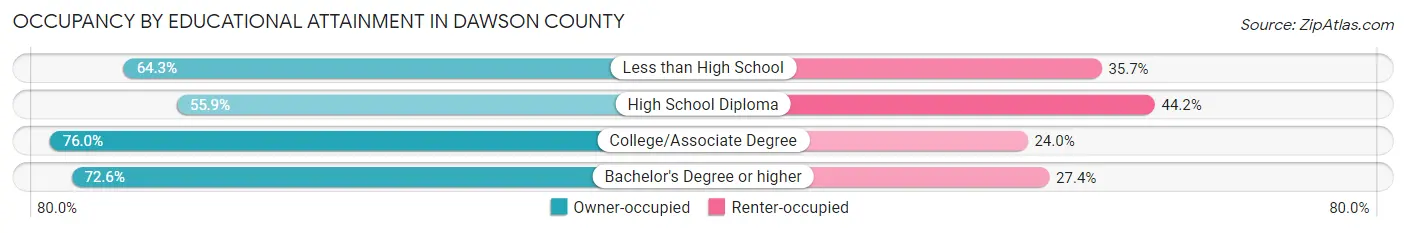
| Household Size | Owner-occupied | Renter-occupied |
| Less than High School | 1,018 (64.3%) | 566 (35.7%) |
| High School Diploma | 1,523 (55.8%) | 1,204 (44.2%) |
| College/Associate Degree | 2,267 (76.0%) | 716 (24.0%) |
| Bachelor's Degree or higher | 1,100 (72.6%) | 416 (27.4%) |
Occupancy by Age of Householder in Dawson County
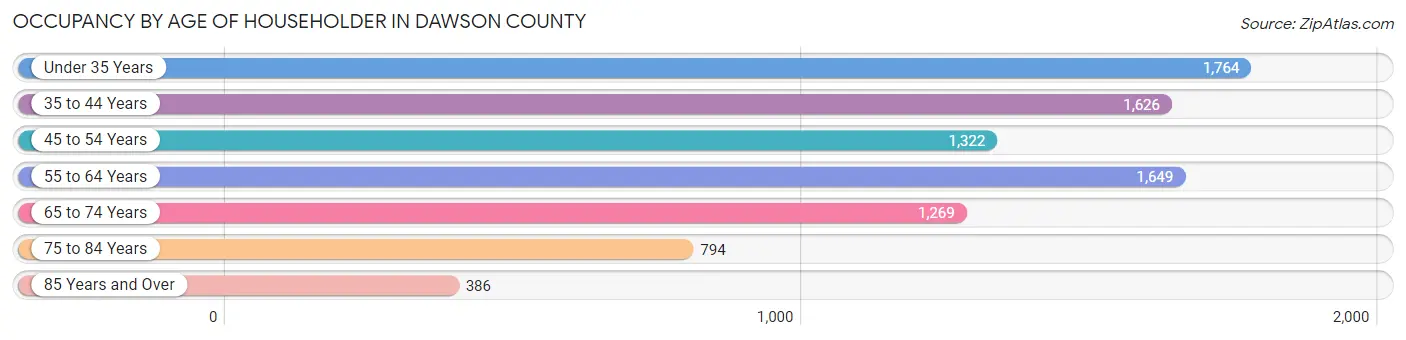
| Age Bracket | # Households | % Households |
| Under 35 Years | 1,764 | 20.0% |
| 35 to 44 Years | 1,626 | 18.5% |
| 45 to 54 Years | 1,322 | 15.0% |
| 55 to 64 Years | 1,649 | 18.7% |
| 65 to 74 Years | 1,269 | 14.4% |
| 75 to 84 Years | 794 | 9.0% |
| 85 Years and Over | 386 | 4.4% |
| Total | 8,810 | 100.0% |
Housing Finances in Dawson County
Median Income by Occupancy in Dawson County
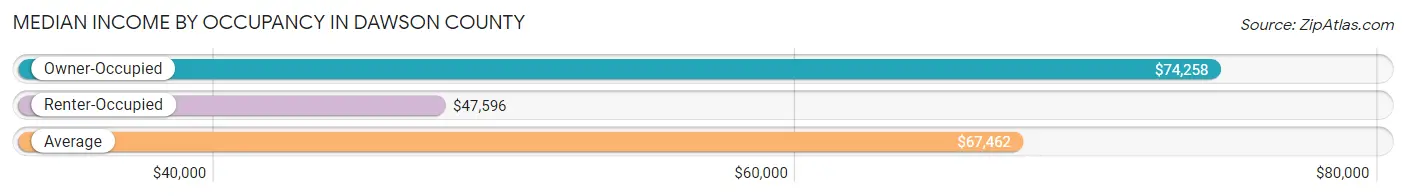
| Occupancy Type | # Households | Median Income |
| Owner-Occupied | 5,908 (67.1%) | $74,258 |
| Renter-Occupied | 2,902 (32.9%) | $47,596 |
| Average | 8,810 (100.0%) | $67,462 |
Occupancy by Householder Income Bracket in Dawson County
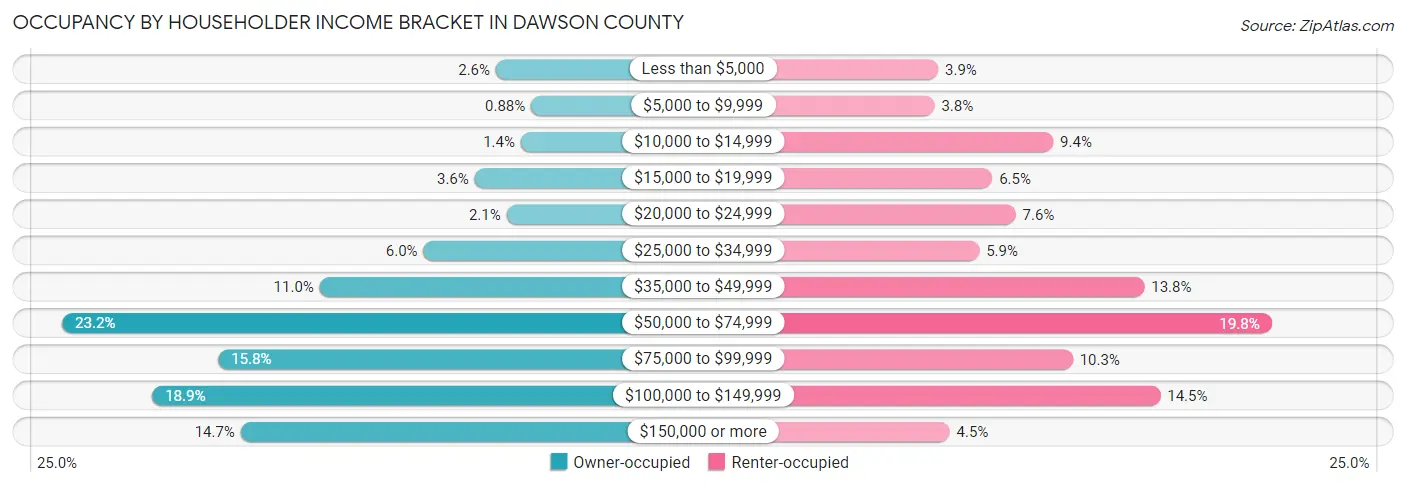
| Income Bracket | Owner-occupied | Renter-occupied |
| Less than $5,000 | 151 (2.6%) | 114 (3.9%) |
| $5,000 to $9,999 | 52 (0.9%) | 109 (3.8%) |
| $10,000 to $14,999 | 81 (1.4%) | 273 (9.4%) |
| $15,000 to $19,999 | 211 (3.6%) | 189 (6.5%) |
| $20,000 to $24,999 | 121 (2.1%) | 221 (7.6%) |
| $25,000 to $34,999 | 355 (6.0%) | 171 (5.9%) |
| $35,000 to $49,999 | 647 (11.0%) | 399 (13.8%) |
| $50,000 to $74,999 | 1,371 (23.2%) | 575 (19.8%) |
| $75,000 to $99,999 | 932 (15.8%) | 300 (10.3%) |
| $100,000 to $149,999 | 1,118 (18.9%) | 421 (14.5%) |
| $150,000 or more | 869 (14.7%) | 130 (4.5%) |
| Total | 5,908 (100.0%) | 2,902 (100.0%) |
Monthly Housing Cost Tiers in Dawson County
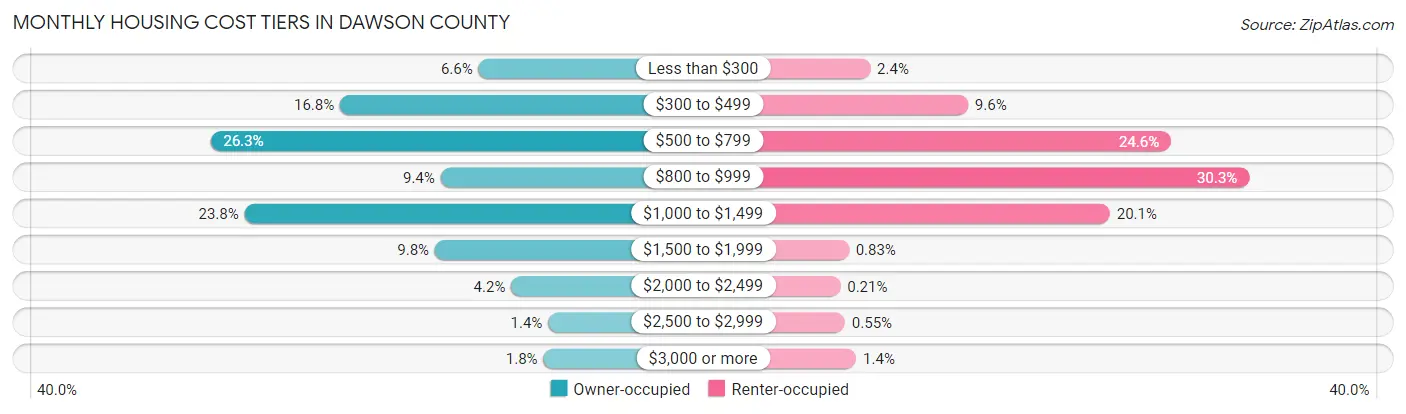
| Monthly Cost | Owner-occupied | Renter-occupied |
| Less than $300 | 388 (6.6%) | 70 (2.4%) |
| $300 to $499 | 991 (16.8%) | 279 (9.6%) |
| $500 to $799 | 1,555 (26.3%) | 713 (24.6%) |
| $800 to $999 | 553 (9.4%) | 880 (30.3%) |
| $1,000 to $1,499 | 1,406 (23.8%) | 582 (20.1%) |
| $1,500 to $1,999 | 578 (9.8%) | 24 (0.8%) |
| $2,000 to $2,499 | 246 (4.2%) | 6 (0.2%) |
| $2,500 to $2,999 | 85 (1.4%) | 16 (0.5%) |
| $3,000 or more | 106 (1.8%) | 40 (1.4%) |
| Total | 5,908 (100.0%) | 2,902 (100.0%) |
Physical Housing Characteristics in Dawson County
Housing Structures in Dawson County
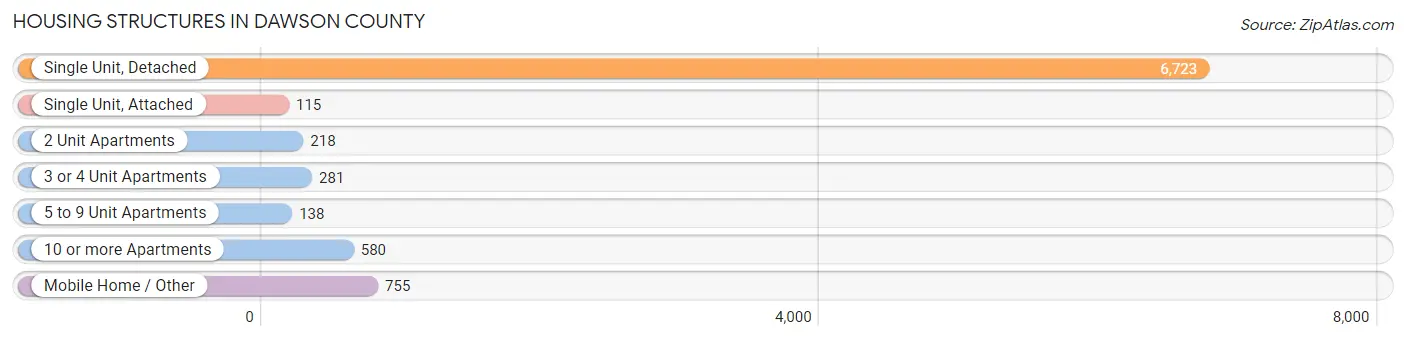
| Structure Type | # Housing Units | % Housing Units |
| Single Unit, Detached | 6,723 | 76.3% |
| Single Unit, Attached | 115 | 1.3% |
| 2 Unit Apartments | 218 | 2.5% |
| 3 or 4 Unit Apartments | 281 | 3.2% |
| 5 to 9 Unit Apartments | 138 | 1.6% |
| 10 or more Apartments | 580 | 6.6% |
| Mobile Home / Other | 755 | 8.6% |
| Total | 8,810 | 100.0% |
Housing Structures by Occupancy in Dawson County
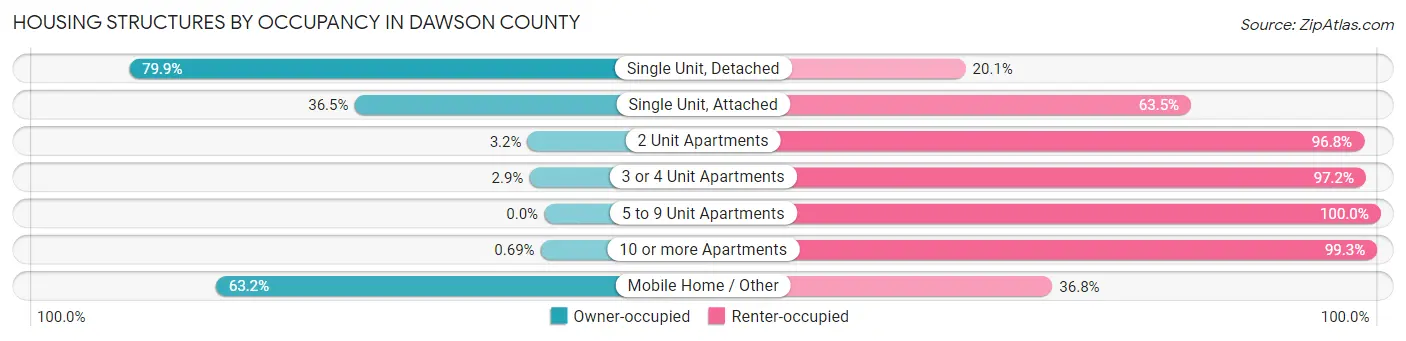
| Structure Type | Owner-occupied | Renter-occupied |
| Single Unit, Detached | 5,370 (79.9%) | 1,353 (20.1%) |
| Single Unit, Attached | 42 (36.5%) | 73 (63.5%) |
| 2 Unit Apartments | 7 (3.2%) | 211 (96.8%) |
| 3 or 4 Unit Apartments | 8 (2.9%) | 273 (97.2%) |
| 5 to 9 Unit Apartments | 0 (0.0%) | 138 (100.0%) |
| 10 or more Apartments | 4 (0.7%) | 576 (99.3%) |
| Mobile Home / Other | 477 (63.2%) | 278 (36.8%) |
| Total | 5,908 (67.1%) | 2,902 (32.9%) |
Housing Structures by Number of Rooms in Dawson County
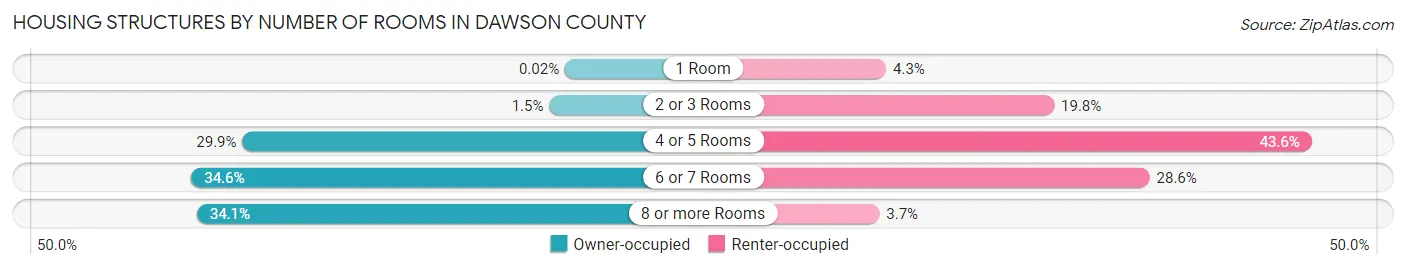
| Number of Rooms | Owner-occupied | Renter-occupied |
| 1 Room | 1 (0.0%) | 124 (4.3%) |
| 2 or 3 Rooms | 87 (1.5%) | 575 (19.8%) |
| 4 or 5 Rooms | 1,764 (29.9%) | 1,266 (43.6%) |
| 6 or 7 Rooms | 2,043 (34.6%) | 831 (28.6%) |
| 8 or more Rooms | 2,013 (34.1%) | 106 (3.6%) |
| Total | 5,908 (100.0%) | 2,902 (100.0%) |
Housing Structure by Heating Type in Dawson County
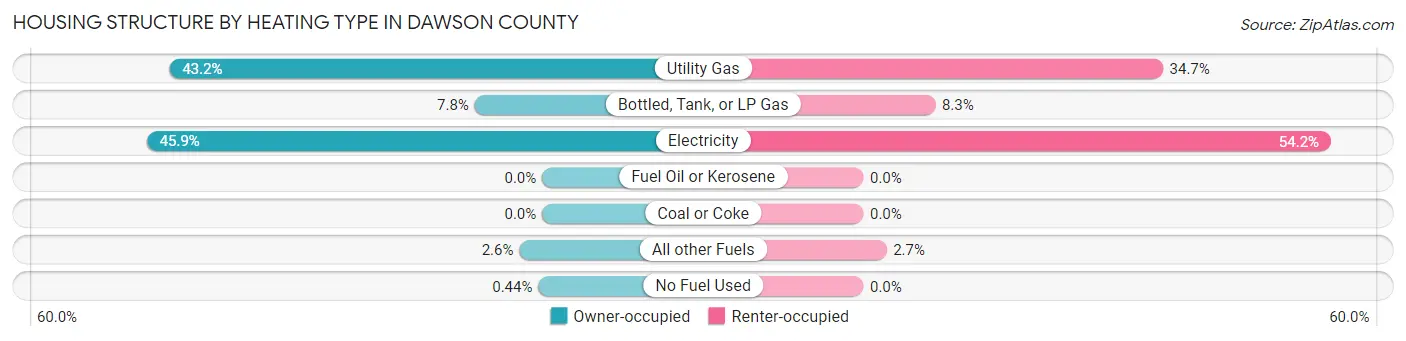
| Heating Type | Owner-occupied | Renter-occupied |
| Utility Gas | 2,554 (43.2%) | 1,008 (34.7%) |
| Bottled, Tank, or LP Gas | 462 (7.8%) | 242 (8.3%) |
| Electricity | 2,710 (45.9%) | 1,574 (54.2%) |
| Fuel Oil or Kerosene | 0 (0.0%) | 0 (0.0%) |
| Coal or Coke | 0 (0.0%) | 0 (0.0%) |
| All other Fuels | 156 (2.6%) | 78 (2.7%) |
| No Fuel Used | 26 (0.4%) | 0 (0.0%) |
| Total | 5,908 (100.0%) | 2,902 (100.0%) |
Household Vehicle Usage in Dawson County
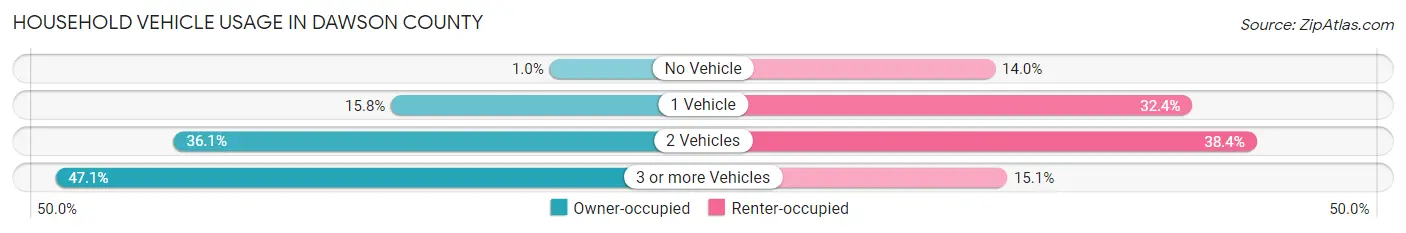
| Vehicles per Household | Owner-occupied | Renter-occupied |
| No Vehicle | 59 (1.0%) | 407 (14.0%) |
| 1 Vehicle | 932 (15.8%) | 941 (32.4%) |
| 2 Vehicles | 2,132 (36.1%) | 1,115 (38.4%) |
| 3 or more Vehicles | 2,785 (47.1%) | 439 (15.1%) |
| Total | 5,908 (100.0%) | 2,902 (100.0%) |
Real Estate & Mortgages in Dawson County
Real Estate and Mortgage Overview in Dawson County
| Characteristic | Without Mortgage | With Mortgage |
| Housing Units | 2,943 | 2,965 |
| Median Property Value | $116,400 | $152,000 |
| Median Household Income | $66,528 | $504 |
| Monthly Housing Costs | $524 | $101 |
| Real Estate Taxes | $1,529 | $30 |
Property Value by Mortgage Status in Dawson County
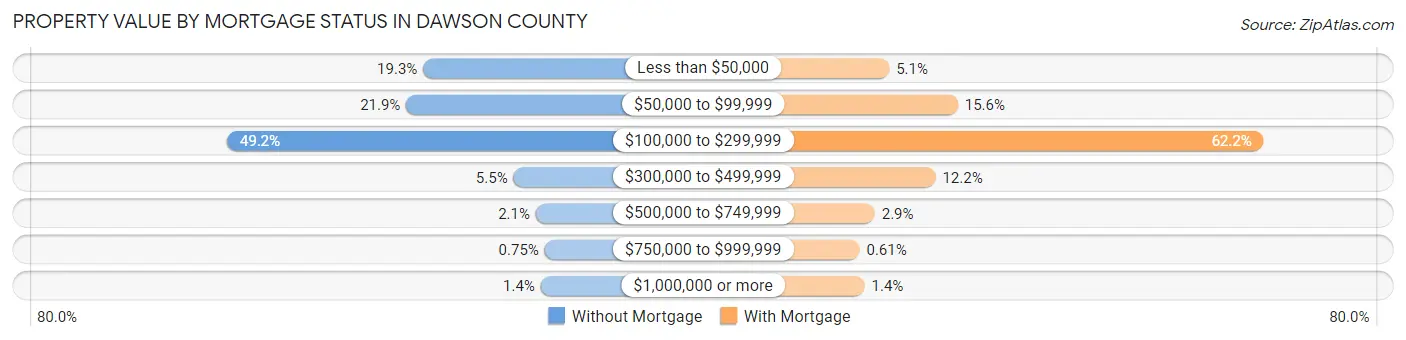
| Property Value | Without Mortgage | With Mortgage |
| Less than $50,000 | 567 (19.3%) | 152 (5.1%) |
| $50,000 to $99,999 | 643 (21.8%) | 462 (15.6%) |
| $100,000 to $299,999 | 1,447 (49.2%) | 1,844 (62.2%) |
| $300,000 to $499,999 | 162 (5.5%) | 361 (12.2%) |
| $500,000 to $749,999 | 62 (2.1%) | 87 (2.9%) |
| $750,000 to $999,999 | 22 (0.7%) | 18 (0.6%) |
| $1,000,000 or more | 40 (1.4%) | 41 (1.4%) |
| Total | 2,943 (100.0%) | 2,965 (100.0%) |
Household Income by Mortgage Status in Dawson County
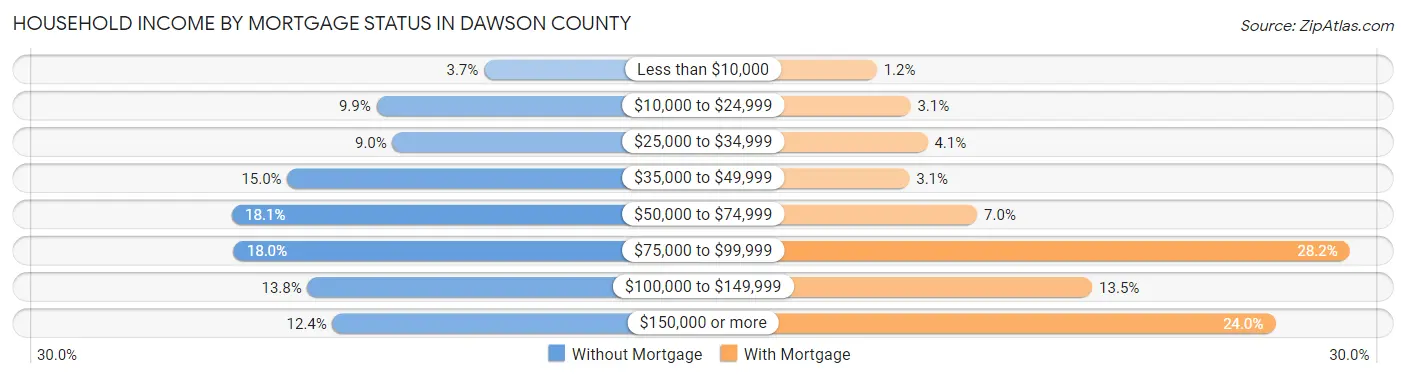
| Household Income | Without Mortgage | With Mortgage |
| Less than $10,000 | 110 (3.7%) | 36 (1.2%) |
| $10,000 to $24,999 | 291 (9.9%) | 93 (3.1%) |
| $25,000 to $34,999 | 264 (9.0%) | 122 (4.1%) |
| $35,000 to $49,999 | 441 (15.0%) | 91 (3.1%) |
| $50,000 to $74,999 | 534 (18.1%) | 206 (7.0%) |
| $75,000 to $99,999 | 531 (18.0%) | 837 (28.2%) |
| $100,000 to $149,999 | 407 (13.8%) | 401 (13.5%) |
| $150,000 or more | 365 (12.4%) | 711 (24.0%) |
| Total | 2,943 (100.0%) | 2,965 (100.0%) |
Property Value to Household Income Ratio in Dawson County
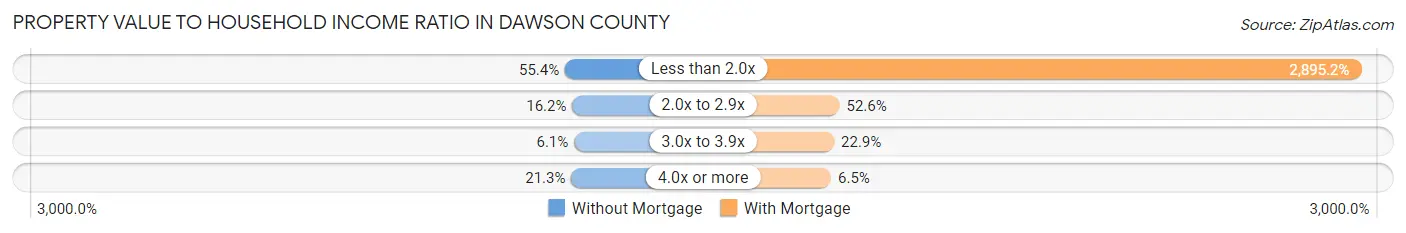
| Value-to-Income Ratio | Without Mortgage | With Mortgage |
| Less than 2.0x | 1,630 (55.4%) | 85,844 (2,895.2%) |
| 2.0x to 2.9x | 476 (16.2%) | 1,559 (52.6%) |
| 3.0x to 3.9x | 180 (6.1%) | 678 (22.9%) |
| 4.0x or more | 627 (21.3%) | 193 (6.5%) |
| Total | 2,943 (100.0%) | 2,965 (100.0%) |
Real Estate Taxes by Mortgage Status in Dawson County
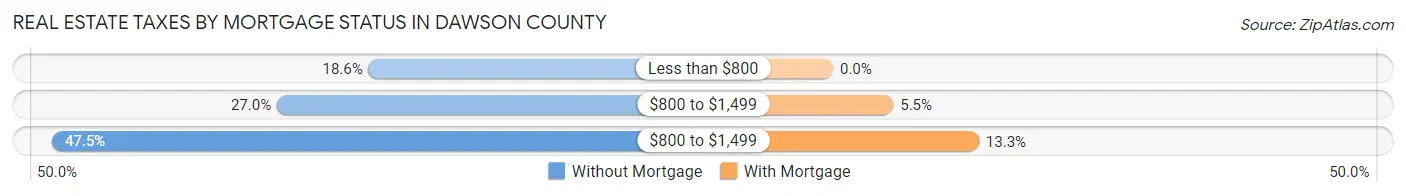
| Property Taxes | Without Mortgage | With Mortgage |
| Less than $800 | 547 (18.6%) | 0 (0.0%) |
| $800 to $1,499 | 793 (27.0%) | 163 (5.5%) |
| $800 to $1,499 | 1,398 (47.5%) | 395 (13.3%) |
| Total | 2,943 (100.0%) | 2,965 (100.0%) |
Health & Disability in Dawson County
Health Insurance Coverage by Age in Dawson County
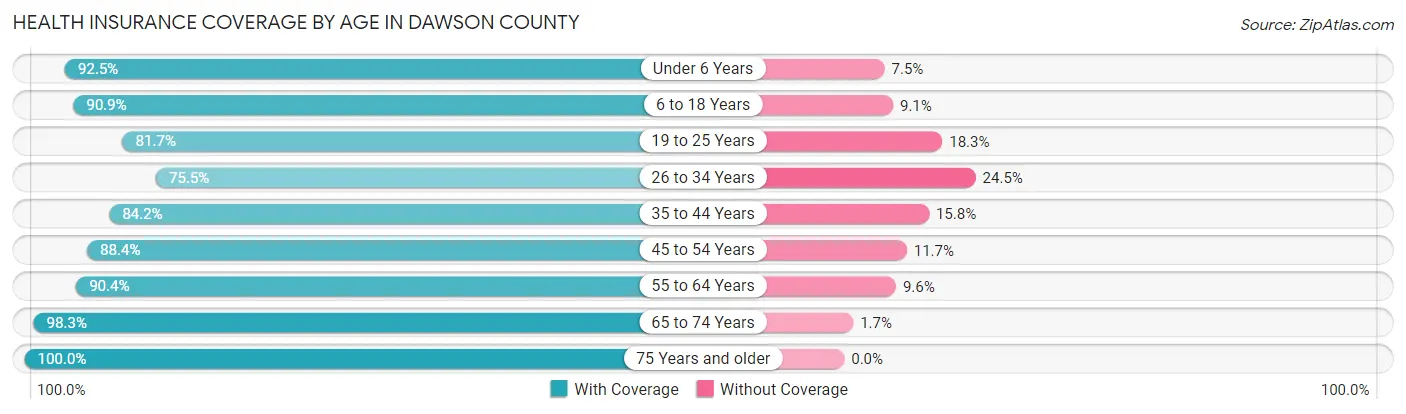
| Age Bracket | With Coverage | Without Coverage |
| Under 6 Years | 2,029 (92.5%) | 165 (7.5%) |
| 6 to 18 Years | 4,300 (90.9%) | 430 (9.1%) |
| 19 to 25 Years | 1,591 (81.7%) | 356 (18.3%) |
| 26 to 34 Years | 2,015 (75.5%) | 654 (24.5%) |
| 35 to 44 Years | 2,506 (84.2%) | 470 (15.8%) |
| 45 to 54 Years | 2,313 (88.3%) | 305 (11.7%) |
| 55 to 64 Years | 2,488 (90.4%) | 265 (9.6%) |
| 65 to 74 Years | 2,117 (98.3%) | 36 (1.7%) |
| 75 Years and older | 1,750 (100.0%) | 0 (0.0%) |
| Total | 21,109 (88.7%) | 2,681 (11.3%) |
Health Insurance Coverage by Citizenship Status in Dawson County
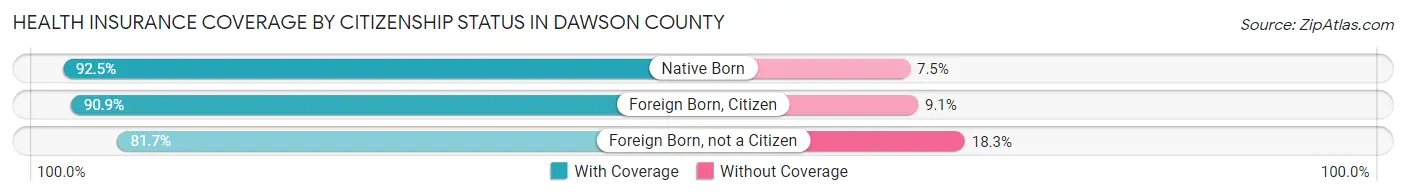
| Citizenship Status | With Coverage | Without Coverage |
| Native Born | 2,029 (92.5%) | 165 (7.5%) |
| Foreign Born, Citizen | 4,300 (90.9%) | 430 (9.1%) |
| Foreign Born, not a Citizen | 1,591 (81.7%) | 356 (18.3%) |
Health Insurance Coverage by Household Income in Dawson County
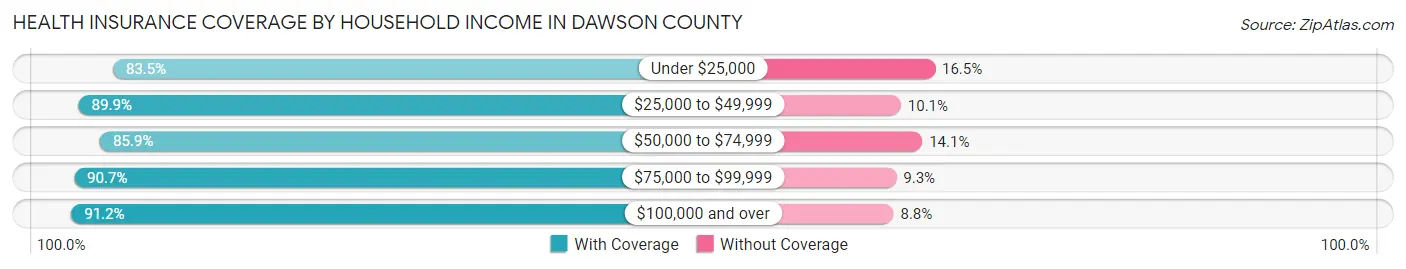
| Household Income | With Coverage | Without Coverage |
| Under $25,000 | 2,217 (83.5%) | 439 (16.5%) |
| $25,000 to $49,999 | 3,337 (89.9%) | 376 (10.1%) |
| $50,000 to $74,999 | 4,675 (85.9%) | 769 (14.1%) |
| $75,000 to $99,999 | 3,252 (90.7%) | 333 (9.3%) |
| $100,000 and over | 7,572 (91.2%) | 727 (8.8%) |
Public vs Private Health Insurance Coverage by Age in Dawson County
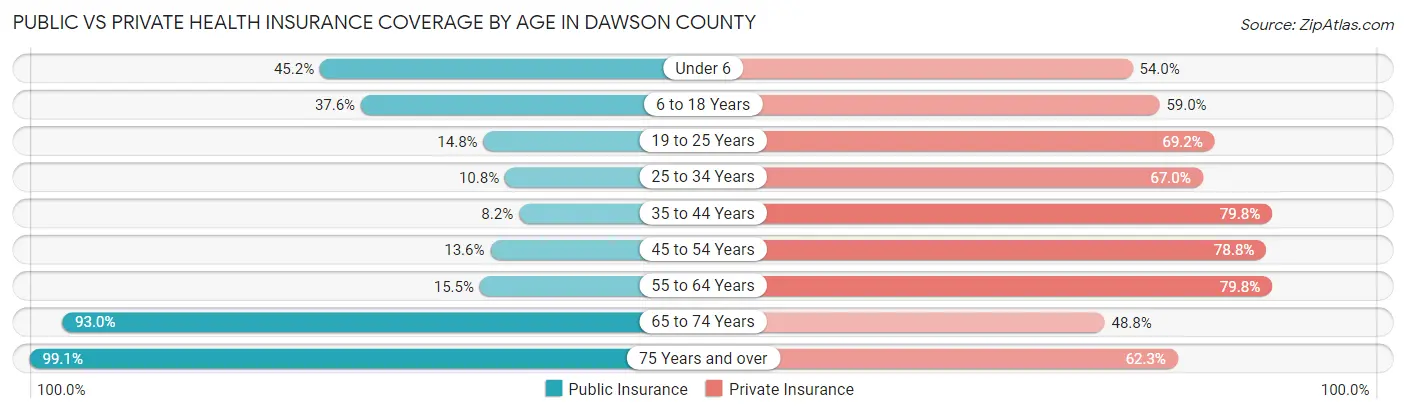
| Age Bracket | Public Insurance | Private Insurance |
| Under 6 | 991 (45.2%) | 1,184 (54.0%) |
| 6 to 18 Years | 1,777 (37.6%) | 2,789 (59.0%) |
| 19 to 25 Years | 289 (14.8%) | 1,347 (69.2%) |
| 25 to 34 Years | 289 (10.8%) | 1,787 (66.9%) |
| 35 to 44 Years | 245 (8.2%) | 2,376 (79.8%) |
| 45 to 54 Years | 355 (13.6%) | 2,062 (78.8%) |
| 55 to 64 Years | 427 (15.5%) | 2,198 (79.8%) |
| 65 to 74 Years | 2,003 (93.0%) | 1,050 (48.8%) |
| 75 Years and over | 1,734 (99.1%) | 1,091 (62.3%) |
| Total | 8,110 (34.1%) | 15,884 (66.8%) |
Disability Status by Sex by Age in Dawson County

| Age Bracket | Male | Female |
| Under 5 Years | 0 (0.0%) | 0 (0.0%) |
| 5 to 17 Years | 130 (5.1%) | 138 (6.2%) |
| 18 to 34 Years | 139 (5.5%) | 203 (8.3%) |
| 35 to 64 Years | 595 (13.2%) | 393 (10.2%) |
| 65 to 74 Years | 230 (21.9%) | 165 (15.0%) |
| 75 Years and over | 514 (63.7%) | 566 (60.0%) |
Disability Class by Sex by Age in Dawson County
Disability Class: Hearing Difficulty
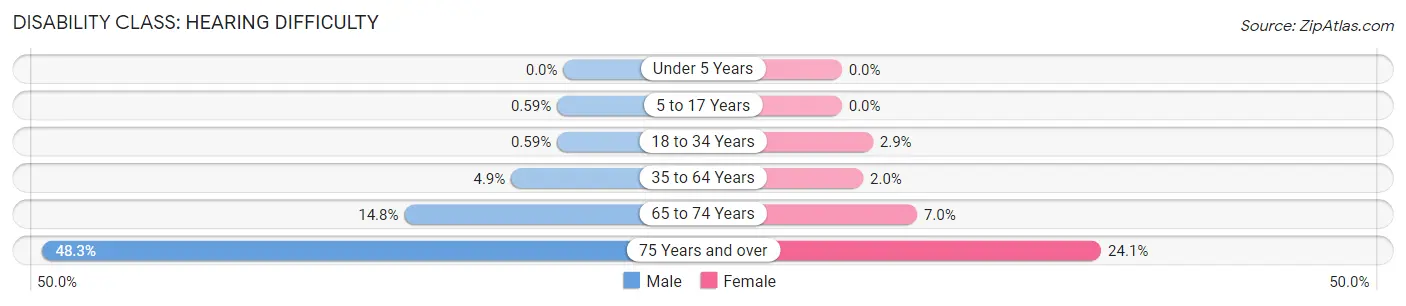
| Age Bracket | Male | Female |
| Under 5 Years | 0 (0.0%) | 0 (0.0%) |
| 5 to 17 Years | 15 (0.6%) | 0 (0.0%) |
| 18 to 34 Years | 15 (0.6%) | 71 (2.9%) |
| 35 to 64 Years | 219 (4.9%) | 76 (2.0%) |
| 65 to 74 Years | 155 (14.8%) | 77 (7.0%) |
| 75 Years and over | 390 (48.3%) | 227 (24.1%) |
Disability Class: Vision Difficulty
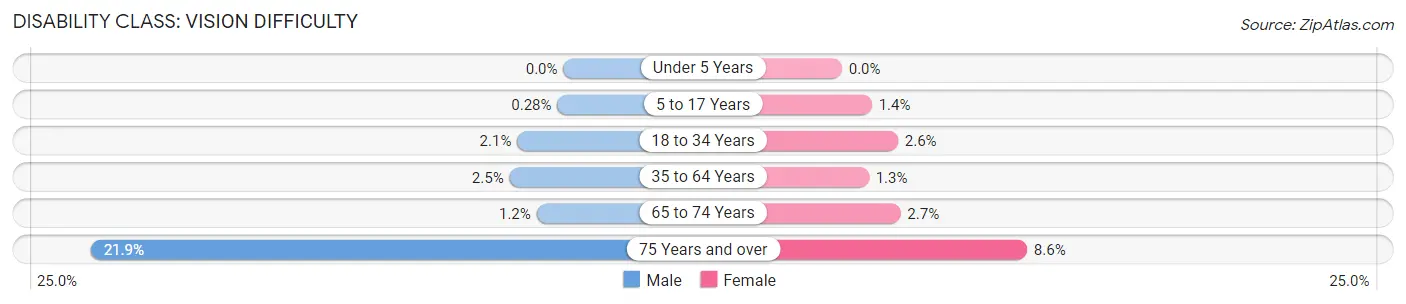
| Age Bracket | Male | Female |
| Under 5 Years | 0 (0.0%) | 0 (0.0%) |
| 5 to 17 Years | 7 (0.3%) | 31 (1.4%) |
| 18 to 34 Years | 54 (2.1%) | 64 (2.6%) |
| 35 to 64 Years | 113 (2.5%) | 48 (1.3%) |
| 65 to 74 Years | 13 (1.2%) | 30 (2.7%) |
| 75 Years and over | 177 (21.9%) | 81 (8.6%) |
Disability Class: Cognitive Difficulty
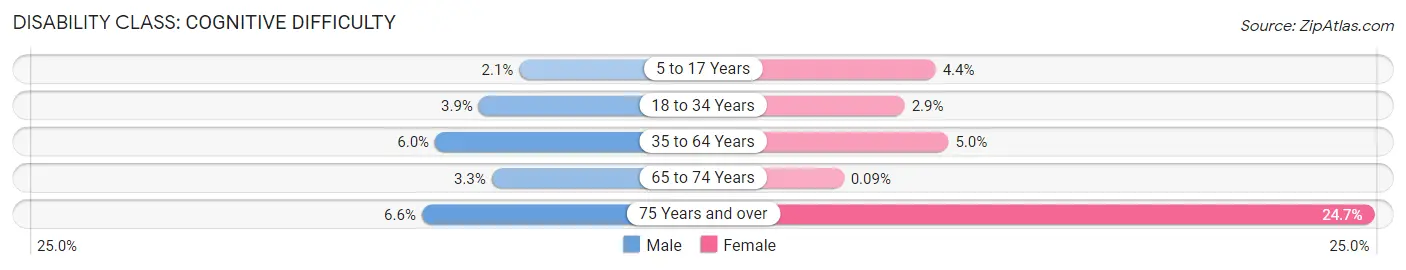
| Age Bracket | Male | Female |
| 5 to 17 Years | 52 (2.1%) | 97 (4.4%) |
| 18 to 34 Years | 99 (3.9%) | 72 (2.9%) |
| 35 to 64 Years | 269 (6.0%) | 190 (5.0%) |
| 65 to 74 Years | 35 (3.3%) | 1 (0.1%) |
| 75 Years and over | 53 (6.6%) | 233 (24.7%) |
Disability Class: Ambulatory Difficulty
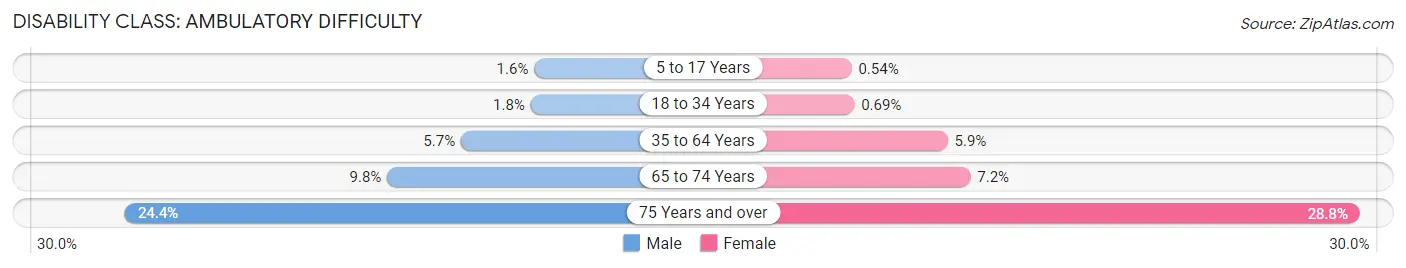
| Age Bracket | Male | Female |
| 5 to 17 Years | 41 (1.6%) | 12 (0.5%) |
| 18 to 34 Years | 46 (1.8%) | 17 (0.7%) |
| 35 to 64 Years | 257 (5.7%) | 226 (5.9%) |
| 65 to 74 Years | 103 (9.8%) | 79 (7.2%) |
| 75 Years and over | 197 (24.4%) | 272 (28.8%) |
Disability Class: Self-Care Difficulty
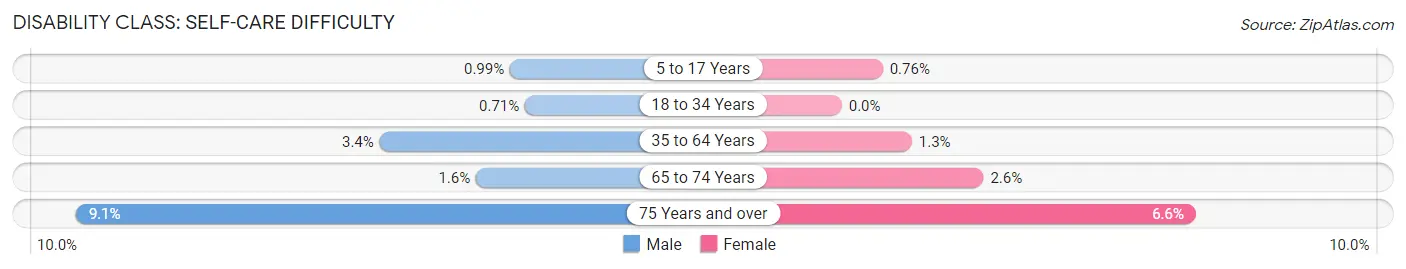
| Age Bracket | Male | Female |
| 5 to 17 Years | 25 (1.0%) | 17 (0.8%) |
| 18 to 34 Years | 18 (0.7%) | 0 (0.0%) |
| 35 to 64 Years | 154 (3.4%) | 50 (1.3%) |
| 65 to 74 Years | 17 (1.6%) | 29 (2.6%) |
| 75 Years and over | 73 (9.0%) | 62 (6.6%) |
Technology Access in Dawson County
Computing Device Access in Dawson County
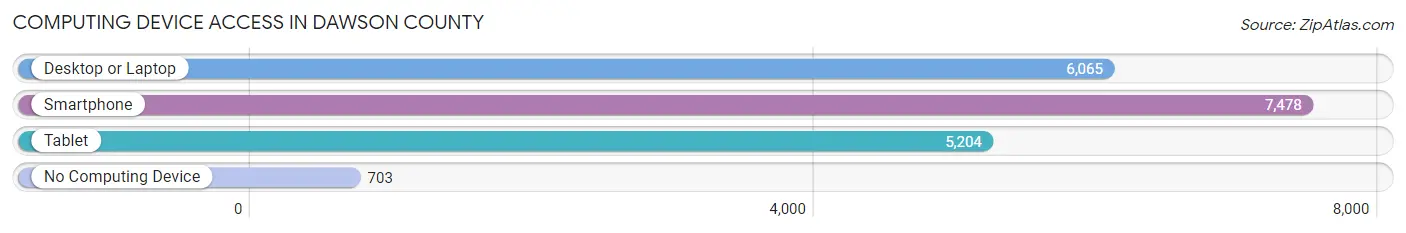
| Device Type | # Households | % Households |
| Desktop or Laptop | 6,065 | 68.8% |
| Smartphone | 7,478 | 84.9% |
| Tablet | 5,204 | 59.1% |
| No Computing Device | 703 | 8.0% |
| Total | 8,810 | 100.0% |
Internet Access in Dawson County
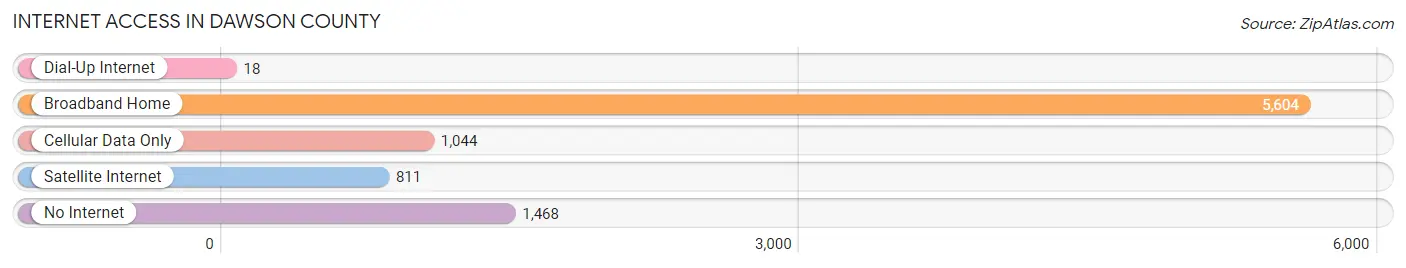
| Internet Type | # Households | % Households |
| Dial-Up Internet | 18 | 0.2% |
| Broadband Home | 5,604 | 63.6% |
| Cellular Data Only | 1,044 | 11.8% |
| Satellite Internet | 811 | 9.2% |
| No Internet | 1,468 | 16.7% |
| Total | 8,810 | 100.0% |
Dawson County Summary
Dawson County is located in the state of Nebraska in the Midwestern United States. It is bordered by Buffalo County to the north, Custer County to the east, Gosper County to the south, and Phelps County to the west. The county seat is Lexington, and the largest city is Cozad. As of the 2010 census, the population was 9,962.
History
Dawson County was established in 1871 and named after Major John W. Dawson, a Civil War veteran and Nebraska politician. The county was originally part of Buffalo County, but was split off in 1871. The first settlers arrived in the area in the late 1860s, and the county was officially organized in 1871.
The county was largely agricultural in its early years, with the main crops being wheat, corn, and hay. The Union Pacific Railroad arrived in the county in 1887, and the town of Cozad was founded in 1888. The railroad brought new economic opportunities to the area, and the population began to grow.
Geography
Dawson County is located in the central part of Nebraska, and covers an area of 845 square miles. The county is mostly flat, with rolling hills in the east and south. The Platte River runs through the county, and there are several small lakes and ponds. The county is mostly rural, with the majority of the population living in small towns and villages.
The county is located in the Central Plains region of the United States, and is part of the Great Plains. The climate is semi-arid, with hot summers and cold winters. The average annual precipitation is around 20 inches.
Economy
The economy of Dawson County is largely based on agriculture. The main crops are corn, wheat, and hay. Livestock production is also important, with cattle, hogs, and sheep being raised in the county.
The county is also home to several manufacturing companies, including a furniture factory, a plastics factory, and a metal fabrication plant. The Union Pacific Railroad also runs through the county, providing transportation for goods and services.
Demographics
As of the 2010 census, the population of Dawson County was 9,962. The population is mostly white (94.2%), with small percentages of African Americans (2.2%), Native Americans (1.2%), Asians (0.7%), and other races (1.7%). The median household income is $45,845, and the median family income is $54,845. The unemployment rate is 3.2%.
Conclusion
Dawson County is a rural county located in the state of Nebraska. It is mostly agricultural, with the main crops being corn, wheat, and hay. The county is also home to several manufacturing companies, and the Union Pacific Railroad runs through the county. The population is mostly white, with a median household income of $45,845.
Common Questions
What is the Total Population of Dawson County?
Total Population of Dawson County is 24,037.
What is the Total Male Population of Dawson County?
Total Male Population of Dawson County is 12,528.
What is the Total Female Population of Dawson County?
Total Female Population of Dawson County is 11,509.
What is the Ratio of Males per 100 Females in Dawson County?
There are 108.85 Males per 100 Females in Dawson County.
What is the Ratio of Females per 100 Males in Dawson County?
There are 91.87 Females per 100 Males in Dawson County.
What is the Median Population Age in Dawson County?
Median Population Age in Dawson County is 35.9 Years.
What is the Average Family Size in Dawson County
Average Family Size in Dawson County is 3.2 People.
What is the Average Household Size in Dawson County
Average Household Size in Dawson County is 2.7 People.
What is Per Capita Income in Dawson County?
Per Capita income in Dawson County is $34,648.
What is the Median Family Income in Dawson County?
Median Family Income in Dawson County is $77,492.
What is the Median Household income in Dawson County?
Median Household Income in Dawson County is $67,462.
What is Income or Wage Gap in Dawson County?
Income or Wage Gap in Dawson County is 29.2%.
Women in Dawson County earn 70.8 cents for every dollar earned by a man.
What is Family Income Deficit in Dawson County?
Family Income Deficit in Dawson County is $10,347.
Families that are below poverty line in Dawson County earn $10,347 less on average than the poverty threshold level.
What is Inequality or Gini Index in Dawson County?
Inequality or Gini Index in Dawson County is 0.43.
How Large is the Labor Force in Dawson County?
There are 12,669 People in the Labor Forcein in Dawson County.
What is the Percentage of People in the Labor Force in Dawson County?
69.5% of People are in the Labor Force in Dawson County.
What is the Unemployment Rate in Dawson County?
Unemployment Rate in Dawson County is 2.1%.