Dakota County, NE
Dakota County Map
Dakota County Overview
21,308
TOTAL POPULATION
10,530
MALE POPULATION
10,778
FEMALE POPULATION
97.70
MALES / 100 FEMALES
102.36
FEMALES / 100 MALES
31.7
MEDIAN AGE
3.6
AVG FAMILY SIZE
2.9
AVG HOUSEHOLD SIZE
$29,584
PER CAPITA INCOME
$82,607
AVG FAMILY INCOME
$66,112
AVG HOUSEHOLD INCOME
37.8%
WAGE / INCOME GAP [ % ]
62.2¢/ $1
WAGE / INCOME GAP [ $ ]
$10,287
FAMILY INCOME DEFICIT
0.41
INEQUALITY / GINI INDEX
10,900
LABOR FORCE [ PEOPLE ]
69.9%
PERCENT IN LABOR FORCE
3.0%
UNEMPLOYMENT RATE
Dakota County Area Codes
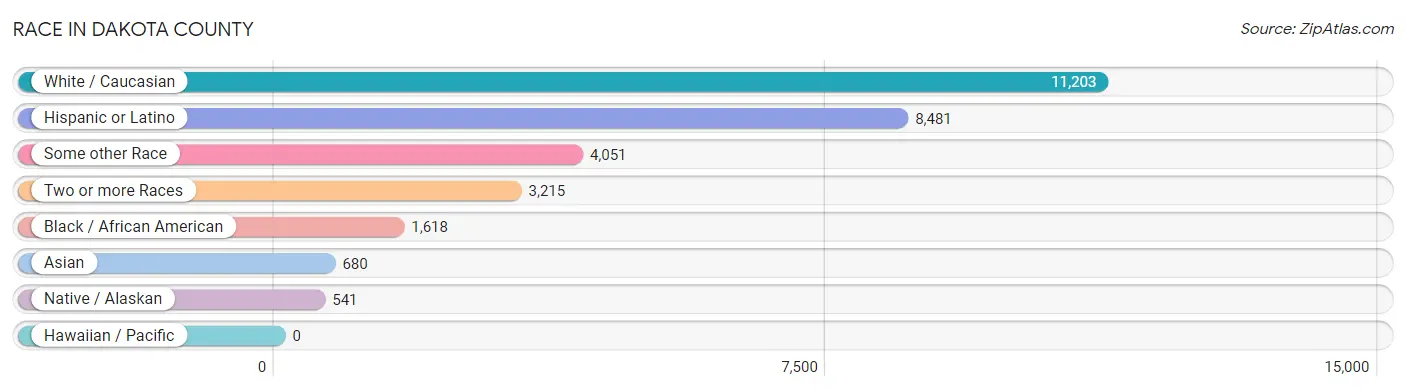
Race in Dakota County
The most populous races in Dakota County are White / Caucasian (11,203 | 52.6%), Hispanic or Latino (8,481 | 39.8%), and Some other Race (4,051 | 19.0%).
| Race | # Population | % Population |
| Asian | 680 | 3.2% |
| Black / African American | 1,618 | 7.6% |
| Hawaiian / Pacific | 0 | 0.0% |
| Hispanic or Latino | 8,481 | 39.8% |
| Native / Alaskan | 541 | 2.5% |
| White / Caucasian | 11,203 | 52.6% |
| Two or more Races | 3,215 | 15.1% |
| Some other Race | 4,051 | 19.0% |
| Total | 21,308 | 100.0% |
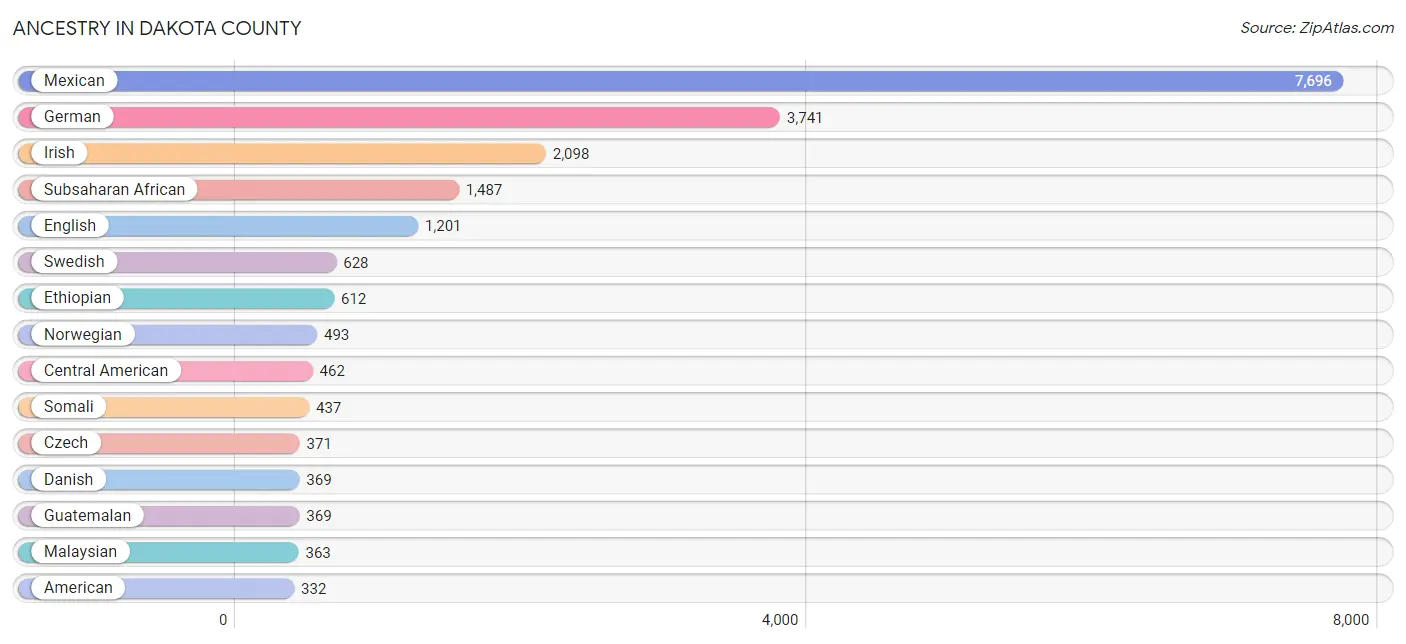
Ancestry in Dakota County
The most populous ancestries reported in Dakota County are Mexican (7,696 | 36.1%), German (3,741 | 17.6%), Irish (2,098 | 9.9%), Subsaharan African (1,487 | 7.0%), and English (1,201 | 5.6%), together accounting for 76.2% of all Dakota County residents.
| Ancestry | # Population | % Population |
| African | 185 | 0.9% |
| American | 332 | 1.6% |
| Apache | 2 | 0.0% |
| Arab | 8 | 0.0% |
| Austrian | 6 | 0.0% |
| Bangladeshi | 126 | 0.6% |
| Bhutanese | 10 | 0.1% |
| British | 83 | 0.4% |
| Burmese | 7 | 0.0% |
| Central American | 462 | 2.2% |
| Central American Indian | 7 | 0.0% |
| Choctaw | 4 | 0.0% |
| Czech | 371 | 1.7% |
| Czechoslovakian | 33 | 0.2% |
| Danish | 369 | 1.7% |
| Dutch | 320 | 1.5% |
| English | 1,201 | 5.6% |
| Estonian | 5 | 0.0% |
| Ethiopian | 612 | 2.9% |
| European | 117 | 0.5% |
| French | 227 | 1.1% |
| French Canadian | 83 | 0.4% |
| German | 3,741 | 17.6% |
| Guatemalan | 369 | 1.7% |
| Hungarian | 6 | 0.0% |
| Icelander | 2 | 0.0% |
| Indian (Asian) | 124 | 0.6% |
| Indonesian | 62 | 0.3% |
| Irish | 2,098 | 9.9% |
| Italian | 208 | 1.0% |
| Korean | 66 | 0.3% |
| Lebanese | 8 | 0.0% |
| Luxembourger | 3 | 0.0% |
| Malaysian | 363 | 1.7% |
| Mexican | 7,696 | 36.1% |
| Mexican American Indian | 29 | 0.1% |
| Navajo | 127 | 0.6% |
| Northern European | 11 | 0.1% |
| Norwegian | 493 | 2.3% |
| Pakistani | 5 | 0.0% |
| Polish | 94 | 0.4% |
| Portuguese | 7 | 0.0% |
| Puerto Rican | 177 | 0.8% |
| Russian | 106 | 0.5% |
| Salvadoran | 93 | 0.4% |
| Scandinavian | 45 | 0.2% |
| Scotch-Irish | 90 | 0.4% |
| Scottish | 136 | 0.6% |
| Sioux | 187 | 0.9% |
| Slovak | 28 | 0.1% |
| Somali | 437 | 2.1% |
| Spaniard | 1 | 0.0% |
| Spanish | 88 | 0.4% |
| Subsaharan African | 1,487 | 7.0% |
| Sudanese | 44 | 0.2% |
| Swedish | 628 | 2.9% |
| Swiss | 38 | 0.2% |
| Thai | 31 | 0.2% |
| Welsh | 82 | 0.4% | View All 59 Rows |
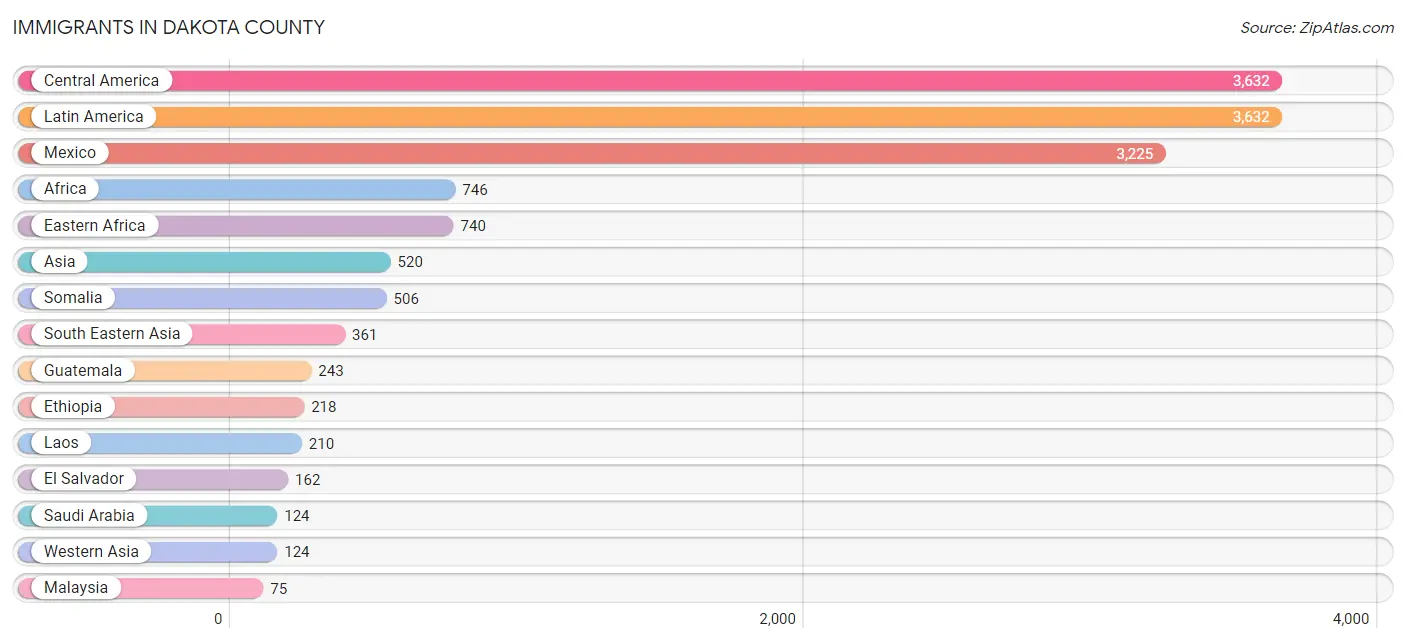
Immigrants in Dakota County
The most numerous immigrant groups reported in Dakota County came from Central America (3,632 | 17.1%), Latin America (3,632 | 17.1%), Mexico (3,225 | 15.1%), Africa (746 | 3.5%), and Eastern Africa (740 | 3.5%), together accounting for 56.2% of all Dakota County residents.
| Immigration Origin | # Population | % Population |
| Africa | 746 | 3.5% |
| Asia | 520 | 2.4% |
| Canada | 7 | 0.0% |
| Central America | 3,632 | 17.1% |
| China | 10 | 0.1% |
| Eastern Africa | 740 | 3.5% |
| Eastern Asia | 13 | 0.1% |
| Eastern Europe | 28 | 0.1% |
| El Salvador | 162 | 0.8% |
| Ethiopia | 218 | 1.0% |
| Europe | 39 | 0.2% |
| Germany | 11 | 0.1% |
| Guatemala | 243 | 1.1% |
| India | 22 | 0.1% |
| Korea | 3 | 0.0% |
| Laos | 210 | 1.0% |
| Latin America | 3,632 | 17.1% |
| Malaysia | 75 | 0.4% |
| Mexico | 3,225 | 15.1% |
| Northern Africa | 6 | 0.0% |
| Panama | 2 | 0.0% |
| Saudi Arabia | 124 | 0.6% |
| Serbia | 28 | 0.1% |
| Somalia | 506 | 2.4% |
| South Central Asia | 22 | 0.1% |
| South Eastern Asia | 361 | 1.7% |
| Sudan | 6 | 0.0% |
| Thailand | 46 | 0.2% |
| Western Asia | 124 | 0.6% |
| Western Europe | 11 | 0.1% | View All 30 Rows |
Sex and Age in Dakota County
Sex and Age in Dakota County
The most populous age groups in Dakota County are 10 to 14 Years (972 | 9.2%) for men and 15 to 19 Years (951 | 8.8%) for women.
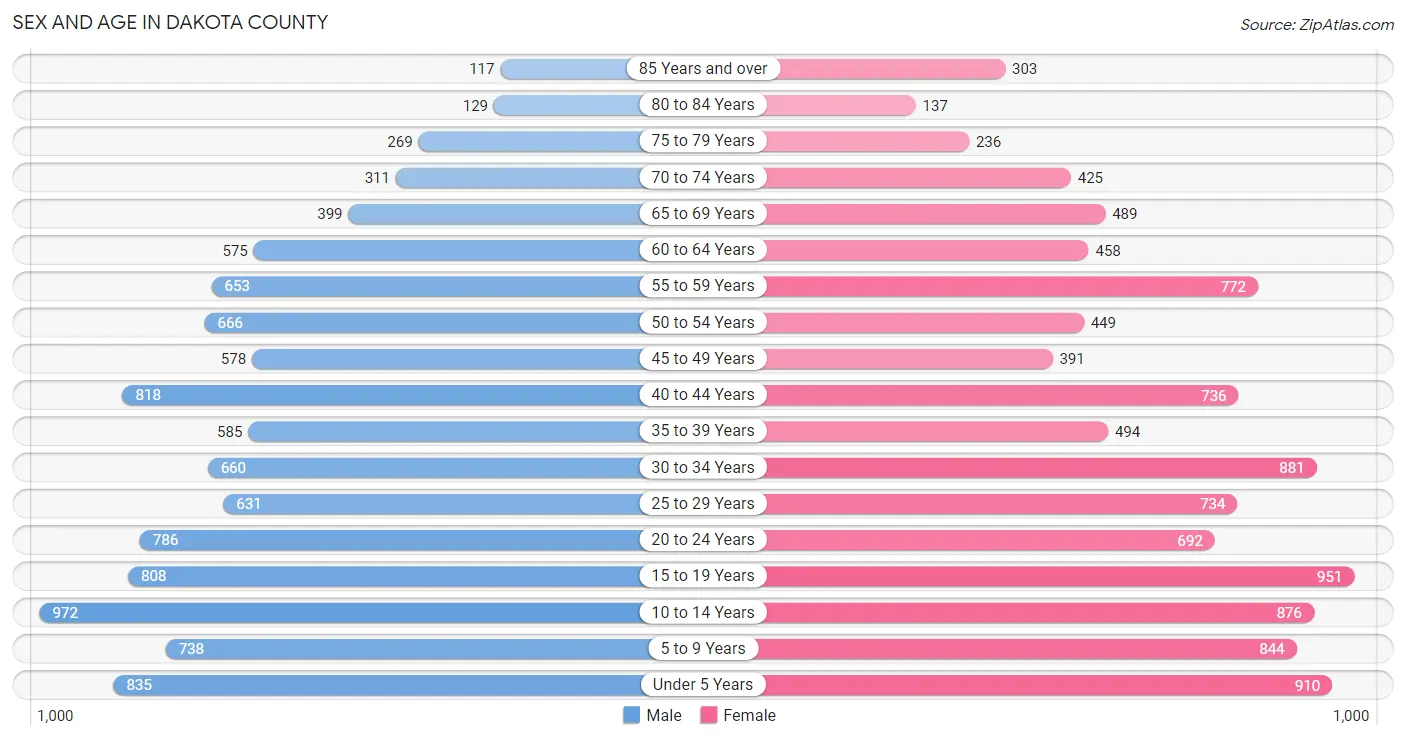
| Age Bracket | Male | Female |
| Under 5 Years | 835 (7.9%) | 910 (8.4%) |
| 5 to 9 Years | 738 (7.0%) | 844 (7.8%) |
| 10 to 14 Years | 972 (9.2%) | 876 (8.1%) |
| 15 to 19 Years | 808 (7.7%) | 951 (8.8%) |
| 20 to 24 Years | 786 (7.5%) | 692 (6.4%) |
| 25 to 29 Years | 631 (6.0%) | 734 (6.8%) |
| 30 to 34 Years | 660 (6.3%) | 881 (8.2%) |
| 35 to 39 Years | 585 (5.6%) | 494 (4.6%) |
| 40 to 44 Years | 818 (7.8%) | 736 (6.8%) |
| 45 to 49 Years | 578 (5.5%) | 391 (3.6%) |
| 50 to 54 Years | 666 (6.3%) | 449 (4.2%) |
| 55 to 59 Years | 653 (6.2%) | 772 (7.2%) |
| 60 to 64 Years | 575 (5.5%) | 458 (4.3%) |
| 65 to 69 Years | 399 (3.8%) | 489 (4.5%) |
| 70 to 74 Years | 311 (2.9%) | 425 (3.9%) |
| 75 to 79 Years | 269 (2.5%) | 236 (2.2%) |
| 80 to 84 Years | 129 (1.2%) | 137 (1.3%) |
| 85 Years and over | 117 (1.1%) | 303 (2.8%) |
| Total | 10,530 (100.0%) | 10,778 (100.0%) |
Families and Households in Dakota County
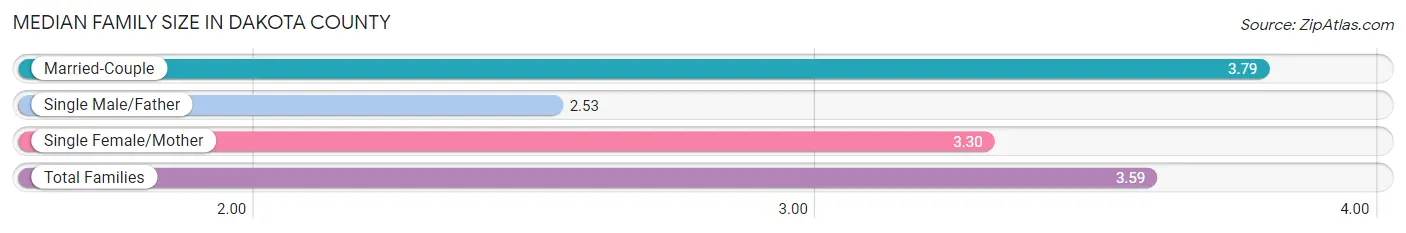
Median Family Size in Dakota County
The median family size in Dakota County is 3.59 persons per family, with married-couple families (3,669 | 75.4%) accounting for the largest median family size of 3.79 persons per family. On the other hand, single male/father families (502 | 10.3%) represent the smallest median family size with 2.53 persons per family.
| Family Type | # Families | Family Size |
| Married-Couple | 3,669 (75.4%) | 3.79 |
| Single Male/Father | 502 (10.3%) | 2.53 |
| Single Female/Mother | 694 (14.3%) | 3.30 |
| Total Families | 4,865 (100.0%) | 3.59 |
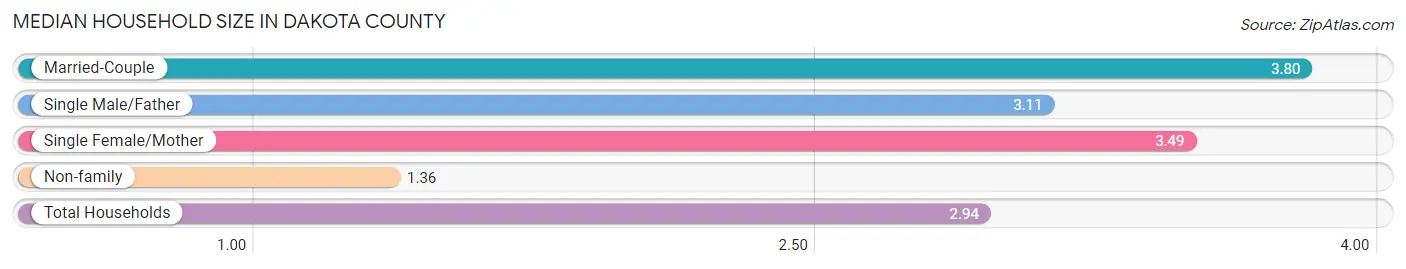
Median Household Size in Dakota County
The median household size in Dakota County is 2.94 persons per household, with married-couple households (3,669 | 51.1%) accounting for the largest median household size of 3.8 persons per household. non-family households (2,316 | 32.3%) represent the smallest median household size with 1.36 persons per household.
| Household Type | # Households | Household Size |
| Married-Couple | 3,669 (51.1%) | 3.80 |
| Single Male/Father | 502 (7.0%) | 3.11 |
| Single Female/Mother | 694 (9.7%) | 3.49 |
| Non-family | 2,316 (32.3%) | 1.36 |
| Total Households | 7,181 (100.0%) | 2.94 |
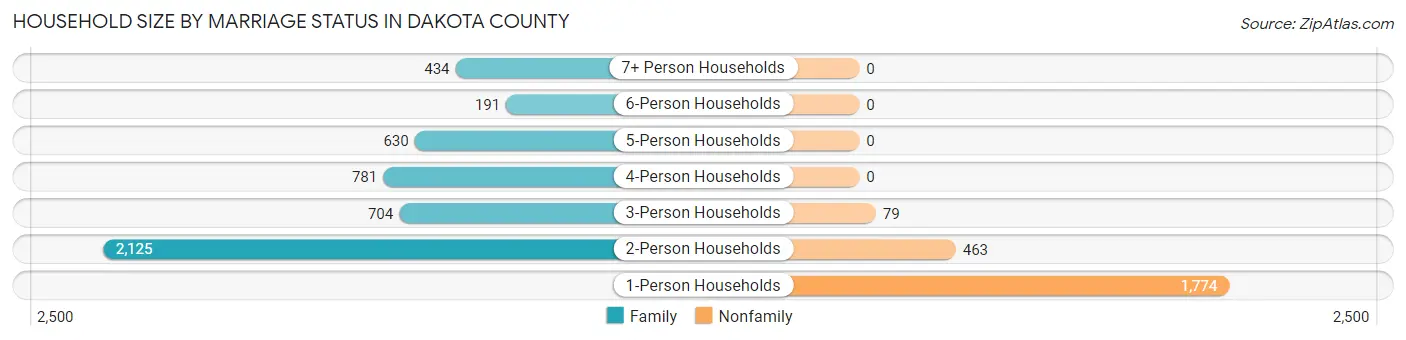
Household Size by Marriage Status in Dakota County
Out of a total of 7,181 households in Dakota County, 4,865 (67.7%) are family households, while 2,316 (32.3%) are nonfamily households. The most numerous type of family households are 2-person households, comprising 2,125, and the most common type of nonfamily households are 1-person households, comprising 1,774.
| Household Size | Family Households | Nonfamily Households |
| 1-Person Households | - | 1,774 (24.7%) |
| 2-Person Households | 2,125 (29.6%) | 463 (6.5%) |
| 3-Person Households | 704 (9.8%) | 79 (1.1%) |
| 4-Person Households | 781 (10.9%) | 0 (0.0%) |
| 5-Person Households | 630 (8.8%) | 0 (0.0%) |
| 6-Person Households | 191 (2.7%) | 0 (0.0%) |
| 7+ Person Households | 434 (6.0%) | 0 (0.0%) |
| Total | 4,865 (67.7%) | 2,316 (32.3%) |
Female Fertility in Dakota County
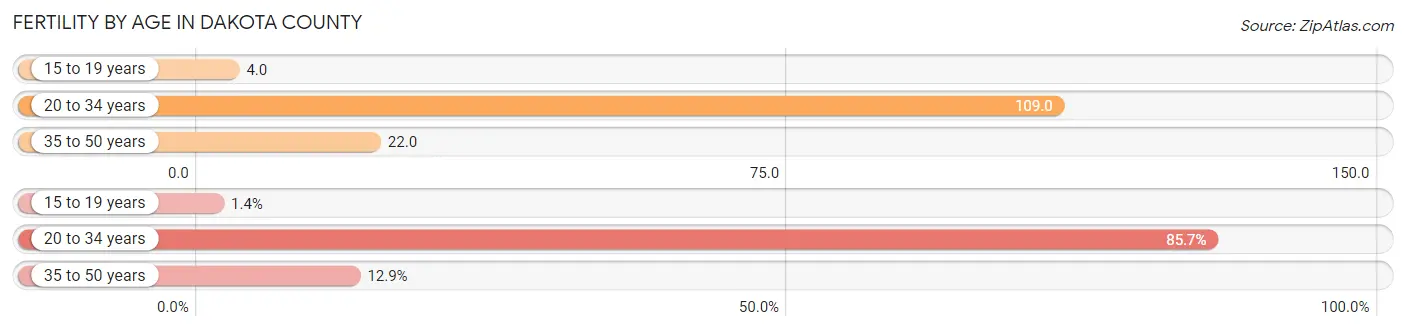
Fertility by Age in Dakota County
Average fertility rate in Dakota County is 59.0 births per 1,000 women. Women in the age bracket of 20 to 34 years have the highest fertility rate with 109.0 births per 1,000 women. Women in the age bracket of 20 to 34 years acount for 85.7% of all women with births.
| Age Bracket | Women with Births | Births / 1,000 Women |
| 15 to 19 years | 4 (1.4%) | 4.0 |
| 20 to 34 years | 252 (85.7%) | 109.0 |
| 35 to 50 years | 38 (12.9%) | 22.0 |
| Total | 294 (100.0%) | 59.0 |
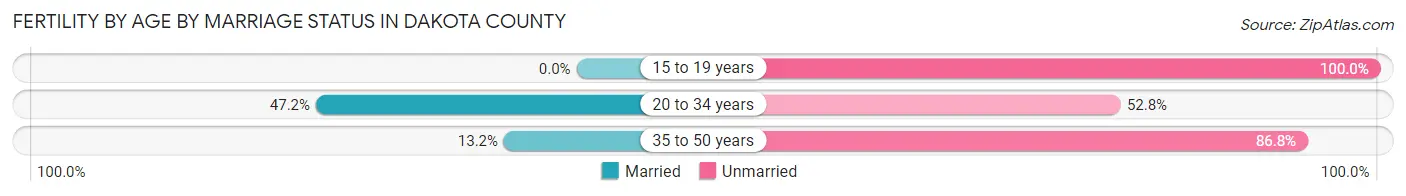
Fertility by Age by Marriage Status in Dakota County
42.2% of women with births (294) in Dakota County are married. The highest percentage of unmarried women with births falls into 15 to 19 years age bracket with 100.0% of them unmarried at the time of birth, while the lowest percentage of unmarried women with births belong to 20 to 34 years age bracket with 52.8% of them unmarried.
| Age Bracket | Married | Unmarried |
| 15 to 19 years | 0 (0.0%) | 4 (100.0%) |
| 20 to 34 years | 119 (47.2%) | 133 (52.8%) |
| 35 to 50 years | 5 (13.2%) | 33 (86.8%) |
| Total | 124 (42.2%) | 170 (57.8%) |
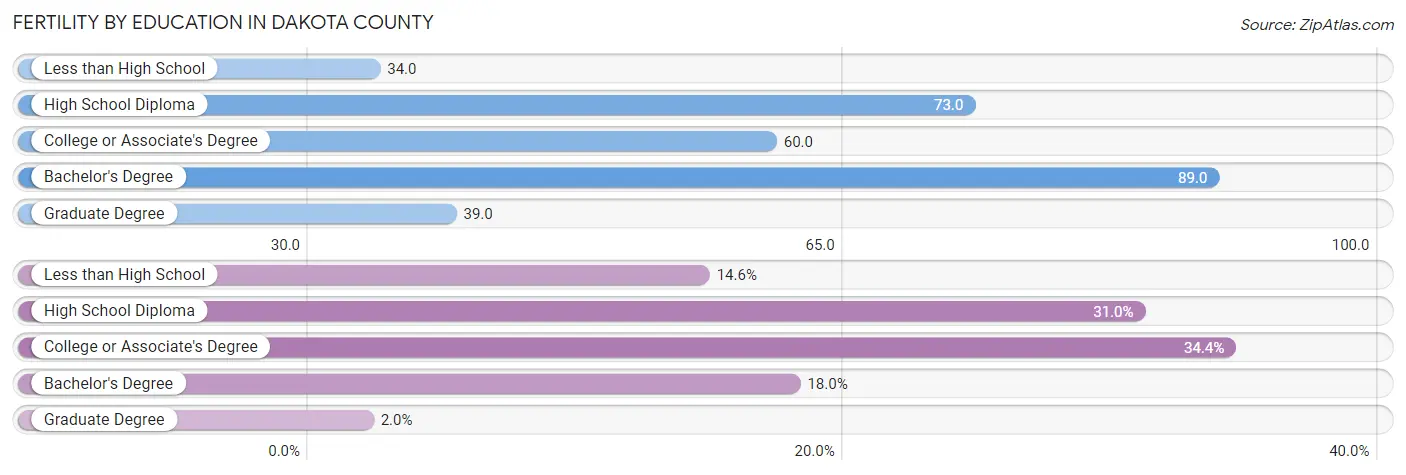
Fertility by Education in Dakota County
Average fertility rate in Dakota County is 59.0 births per 1,000 women. Women with the education attainment of bachelor's degree have the highest fertility rate of 89.0 births per 1,000 women, while women with the education attainment of less than high school have the lowest fertility at 34.0 births per 1,000 women. Women with the education attainment of college or associate's degree represent 34.4% of all women with births.
| Educational Attainment | Women with Births | Births / 1,000 Women |
| Less than High School | 43 (14.6%) | 34.0 |
| High School Diploma | 91 (30.9%) | 73.0 |
| College or Associate's Degree | 101 (34.4%) | 60.0 |
| Bachelor's Degree | 53 (18.0%) | 89.0 |
| Graduate Degree | 6 (2.0%) | 39.0 |
| Total | 294 (100.0%) | 59.0 |
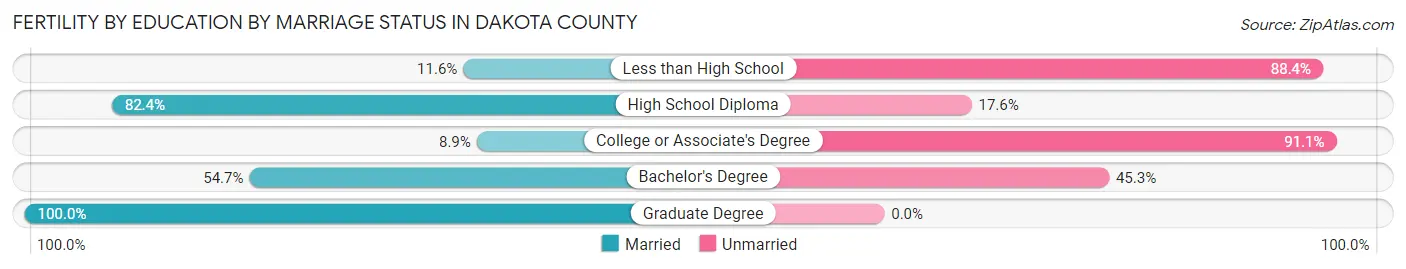
Fertility by Education by Marriage Status in Dakota County
57.8% of women with births in Dakota County are unmarried. Women with the educational attainment of graduate degree are most likely to be married with 100.0% of them married at childbirth, while women with the educational attainment of college or associate's degree are least likely to be married with 91.1% of them unmarried at childbirth.
| Educational Attainment | Married | Unmarried |
| Less than High School | 5 (11.6%) | 38 (88.4%) |
| High School Diploma | 75 (82.4%) | 16 (17.6%) |
| College or Associate's Degree | 9 (8.9%) | 92 (91.1%) |
| Bachelor's Degree | 29 (54.7%) | 24 (45.3%) |
| Graduate Degree | 6 (100.0%) | 0 (0.0%) |
| Total | 124 (42.2%) | 170 (57.8%) |
Income in Dakota County
Income Overview in Dakota County
Per Capita Income in Dakota County is $29,584, while median incomes of families and households are $82,607 and $66,112 respectively.
| Characteristic | Number | Measure |
| Per Capita Income | 21,308 | $29,584 |
| Median Family Income | 4,865 | $82,607 |
| Mean Family Income | 4,865 | $100,451 |
| Median Household Income | 7,181 | $66,112 |
| Mean Household Income | 7,181 | $85,101 |
| Income Deficit | 4,865 | $10,287 |
| Wage / Income Gap (%) | 21,308 | 37.81% |
| Wage / Income Gap ($) | 21,308 | 62.19¢ per $1 |
| Gini / Inequality Index | 21,308 | 0.41 |
Earnings by Sex in Dakota County
Average Earnings in Dakota County are $38,708, $45,834 for men and $28,505 for women, a difference of 37.8%.
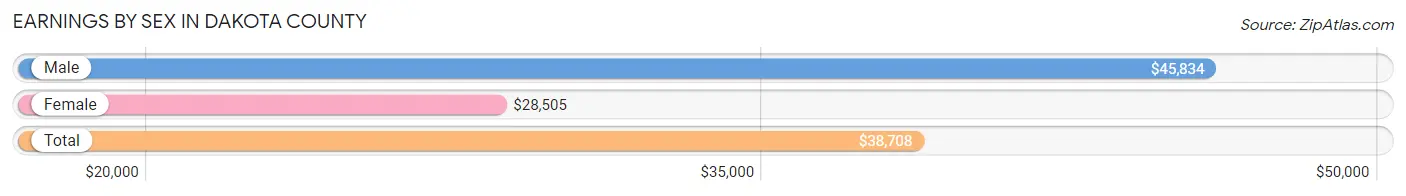
| Sex | Number | Average Earnings |
| Male | 6,173 (54.8%) | $45,834 |
| Female | 5,095 (45.2%) | $28,505 |
| Total | 11,268 (100.0%) | $38,708 |
Earnings by Sex by Income Bracket in Dakota County
The most common earnings brackets in Dakota County are $55,000 to $64,999 for men (712 | 11.5%) and $25,000 to $29,999 for women (583 | 11.4%).
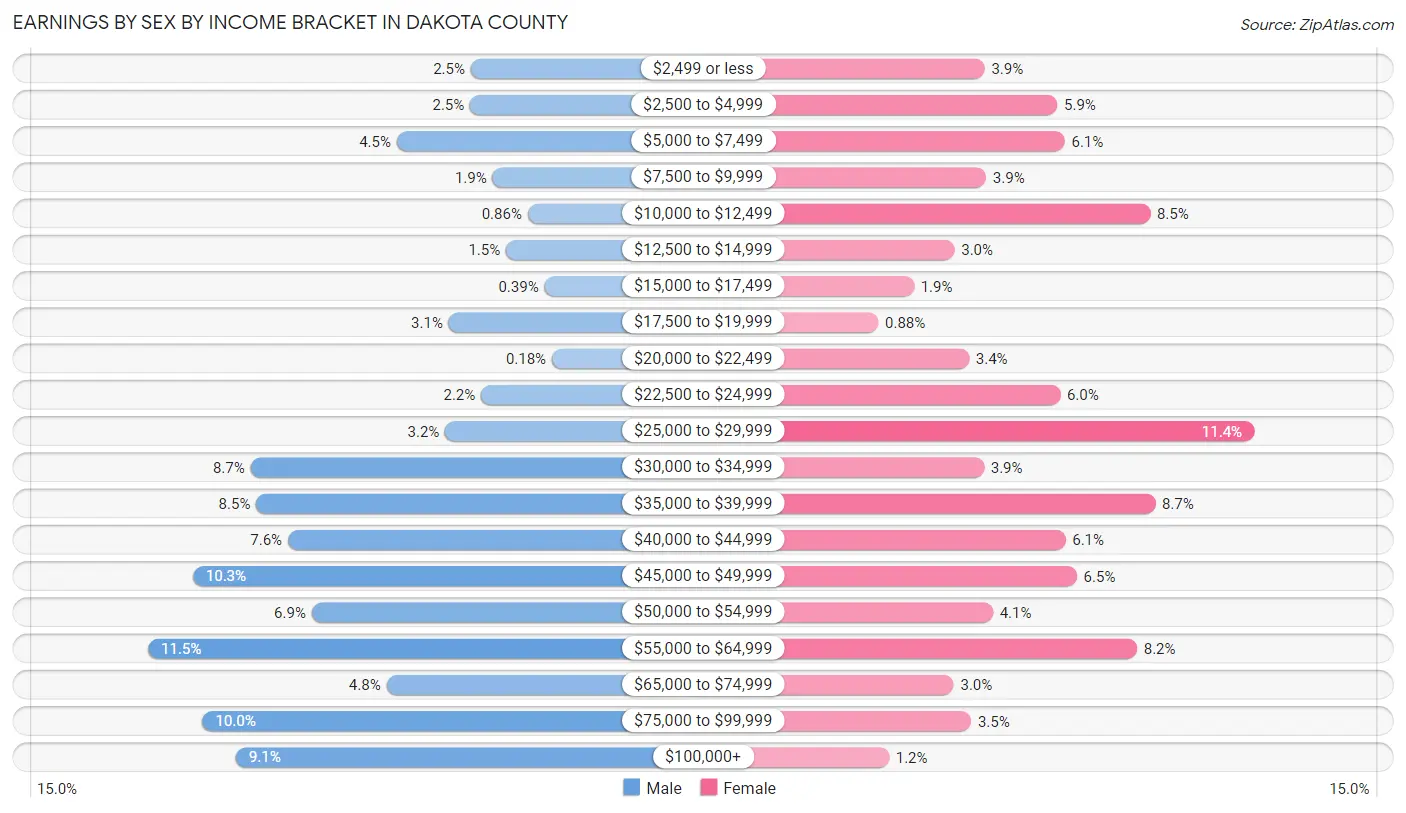
| Income | Male | Female |
| $2,499 or less | 152 (2.5%) | 197 (3.9%) |
| $2,500 to $4,999 | 153 (2.5%) | 301 (5.9%) |
| $5,000 to $7,499 | 280 (4.5%) | 312 (6.1%) |
| $7,500 to $9,999 | 114 (1.8%) | 199 (3.9%) |
| $10,000 to $12,499 | 53 (0.9%) | 434 (8.5%) |
| $12,500 to $14,999 | 91 (1.5%) | 154 (3.0%) |
| $15,000 to $17,499 | 24 (0.4%) | 96 (1.9%) |
| $17,500 to $19,999 | 190 (3.1%) | 45 (0.9%) |
| $20,000 to $22,499 | 11 (0.2%) | 175 (3.4%) |
| $22,500 to $24,999 | 134 (2.2%) | 305 (6.0%) |
| $25,000 to $29,999 | 196 (3.2%) | 583 (11.4%) |
| $30,000 to $34,999 | 534 (8.6%) | 196 (3.8%) |
| $35,000 to $39,999 | 524 (8.5%) | 441 (8.7%) |
| $40,000 to $44,999 | 469 (7.6%) | 313 (6.1%) |
| $45,000 to $49,999 | 634 (10.3%) | 329 (6.5%) |
| $50,000 to $54,999 | 428 (6.9%) | 209 (4.1%) |
| $55,000 to $64,999 | 712 (11.5%) | 415 (8.2%) |
| $65,000 to $74,999 | 298 (4.8%) | 153 (3.0%) |
| $75,000 to $99,999 | 617 (10.0%) | 178 (3.5%) |
| $100,000+ | 559 (9.1%) | 60 (1.2%) |
| Total | 6,173 (100.0%) | 5,095 (100.0%) |
Earnings by Sex by Educational Attainment in Dakota County
Average earnings in Dakota County are $47,936 for men and $31,460 for women, a difference of 34.4%. Men with an educational attainment of bachelor's degree enjoy the highest average annual earnings of $71,250, while those with college or associate's degree education earn the least with $41,590. Women with an educational attainment of graduate degree earn the most with the average annual earnings of $76,685, while those with high school diploma education have the smallest earnings of $22,844.
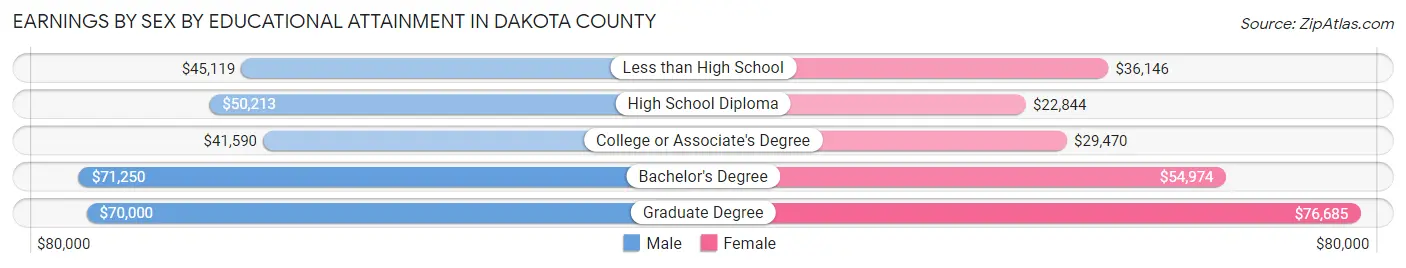
| Educational Attainment | Male Income | Female Income |
| Less than High School | $45,119 | $36,146 |
| High School Diploma | $50,213 | $22,844 |
| College or Associate's Degree | $41,590 | $29,470 |
| Bachelor's Degree | $71,250 | $54,974 |
| Graduate Degree | $70,000 | $76,685 |
| Total | $47,936 | $31,460 |
Family Income in Dakota County
Family Income Brackets in Dakota County
According to the Dakota County family income data, there are 1,250 families falling into the $100,000 to $149,999 income range, which is the most common income bracket and makes up 25.7% of all families. Conversely, the less than $10,000 income bracket is the least frequent group with only 39 families (0.8%) belonging to this category.
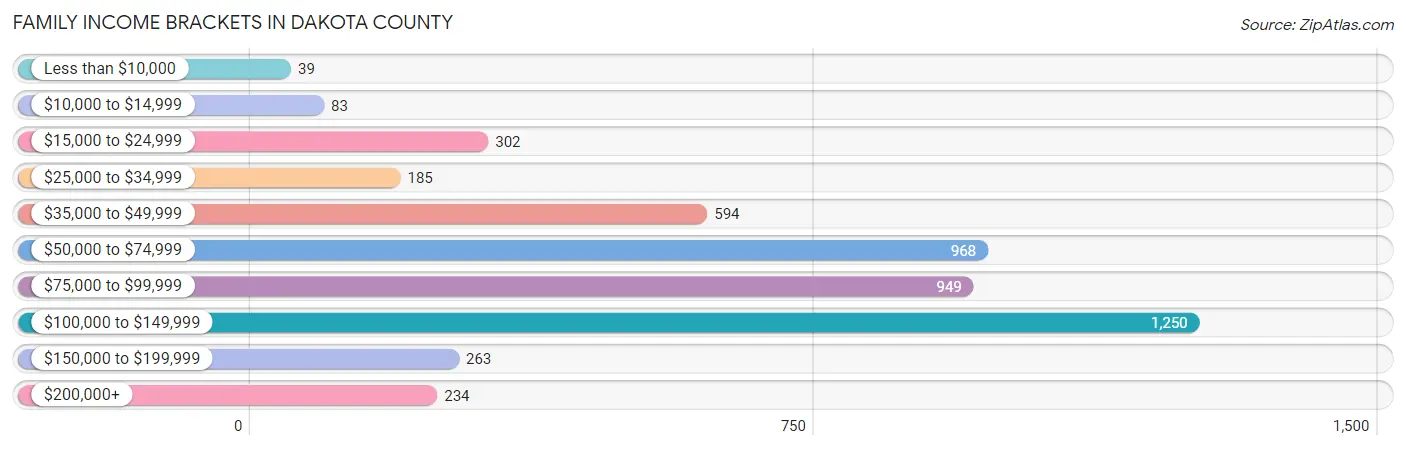
| Income Bracket | # Families | % Families |
| Less than $10,000 | 39 | 0.8% |
| $10,000 to $14,999 | 83 | 1.7% |
| $15,000 to $24,999 | 302 | 6.2% |
| $25,000 to $34,999 | 185 | 3.8% |
| $35,000 to $49,999 | 594 | 12.2% |
| $50,000 to $74,999 | 968 | 19.9% |
| $75,000 to $99,999 | 949 | 19.5% |
| $100,000 to $149,999 | 1,250 | 25.7% |
| $150,000 to $199,999 | 263 | 5.4% |
| $200,000+ | 234 | 4.8% |
Family Income by Famaliy Size in Dakota County
7+ person families (390 | 8.0%) account for the highest median family income in Dakota County with $98,333 per family, while 2-person families (2,268 | 46.6%) have the highest median income of $40,972 per family member.
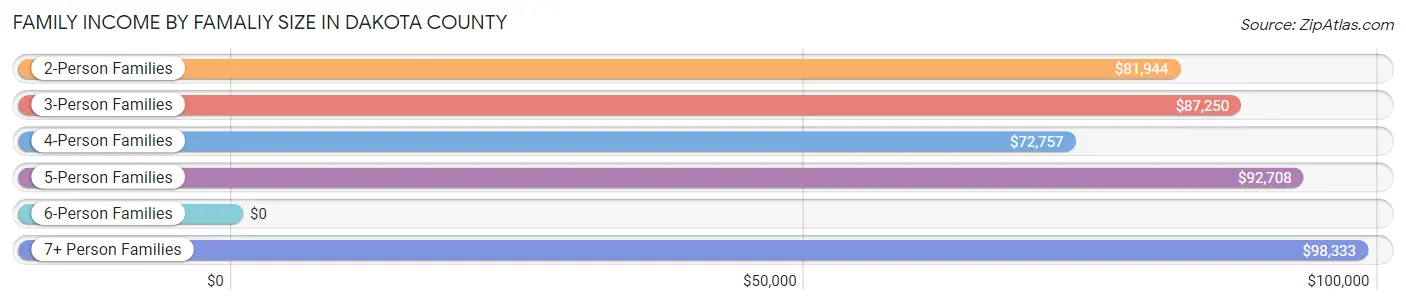
| Income Bracket | # Families | Median Income |
| 2-Person Families | 2,268 (46.6%) | $81,944 |
| 3-Person Families | 663 (13.6%) | $87,250 |
| 4-Person Families | 795 (16.3%) | $72,757 |
| 5-Person Families | 541 (11.1%) | $92,708 |
| 6-Person Families | 208 (4.3%) | $0 |
| 7+ Person Families | 390 (8.0%) | $98,333 |
| Total | 4,865 (100.0%) | $82,607 |
Family Income by Number of Earners in Dakota County
The median family income in Dakota County is $82,607, with families comprising 3+ earners (729) having the highest median family income of $126,074, while families with 1 earner (1,458) have the lowest median family income of $47,156, accounting for 15.0% and 30.0% of families, respectively.
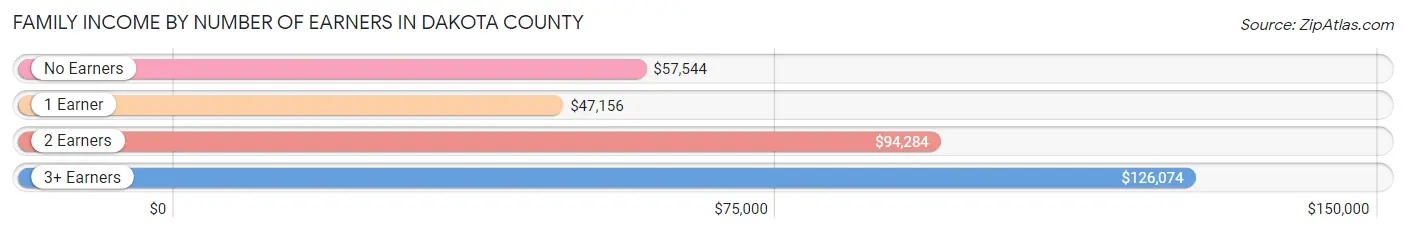
| Number of Earners | # Families | Median Income |
| No Earners | 499 (10.3%) | $57,544 |
| 1 Earner | 1,458 (30.0%) | $47,156 |
| 2 Earners | 2,179 (44.8%) | $94,284 |
| 3+ Earners | 729 (15.0%) | $126,074 |
| Total | 4,865 (100.0%) | $82,607 |
Household Income in Dakota County
Household Income Brackets in Dakota County
With 1,436 households falling in the category, the $100,000 to $149,999 income range is the most frequent in Dakota County, accounting for 20.0% of all households. In contrast, only 165 households (2.3%) fall into the less than $10,000 income bracket, making it the least populous group.
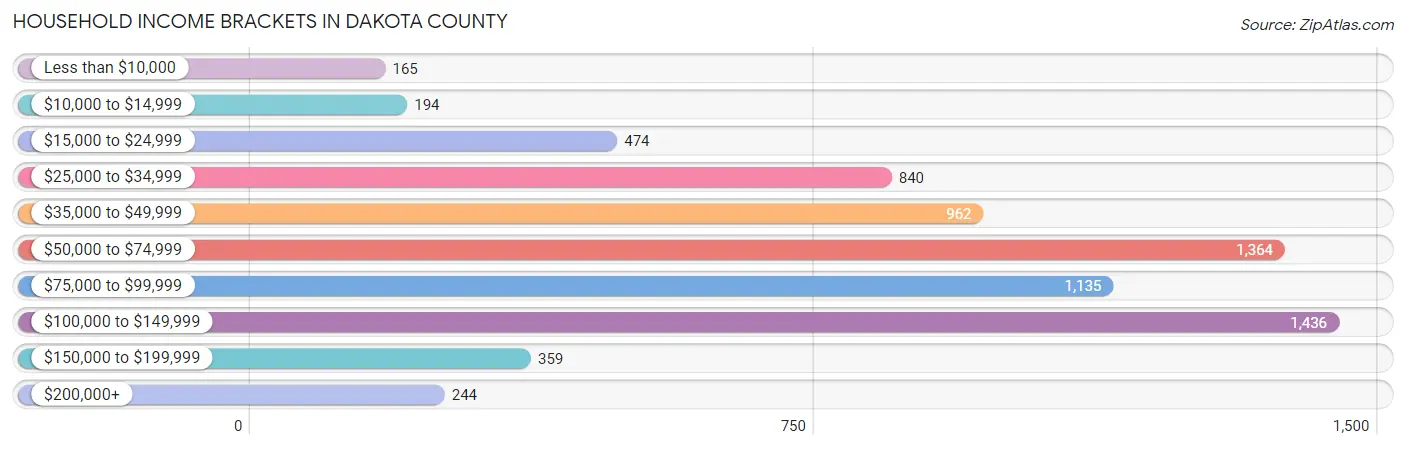
| Income Bracket | # Households | % Households |
| Less than $10,000 | 165 | 2.3% |
| $10,000 to $14,999 | 194 | 2.7% |
| $15,000 to $24,999 | 474 | 6.6% |
| $25,000 to $34,999 | 840 | 11.7% |
| $35,000 to $49,999 | 962 | 13.4% |
| $50,000 to $74,999 | 1,364 | 19.0% |
| $75,000 to $99,999 | 1,135 | 15.8% |
| $100,000 to $149,999 | 1,436 | 20.0% |
| $150,000 to $199,999 | 359 | 5.0% |
| $200,000+ | 244 | 3.4% |
Household Income by Householder Age in Dakota County
The median household income in Dakota County is $66,112, with the highest median household income of $82,687 found in the 15 to 24 years age bracket for the primary householder. A total of 380 households (5.3%) fall into this category. Meanwhile, the 65+ years age bracket for the primary householder has the lowest median household income of $46,027, with 1,633 households (22.7%) in this group.
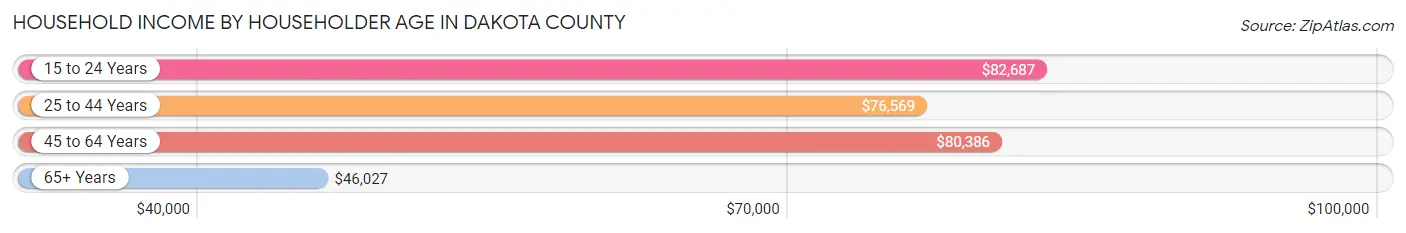
| Income Bracket | # Households | Median Income |
| 15 to 24 Years | 380 (5.3%) | $82,687 |
| 25 to 44 Years | 2,505 (34.9%) | $76,569 |
| 45 to 64 Years | 2,663 (37.1%) | $80,386 |
| 65+ Years | 1,633 (22.7%) | $46,027 |
| Total | 7,181 (100.0%) | $66,112 |
Poverty in Dakota County
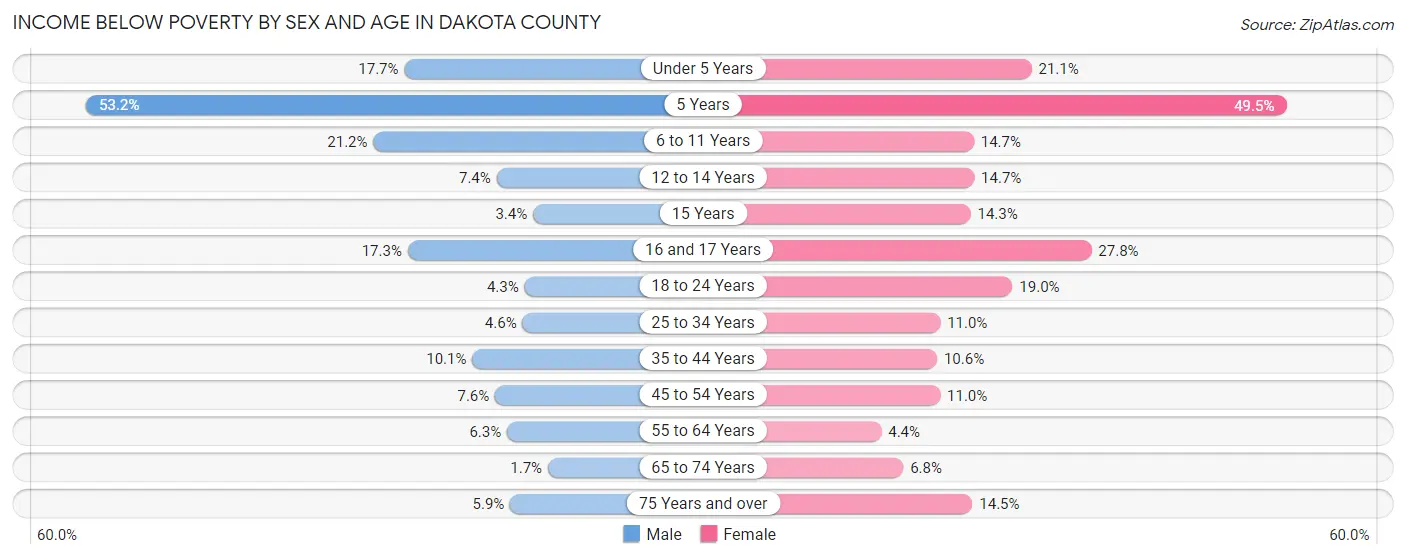
Income Below Poverty by Sex and Age in Dakota County
With 8.9% poverty level for males and 13.4% for females among the residents of Dakota County, 5 year old males and 5 year old females are the most vulnerable to poverty, with 42 males (53.2%) and 98 females (49.5%) in their respective age groups living below the poverty level.
| Age Bracket | Male | Female |
| Under 5 Years | 147 (17.7%) | 183 (21.1%) |
| 5 Years | 42 (53.2%) | 98 (49.5%) |
| 6 to 11 Years | 175 (21.2%) | 128 (14.7%) |
| 12 to 14 Years | 59 (7.4%) | 92 (14.7%) |
| 15 Years | 9 (3.4%) | 39 (14.3%) |
| 16 and 17 Years | 39 (17.3%) | 72 (27.8%) |
| 18 to 24 Years | 47 (4.3%) | 210 (19.0%) |
| 25 to 34 Years | 58 (4.5%) | 177 (11.0%) |
| 35 to 44 Years | 140 (10.1%) | 130 (10.6%) |
| 45 to 54 Years | 94 (7.6%) | 92 (11.0%) |
| 55 to 64 Years | 76 (6.3%) | 54 (4.4%) |
| 65 to 74 Years | 12 (1.7%) | 62 (6.8%) |
| 75 Years and over | 29 (5.9%) | 90 (14.5%) |
| Total | 927 (8.9%) | 1,427 (13.4%) |
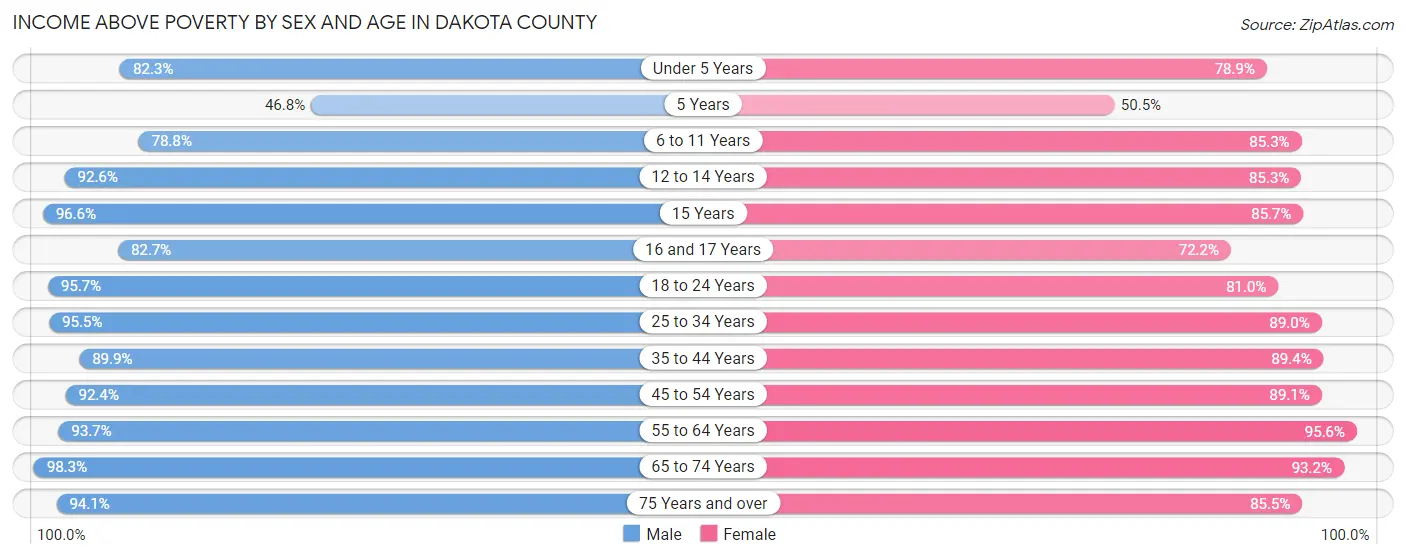
Income Above Poverty by Sex and Age in Dakota County
According to the poverty statistics in Dakota County, males aged 65 to 74 years and females aged 55 to 64 years are the age groups that are most secure financially, with 98.3% of males and 95.6% of females in these age groups living above the poverty line.
| Age Bracket | Male | Female |
| Under 5 Years | 683 (82.3%) | 683 (78.9%) |
| 5 Years | 37 (46.8%) | 100 (50.5%) |
| 6 to 11 Years | 652 (78.8%) | 743 (85.3%) |
| 12 to 14 Years | 735 (92.6%) | 532 (85.3%) |
| 15 Years | 258 (96.6%) | 233 (85.7%) |
| 16 and 17 Years | 186 (82.7%) | 187 (72.2%) |
| 18 to 24 Years | 1,041 (95.7%) | 895 (81.0%) |
| 25 to 34 Years | 1,217 (95.5%) | 1,438 (89.0%) |
| 35 to 44 Years | 1,241 (89.9%) | 1,096 (89.4%) |
| 45 to 54 Years | 1,143 (92.4%) | 748 (89.0%) |
| 55 to 64 Years | 1,136 (93.7%) | 1,173 (95.6%) |
| 65 to 74 Years | 684 (98.3%) | 844 (93.2%) |
| 75 Years and over | 461 (94.1%) | 529 (85.5%) |
| Total | 9,474 (91.1%) | 9,201 (86.6%) |
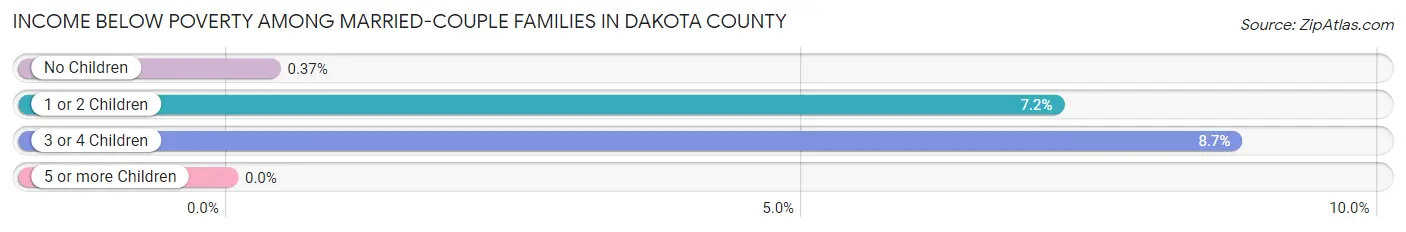
Income Below Poverty Among Married-Couple Families in Dakota County
The poverty statistics for married-couple families in Dakota County show that 3.7% or 135 of the total 3,669 families live below the poverty line. Families with 3 or 4 children have the highest poverty rate of 8.7%, comprising of 47 families. On the other hand, families with 5 or more children have the lowest poverty rate of 0.0%, which includes 0 families.
| Children | Above Poverty | Below Poverty |
| No Children | 1,861 (99.6%) | 7 (0.4%) |
| 1 or 2 Children | 1,046 (92.8%) | 81 (7.2%) |
| 3 or 4 Children | 491 (91.3%) | 47 (8.7%) |
| 5 or more Children | 136 (100.0%) | 0 (0.0%) |
| Total | 3,534 (96.3%) | 135 (3.7%) |
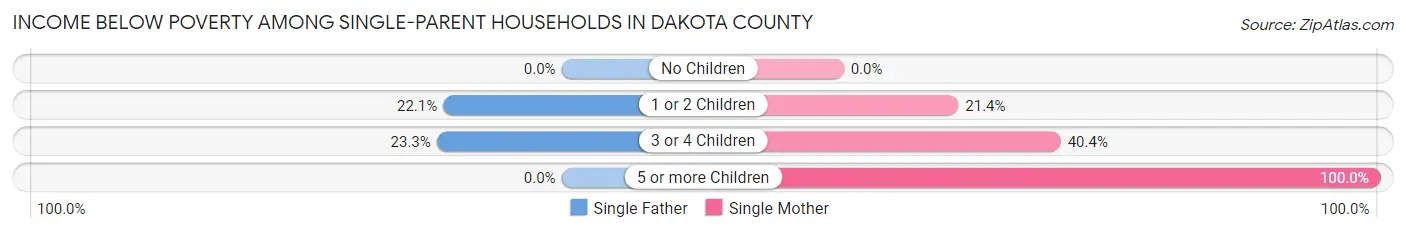
Income Below Poverty Among Single-Parent Households in Dakota County
According to the poverty data in Dakota County, 16.3% or 82 single-father households and 21.0% or 146 single-mother households are living below the poverty line. Among single-father households, those with 3 or 4 children have the highest poverty rate, with 20 households (23.3%) experiencing poverty. Likewise, among single-mother households, those with 5 or more children have the highest poverty rate, with 36 households (100.0%) falling below the poverty line.
| Children | Single Father | Single Mother |
| No Children | 0 (0.0%) | 0 (0.0%) |
| 1 or 2 Children | 62 (22.1%) | 72 (21.4%) |
| 3 or 4 Children | 20 (23.3%) | 38 (40.4%) |
| 5 or more Children | 0 (0.0%) | 36 (100.0%) |
| Total | 82 (16.3%) | 146 (21.0%) |
Income Below Poverty Among Married-Couple vs Single-Parent Households in Dakota County
The poverty data for Dakota County shows that 135 of the married-couple family households (3.7%) and 228 of the single-parent households (19.1%) are living below the poverty level. Within the married-couple family households, those with 3 or 4 children have the highest poverty rate, with 47 households (8.7%) falling below the poverty line. Among the single-parent households, those with 5 or more children have the highest poverty rate, with 36 household (100.0%) living below poverty.
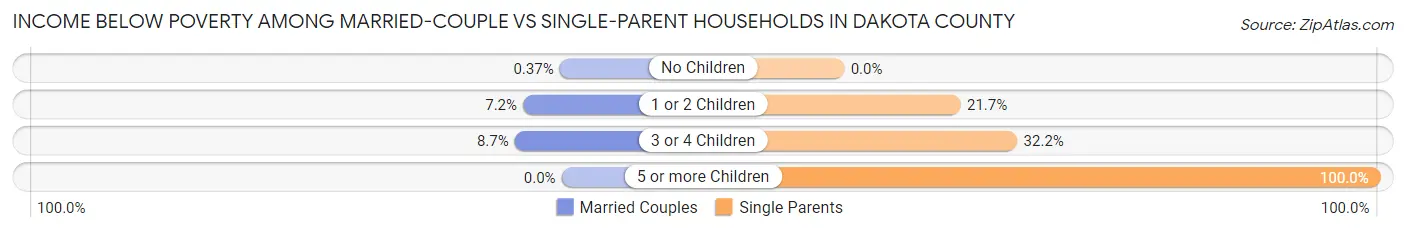
| Children | Married-Couple Families | Single-Parent Households |
| No Children | 7 (0.4%) | 0 (0.0%) |
| 1 or 2 Children | 81 (7.2%) | 134 (21.7%) |
| 3 or 4 Children | 47 (8.7%) | 58 (32.2%) |
| 5 or more Children | 0 (0.0%) | 36 (100.0%) |
| Total | 135 (3.7%) | 228 (19.1%) |
Employment Characteristics in Dakota County
Employment by Class of Employer in Dakota County
Among the 10,396 employed individuals in Dakota County, private company employees (8,113 | 78.0%), self-employed (not incorporated) (645 | 6.2%), and local government employees (623 | 6.0%) make up the most common classes of employment.
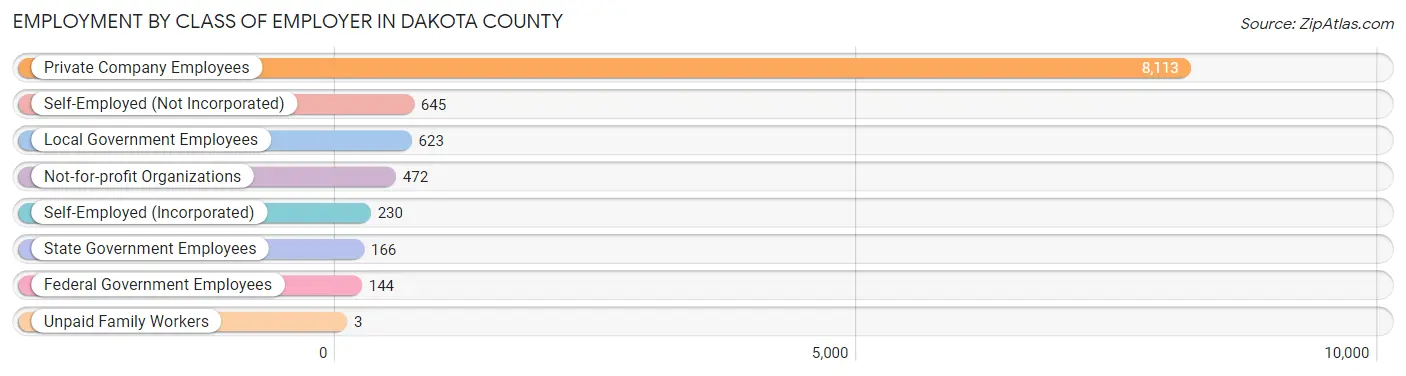
| Employer Class | # Employees | % Employees |
| Private Company Employees | 8,113 | 78.0% |
| Self-Employed (Incorporated) | 230 | 2.2% |
| Self-Employed (Not Incorporated) | 645 | 6.2% |
| Not-for-profit Organizations | 472 | 4.5% |
| Local Government Employees | 623 | 6.0% |
| State Government Employees | 166 | 1.6% |
| Federal Government Employees | 144 | 1.4% |
| Unpaid Family Workers | 3 | 0.0% |
| Total | 10,396 | 100.0% |
Employment Status by Age in Dakota County
According to the labor force statistics for Dakota County, out of the total population over 16 years of age (15,594), 69.9% or 10,900 individuals are in the labor force, with 3.0% or 327 of them unemployed. The age group with the highest labor force participation rate is 45 to 54 years, with 90.6% or 1,888 individuals in the labor force. Within the labor force, the 55 to 59 years age range has the highest percentage of unemployed individuals, with 5.1% or 63 of them being unemployed.
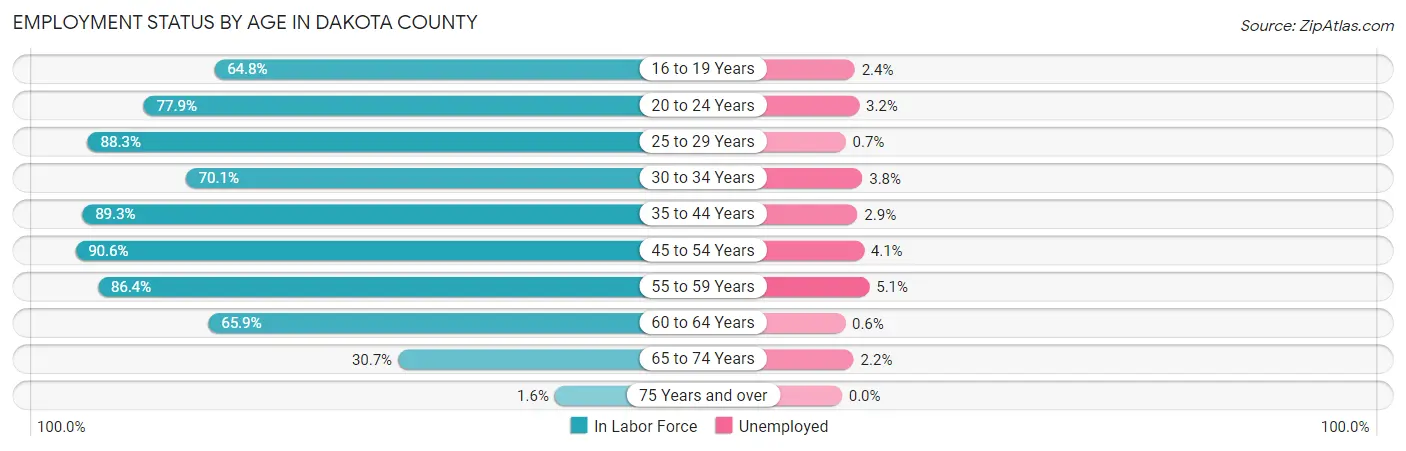
| Age Bracket | In Labor Force | Unemployed |
| 16 to 19 Years | 791 (64.8%) | 19 (2.4%) |
| 20 to 24 Years | 1,151 (77.9%) | 37 (3.2%) |
| 25 to 29 Years | 1,205 (88.3%) | 8 (0.7%) |
| 30 to 34 Years | 1,080 (70.1%) | 41 (3.8%) |
| 35 to 44 Years | 2,351 (89.3%) | 68 (2.9%) |
| 45 to 54 Years | 1,888 (90.6%) | 77 (4.1%) |
| 55 to 59 Years | 1,231 (86.4%) | 63 (5.1%) |
| 60 to 64 Years | 681 (65.9%) | 4 (0.6%) |
| 65 to 74 Years | 499 (30.7%) | 11 (2.2%) |
| 75 Years and over | 19 (1.6%) | 0 (0.0%) |
| Total | 10,900 (69.9%) | 327 (3.0%) |
Employment Status by Educational Attainment in Dakota County
According to labor force statistics for Dakota County, 83.7% of individuals (8,438) out of the total population between 25 and 64 years of age (10,081) are in the labor force, with 3.1% or 262 of them being unemployed. The group with the highest labor force participation rate are those with the educational attainment of bachelor's degree or higher, with 91.5% or 1,394 individuals in the labor force. Within the labor force, individuals with college / associate degree education have the highest percentage of unemployment, with 5.3% or 147 of them being unemployed.
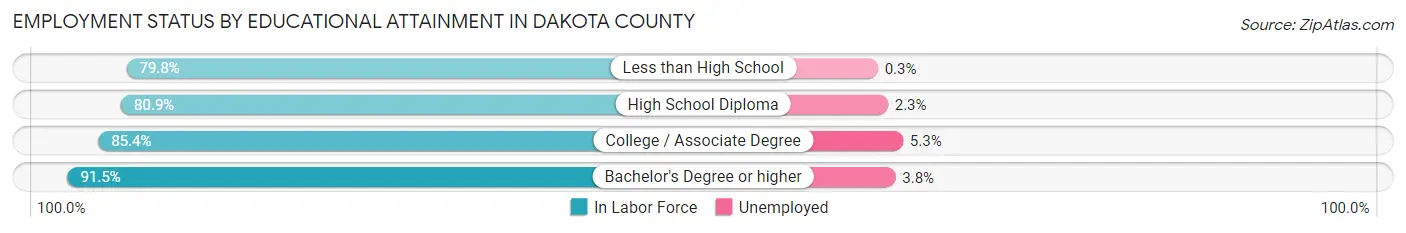
| Educational Attainment | In Labor Force | Unemployed |
| Less than High School | 1,740 (79.8%) | 7 (0.3%) |
| High School Diploma | 2,534 (80.9%) | 72 (2.3%) |
| College / Associate Degree | 2,771 (85.4%) | 172 (5.3%) |
| Bachelor's Degree or higher | 1,394 (91.5%) | 58 (3.8%) |
| Total | 8,438 (83.7%) | 313 (3.1%) |
Employment Occupations by Sex in Dakota County
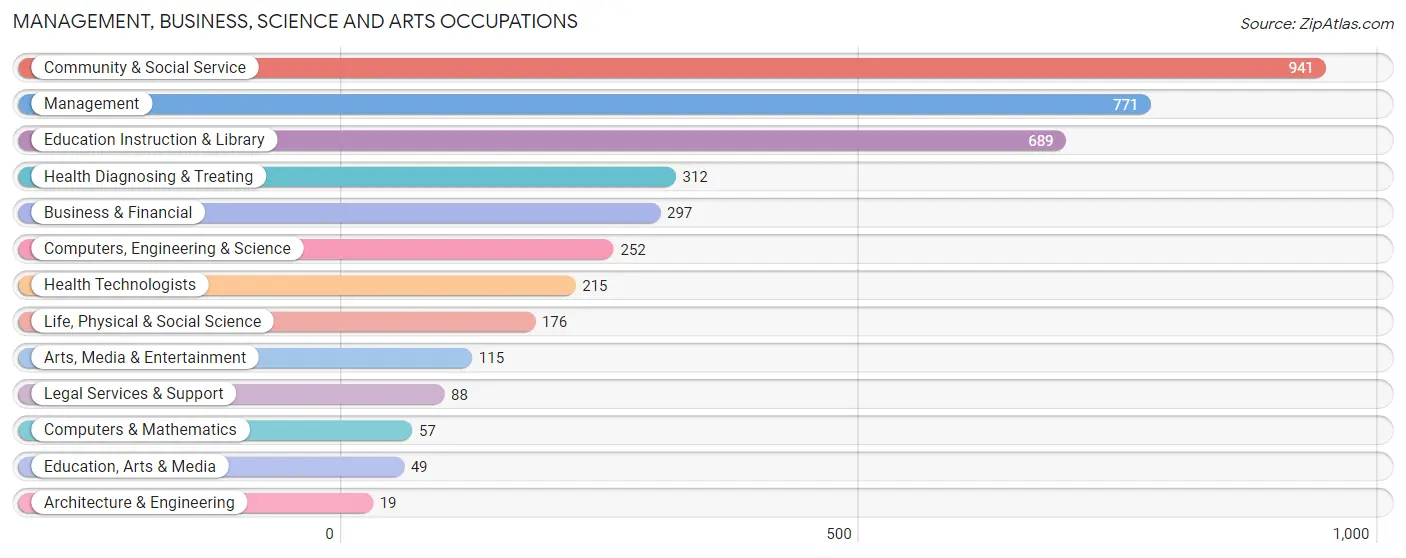
Management, Business, Science and Arts Occupations
The most common Management, Business, Science and Arts occupations in Dakota County are Community & Social Service (941 | 8.9%), Management (771 | 7.3%), Education Instruction & Library (689 | 6.5%), Health Diagnosing & Treating (312 | 3.0%), and Business & Financial (297 | 2.8%).
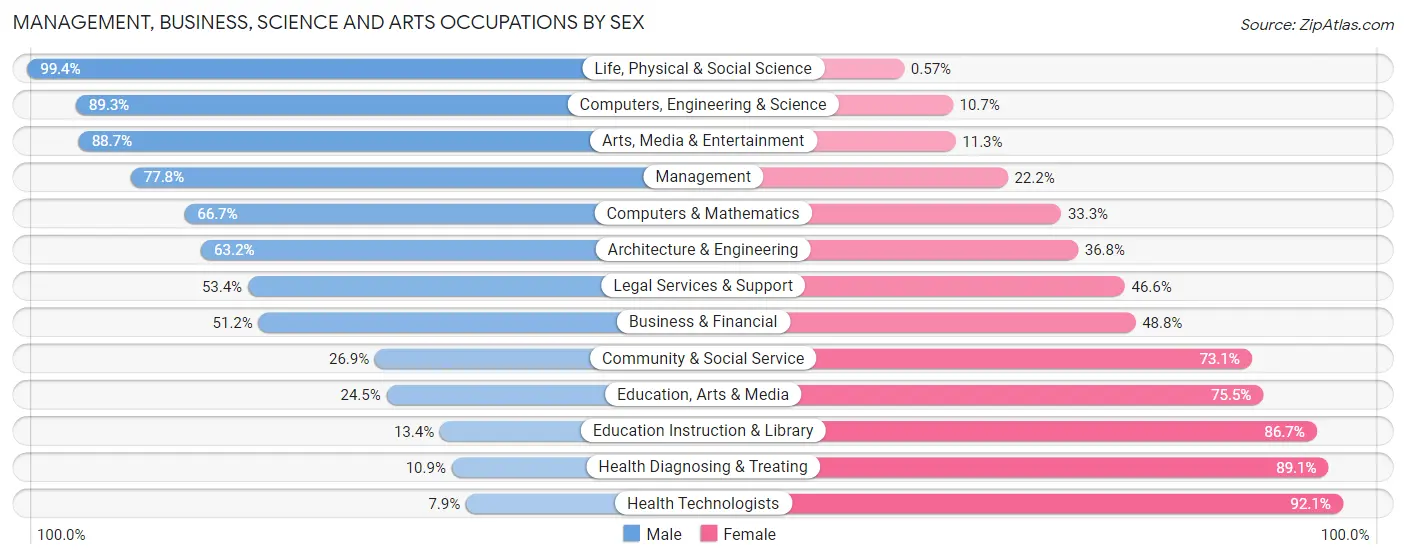
Management, Business, Science and Arts Occupations by Sex
Within the Management, Business, Science and Arts occupations in Dakota County, the most male-oriented occupations are Life, Physical & Social Science (99.4%), Computers, Engineering & Science (89.3%), and Arts, Media & Entertainment (88.7%), while the most female-oriented occupations are Health Technologists (92.1%), Health Diagnosing & Treating (89.1%), and Education Instruction & Library (86.7%).
| Occupation | Male | Female |
| Management | 600 (77.8%) | 171 (22.2%) |
| Business & Financial | 152 (51.2%) | 145 (48.8%) |
| Computers, Engineering & Science | 225 (89.3%) | 27 (10.7%) |
| Computers & Mathematics | 38 (66.7%) | 19 (33.3%) |
| Architecture & Engineering | 12 (63.2%) | 7 (36.8%) |
| Life, Physical & Social Science | 175 (99.4%) | 1 (0.6%) |
| Community & Social Service | 253 (26.9%) | 688 (73.1%) |
| Education, Arts & Media | 12 (24.5%) | 37 (75.5%) |
| Legal Services & Support | 47 (53.4%) | 41 (46.6%) |
| Education Instruction & Library | 92 (13.4%) | 597 (86.7%) |
| Arts, Media & Entertainment | 102 (88.7%) | 13 (11.3%) |
| Health Diagnosing & Treating | 34 (10.9%) | 278 (89.1%) |
| Health Technologists | 17 (7.9%) | 198 (92.1%) |
| Total (Category) | 1,264 (49.1%) | 1,309 (50.9%) |
| Total (Overall) | 5,801 (55.0%) | 4,738 (45.0%) |
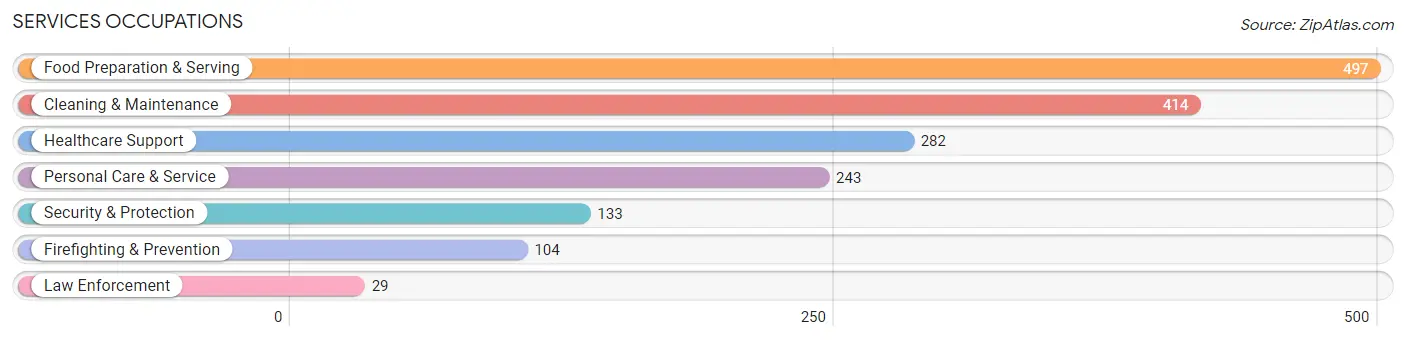
Services Occupations
The most common Services occupations in Dakota County are Food Preparation & Serving (497 | 4.7%), Cleaning & Maintenance (414 | 3.9%), Healthcare Support (282 | 2.7%), Personal Care & Service (243 | 2.3%), and Security & Protection (133 | 1.3%).
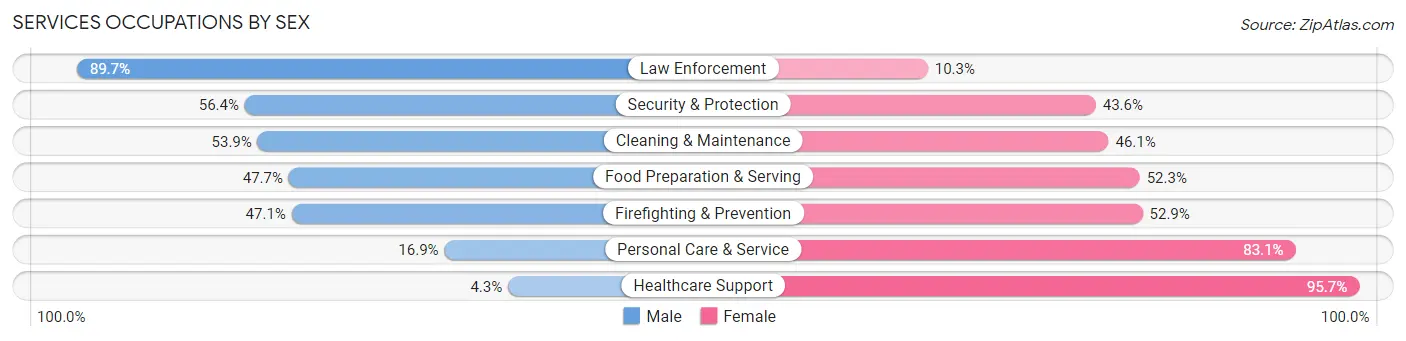
Services Occupations by Sex
Within the Services occupations in Dakota County, the most male-oriented occupations are Law Enforcement (89.7%), Security & Protection (56.4%), and Cleaning & Maintenance (53.9%), while the most female-oriented occupations are Healthcare Support (95.7%), Personal Care & Service (83.1%), and Firefighting & Prevention (52.9%).
| Occupation | Male | Female |
| Healthcare Support | 12 (4.3%) | 270 (95.7%) |
| Security & Protection | 75 (56.4%) | 58 (43.6%) |
| Firefighting & Prevention | 49 (47.1%) | 55 (52.9%) |
| Law Enforcement | 26 (89.7%) | 3 (10.3%) |
| Food Preparation & Serving | 237 (47.7%) | 260 (52.3%) |
| Cleaning & Maintenance | 223 (53.9%) | 191 (46.1%) |
| Personal Care & Service | 41 (16.9%) | 202 (83.1%) |
| Total (Category) | 588 (37.5%) | 981 (62.5%) |
| Total (Overall) | 5,801 (55.0%) | 4,738 (45.0%) |
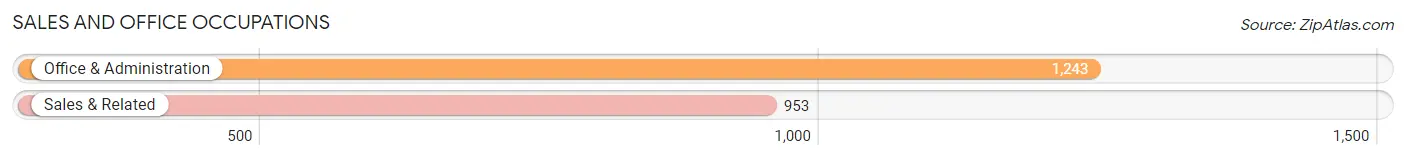
Sales and Office Occupations
The most common Sales and Office occupations in Dakota County are Office & Administration (1,243 | 11.8%), and Sales & Related (953 | 9.0%).
Sales and Office Occupations by Sex
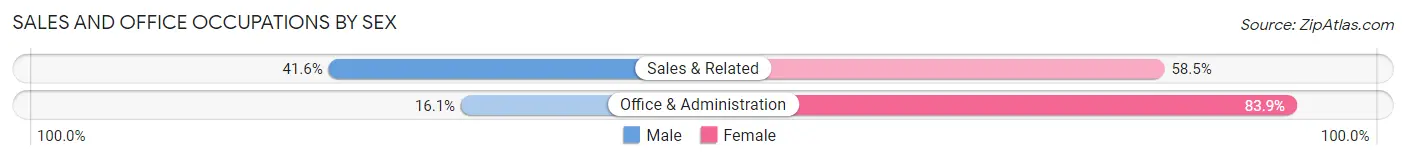
| Occupation | Male | Female |
| Sales & Related | 396 (41.5%) | 557 (58.5%) |
| Office & Administration | 200 (16.1%) | 1,043 (83.9%) |
| Total (Category) | 596 (27.1%) | 1,600 (72.9%) |
| Total (Overall) | 5,801 (55.0%) | 4,738 (45.0%) |
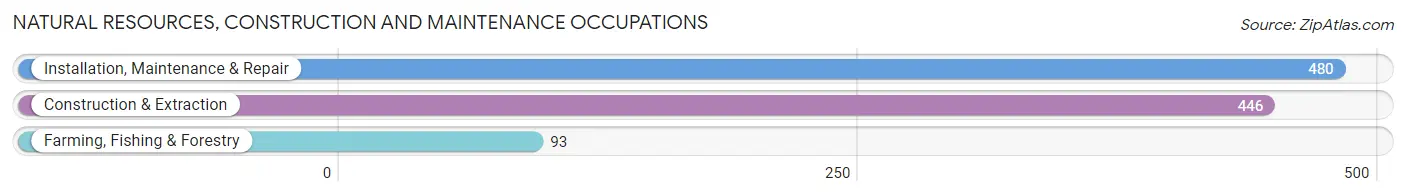
Natural Resources, Construction and Maintenance Occupations
The most common Natural Resources, Construction and Maintenance occupations in Dakota County are Installation, Maintenance & Repair (480 | 4.5%), Construction & Extraction (446 | 4.2%), and Farming, Fishing & Forestry (93 | 0.9%).
Natural Resources, Construction and Maintenance Occupations by Sex
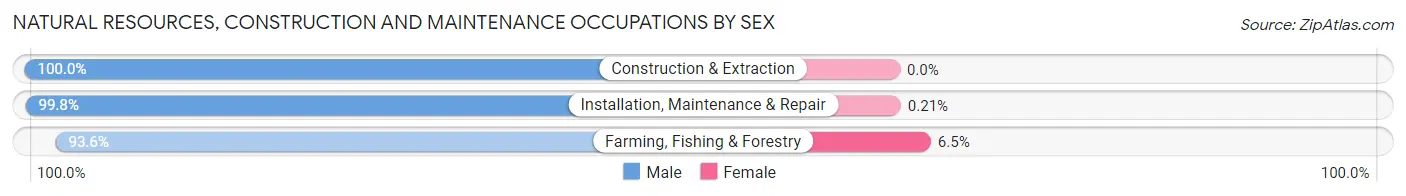
| Occupation | Male | Female |
| Farming, Fishing & Forestry | 87 (93.5%) | 6 (6.5%) |
| Construction & Extraction | 446 (100.0%) | 0 (0.0%) |
| Installation, Maintenance & Repair | 479 (99.8%) | 1 (0.2%) |
| Total (Category) | 1,012 (99.3%) | 7 (0.7%) |
| Total (Overall) | 5,801 (55.0%) | 4,738 (45.0%) |
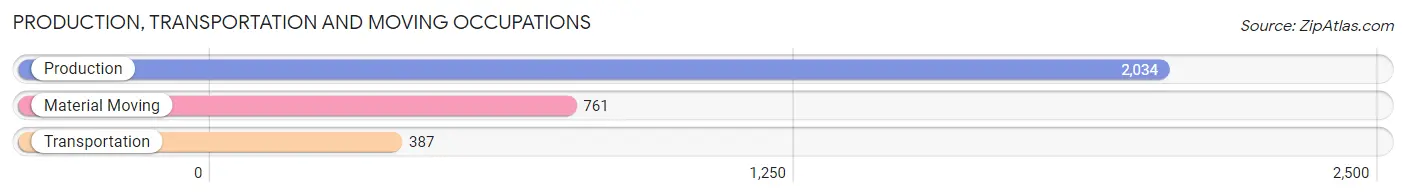
Production, Transportation and Moving Occupations
The most common Production, Transportation and Moving occupations in Dakota County are Production (2,034 | 19.3%), Material Moving (761 | 7.2%), and Transportation (387 | 3.7%).
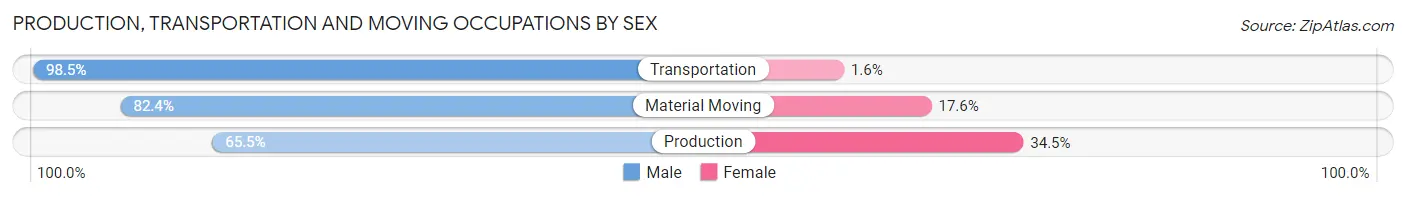
Production, Transportation and Moving Occupations by Sex
| Occupation | Male | Female |
| Production | 1,333 (65.5%) | 701 (34.5%) |
| Transportation | 381 (98.5%) | 6 (1.5%) |
| Material Moving | 627 (82.4%) | 134 (17.6%) |
| Total (Category) | 2,341 (73.6%) | 841 (26.4%) |
| Total (Overall) | 5,801 (55.0%) | 4,738 (45.0%) |
Employment Industries by Sex in Dakota County
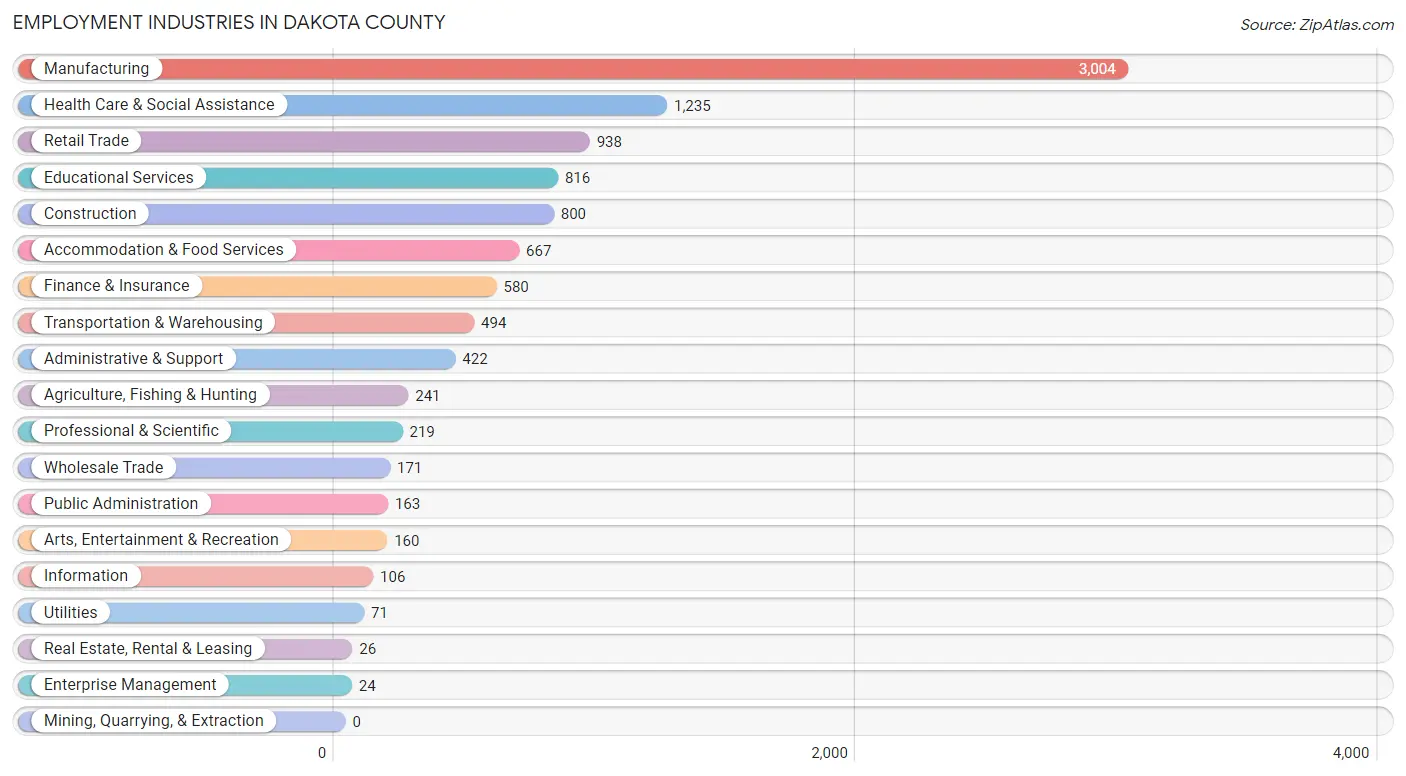
Employment Industries in Dakota County
The major employment industries in Dakota County include Manufacturing (3,004 | 28.5%), Health Care & Social Assistance (1,235 | 11.7%), Retail Trade (938 | 8.9%), Educational Services (816 | 7.7%), and Construction (800 | 7.6%).
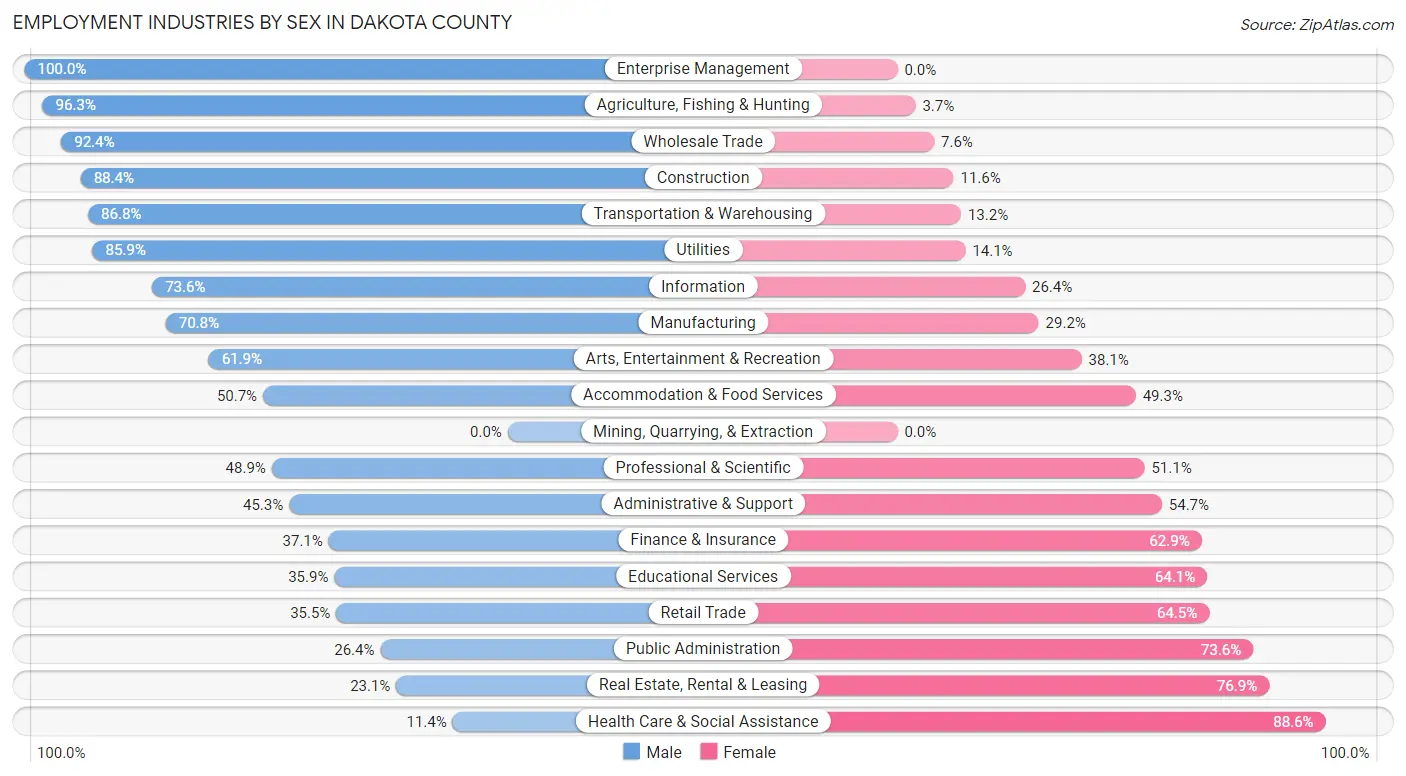
Employment Industries by Sex in Dakota County
The Dakota County industries that see more men than women are Enterprise Management (100.0%), Agriculture, Fishing & Hunting (96.3%), and Wholesale Trade (92.4%), whereas the industries that tend to have a higher number of women are Health Care & Social Assistance (88.6%), Real Estate, Rental & Leasing (76.9%), and Public Administration (73.6%).
| Industry | Male | Female |
| Agriculture, Fishing & Hunting | 232 (96.3%) | 9 (3.7%) |
| Mining, Quarrying, & Extraction | 0 (0.0%) | 0 (0.0%) |
| Construction | 707 (88.4%) | 93 (11.6%) |
| Manufacturing | 2,126 (70.8%) | 878 (29.2%) |
| Wholesale Trade | 158 (92.4%) | 13 (7.6%) |
| Retail Trade | 333 (35.5%) | 605 (64.5%) |
| Transportation & Warehousing | 429 (86.8%) | 65 (13.2%) |
| Utilities | 61 (85.9%) | 10 (14.1%) |
| Information | 78 (73.6%) | 28 (26.4%) |
| Finance & Insurance | 215 (37.1%) | 365 (62.9%) |
| Real Estate, Rental & Leasing | 6 (23.1%) | 20 (76.9%) |
| Professional & Scientific | 107 (48.9%) | 112 (51.1%) |
| Enterprise Management | 24 (100.0%) | 0 (0.0%) |
| Administrative & Support | 191 (45.3%) | 231 (54.7%) |
| Educational Services | 293 (35.9%) | 523 (64.1%) |
| Health Care & Social Assistance | 141 (11.4%) | 1,094 (88.6%) |
| Arts, Entertainment & Recreation | 99 (61.9%) | 61 (38.1%) |
| Accommodation & Food Services | 338 (50.7%) | 329 (49.3%) |
| Public Administration | 43 (26.4%) | 120 (73.6%) |
| Total | 5,801 (55.0%) | 4,738 (45.0%) |
Education in Dakota County
School Enrollment in Dakota County
The most common levels of schooling among the 5,632 students in Dakota County are middle school (1,390 | 24.7%), high school (1,361 | 24.2%), and elementary school (1,128 | 20.0%).
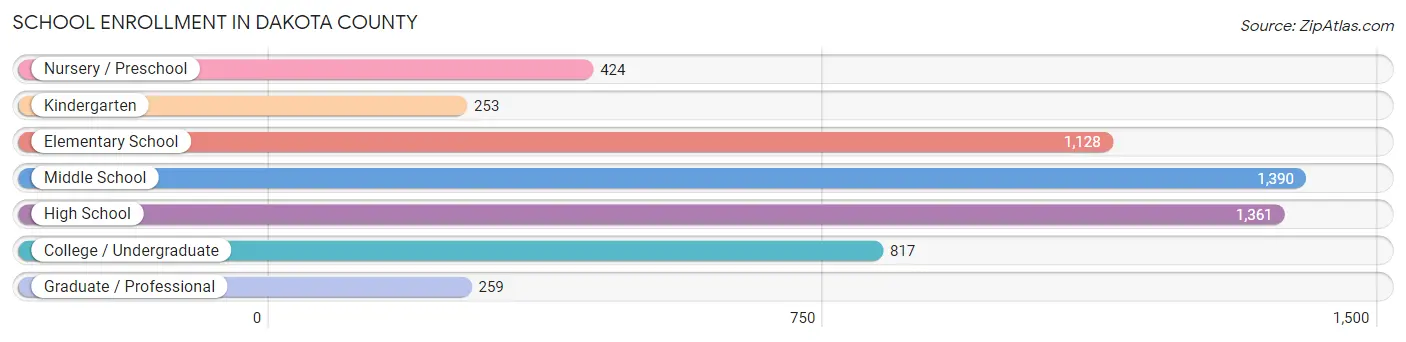
| School Level | # Students | % Students |
| Nursery / Preschool | 424 | 7.5% |
| Kindergarten | 253 | 4.5% |
| Elementary School | 1,128 | 20.0% |
| Middle School | 1,390 | 24.7% |
| High School | 1,361 | 24.2% |
| College / Undergraduate | 817 | 14.5% |
| Graduate / Professional | 259 | 4.6% |
| Total | 5,632 | 100.0% |
School Enrollment by Age by Funding Source in Dakota County
Out of a total of 5,632 students who are enrolled in schools in Dakota County, 501 (8.9%) attend a private institution, while the remaining 5,131 (91.1%) are enrolled in public schools. The age group of 35 years and over has the highest likelihood of being enrolled in private schools, with 29 (24.4% in the age bracket) enrolled. Conversely, the age group of 5 to 9 year old has the lowest likelihood of being enrolled in a private school, with 1,393 (96.7% in the age bracket) attending a public institution.
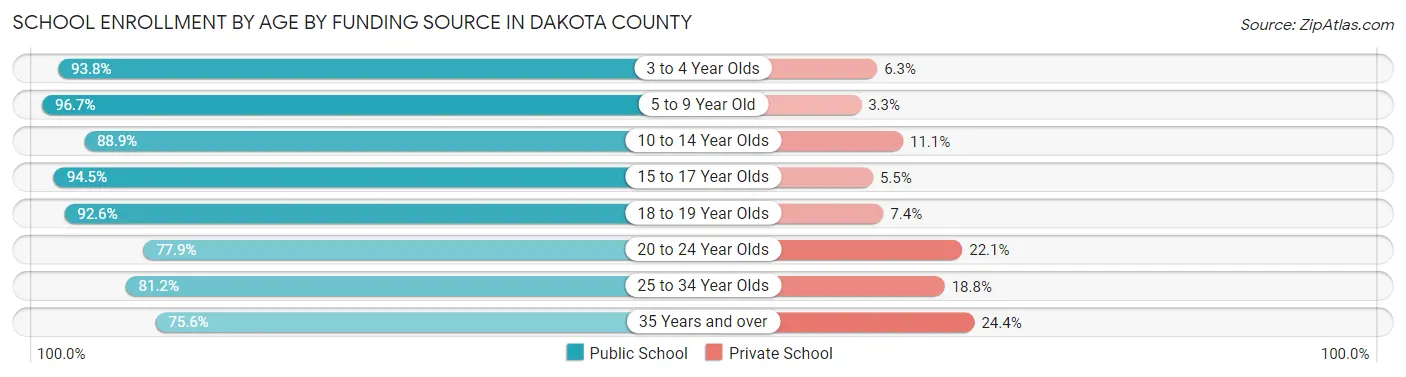
| Age Bracket | Public School | Private School |
| 3 to 4 Year Olds | 255 (93.8%) | 17 (6.2%) |
| 5 to 9 Year Old | 1,393 (96.7%) | 47 (3.3%) |
| 10 to 14 Year Olds | 1,568 (88.9%) | 195 (11.1%) |
| 15 to 17 Year Olds | 918 (94.5%) | 53 (5.5%) |
| 18 to 19 Year Olds | 388 (92.6%) | 31 (7.4%) |
| 20 to 24 Year Olds | 215 (77.9%) | 61 (22.1%) |
| 25 to 34 Year Olds | 302 (81.2%) | 70 (18.8%) |
| 35 Years and over | 90 (75.6%) | 29 (24.4%) |
| Total | 5,131 (91.1%) | 501 (8.9%) |
Educational Attainment by Field of Study in Dakota County
Education (520 | 26.0%), business (405 | 20.3%), science & technology (260 | 13.0%), arts & humanities (178 | 8.9%), and bio, nature & agricultural (162 | 8.1%) are the most common fields of study among 1,999 individuals in Dakota County who have obtained a bachelor's degree or higher.
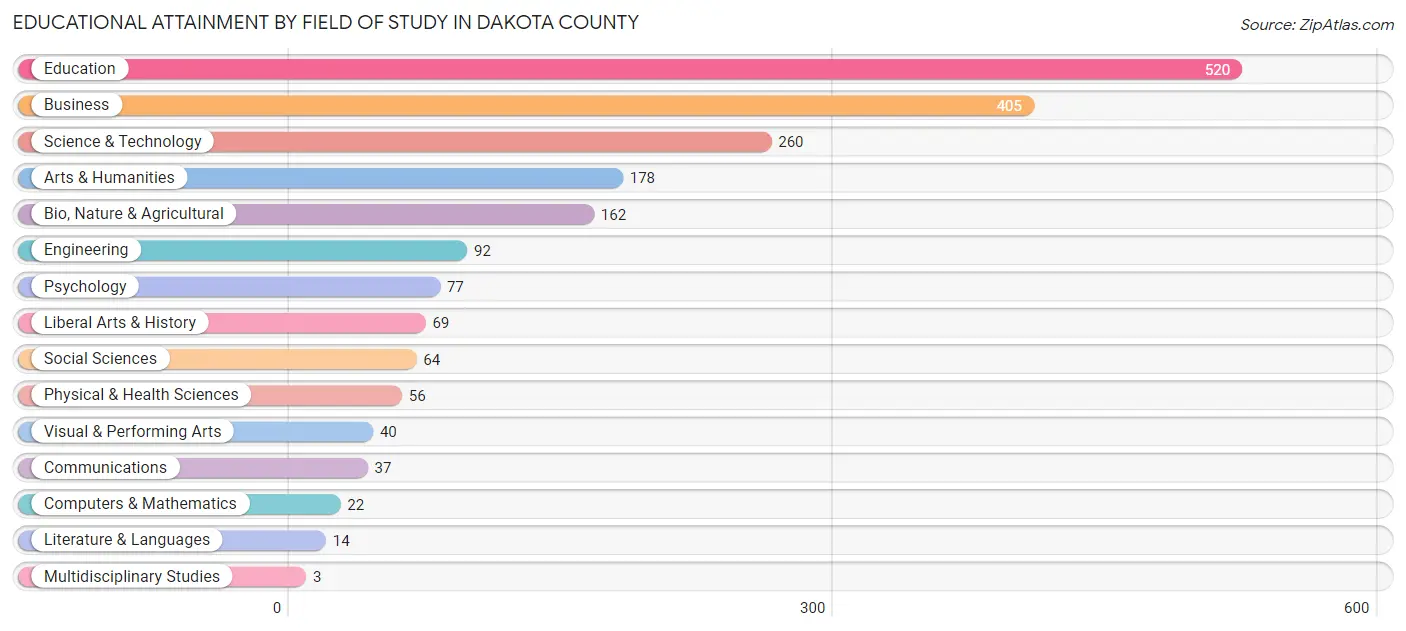
| Field of Study | # Graduates | % Graduates |
| Computers & Mathematics | 22 | 1.1% |
| Bio, Nature & Agricultural | 162 | 8.1% |
| Physical & Health Sciences | 56 | 2.8% |
| Psychology | 77 | 3.8% |
| Social Sciences | 64 | 3.2% |
| Engineering | 92 | 4.6% |
| Multidisciplinary Studies | 3 | 0.2% |
| Science & Technology | 260 | 13.0% |
| Business | 405 | 20.3% |
| Education | 520 | 26.0% |
| Literature & Languages | 14 | 0.7% |
| Liberal Arts & History | 69 | 3.5% |
| Visual & Performing Arts | 40 | 2.0% |
| Communications | 37 | 1.8% |
| Arts & Humanities | 178 | 8.9% |
| Total | 1,999 | 100.0% |
Transportation & Commute in Dakota County
Vehicle Availability by Sex in Dakota County
The most prevalent vehicle ownership categories in Dakota County are males with 2 vehicles (2,413, accounting for 41.8%) and females with 2 vehicles (1,664, making up 52.3%).
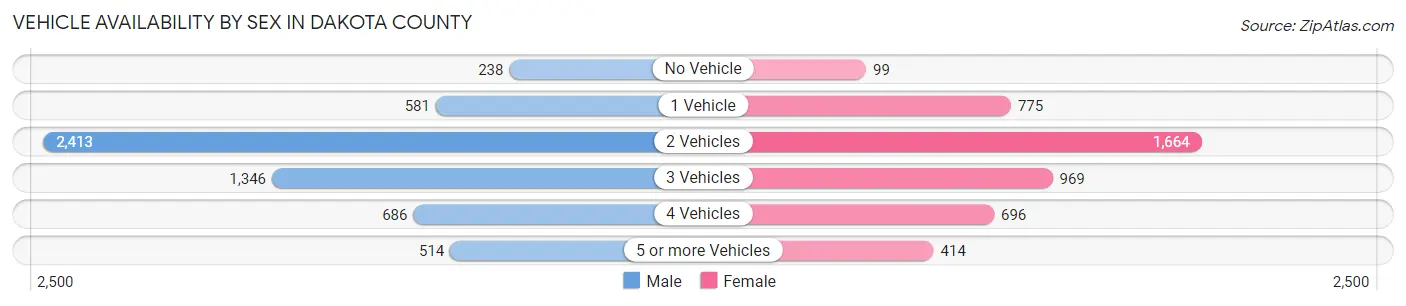
| Vehicles Available | Male | Female |
| No Vehicle | 238 (4.1%) | 99 (2.1%) |
| 1 Vehicle | 581 (10.1%) | 775 (16.8%) |
| 2 Vehicles | 2,413 (41.8%) | 1,664 (36.0%) |
| 3 Vehicles | 1,346 (23.3%) | 969 (21.0%) |
| 4 Vehicles | 686 (11.9%) | 696 (15.1%) |
| 5 or more Vehicles | 514 (8.9%) | 414 (9.0%) |
| Total | 5,778 (100.0%) | 4,617 (100.0%) |
Commute Time in Dakota County
The most frequently occuring commute durations in Dakota County are 10 to 14 minutes (2,690 commuters, 27.5%), 15 to 19 minutes (2,670 commuters, 27.3%), and 5 to 9 minutes (1,736 commuters, 17.7%).
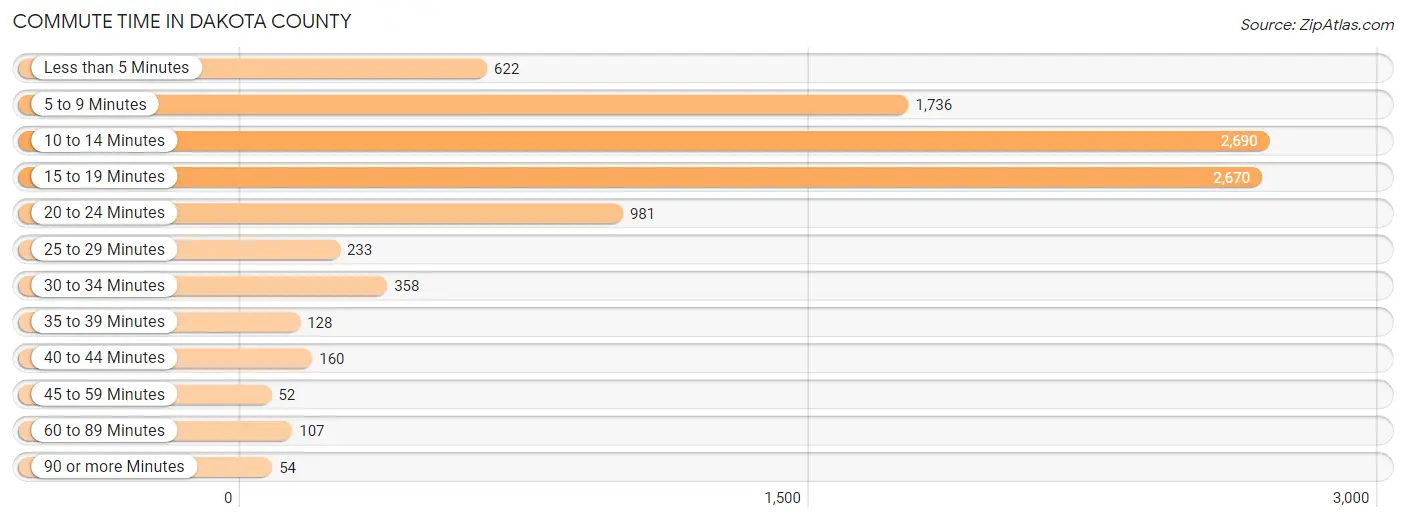
| Commute Time | # Commuters | % Commuters |
| Less than 5 Minutes | 622 | 6.4% |
| 5 to 9 Minutes | 1,736 | 17.7% |
| 10 to 14 Minutes | 2,690 | 27.5% |
| 15 to 19 Minutes | 2,670 | 27.3% |
| 20 to 24 Minutes | 981 | 10.0% |
| 25 to 29 Minutes | 233 | 2.4% |
| 30 to 34 Minutes | 358 | 3.7% |
| 35 to 39 Minutes | 128 | 1.3% |
| 40 to 44 Minutes | 160 | 1.6% |
| 45 to 59 Minutes | 52 | 0.5% |
| 60 to 89 Minutes | 107 | 1.1% |
| 90 or more Minutes | 54 | 0.5% |
Commute Time by Sex in Dakota County
The most common commute times in Dakota County are 10 to 14 minutes (1,609 commuters, 30.6%) for males and 15 to 19 minutes (1,133 commuters, 24.9%) for females.
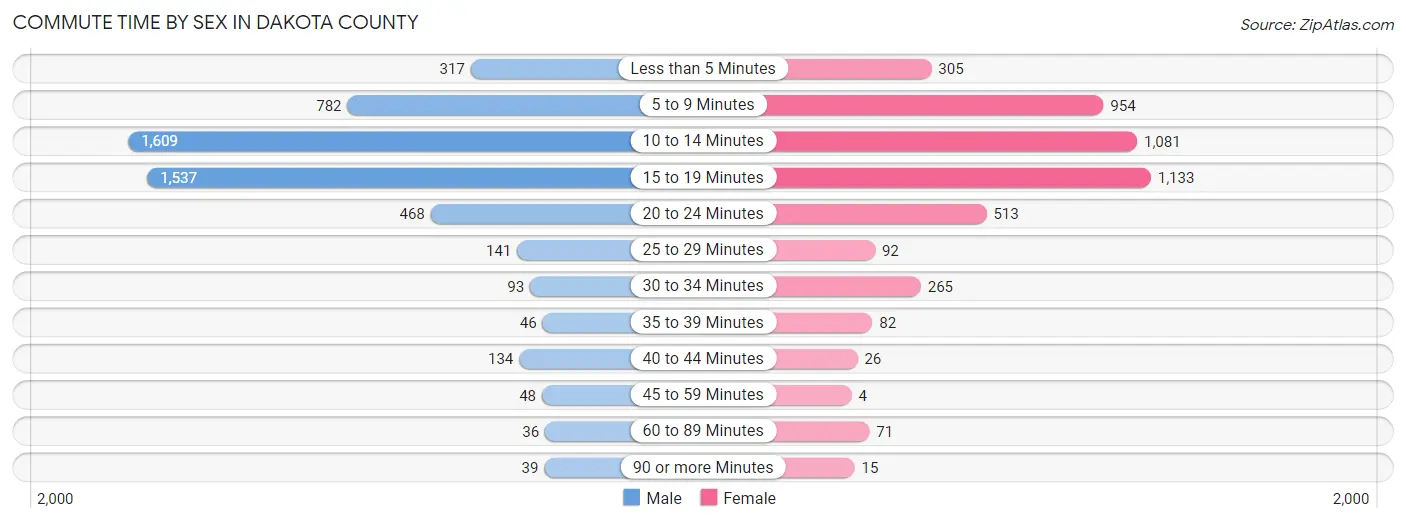
| Commute Time | Male | Female |
| Less than 5 Minutes | 317 (6.0%) | 305 (6.7%) |
| 5 to 9 Minutes | 782 (14.9%) | 954 (21.0%) |
| 10 to 14 Minutes | 1,609 (30.6%) | 1,081 (23.8%) |
| 15 to 19 Minutes | 1,537 (29.3%) | 1,133 (24.9%) |
| 20 to 24 Minutes | 468 (8.9%) | 513 (11.3%) |
| 25 to 29 Minutes | 141 (2.7%) | 92 (2.0%) |
| 30 to 34 Minutes | 93 (1.8%) | 265 (5.8%) |
| 35 to 39 Minutes | 46 (0.9%) | 82 (1.8%) |
| 40 to 44 Minutes | 134 (2.5%) | 26 (0.6%) |
| 45 to 59 Minutes | 48 (0.9%) | 4 (0.1%) |
| 60 to 89 Minutes | 36 (0.7%) | 71 (1.6%) |
| 90 or more Minutes | 39 (0.7%) | 15 (0.3%) |
Time of Departure to Work by Sex in Dakota County
The most frequent times of departure to work in Dakota County are 12:00 PM to 3:59 PM (943, 18.0%) for males and 12:00 PM to 3:59 PM (801, 17.6%) for females.
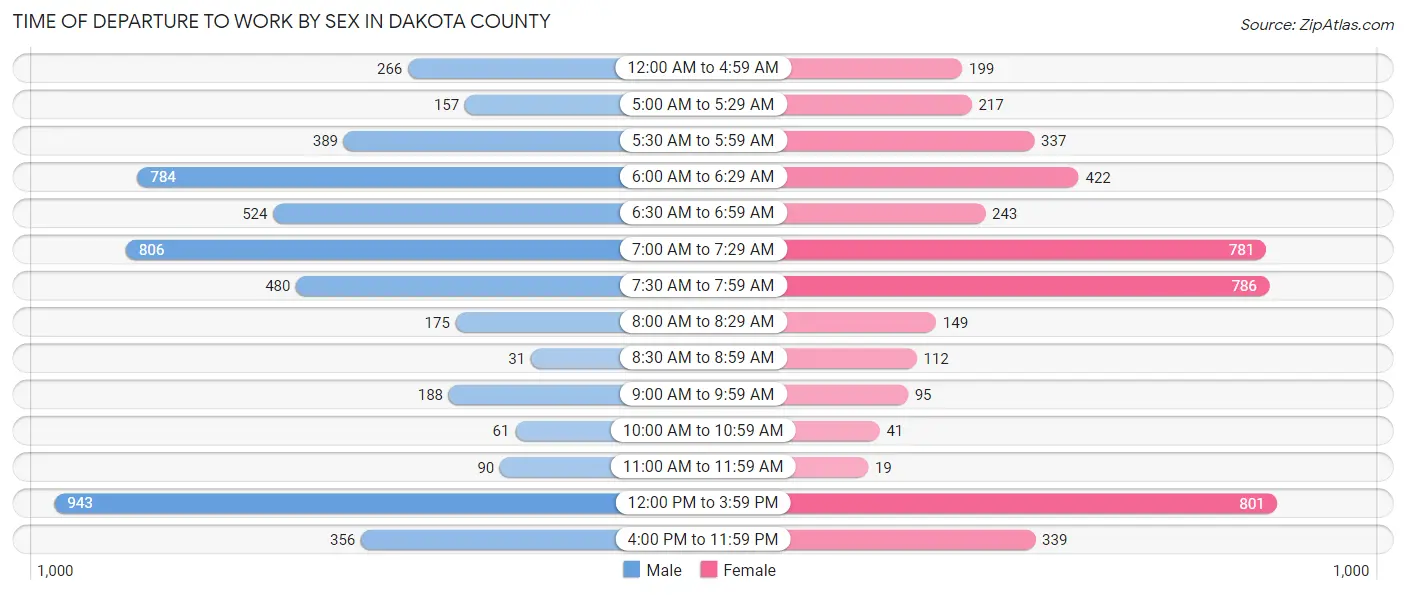
| Time of Departure | Male | Female |
| 12:00 AM to 4:59 AM | 266 (5.1%) | 199 (4.4%) |
| 5:00 AM to 5:29 AM | 157 (3.0%) | 217 (4.8%) |
| 5:30 AM to 5:59 AM | 389 (7.4%) | 337 (7.4%) |
| 6:00 AM to 6:29 AM | 784 (14.9%) | 422 (9.3%) |
| 6:30 AM to 6:59 AM | 524 (10.0%) | 243 (5.3%) |
| 7:00 AM to 7:29 AM | 806 (15.3%) | 781 (17.2%) |
| 7:30 AM to 7:59 AM | 480 (9.1%) | 786 (17.3%) |
| 8:00 AM to 8:29 AM | 175 (3.3%) | 149 (3.3%) |
| 8:30 AM to 8:59 AM | 31 (0.6%) | 112 (2.5%) |
| 9:00 AM to 9:59 AM | 188 (3.6%) | 95 (2.1%) |
| 10:00 AM to 10:59 AM | 61 (1.2%) | 41 (0.9%) |
| 11:00 AM to 11:59 AM | 90 (1.7%) | 19 (0.4%) |
| 12:00 PM to 3:59 PM | 943 (18.0%) | 801 (17.6%) |
| 4:00 PM to 11:59 PM | 356 (6.8%) | 339 (7.5%) |
| Total | 5,250 (100.0%) | 4,541 (100.0%) |
Housing Occupancy in Dakota County
Occupancy by Ownership in Dakota County
Of the total 7,181 dwellings in Dakota County, owner-occupied units account for 4,670 (65.0%), while renter-occupied units make up 2,511 (35.0%).
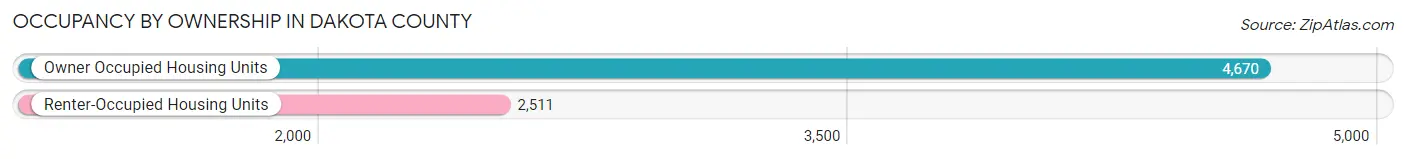
| Occupancy | # Housing Units | % Housing Units |
| Owner Occupied Housing Units | 4,670 | 65.0% |
| Renter-Occupied Housing Units | 2,511 | 35.0% |
| Total Occupied Housing Units | 7,181 | 100.0% |
Occupancy by Household Size in Dakota County
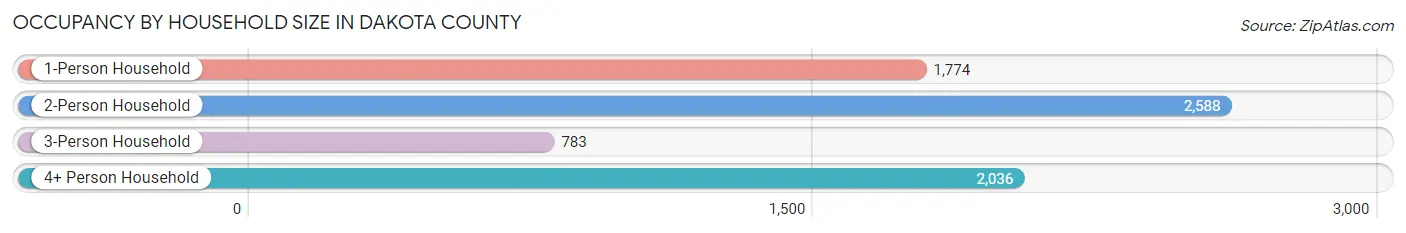
| Household Size | # Housing Units | % Housing Units |
| 1-Person Household | 1,774 | 24.7% |
| 2-Person Household | 2,588 | 36.0% |
| 3-Person Household | 783 | 10.9% |
| 4+ Person Household | 2,036 | 28.3% |
| Total Housing Units | 7,181 | 100.0% |
Occupancy by Ownership by Household Size in Dakota County
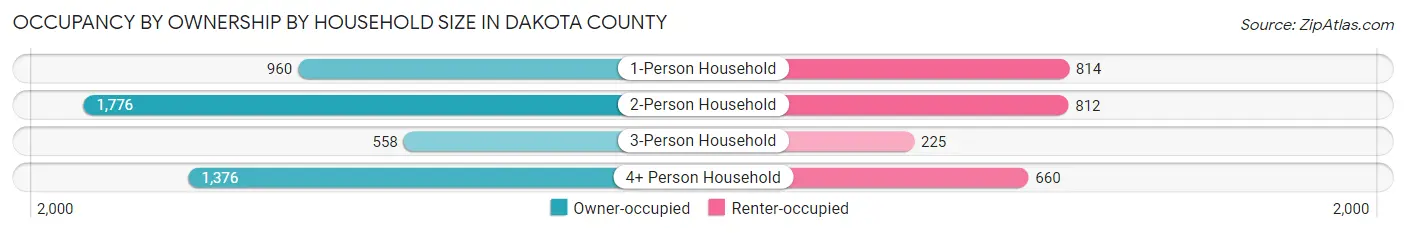
| Household Size | Owner-occupied | Renter-occupied |
| 1-Person Household | 960 (54.1%) | 814 (45.9%) |
| 2-Person Household | 1,776 (68.6%) | 812 (31.4%) |
| 3-Person Household | 558 (71.3%) | 225 (28.7%) |
| 4+ Person Household | 1,376 (67.6%) | 660 (32.4%) |
| Total Housing Units | 4,670 (65.0%) | 2,511 (35.0%) |
Occupancy by Educational Attainment in Dakota County
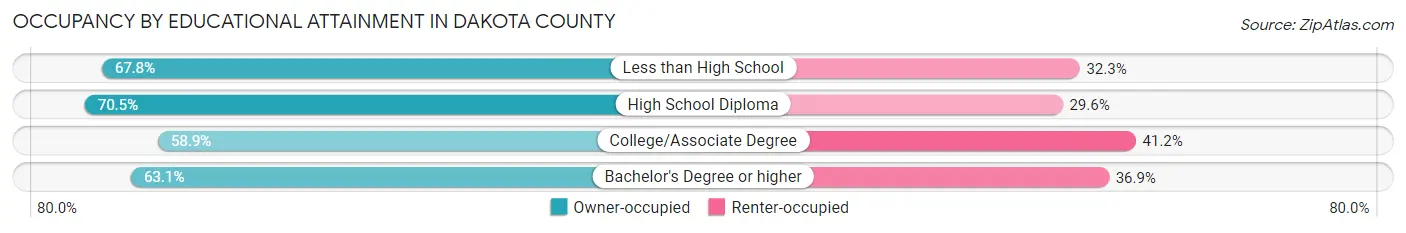
| Household Size | Owner-occupied | Renter-occupied |
| Less than High School | 832 (67.7%) | 396 (32.3%) |
| High School Diploma | 1,724 (70.5%) | 723 (29.5%) |
| College/Associate Degree | 1,366 (58.9%) | 955 (41.1%) |
| Bachelor's Degree or higher | 748 (63.1%) | 437 (36.9%) |
Occupancy by Age of Householder in Dakota County
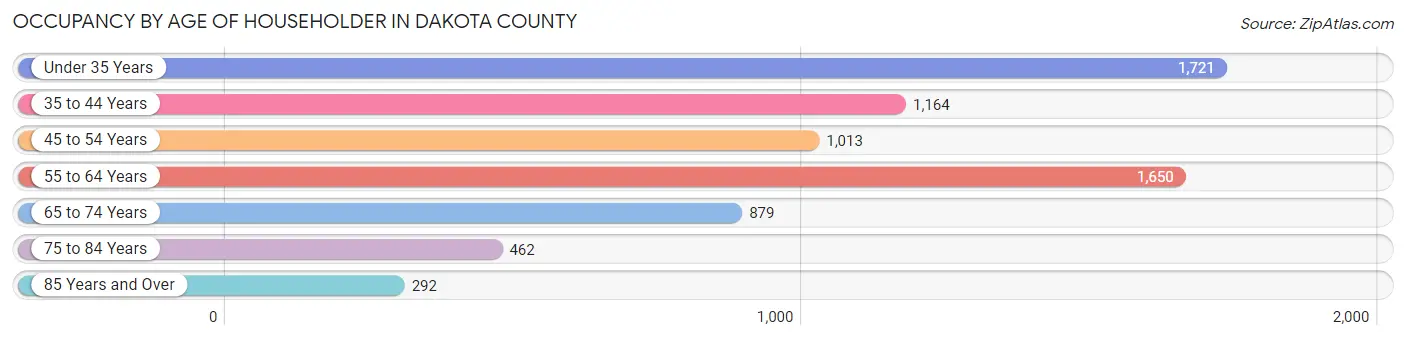
| Age Bracket | # Households | % Households |
| Under 35 Years | 1,721 | 24.0% |
| 35 to 44 Years | 1,164 | 16.2% |
| 45 to 54 Years | 1,013 | 14.1% |
| 55 to 64 Years | 1,650 | 23.0% |
| 65 to 74 Years | 879 | 12.2% |
| 75 to 84 Years | 462 | 6.4% |
| 85 Years and Over | 292 | 4.1% |
| Total | 7,181 | 100.0% |
Housing Finances in Dakota County
Median Income by Occupancy in Dakota County
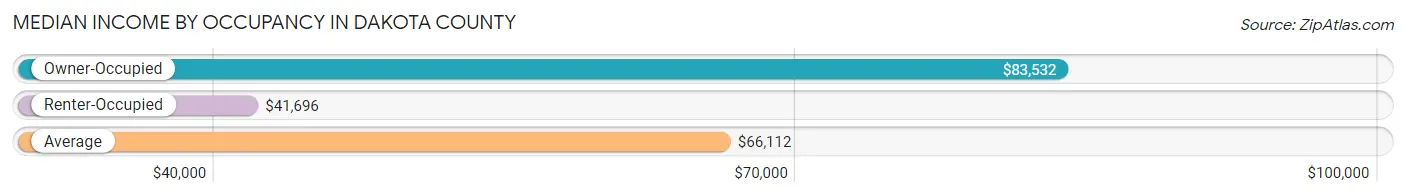
| Occupancy Type | # Households | Median Income |
| Owner-Occupied | 4,670 (65.0%) | $83,532 |
| Renter-Occupied | 2,511 (35.0%) | $41,696 |
| Average | 7,181 (100.0%) | $66,112 |
Occupancy by Householder Income Bracket in Dakota County
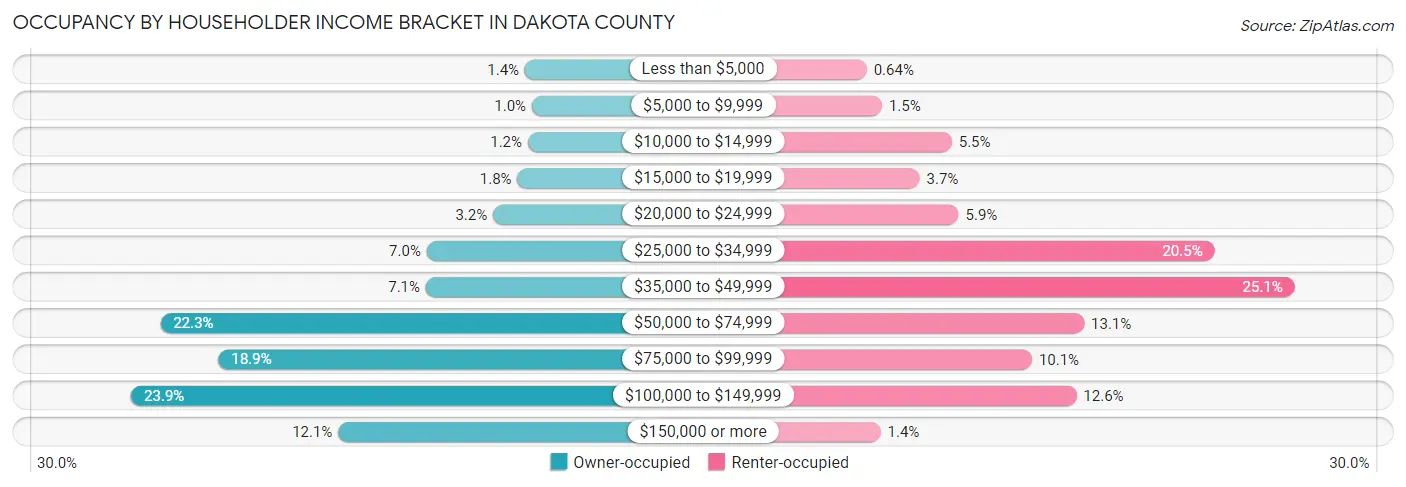
| Income Bracket | Owner-occupied | Renter-occupied |
| Less than $5,000 | 66 (1.4%) | 16 (0.6%) |
| $5,000 to $9,999 | 47 (1.0%) | 38 (1.5%) |
| $10,000 to $14,999 | 58 (1.2%) | 138 (5.5%) |
| $15,000 to $19,999 | 86 (1.8%) | 92 (3.7%) |
| $20,000 to $24,999 | 151 (3.2%) | 148 (5.9%) |
| $25,000 to $34,999 | 328 (7.0%) | 515 (20.5%) |
| $35,000 to $49,999 | 330 (7.1%) | 630 (25.1%) |
| $50,000 to $74,999 | 1,039 (22.3%) | 328 (13.1%) |
| $75,000 to $99,999 | 884 (18.9%) | 253 (10.1%) |
| $100,000 to $149,999 | 1,117 (23.9%) | 317 (12.6%) |
| $150,000 or more | 564 (12.1%) | 36 (1.4%) |
| Total | 4,670 (100.0%) | 2,511 (100.0%) |
Monthly Housing Cost Tiers in Dakota County
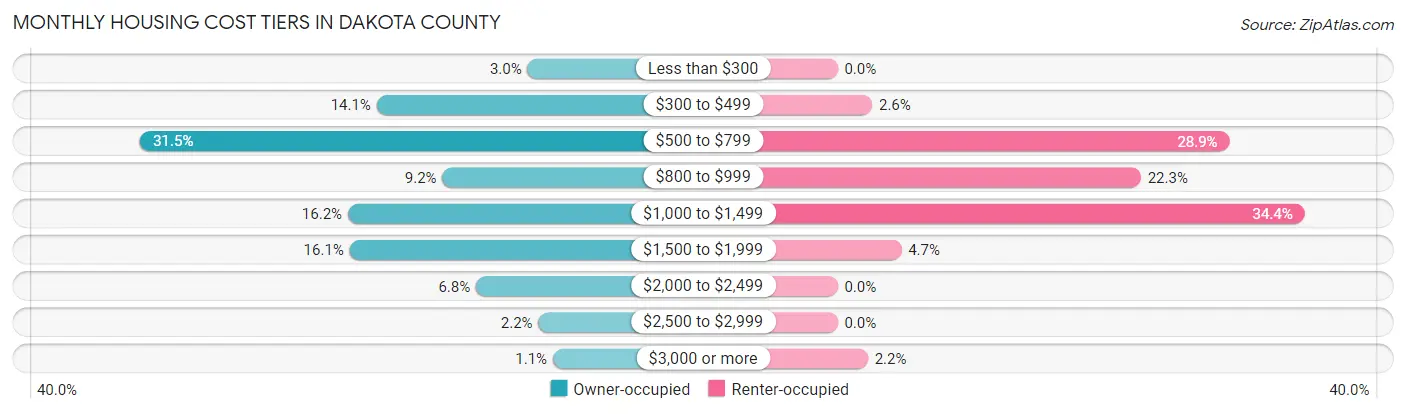
| Monthly Cost | Owner-occupied | Renter-occupied |
| Less than $300 | 138 (3.0%) | 0 (0.0%) |
| $300 to $499 | 657 (14.1%) | 64 (2.5%) |
| $500 to $799 | 1,471 (31.5%) | 725 (28.9%) |
| $800 to $999 | 431 (9.2%) | 561 (22.3%) |
| $1,000 to $1,499 | 756 (16.2%) | 864 (34.4%) |
| $1,500 to $1,999 | 750 (16.1%) | 118 (4.7%) |
| $2,000 to $2,499 | 315 (6.8%) | 0 (0.0%) |
| $2,500 to $2,999 | 101 (2.2%) | 0 (0.0%) |
| $3,000 or more | 51 (1.1%) | 56 (2.2%) |
| Total | 4,670 (100.0%) | 2,511 (100.0%) |
Physical Housing Characteristics in Dakota County
Housing Structures in Dakota County
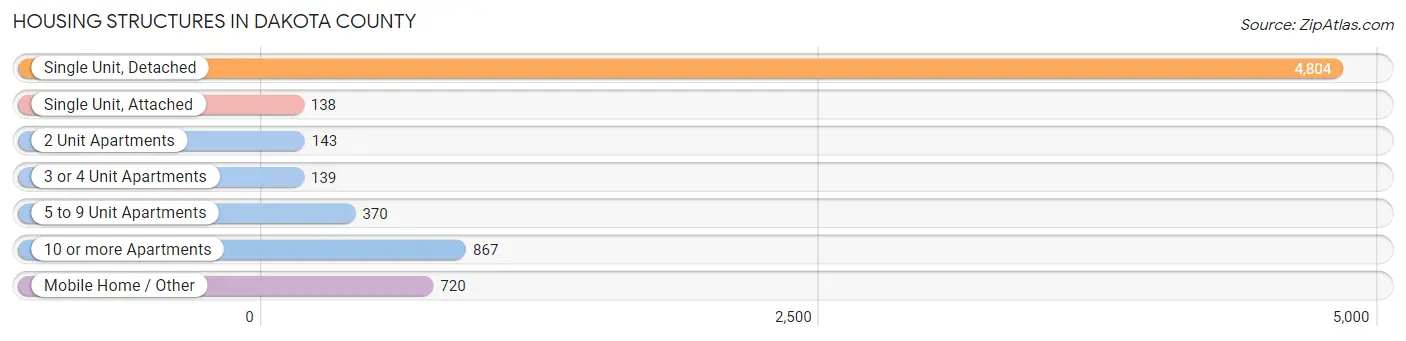
| Structure Type | # Housing Units | % Housing Units |
| Single Unit, Detached | 4,804 | 66.9% |
| Single Unit, Attached | 138 | 1.9% |
| 2 Unit Apartments | 143 | 2.0% |
| 3 or 4 Unit Apartments | 139 | 1.9% |
| 5 to 9 Unit Apartments | 370 | 5.1% |
| 10 or more Apartments | 867 | 12.1% |
| Mobile Home / Other | 720 | 10.0% |
| Total | 7,181 | 100.0% |
Housing Structures by Occupancy in Dakota County
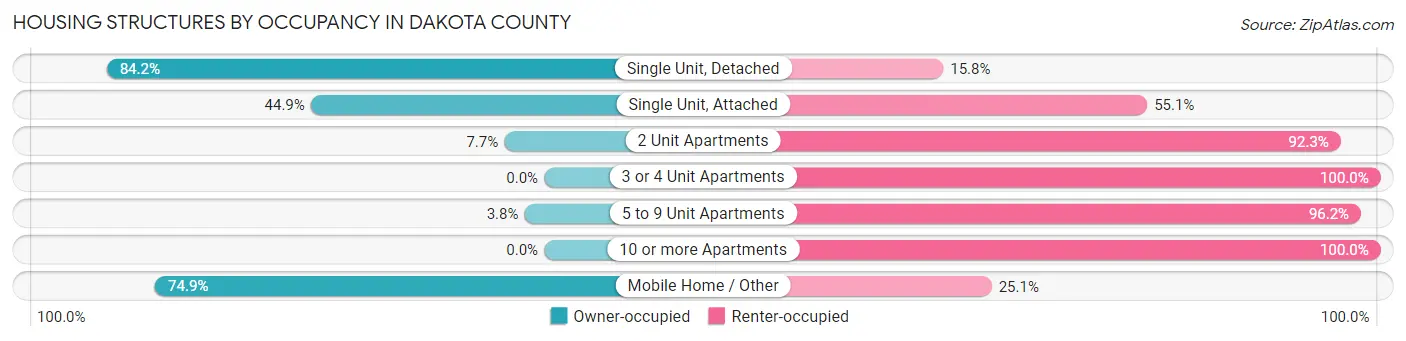
| Structure Type | Owner-occupied | Renter-occupied |
| Single Unit, Detached | 4,044 (84.2%) | 760 (15.8%) |
| Single Unit, Attached | 62 (44.9%) | 76 (55.1%) |
| 2 Unit Apartments | 11 (7.7%) | 132 (92.3%) |
| 3 or 4 Unit Apartments | 0 (0.0%) | 139 (100.0%) |
| 5 to 9 Unit Apartments | 14 (3.8%) | 356 (96.2%) |
| 10 or more Apartments | 0 (0.0%) | 867 (100.0%) |
| Mobile Home / Other | 539 (74.9%) | 181 (25.1%) |
| Total | 4,670 (65.0%) | 2,511 (35.0%) |
Housing Structures by Number of Rooms in Dakota County
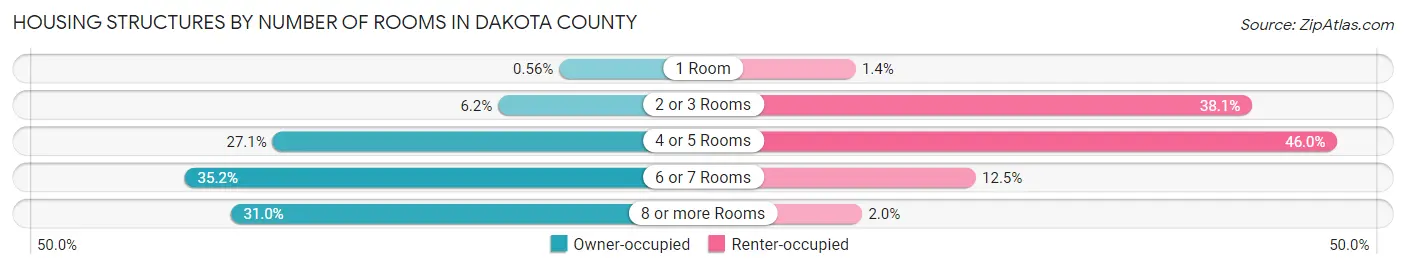
| Number of Rooms | Owner-occupied | Renter-occupied |
| 1 Room | 26 (0.6%) | 35 (1.4%) |
| 2 or 3 Rooms | 290 (6.2%) | 957 (38.1%) |
| 4 or 5 Rooms | 1,264 (27.1%) | 1,155 (46.0%) |
| 6 or 7 Rooms | 1,644 (35.2%) | 314 (12.5%) |
| 8 or more Rooms | 1,446 (31.0%) | 50 (2.0%) |
| Total | 4,670 (100.0%) | 2,511 (100.0%) |
Housing Structure by Heating Type in Dakota County
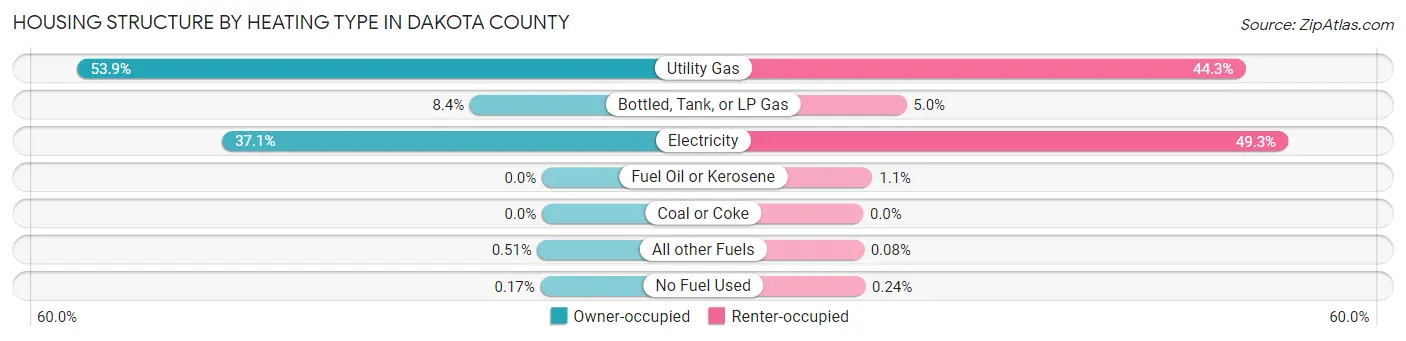
| Heating Type | Owner-occupied | Renter-occupied |
| Utility Gas | 2,515 (53.8%) | 1,113 (44.3%) |
| Bottled, Tank, or LP Gas | 390 (8.4%) | 126 (5.0%) |
| Electricity | 1,733 (37.1%) | 1,237 (49.3%) |
| Fuel Oil or Kerosene | 0 (0.0%) | 27 (1.1%) |
| Coal or Coke | 0 (0.0%) | 0 (0.0%) |
| All other Fuels | 24 (0.5%) | 2 (0.1%) |
| No Fuel Used | 8 (0.2%) | 6 (0.2%) |
| Total | 4,670 (100.0%) | 2,511 (100.0%) |
Household Vehicle Usage in Dakota County
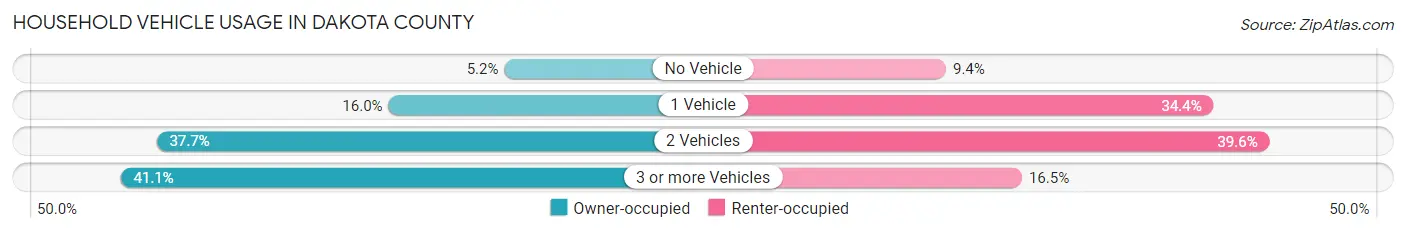
| Vehicles per Household | Owner-occupied | Renter-occupied |
| No Vehicle | 244 (5.2%) | 237 (9.4%) |
| 1 Vehicle | 749 (16.0%) | 864 (34.4%) |
| 2 Vehicles | 1,760 (37.7%) | 995 (39.6%) |
| 3 or more Vehicles | 1,917 (41.0%) | 415 (16.5%) |
| Total | 4,670 (100.0%) | 2,511 (100.0%) |
Real Estate & Mortgages in Dakota County
Real Estate and Mortgage Overview in Dakota County
| Characteristic | Without Mortgage | With Mortgage |
| Housing Units | 2,299 | 2,371 |
| Median Property Value | $142,600 | $171,200 |
| Median Household Income | $63,683 | $378 |
| Monthly Housing Costs | $573 | $51 |
| Real Estate Taxes | $2,362 | $205 |
Property Value by Mortgage Status in Dakota County
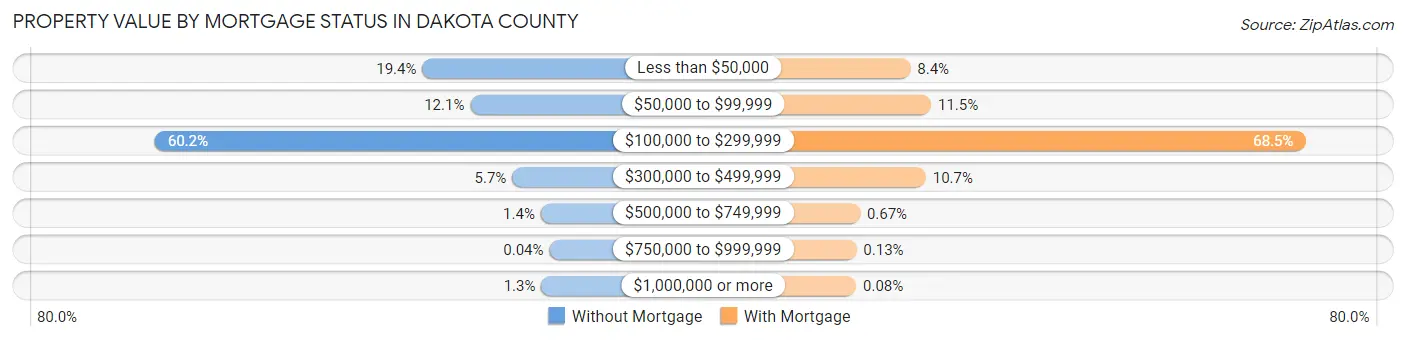
| Property Value | Without Mortgage | With Mortgage |
| Less than $50,000 | 446 (19.4%) | 198 (8.4%) |
| $50,000 to $99,999 | 278 (12.1%) | 273 (11.5%) |
| $100,000 to $299,999 | 1,383 (60.2%) | 1,625 (68.5%) |
| $300,000 to $499,999 | 131 (5.7%) | 254 (10.7%) |
| $500,000 to $749,999 | 31 (1.3%) | 16 (0.7%) |
| $750,000 to $999,999 | 1 (0.0%) | 3 (0.1%) |
| $1,000,000 or more | 29 (1.3%) | 2 (0.1%) |
| Total | 2,299 (100.0%) | 2,371 (100.0%) |
Household Income by Mortgage Status in Dakota County
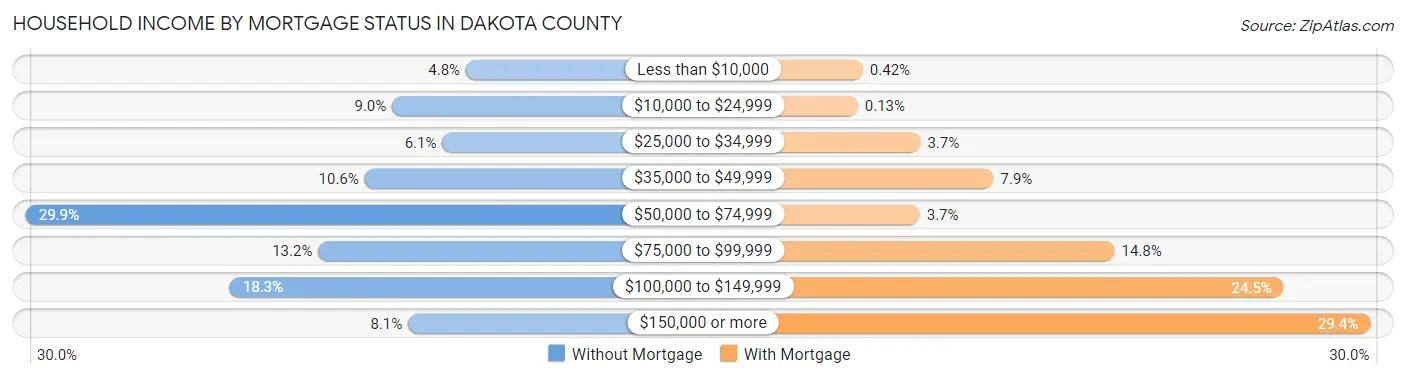
| Household Income | Without Mortgage | With Mortgage |
| Less than $10,000 | 110 (4.8%) | 10 (0.4%) |
| $10,000 to $24,999 | 207 (9.0%) | 3 (0.1%) |
| $25,000 to $34,999 | 141 (6.1%) | 88 (3.7%) |
| $35,000 to $49,999 | 243 (10.6%) | 187 (7.9%) |
| $50,000 to $74,999 | 688 (29.9%) | 87 (3.7%) |
| $75,000 to $99,999 | 304 (13.2%) | 351 (14.8%) |
| $100,000 to $149,999 | 420 (18.3%) | 580 (24.5%) |
| $150,000 or more | 186 (8.1%) | 697 (29.4%) |
| Total | 2,299 (100.0%) | 2,371 (100.0%) |
Property Value to Household Income Ratio in Dakota County
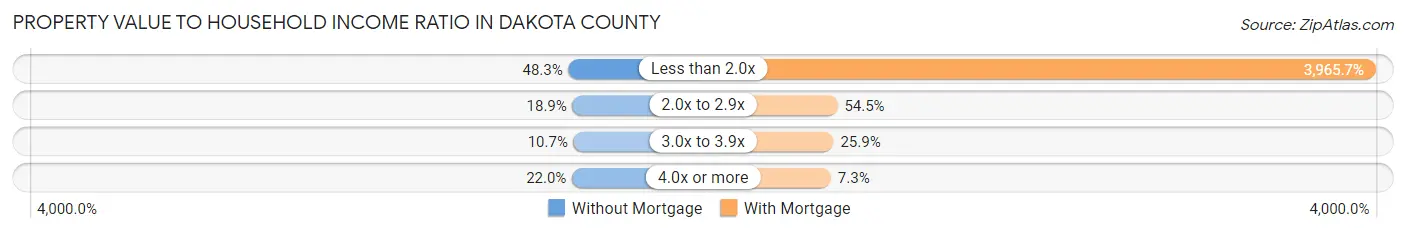
| Value-to-Income Ratio | Without Mortgage | With Mortgage |
| Less than 2.0x | 1,111 (48.3%) | 94,027 (3,965.7%) |
| 2.0x to 2.9x | 434 (18.9%) | 1,292 (54.5%) |
| 3.0x to 3.9x | 247 (10.7%) | 614 (25.9%) |
| 4.0x or more | 505 (22.0%) | 174 (7.3%) |
| Total | 2,299 (100.0%) | 2,371 (100.0%) |
Real Estate Taxes by Mortgage Status in Dakota County
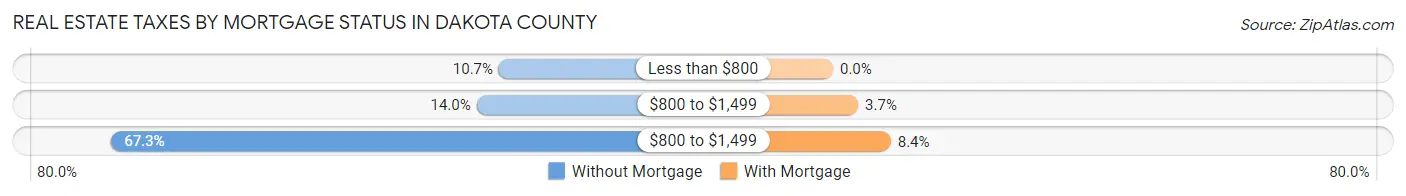
| Property Taxes | Without Mortgage | With Mortgage |
| Less than $800 | 246 (10.7%) | 0 (0.0%) |
| $800 to $1,499 | 321 (14.0%) | 87 (3.7%) |
| $800 to $1,499 | 1,548 (67.3%) | 200 (8.4%) |
| Total | 2,299 (100.0%) | 2,371 (100.0%) |
Health & Disability in Dakota County
Health Insurance Coverage by Age in Dakota County
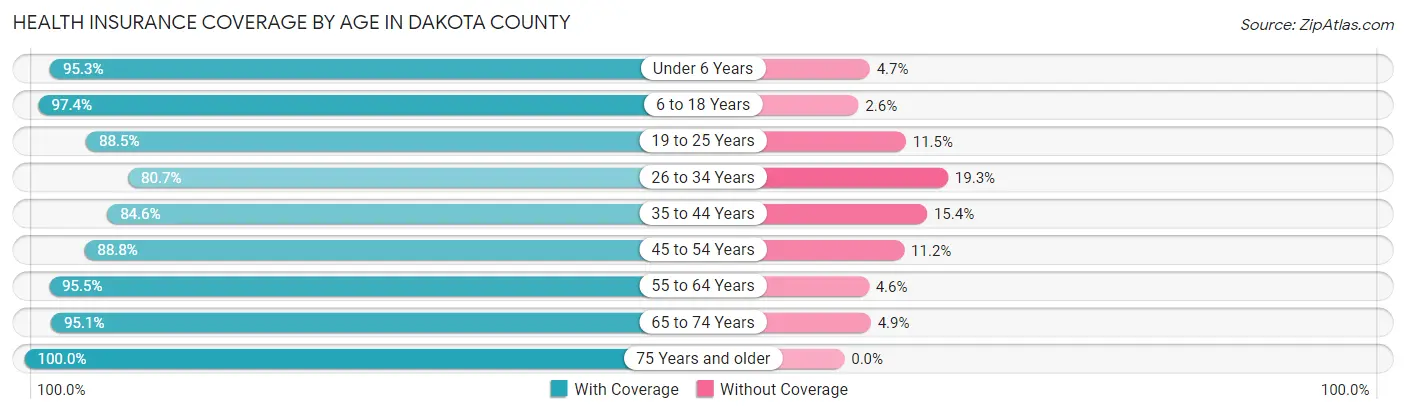
| Age Bracket | With Coverage | Without Coverage |
| Under 6 Years | 1,928 (95.3%) | 96 (4.7%) |
| 6 to 18 Years | 4,442 (97.4%) | 120 (2.6%) |
| 19 to 25 Years | 1,884 (88.5%) | 244 (11.5%) |
| 26 to 34 Years | 2,050 (80.7%) | 491 (19.3%) |
| 35 to 44 Years | 2,205 (84.6%) | 402 (15.4%) |
| 45 to 54 Years | 1,839 (88.8%) | 231 (11.2%) |
| 55 to 64 Years | 2,328 (95.5%) | 111 (4.5%) |
| 65 to 74 Years | 1,523 (95.1%) | 79 (4.9%) |
| 75 Years and older | 1,109 (100.0%) | 0 (0.0%) |
| Total | 19,308 (91.6%) | 1,774 (8.4%) |
Health Insurance Coverage by Citizenship Status in Dakota County
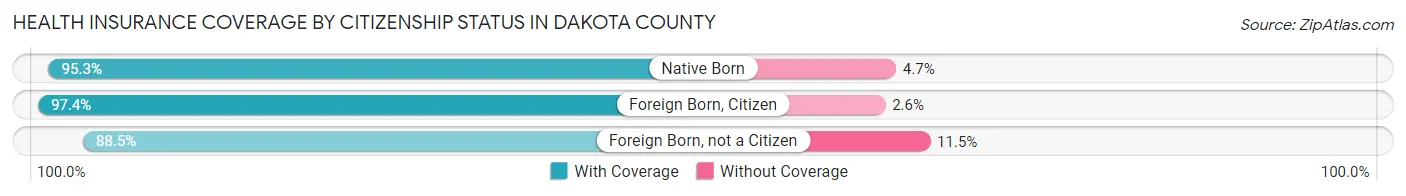
| Citizenship Status | With Coverage | Without Coverage |
| Native Born | 1,928 (95.3%) | 96 (4.7%) |
| Foreign Born, Citizen | 4,442 (97.4%) | 120 (2.6%) |
| Foreign Born, not a Citizen | 1,884 (88.5%) | 244 (11.5%) |
Health Insurance Coverage by Household Income in Dakota County
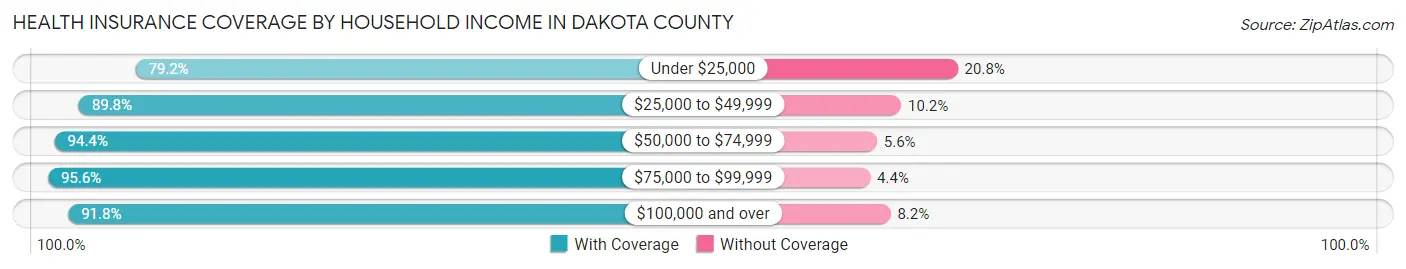
| Household Income | With Coverage | Without Coverage |
| Under $25,000 | 1,316 (79.2%) | 345 (20.8%) |
| $25,000 to $49,999 | 3,541 (89.8%) | 401 (10.2%) |
| $50,000 to $74,999 | 3,652 (94.4%) | 218 (5.6%) |
| $75,000 to $99,999 | 3,512 (95.6%) | 161 (4.4%) |
| $100,000 and over | 7,273 (91.8%) | 648 (8.2%) |
Public vs Private Health Insurance Coverage by Age in Dakota County
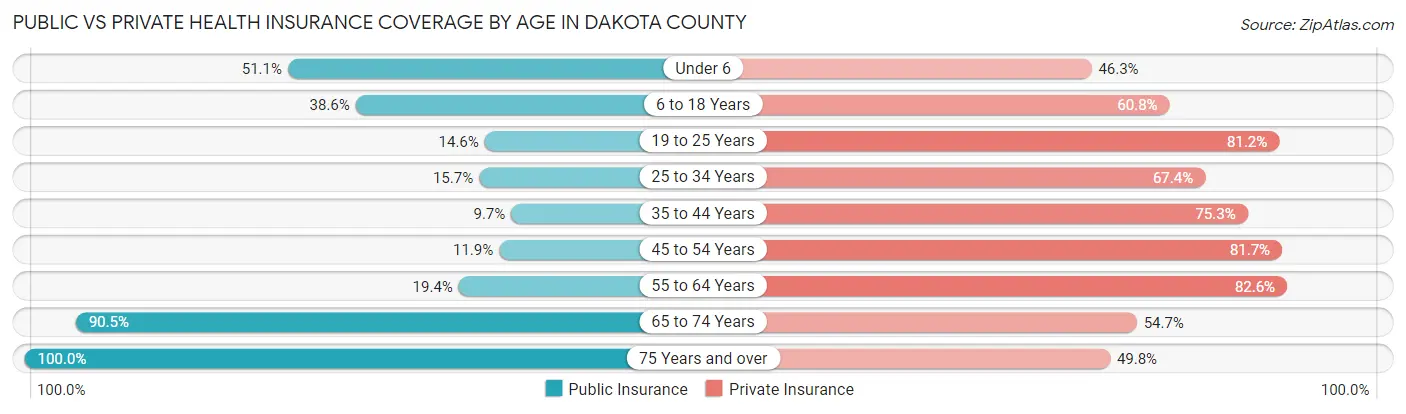
| Age Bracket | Public Insurance | Private Insurance |
| Under 6 | 1,035 (51.1%) | 938 (46.3%) |
| 6 to 18 Years | 1,759 (38.6%) | 2,774 (60.8%) |
| 19 to 25 Years | 311 (14.6%) | 1,727 (81.2%) |
| 25 to 34 Years | 398 (15.7%) | 1,713 (67.4%) |
| 35 to 44 Years | 253 (9.7%) | 1,963 (75.3%) |
| 45 to 54 Years | 247 (11.9%) | 1,691 (81.7%) |
| 55 to 64 Years | 474 (19.4%) | 2,015 (82.6%) |
| 65 to 74 Years | 1,450 (90.5%) | 877 (54.7%) |
| 75 Years and over | 1,109 (100.0%) | 552 (49.8%) |
| Total | 7,036 (33.4%) | 14,250 (67.6%) |
Disability Status by Sex by Age in Dakota County
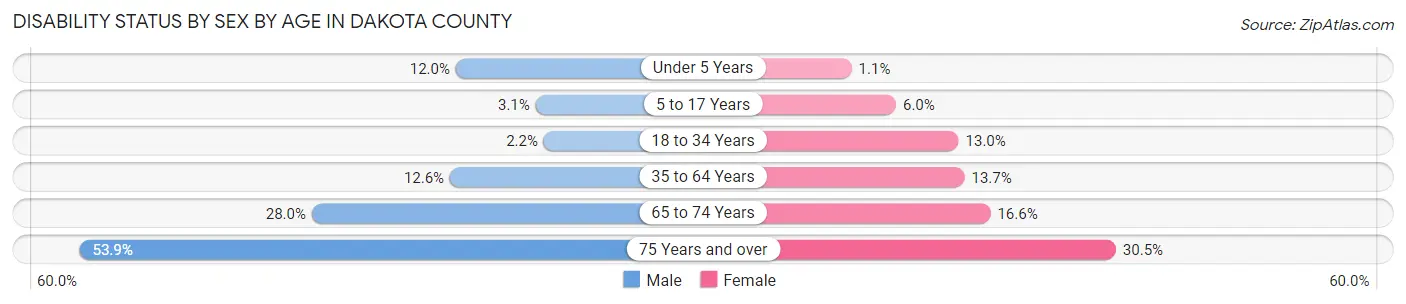
| Age Bracket | Male | Female |
| Under 5 Years | 100 (12.0%) | 10 (1.1%) |
| 5 to 17 Years | 68 (3.1%) | 136 (6.0%) |
| 18 to 34 Years | 51 (2.2%) | 354 (13.0%) |
| 35 to 64 Years | 483 (12.6%) | 450 (13.7%) |
| 65 to 74 Years | 195 (28.0%) | 150 (16.6%) |
| 75 Years and over | 264 (53.9%) | 189 (30.5%) |
Disability Class by Sex by Age in Dakota County
Disability Class: Hearing Difficulty
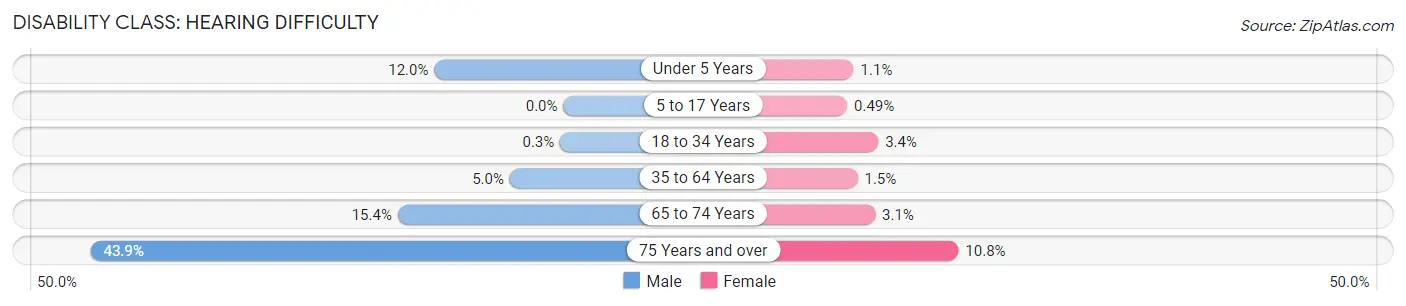
| Age Bracket | Male | Female |
| Under 5 Years | 100 (12.0%) | 10 (1.1%) |
| 5 to 17 Years | 0 (0.0%) | 11 (0.5%) |
| 18 to 34 Years | 7 (0.3%) | 92 (3.4%) |
| 35 to 64 Years | 190 (5.0%) | 48 (1.5%) |
| 65 to 74 Years | 107 (15.4%) | 28 (3.1%) |
| 75 Years and over | 215 (43.9%) | 67 (10.8%) |
Disability Class: Vision Difficulty
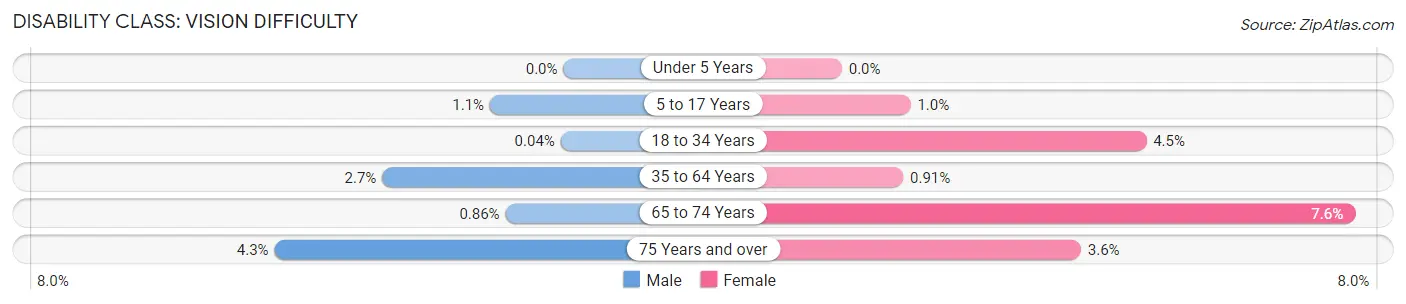
| Age Bracket | Male | Female |
| Under 5 Years | 0 (0.0%) | 0 (0.0%) |
| 5 to 17 Years | 24 (1.1%) | 23 (1.0%) |
| 18 to 34 Years | 1 (0.0%) | 123 (4.5%) |
| 35 to 64 Years | 103 (2.7%) | 30 (0.9%) |
| 65 to 74 Years | 6 (0.9%) | 69 (7.6%) |
| 75 Years and over | 21 (4.3%) | 22 (3.5%) |
Disability Class: Cognitive Difficulty
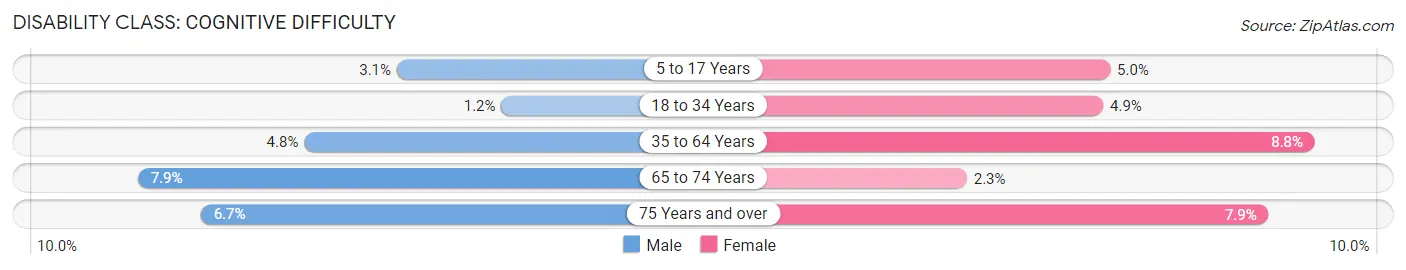
| Age Bracket | Male | Female |
| 5 to 17 Years | 68 (3.1%) | 112 (5.0%) |
| 18 to 34 Years | 27 (1.1%) | 132 (4.9%) |
| 35 to 64 Years | 184 (4.8%) | 289 (8.8%) |
| 65 to 74 Years | 55 (7.9%) | 21 (2.3%) |
| 75 Years and over | 33 (6.7%) | 49 (7.9%) |
Disability Class: Ambulatory Difficulty
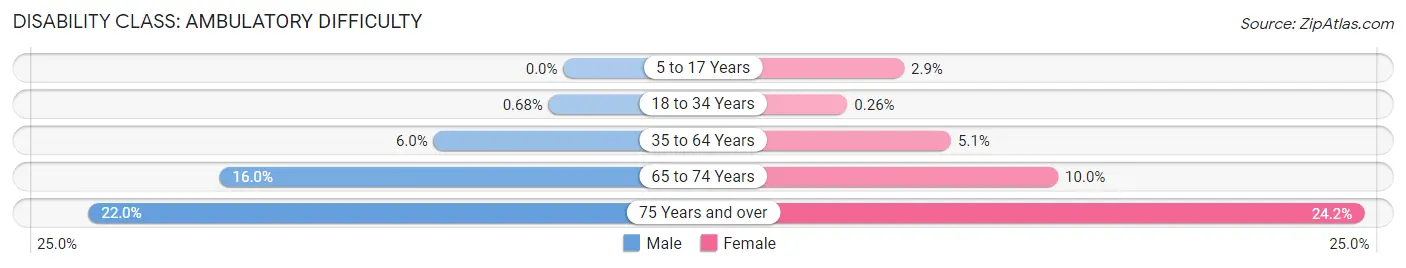
| Age Bracket | Male | Female |
| 5 to 17 Years | 0 (0.0%) | 65 (2.9%) |
| 18 to 34 Years | 16 (0.7%) | 7 (0.3%) |
| 35 to 64 Years | 230 (6.0%) | 167 (5.1%) |
| 65 to 74 Years | 111 (16.0%) | 91 (10.0%) |
| 75 Years and over | 108 (22.0%) | 150 (24.2%) |
Disability Class: Self-Care Difficulty
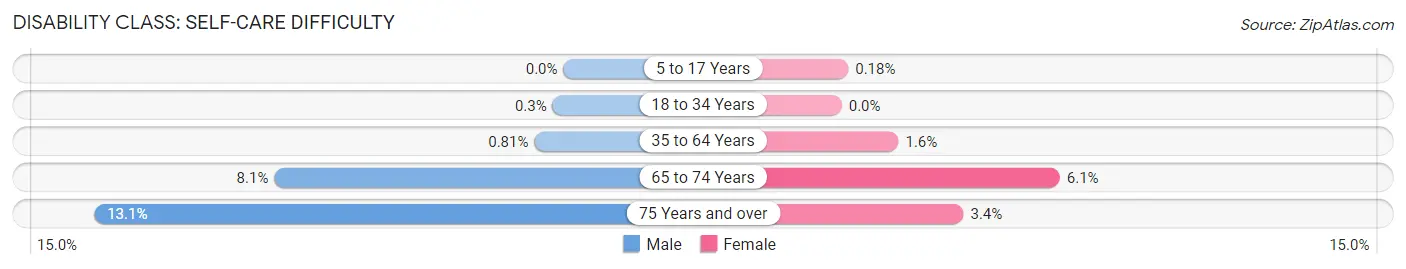
| Age Bracket | Male | Female |
| 5 to 17 Years | 0 (0.0%) | 4 (0.2%) |
| 18 to 34 Years | 7 (0.3%) | 0 (0.0%) |
| 35 to 64 Years | 31 (0.8%) | 52 (1.6%) |
| 65 to 74 Years | 56 (8.1%) | 55 (6.1%) |
| 75 Years and over | 64 (13.1%) | 21 (3.4%) |
Technology Access in Dakota County
Computing Device Access in Dakota County
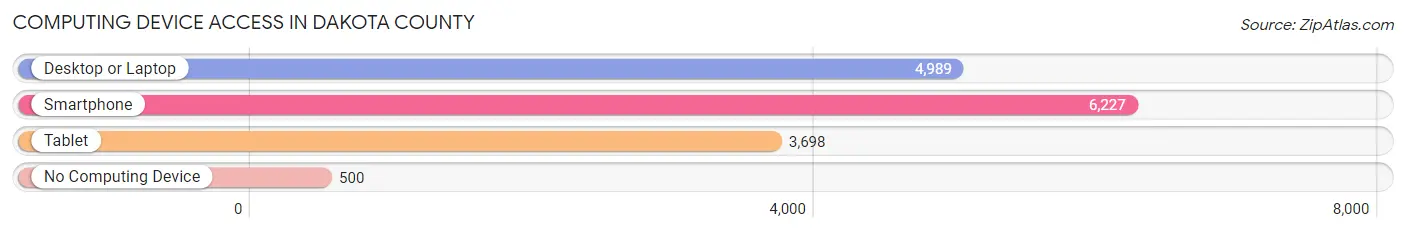
| Device Type | # Households | % Households |
| Desktop or Laptop | 4,989 | 69.5% |
| Smartphone | 6,227 | 86.7% |
| Tablet | 3,698 | 51.5% |
| No Computing Device | 500 | 7.0% |
| Total | 7,181 | 100.0% |
Internet Access in Dakota County
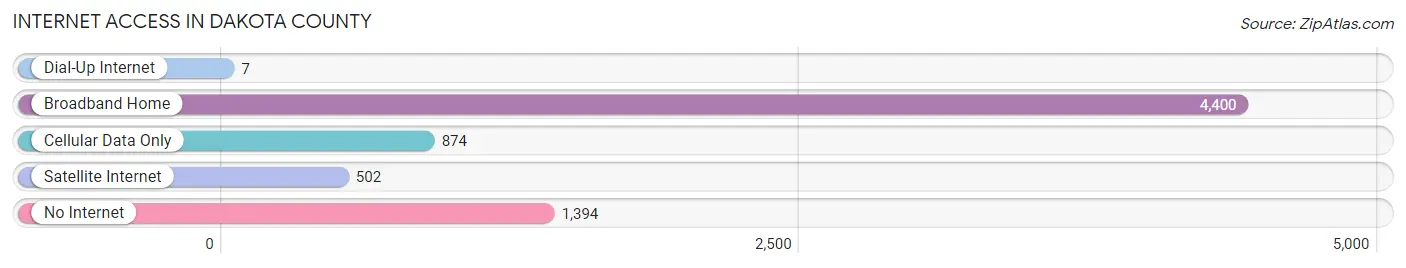
| Internet Type | # Households | % Households |
| Dial-Up Internet | 7 | 0.1% |
| Broadband Home | 4,400 | 61.3% |
| Cellular Data Only | 874 | 12.2% |
| Satellite Internet | 502 | 7.0% |
| No Internet | 1,394 | 19.4% |
| Total | 7,181 | 100.0% |
Dakota County Summary
Dakota County is located in the northeastern corner of Nebraska, and is bordered by South Dakota to the north, Iowa to the east, and the Missouri River to the south. The county seat is Dakota City, and the county is part of the Sioux City, IA-NE-SD Metropolitan Statistical Area. As of the 2010 census, the population of Dakota County was 21,006, making it the fourth most populous county in Nebraska.
History
Dakota County was established in 1855, and was named after the Dakota Sioux Native American tribe. The county was originally part of the Nebraska Territory, and was one of the original nine counties established in the territory. The county was originally much larger than it is today, and included parts of what are now Burt, Thurston, and Dixon counties.
The first settlers in Dakota County were mostly of German and Scandinavian descent, and they established small farms and ranches in the area. The county was largely rural until the late 19th century, when the railroad was built through the area. This brought an influx of new settlers, and the county began to develop more rapidly.
Geography
Dakota County is located in the northeastern corner of Nebraska, and is bordered by South Dakota to the north, Iowa to the east, and the Missouri River to the south. The county has a total area of 576 square miles, of which 574 square miles is land and 2 square miles is water. The county is mostly flat, with some rolling hills in the western part of the county. The county is drained by the Big Sioux River, which flows through the county from north to south.
Economy
Dakota County is largely rural, and the economy is based on agriculture and related industries. The county is home to several large farms and ranches, and the main crops grown in the county are corn, soybeans, and wheat. The county is also home to several food processing plants, as well as a number of manufacturing companies.
The county is also home to several tourist attractions, including the Dakota County Historical Museum, the Dakota County Fairgrounds, and the Dakota County Speedway.
Demographics
As of the 2010 census, there were 21,006 people, 7,845 households, and 5,717 families residing in the county. The population density was 36.5 people per square mile. There were 8,541 housing units at an average density of 14.8 per square mile. The racial makeup of the county was 94.2% White, 0.7% Black or African American, 0.5% Native American, 0.3% Asian, 0.1% Pacific Islander, 2.7% from other races, and 1.5% from two or more races. Hispanic or Latino of any race were 5.2% of the population.
There were 7,845 households, out of which 33.2% had children under the age of 18 living with them, 57.2% were married couples living together, 8.7% had a female householder with no husband present, and 29.7% were non-families. 25.2% of all households were made up of individuals, and 11.3% had someone living alone who was 65 years of age or older. The average household size was 2.60 and the average family size was 3.12.
In the county, the population was spread out, with 27.2% under the age of 18, 7.7% from 18 to 24, 25.7% from 25 to 44, 24.2% from 45 to 64, and 15.2% who were 65 years of age or older. The median age was 38 years. For every 100 females, there were 97.2 males. For every 100 females age 18 and over, there were 94.2 males.
The median income for a household in the county was $41,945, and the median income for a family was $50,845. Males had a median income of $35,945 versus $25,845 for females. The per capita income for the county was $20,845. About 6.2% of families and 8.7% of the population were below the poverty line, including 10.2% of those under age 18 and 8.2% of those age 65 or over.
Common Questions
What is the Total Population of Dakota County?
Total Population of Dakota County is 21,308.
What is the Total Male Population of Dakota County?
Total Male Population of Dakota County is 10,530.
What is the Total Female Population of Dakota County?
Total Female Population of Dakota County is 10,778.
What is the Ratio of Males per 100 Females in Dakota County?
There are 97.70 Males per 100 Females in Dakota County.
What is the Ratio of Females per 100 Males in Dakota County?
There are 102.36 Females per 100 Males in Dakota County.
What is the Median Population Age in Dakota County?
Median Population Age in Dakota County is 31.7 Years.
What is the Average Family Size in Dakota County
Average Family Size in Dakota County is 3.6 People.
What is the Average Household Size in Dakota County
Average Household Size in Dakota County is 2.9 People.
What is Per Capita Income in Dakota County?
Per Capita income in Dakota County is $29,584.
What is the Median Family Income in Dakota County?
Median Family Income in Dakota County is $82,607.
What is the Median Household income in Dakota County?
Median Household Income in Dakota County is $66,112.
What is Income or Wage Gap in Dakota County?
Income or Wage Gap in Dakota County is 37.8%.
Women in Dakota County earn 62.2 cents for every dollar earned by a man.
What is Family Income Deficit in Dakota County?
Family Income Deficit in Dakota County is $10,287.
Families that are below poverty line in Dakota County earn $10,287 less on average than the poverty threshold level.
What is Inequality or Gini Index in Dakota County?
Inequality or Gini Index in Dakota County is 0.41.
How Large is the Labor Force in Dakota County?
There are 10,900 People in the Labor Forcein in Dakota County.
What is the Percentage of People in the Labor Force in Dakota County?
69.9% of People are in the Labor Force in Dakota County.
What is the Unemployment Rate in Dakota County?
Unemployment Rate in Dakota County is 3.0%.