Cuming County, NE
Cuming County Map
Cuming County Overview
9,000
TOTAL POPULATION
4,582
MALE POPULATION
4,418
FEMALE POPULATION
103.71
MALES / 100 FEMALES
96.42
FEMALES / 100 MALES
41.8
MEDIAN AGE
3.0
AVG FAMILY SIZE
2.4
AVG HOUSEHOLD SIZE
$34,825
PER CAPITA INCOME
$83,687
AVG FAMILY INCOME
$68,917
AVG HOUSEHOLD INCOME
38.7%
WAGE / INCOME GAP [ % ]
61.3¢/ $1
WAGE / INCOME GAP [ $ ]
0.40
INEQUALITY / GINI INDEX
4,821
LABOR FORCE [ PEOPLE ]
68.0%
PERCENT IN LABOR FORCE
2.6%
UNEMPLOYMENT RATE
Cuming County Area Codes
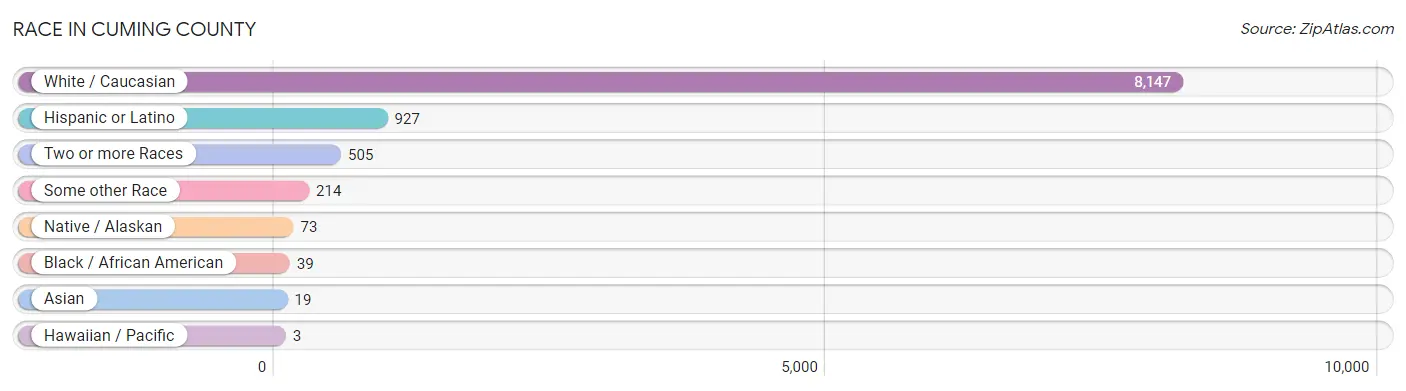
Race in Cuming County
The most populous races in Cuming County are White / Caucasian (8,147 | 90.5%), Hispanic or Latino (927 | 10.3%), and Two or more Races (505 | 5.6%).
| Race | # Population | % Population |
| Asian | 19 | 0.2% |
| Black / African American | 39 | 0.4% |
| Hawaiian / Pacific | 3 | 0.0% |
| Hispanic or Latino | 927 | 10.3% |
| Native / Alaskan | 73 | 0.8% |
| White / Caucasian | 8,147 | 90.5% |
| Two or more Races | 505 | 5.6% |
| Some other Race | 214 | 2.4% |
| Total | 9,000 | 100.0% |
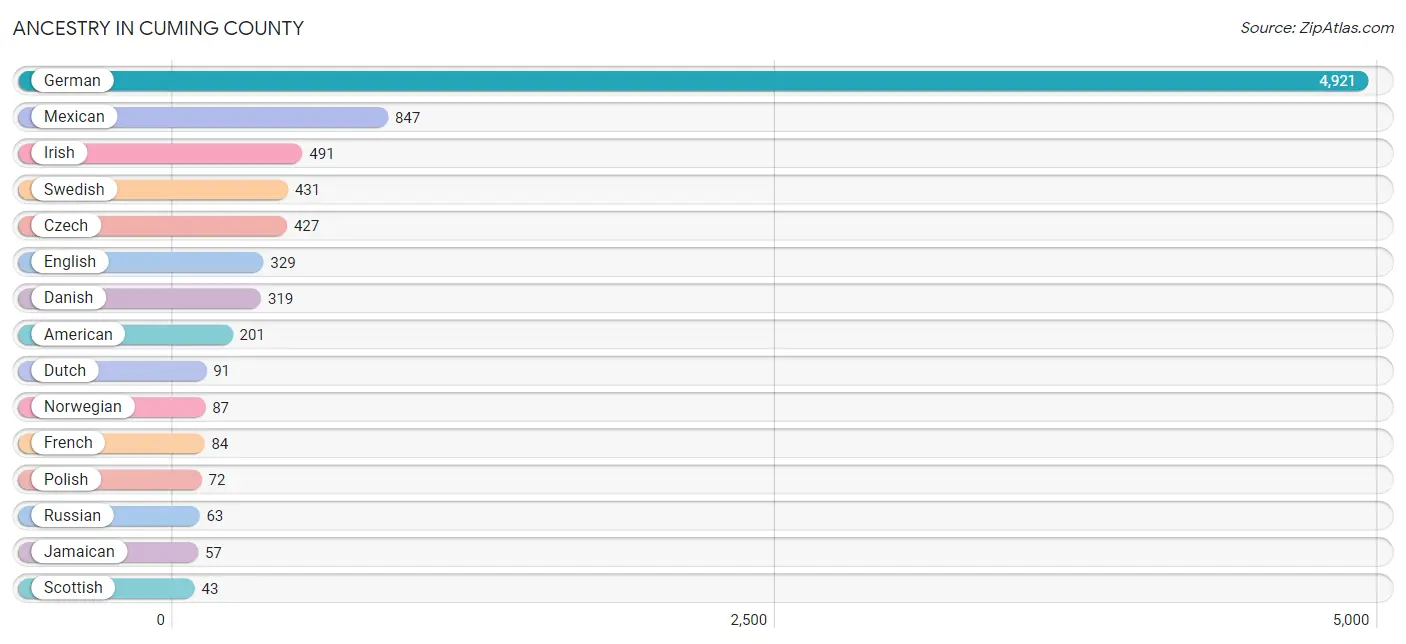
Ancestry in Cuming County
The most populous ancestries reported in Cuming County are German (4,921 | 54.7%), Mexican (847 | 9.4%), Irish (491 | 5.5%), Swedish (431 | 4.8%), and Czech (427 | 4.7%), together accounting for 79.1% of all Cuming County residents.
| Ancestry | # Population | % Population |
| American | 201 | 2.2% |
| Arab | 3 | 0.0% |
| Austrian | 18 | 0.2% |
| British | 18 | 0.2% |
| Cheyenne | 7 | 0.1% |
| Creek | 6 | 0.1% |
| Czech | 427 | 4.7% |
| Danish | 319 | 3.5% |
| Dutch | 91 | 1.0% |
| Eastern European | 2 | 0.0% |
| English | 329 | 3.7% |
| European | 18 | 0.2% |
| Finnish | 5 | 0.1% |
| French | 84 | 0.9% |
| French Canadian | 9 | 0.1% |
| German | 4,921 | 54.7% |
| Guamanian / Chamorro | 4 | 0.0% |
| Irish | 491 | 5.5% |
| Italian | 26 | 0.3% |
| Jamaican | 57 | 0.6% |
| Korean | 8 | 0.1% |
| Lebanese | 2 | 0.0% |
| Luxembourger | 18 | 0.2% |
| Malaysian | 7 | 0.1% |
| Mexican | 847 | 9.4% |
| Mexican American Indian | 30 | 0.3% |
| Native Hawaiian | 4 | 0.0% |
| Norwegian | 87 | 1.0% |
| Polish | 72 | 0.8% |
| Puerto Rican | 7 | 0.1% |
| Russian | 63 | 0.7% |
| Scandinavian | 10 | 0.1% |
| Scotch-Irish | 17 | 0.2% |
| Scottish | 43 | 0.5% |
| Sioux | 2 | 0.0% |
| Spanish | 8 | 0.1% |
| Spanish American Indian | 18 | 0.2% |
| Swedish | 431 | 4.8% |
| Swiss | 21 | 0.2% |
| Syrian | 1 | 0.0% |
| Thai | 6 | 0.1% |
| Welsh | 37 | 0.4% | View All 42 Rows |
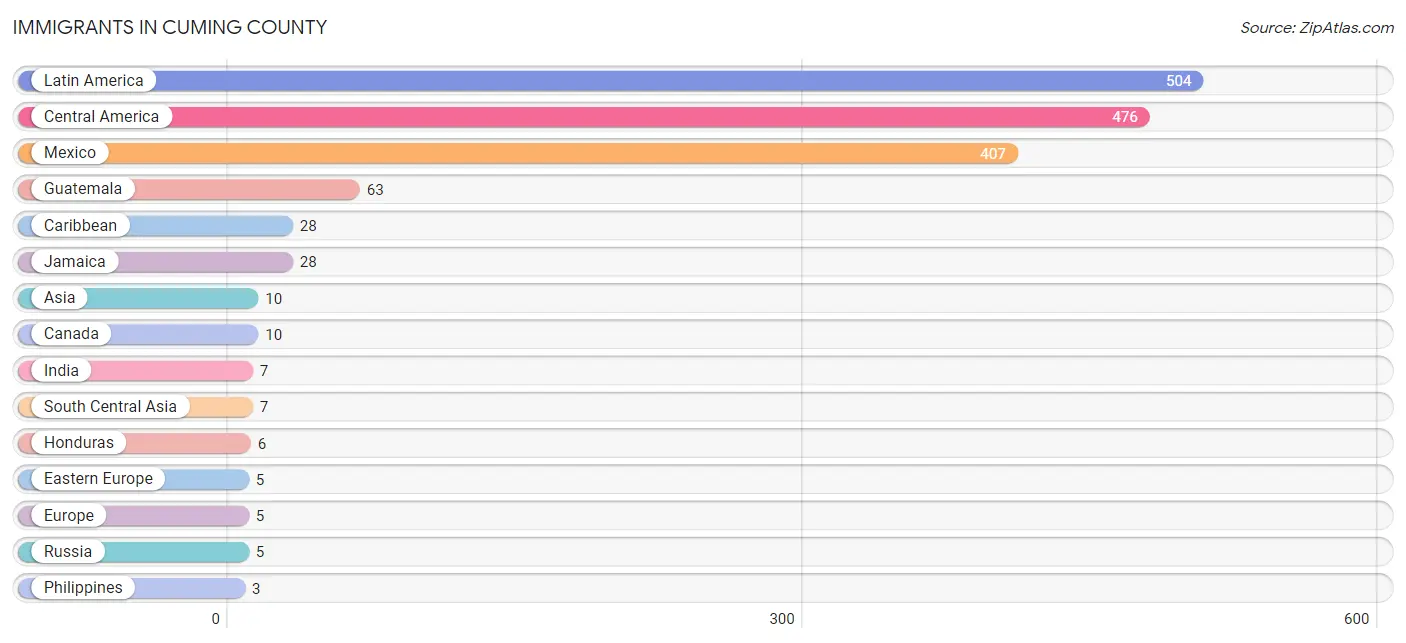
Immigrants in Cuming County
The most numerous immigrant groups reported in Cuming County came from Latin America (504 | 5.6%), Central America (476 | 5.3%), Mexico (407 | 4.5%), Guatemala (63 | 0.7%), and Caribbean (28 | 0.3%), together accounting for 16.4% of all Cuming County residents.
| Immigration Origin | # Population | % Population |
| Asia | 10 | 0.1% |
| Canada | 10 | 0.1% |
| Caribbean | 28 | 0.3% |
| Central America | 476 | 5.3% |
| Eastern Europe | 5 | 0.1% |
| Europe | 5 | 0.1% |
| Guatemala | 63 | 0.7% |
| Honduras | 6 | 0.1% |
| India | 7 | 0.1% |
| Jamaica | 28 | 0.3% |
| Latin America | 504 | 5.6% |
| Mexico | 407 | 4.5% |
| Philippines | 3 | 0.0% |
| Russia | 5 | 0.1% |
| South Central Asia | 7 | 0.1% |
| South Eastern Asia | 3 | 0.0% | View All 16 Rows |
Sex and Age in Cuming County
Sex and Age in Cuming County
The most populous age groups in Cuming County are 55 to 59 Years (376 | 8.2%) for men and 5 to 9 Years (323 | 7.3%) for women.
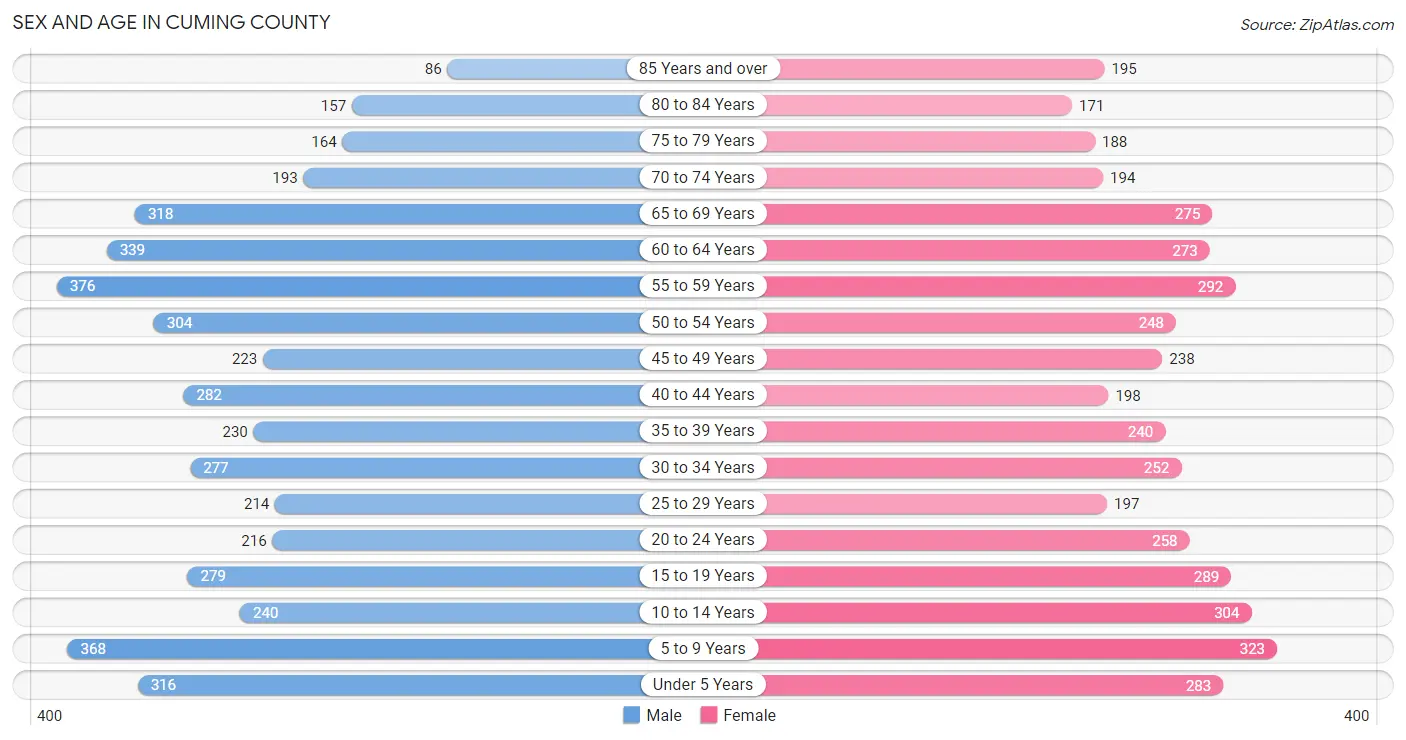
| Age Bracket | Male | Female |
| Under 5 Years | 316 (6.9%) | 283 (6.4%) |
| 5 to 9 Years | 368 (8.0%) | 323 (7.3%) |
| 10 to 14 Years | 240 (5.2%) | 304 (6.9%) |
| 15 to 19 Years | 279 (6.1%) | 289 (6.5%) |
| 20 to 24 Years | 216 (4.7%) | 258 (5.8%) |
| 25 to 29 Years | 214 (4.7%) | 197 (4.5%) |
| 30 to 34 Years | 277 (6.0%) | 252 (5.7%) |
| 35 to 39 Years | 230 (5.0%) | 240 (5.4%) |
| 40 to 44 Years | 282 (6.1%) | 198 (4.5%) |
| 45 to 49 Years | 223 (4.9%) | 238 (5.4%) |
| 50 to 54 Years | 304 (6.6%) | 248 (5.6%) |
| 55 to 59 Years | 376 (8.2%) | 292 (6.6%) |
| 60 to 64 Years | 339 (7.4%) | 273 (6.2%) |
| 65 to 69 Years | 318 (6.9%) | 275 (6.2%) |
| 70 to 74 Years | 193 (4.2%) | 194 (4.4%) |
| 75 to 79 Years | 164 (3.6%) | 188 (4.3%) |
| 80 to 84 Years | 157 (3.4%) | 171 (3.9%) |
| 85 Years and over | 86 (1.9%) | 195 (4.4%) |
| Total | 4,582 (100.0%) | 4,418 (100.0%) |
Families and Households in Cuming County
Median Family Size in Cuming County
The median family size in Cuming County is 3.00 persons per family, with single female/mother families (148 | 6.2%) accounting for the largest median family size of 3.22 persons per family. On the other hand, single male/father families (119 | 5.0%) represent the smallest median family size with 2.89 persons per family.
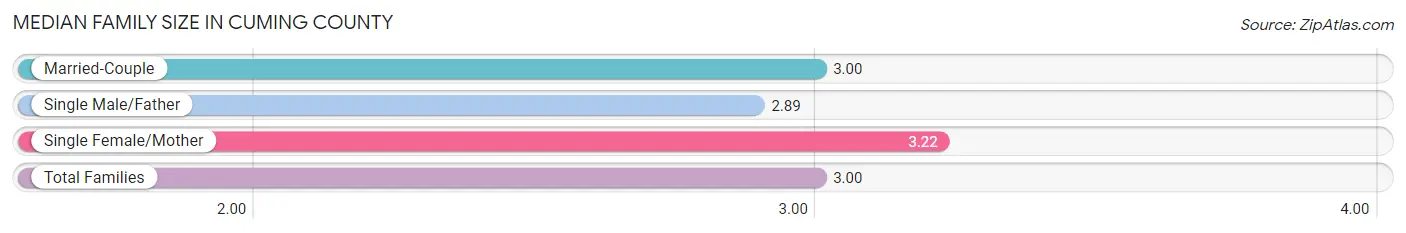
| Family Type | # Families | Family Size |
| Married-Couple | 2,112 (88.8%) | 3.00 |
| Single Male/Father | 119 (5.0%) | 2.89 |
| Single Female/Mother | 148 (6.2%) | 3.22 |
| Total Families | 2,379 (100.0%) | 3.00 |
Median Household Size in Cuming County
The median household size in Cuming County is 2.39 persons per household, with single male/father households (119 | 3.2%) accounting for the largest median household size of 3.67 persons per household. non-family households (1,332 | 35.9%) represent the smallest median household size with 1.17 persons per household.
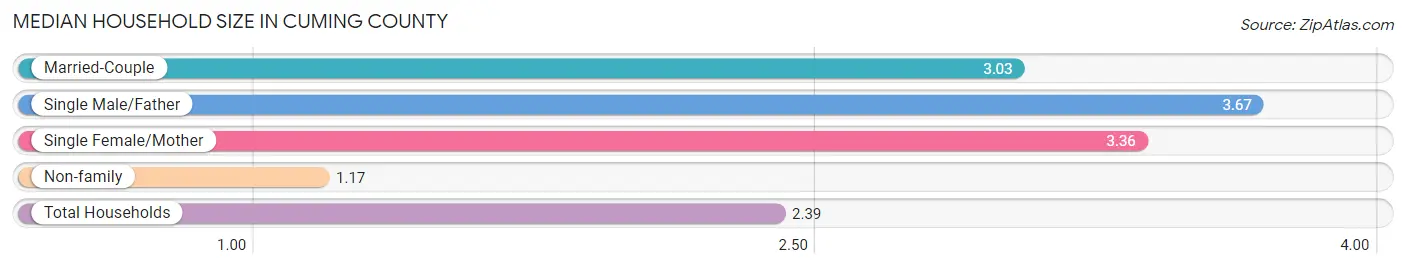
| Household Type | # Households | Household Size |
| Married-Couple | 2,112 (56.9%) | 3.03 |
| Single Male/Father | 119 (3.2%) | 3.67 |
| Single Female/Mother | 148 (4.0%) | 3.36 |
| Non-family | 1,332 (35.9%) | 1.17 |
| Total Households | 3,711 (100.0%) | 2.39 |
Household Size by Marriage Status in Cuming County
Out of a total of 3,711 households in Cuming County, 2,379 (64.1%) are family households, while 1,332 (35.9%) are nonfamily households. The most numerous type of family households are 2-person households, comprising 1,252, and the most common type of nonfamily households are 1-person households, comprising 1,147.
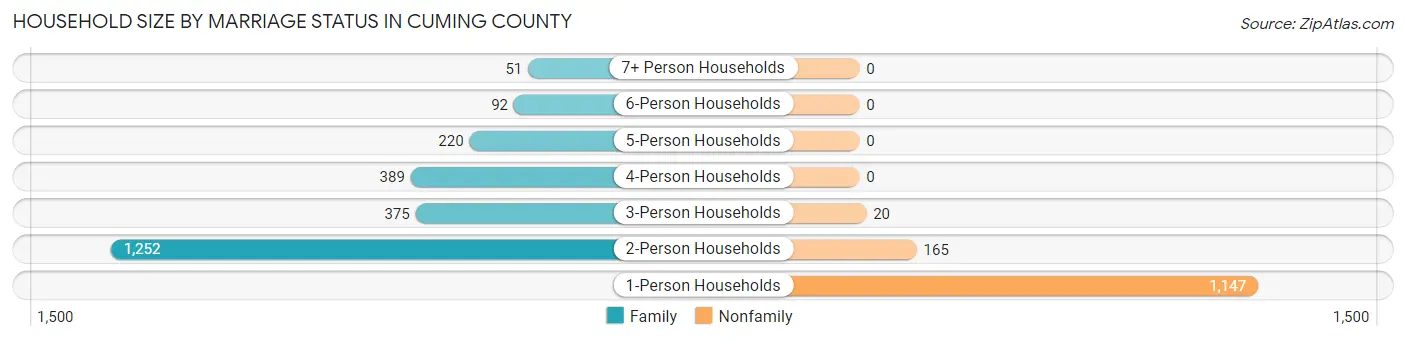
| Household Size | Family Households | Nonfamily Households |
| 1-Person Households | - | 1,147 (30.9%) |
| 2-Person Households | 1,252 (33.7%) | 165 (4.4%) |
| 3-Person Households | 375 (10.1%) | 20 (0.5%) |
| 4-Person Households | 389 (10.5%) | 0 (0.0%) |
| 5-Person Households | 220 (5.9%) | 0 (0.0%) |
| 6-Person Households | 92 (2.5%) | 0 (0.0%) |
| 7+ Person Households | 51 (1.4%) | 0 (0.0%) |
| Total | 2,379 (64.1%) | 1,332 (35.9%) |
Female Fertility in Cuming County
Fertility by Age in Cuming County
Average fertility rate in Cuming County is 58.0 births per 1,000 women. Women in the age bracket of 20 to 34 years have the highest fertility rate with 83.0 births per 1,000 women. Women in the age bracket of 20 to 34 years acount for 59.6% of all women with births.
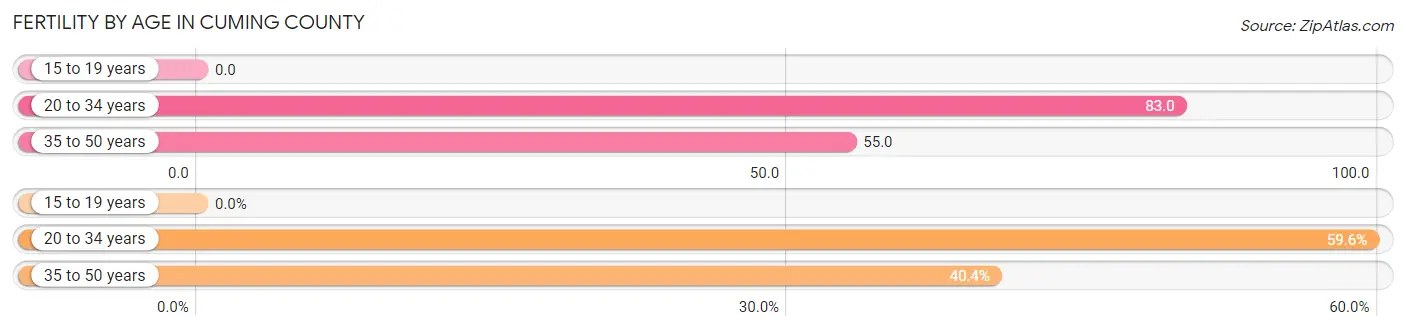
| Age Bracket | Women with Births | Births / 1,000 Women |
| 15 to 19 years | 0 (0.0%) | 0.0 |
| 20 to 34 years | 59 (59.6%) | 83.0 |
| 35 to 50 years | 40 (40.4%) | 55.0 |
| Total | 99 (100.0%) | 58.0 |
Fertility by Age by Marriage Status in Cuming County
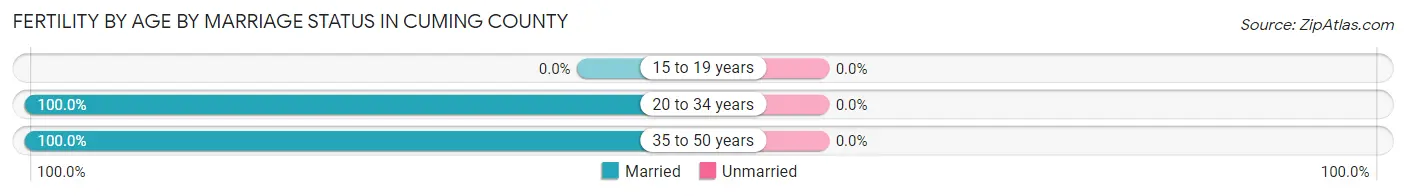
| Age Bracket | Married | Unmarried |
| 15 to 19 years | 0 (0.0%) | 0 (0.0%) |
| 20 to 34 years | 59 (100.0%) | 0 (0.0%) |
| 35 to 50 years | 40 (100.0%) | 0 (0.0%) |
| Total | 99 (100.0%) | 0 (0.0%) |
Fertility by Education in Cuming County
Average fertility rate in Cuming County is 58.0 births per 1,000 women. Women with the education attainment of graduate degree have the highest fertility rate of 140.0 births per 1,000 women, while women with the education attainment of less than high school have the lowest fertility at 9.0 births per 1,000 women. Women with the education attainment of bachelor's degree represent 32.3% of all women with births.
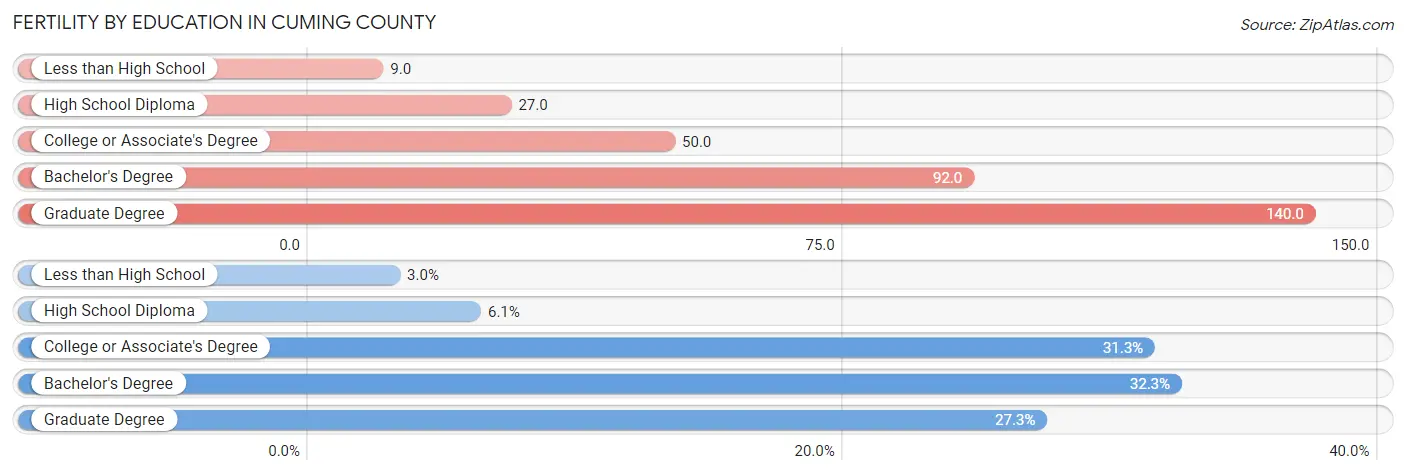
| Educational Attainment | Women with Births | Births / 1,000 Women |
| Less than High School | 3 (3.0%) | 9.0 |
| High School Diploma | 6 (6.1%) | 27.0 |
| College or Associate's Degree | 31 (31.3%) | 50.0 |
| Bachelor's Degree | 32 (32.3%) | 92.0 |
| Graduate Degree | 27 (27.3%) | 140.0 |
| Total | 99 (100.0%) | 58.0 |
Fertility by Education by Marriage Status in Cuming County
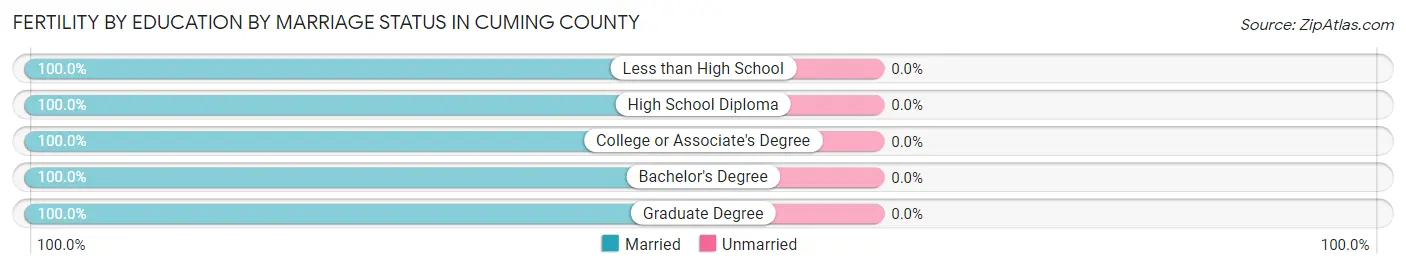
| Educational Attainment | Married | Unmarried |
| Less than High School | 3 (100.0%) | 0 (0.0%) |
| High School Diploma | 6 (100.0%) | 0 (0.0%) |
| College or Associate's Degree | 31 (100.0%) | 0 (0.0%) |
| Bachelor's Degree | 32 (100.0%) | 0 (0.0%) |
| Graduate Degree | 27 (100.0%) | 0 (0.0%) |
| Total | 99 (100.0%) | 0 (0.0%) |
Income in Cuming County
Income Overview in Cuming County
Per Capita Income in Cuming County is $34,825, while median incomes of families and households are $83,687 and $68,917 respectively.
| Characteristic | Number | Measure |
| Per Capita Income | 9,000 | $34,825 |
| Median Family Income | 2,379 | $83,687 |
| Mean Family Income | 2,379 | $100,803 |
| Median Household Income | 3,711 | $68,917 |
| Mean Household Income | 3,711 | $83,313 |
| Income Deficit | 2,379 | $0 |
| Wage / Income Gap (%) | 9,000 | 38.74% |
| Wage / Income Gap ($) | 9,000 | 61.26¢ per $1 |
| Gini / Inequality Index | 9,000 | 0.40 |
Earnings by Sex in Cuming County
Average Earnings in Cuming County are $41,132, $50,701 for men and $31,058 for women, a difference of 38.7%.
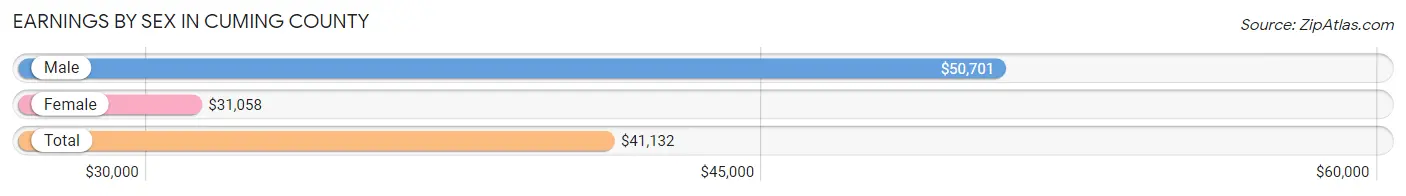
| Sex | Number | Average Earnings |
| Male | 2,785 (55.1%) | $50,701 |
| Female | 2,266 (44.9%) | $31,058 |
| Total | 5,051 (100.0%) | $41,132 |
Earnings by Sex by Income Bracket in Cuming County
The most common earnings brackets in Cuming County are $55,000 to $64,999 for men (411 | 14.8%) and $30,000 to $34,999 for women (226 | 10.0%).
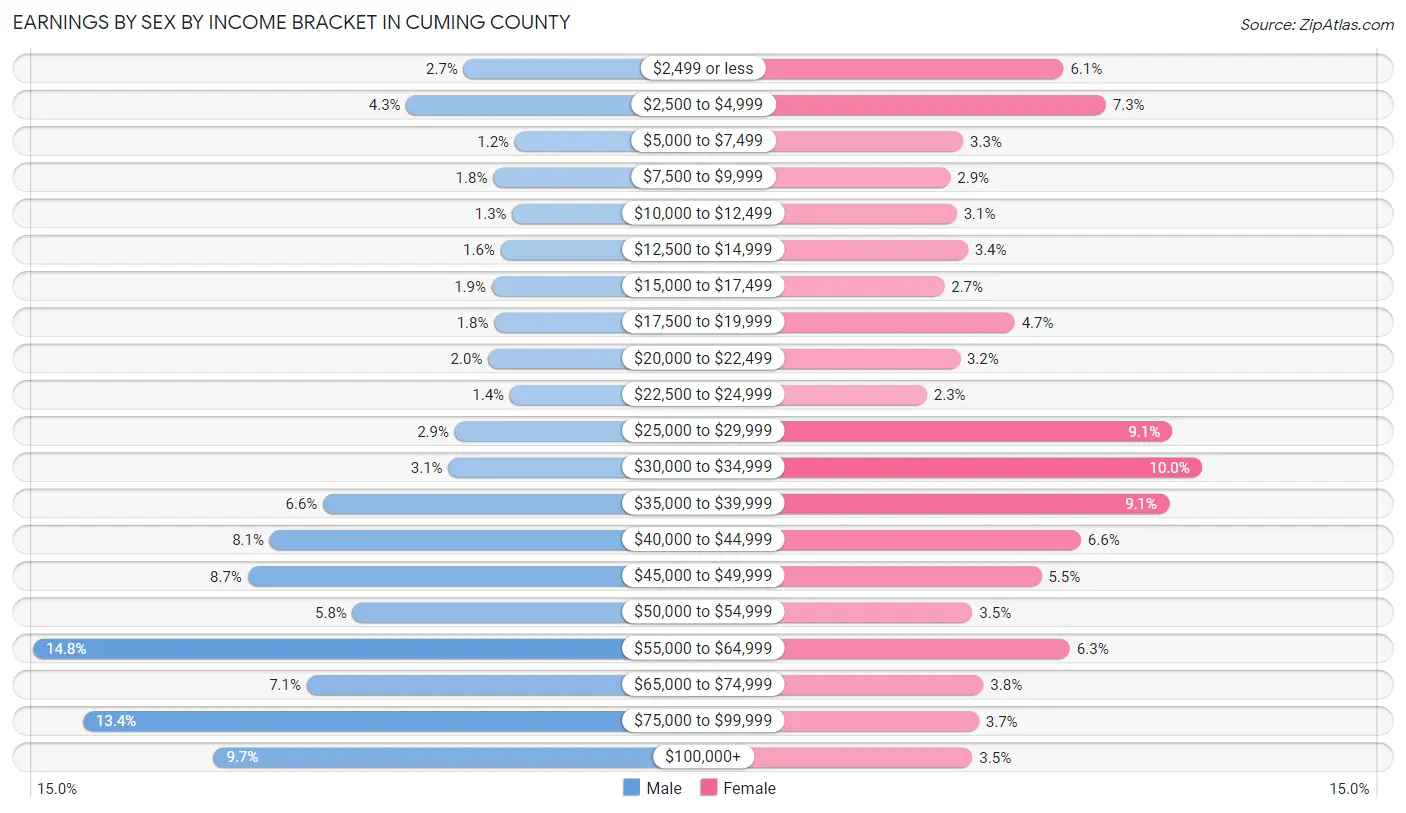
| Income | Male | Female |
| $2,499 or less | 74 (2.7%) | 138 (6.1%) |
| $2,500 to $4,999 | 119 (4.3%) | 165 (7.3%) |
| $5,000 to $7,499 | 34 (1.2%) | 74 (3.3%) |
| $7,500 to $9,999 | 51 (1.8%) | 66 (2.9%) |
| $10,000 to $12,499 | 36 (1.3%) | 70 (3.1%) |
| $12,500 to $14,999 | 45 (1.6%) | 77 (3.4%) |
| $15,000 to $17,499 | 52 (1.9%) | 62 (2.7%) |
| $17,500 to $19,999 | 50 (1.8%) | 107 (4.7%) |
| $20,000 to $22,499 | 55 (2.0%) | 72 (3.2%) |
| $22,500 to $24,999 | 38 (1.4%) | 51 (2.2%) |
| $25,000 to $29,999 | 81 (2.9%) | 207 (9.1%) |
| $30,000 to $34,999 | 86 (3.1%) | 226 (10.0%) |
| $35,000 to $39,999 | 184 (6.6%) | 205 (9.0%) |
| $40,000 to $44,999 | 226 (8.1%) | 149 (6.6%) |
| $45,000 to $49,999 | 243 (8.7%) | 124 (5.5%) |
| $50,000 to $54,999 | 161 (5.8%) | 80 (3.5%) |
| $55,000 to $64,999 | 411 (14.8%) | 142 (6.3%) |
| $65,000 to $74,999 | 197 (7.1%) | 87 (3.8%) |
| $75,000 to $99,999 | 372 (13.4%) | 84 (3.7%) |
| $100,000+ | 270 (9.7%) | 80 (3.5%) |
| Total | 2,785 (100.0%) | 2,266 (100.0%) |
Earnings by Sex by Educational Attainment in Cuming County
Average earnings in Cuming County are $52,829 for men and $33,164 for women, a difference of 37.2%. Men with an educational attainment of less than high school enjoy the highest average annual earnings of $60,075, while those with high school diploma education earn the least with $46,928. Women with an educational attainment of graduate degree earn the most with the average annual earnings of $59,191, while those with high school diploma education have the smallest earnings of $26,061.
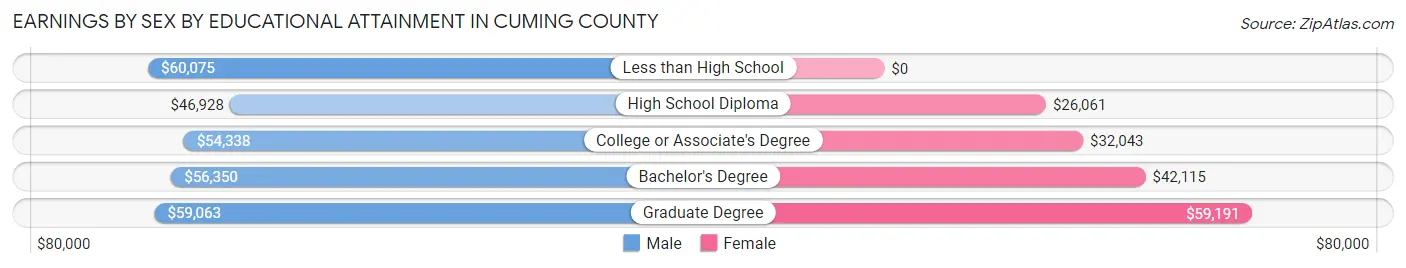
| Educational Attainment | Male Income | Female Income |
| Less than High School | $60,075 | $0 |
| High School Diploma | $46,928 | $26,061 |
| College or Associate's Degree | $54,338 | $32,043 |
| Bachelor's Degree | $56,350 | $42,115 |
| Graduate Degree | $59,063 | $59,191 |
| Total | $52,829 | $33,164 |
Family Income in Cuming County
Family Income Brackets in Cuming County
According to the Cuming County family income data, there are 595 families falling into the $100,000 to $149,999 income range, which is the most common income bracket and makes up 25.0% of all families.
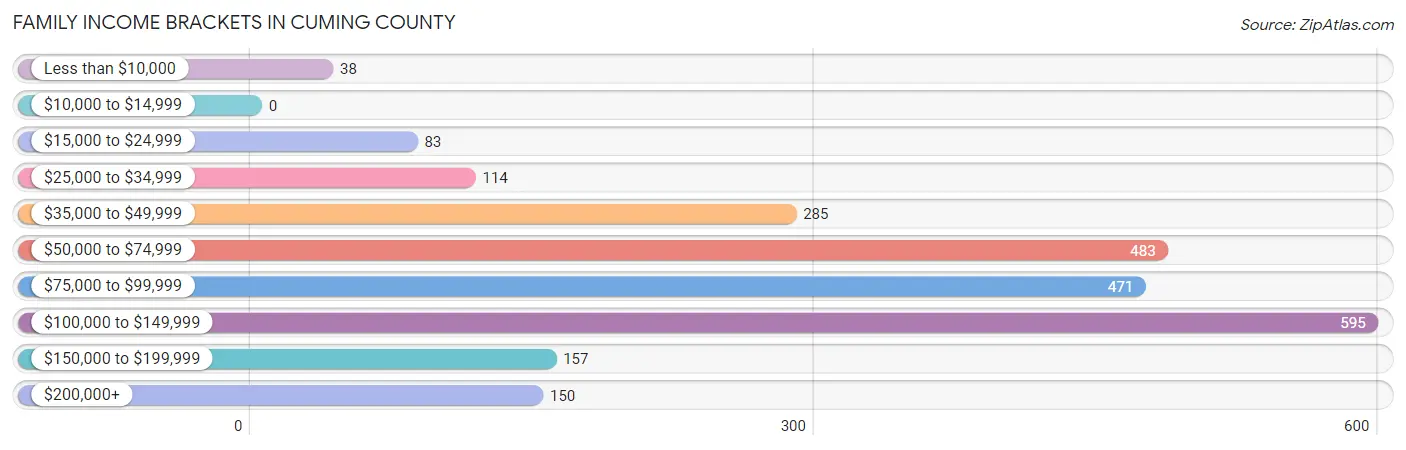
| Income Bracket | # Families | % Families |
| Less than $10,000 | 38 | 1.6% |
| $10,000 to $14,999 | 0 | 0.0% |
| $15,000 to $24,999 | 83 | 3.5% |
| $25,000 to $34,999 | 114 | 4.8% |
| $35,000 to $49,999 | 285 | 12.0% |
| $50,000 to $74,999 | 483 | 20.3% |
| $75,000 to $99,999 | 471 | 19.8% |
| $100,000 to $149,999 | 595 | 25.0% |
| $150,000 to $199,999 | 157 | 6.6% |
| $200,000+ | 150 | 6.3% |
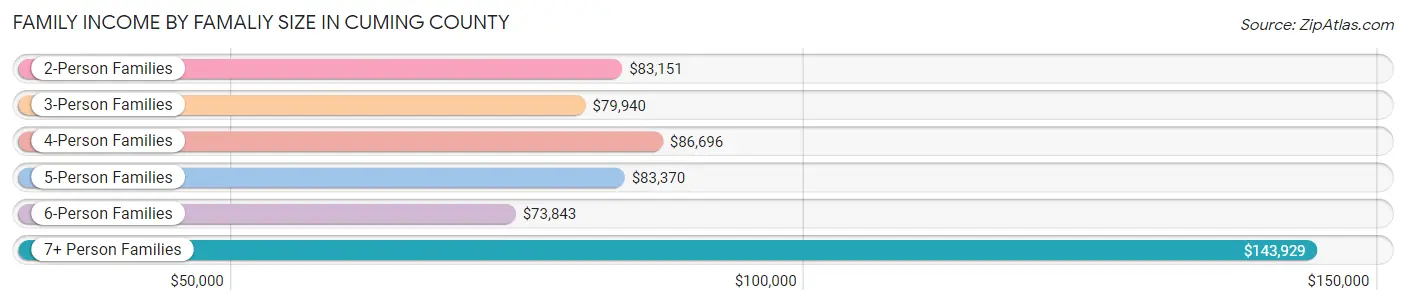
Family Income by Famaliy Size in Cuming County
7+ person families (40 | 1.7%) account for the highest median family income in Cuming County with $143,929 per family, while 2-person families (1,283 | 53.9%) have the highest median income of $41,576 per family member.
| Income Bracket | # Families | Median Income |
| 2-Person Families | 1,283 (53.9%) | $83,151 |
| 3-Person Families | 395 (16.6%) | $79,940 |
| 4-Person Families | 394 (16.6%) | $86,696 |
| 5-Person Families | 174 (7.3%) | $83,370 |
| 6-Person Families | 93 (3.9%) | $73,843 |
| 7+ Person Families | 40 (1.7%) | $143,929 |
| Total | 2,379 (100.0%) | $83,687 |
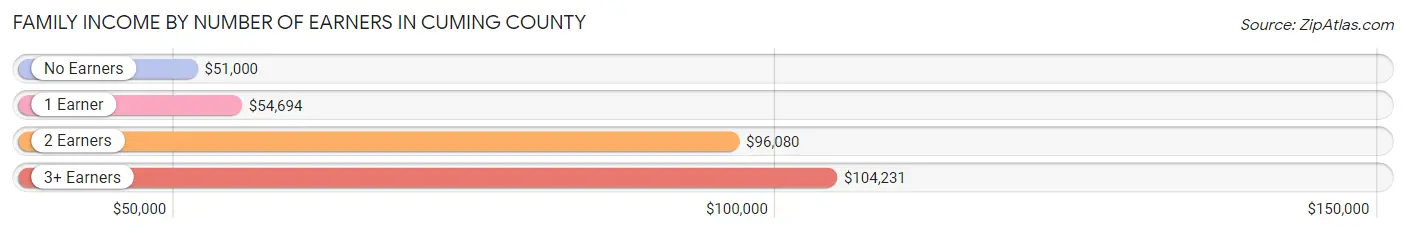
Family Income by Number of Earners in Cuming County
The median family income in Cuming County is $83,687, with families comprising 3+ earners (160) having the highest median family income of $104,231, while families with no earners (280) have the lowest median family income of $51,000, accounting for 6.7% and 11.8% of families, respectively.
| Number of Earners | # Families | Median Income |
| No Earners | 280 (11.8%) | $51,000 |
| 1 Earner | 531 (22.3%) | $54,694 |
| 2 Earners | 1,408 (59.2%) | $96,080 |
| 3+ Earners | 160 (6.7%) | $104,231 |
| Total | 2,379 (100.0%) | $83,687 |
Household Income in Cuming County
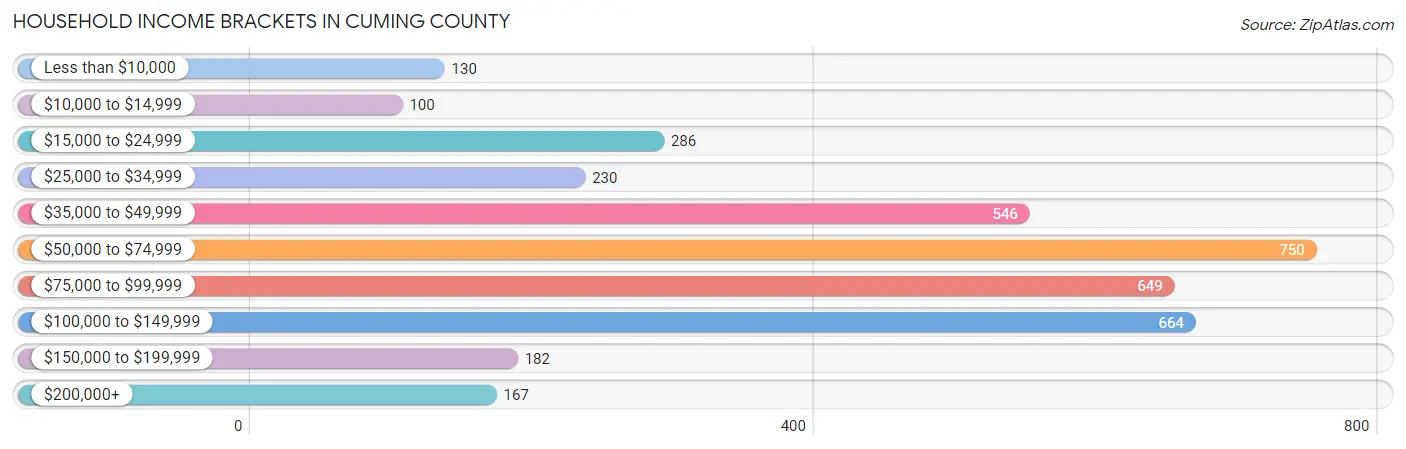
Household Income Brackets in Cuming County
With 750 households falling in the category, the $50,000 to $74,999 income range is the most frequent in Cuming County, accounting for 20.2% of all households. In contrast, only 100 households (2.7%) fall into the $10,000 to $14,999 income bracket, making it the least populous group.
| Income Bracket | # Households | % Households |
| Less than $10,000 | 130 | 3.5% |
| $10,000 to $14,999 | 100 | 2.7% |
| $15,000 to $24,999 | 286 | 7.7% |
| $25,000 to $34,999 | 230 | 6.2% |
| $35,000 to $49,999 | 546 | 14.7% |
| $50,000 to $74,999 | 750 | 20.2% |
| $75,000 to $99,999 | 649 | 17.5% |
| $100,000 to $149,999 | 664 | 17.9% |
| $150,000 to $199,999 | 182 | 4.9% |
| $200,000+ | 167 | 4.5% |
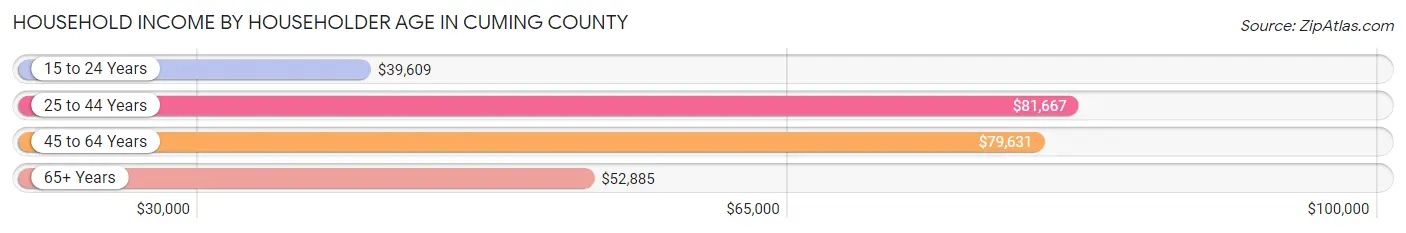
Household Income by Householder Age in Cuming County
The median household income in Cuming County is $68,917, with the highest median household income of $81,667 found in the 25 to 44 years age bracket for the primary householder. A total of 970 households (26.1%) fall into this category. Meanwhile, the 15 to 24 years age bracket for the primary householder has the lowest median household income of $39,609, with 162 households (4.4%) in this group.
| Income Bracket | # Households | Median Income |
| 15 to 24 Years | 162 (4.4%) | $39,609 |
| 25 to 44 Years | 970 (26.1%) | $81,667 |
| 45 to 64 Years | 1,329 (35.8%) | $79,631 |
| 65+ Years | 1,250 (33.7%) | $52,885 |
| Total | 3,711 (100.0%) | $68,917 |
Poverty in Cuming County
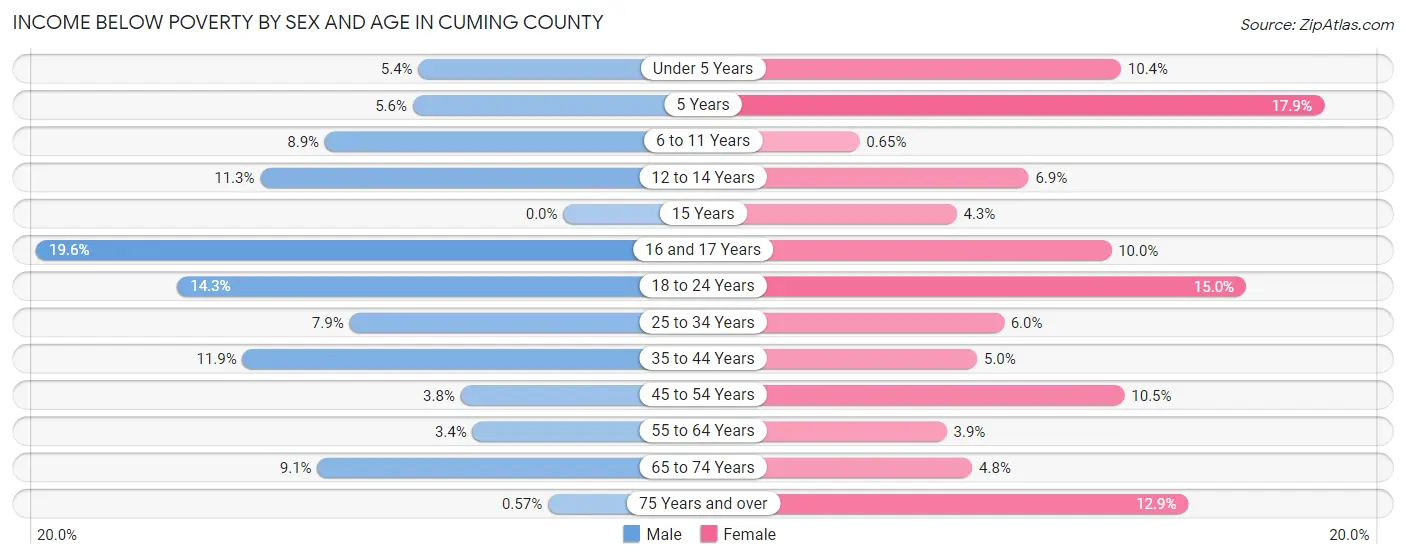
Income Below Poverty by Sex and Age in Cuming County
With 7.4% poverty level for males and 7.9% for females among the residents of Cuming County, 16 and 17 year old males and 5 year old females are the most vulnerable to poverty, with 27 males (19.6%) and 17 females (17.9%) in their respective age groups living below the poverty level.
| Age Bracket | Male | Female |
| Under 5 Years | 17 (5.4%) | 29 (10.4%) |
| 5 Years | 8 (5.6%) | 17 (17.9%) |
| 6 to 11 Years | 27 (8.8%) | 2 (0.6%) |
| 12 to 14 Years | 18 (11.3%) | 14 (6.9%) |
| 15 Years | 0 (0.0%) | 2 (4.3%) |
| 16 and 17 Years | 27 (19.6%) | 16 (10.0%) |
| 18 to 24 Years | 47 (14.3%) | 51 (15.0%) |
| 25 to 34 Years | 39 (7.9%) | 27 (6.0%) |
| 35 to 44 Years | 61 (11.9%) | 22 (5.0%) |
| 45 to 54 Years | 20 (3.8%) | 51 (10.5%) |
| 55 to 64 Years | 24 (3.4%) | 22 (3.9%) |
| 65 to 74 Years | 46 (9.1%) | 22 (4.8%) |
| 75 Years and over | 2 (0.6%) | 67 (12.9%) |
| Total | 336 (7.4%) | 342 (7.9%) |
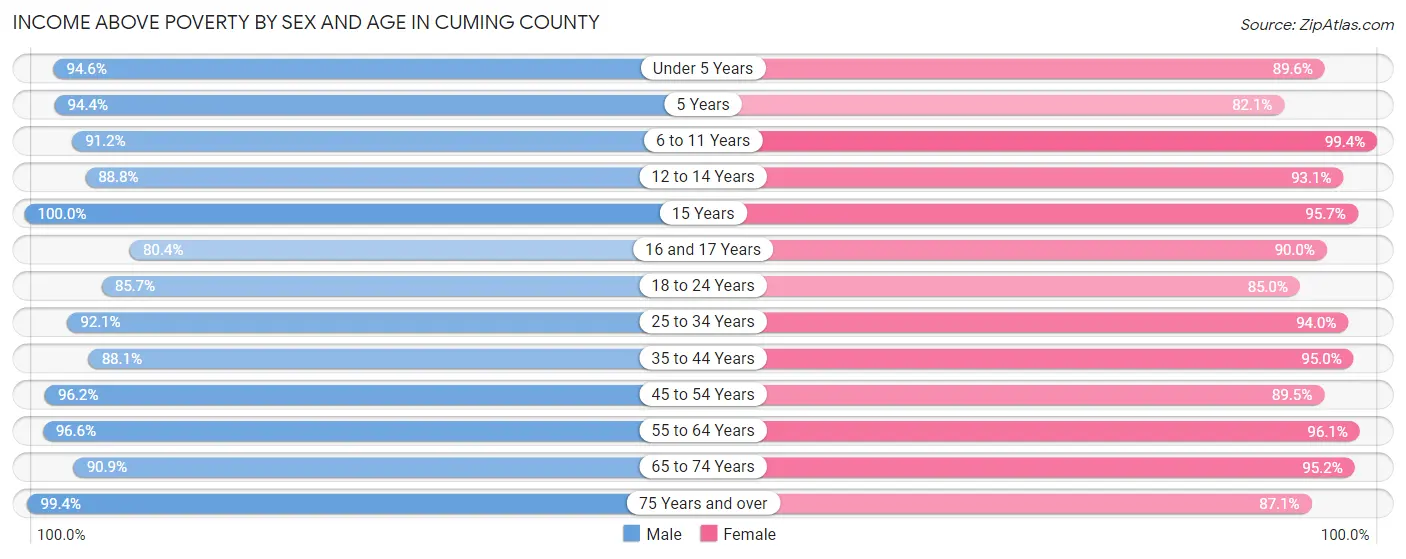
Income Above Poverty by Sex and Age in Cuming County
According to the poverty statistics in Cuming County, males aged 15 years and females aged 6 to 11 years are the age groups that are most secure financially, with 100.0% of males and 99.4% of females in these age groups living above the poverty line.
| Age Bracket | Male | Female |
| Under 5 Years | 299 (94.6%) | 251 (89.6%) |
| 5 Years | 135 (94.4%) | 78 (82.1%) |
| 6 to 11 Years | 278 (91.1%) | 305 (99.4%) |
| 12 to 14 Years | 142 (88.7%) | 188 (93.1%) |
| 15 Years | 29 (100.0%) | 45 (95.7%) |
| 16 and 17 Years | 111 (80.4%) | 144 (90.0%) |
| 18 to 24 Years | 281 (85.7%) | 289 (85.0%) |
| 25 to 34 Years | 452 (92.1%) | 422 (94.0%) |
| 35 to 44 Years | 451 (88.1%) | 416 (95.0%) |
| 45 to 54 Years | 505 (96.2%) | 435 (89.5%) |
| 55 to 64 Years | 688 (96.6%) | 543 (96.1%) |
| 65 to 74 Years | 458 (90.9%) | 433 (95.2%) |
| 75 Years and over | 348 (99.4%) | 454 (87.1%) |
| Total | 4,177 (92.5%) | 4,003 (92.1%) |
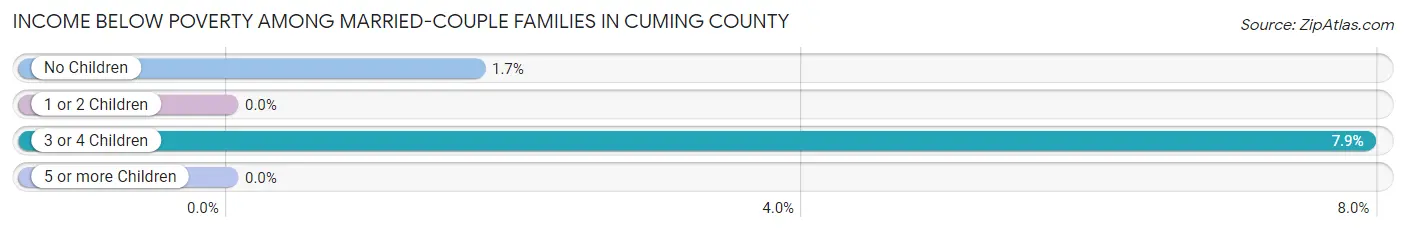
Income Below Poverty Among Married-Couple Families in Cuming County
The poverty statistics for married-couple families in Cuming County show that 2.1% or 44 of the total 2,112 families live below the poverty line. Families with 3 or 4 children have the highest poverty rate of 7.9%, comprising of 21 families. On the other hand, families with 1 or 2 children have the lowest poverty rate of 0.0%, which includes 0 families.
| Children | Above Poverty | Below Poverty |
| No Children | 1,317 (98.3%) | 23 (1.7%) |
| 1 or 2 Children | 485 (100.0%) | 0 (0.0%) |
| 3 or 4 Children | 244 (92.1%) | 21 (7.9%) |
| 5 or more Children | 22 (100.0%) | 0 (0.0%) |
| Total | 2,068 (97.9%) | 44 (2.1%) |
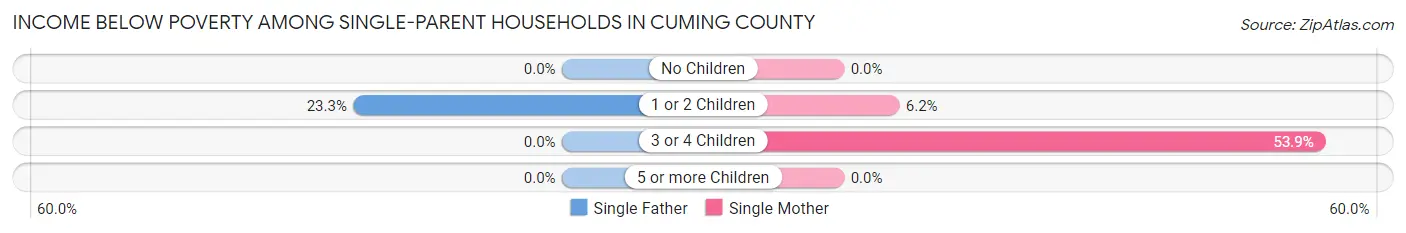
Income Below Poverty Among Single-Parent Households in Cuming County
According to the poverty data in Cuming County, 17.6% or 21 single-father households and 12.8% or 19 single-mother households are living below the poverty line. Among single-father households, those with 1 or 2 children have the highest poverty rate, with 21 households (23.3%) experiencing poverty. Likewise, among single-mother households, those with 3 or 4 children have the highest poverty rate, with 14 households (53.8%) falling below the poverty line.
| Children | Single Father | Single Mother |
| No Children | 0 (0.0%) | 0 (0.0%) |
| 1 or 2 Children | 21 (23.3%) | 5 (6.2%) |
| 3 or 4 Children | 0 (0.0%) | 14 (53.8%) |
| 5 or more Children | 0 (0.0%) | 0 (0.0%) |
| Total | 21 (17.6%) | 19 (12.8%) |
Income Below Poverty Among Married-Couple vs Single-Parent Households in Cuming County
The poverty data for Cuming County shows that 44 of the married-couple family households (2.1%) and 40 of the single-parent households (15.0%) are living below the poverty level. Within the married-couple family households, those with 3 or 4 children have the highest poverty rate, with 21 households (7.9%) falling below the poverty line. Among the single-parent households, those with 3 or 4 children have the highest poverty rate, with 14 household (29.2%) living below poverty.
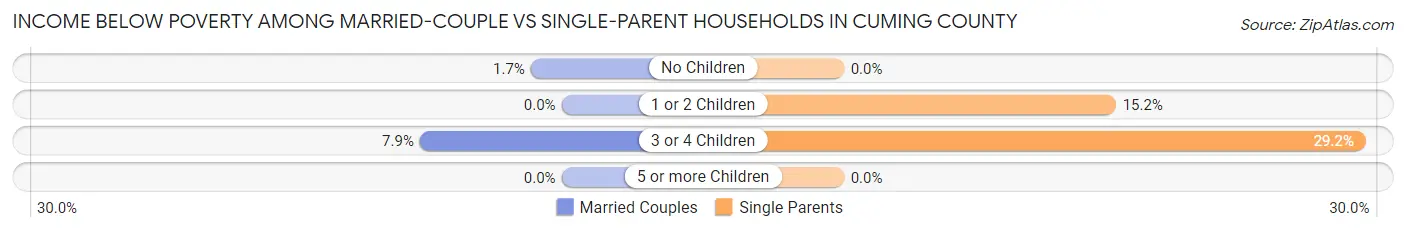
| Children | Married-Couple Families | Single-Parent Households |
| No Children | 23 (1.7%) | 0 (0.0%) |
| 1 or 2 Children | 0 (0.0%) | 26 (15.2%) |
| 3 or 4 Children | 21 (7.9%) | 14 (29.2%) |
| 5 or more Children | 0 (0.0%) | 0 (0.0%) |
| Total | 44 (2.1%) | 40 (15.0%) |
Employment Characteristics in Cuming County
Employment by Class of Employer in Cuming County
Among the 4,618 employed individuals in Cuming County, private company employees (2,901 | 62.8%), self-employed (not incorporated) (461 | 10.0%), and not-for-profit organizations (366 | 7.9%) make up the most common classes of employment.
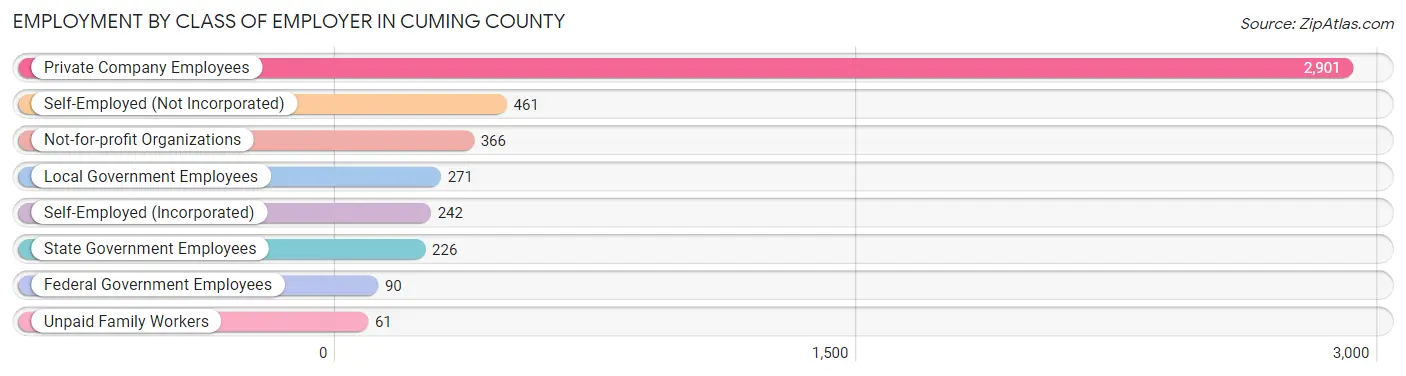
| Employer Class | # Employees | % Employees |
| Private Company Employees | 2,901 | 62.8% |
| Self-Employed (Incorporated) | 242 | 5.2% |
| Self-Employed (Not Incorporated) | 461 | 10.0% |
| Not-for-profit Organizations | 366 | 7.9% |
| Local Government Employees | 271 | 5.9% |
| State Government Employees | 226 | 4.9% |
| Federal Government Employees | 90 | 1.9% |
| Unpaid Family Workers | 61 | 1.3% |
| Total | 4,618 | 100.0% |
Employment Status by Age in Cuming County
According to the labor force statistics for Cuming County, out of the total population over 16 years of age (7,090), 68.0% or 4,821 individuals are in the labor force, with 2.6% or 125 of them unemployed. The age group with the highest labor force participation rate is 25 to 29 years, with 96.1% or 395 individuals in the labor force. Within the labor force, the 16 to 19 years age range has the highest percentage of unemployed individuals, with 5.9% or 12 of them being unemployed.
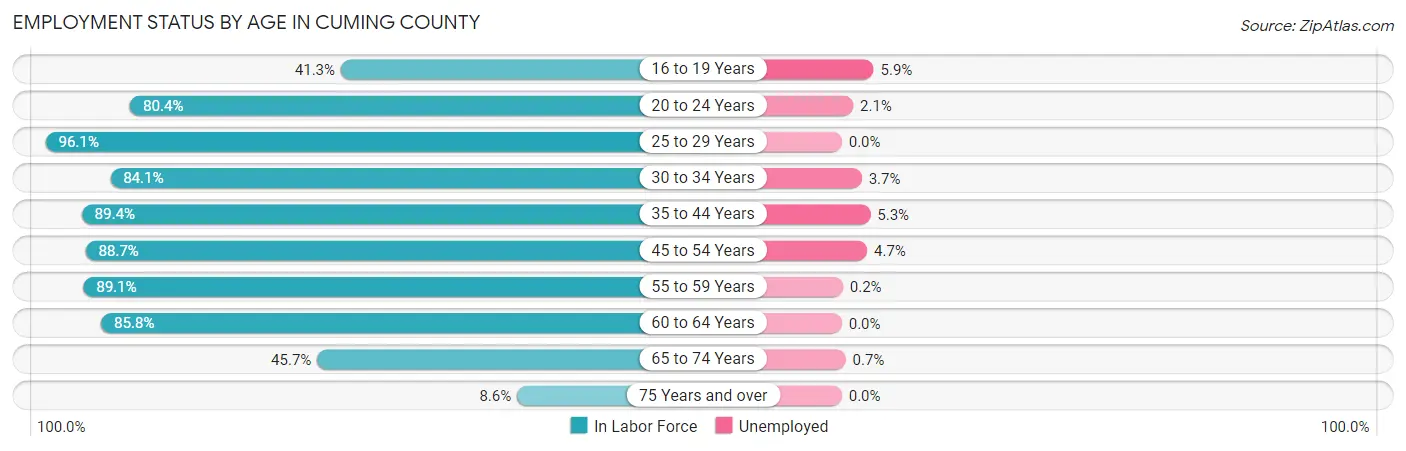
| Age Bracket | In Labor Force | Unemployed |
| 16 to 19 Years | 203 (41.3%) | 12 (5.9%) |
| 20 to 24 Years | 381 (80.4%) | 8 (2.1%) |
| 25 to 29 Years | 395 (96.1%) | 0 (0.0%) |
| 30 to 34 Years | 445 (84.1%) | 16 (3.7%) |
| 35 to 44 Years | 849 (89.4%) | 45 (5.3%) |
| 45 to 54 Years | 899 (88.7%) | 42 (4.7%) |
| 55 to 59 Years | 595 (89.1%) | 1 (0.2%) |
| 60 to 64 Years | 525 (85.8%) | 0 (0.0%) |
| 65 to 74 Years | 448 (45.7%) | 3 (0.7%) |
| 75 Years and over | 83 (8.6%) | 0 (0.0%) |
| Total | 4,821 (68.0%) | 125 (2.6%) |
Employment Status by Educational Attainment in Cuming County
According to labor force statistics for Cuming County, 88.6% of individuals (3,706) out of the total population between 25 and 64 years of age (4,183) are in the labor force, with 2.8% or 104 of them being unemployed. The group with the highest labor force participation rate are those with the educational attainment of bachelor's degree or higher, with 93.5% or 1,028 individuals in the labor force. Within the labor force, individuals with less than high school education have the highest percentage of unemployment, with 7.2% or 19 of them being unemployed.
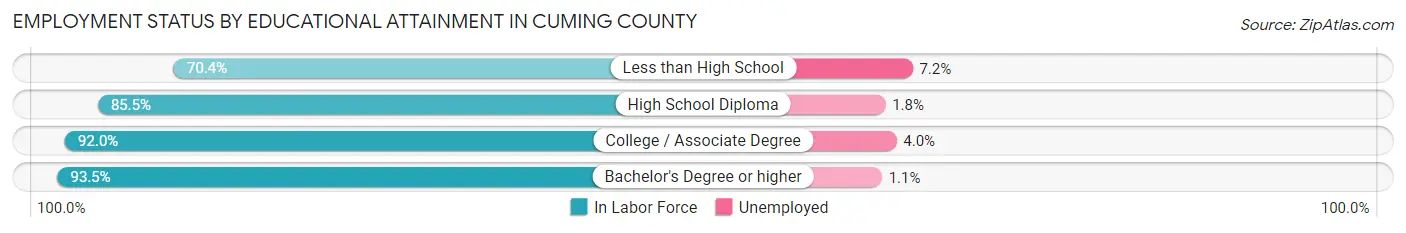
| Educational Attainment | In Labor Force | Unemployed |
| Less than High School | 264 (70.4%) | 27 (7.2%) |
| High School Diploma | 1,011 (85.5%) | 21 (1.8%) |
| College / Associate Degree | 1,404 (92.0%) | 61 (4.0%) |
| Bachelor's Degree or higher | 1,028 (93.5%) | 12 (1.1%) |
| Total | 3,706 (88.6%) | 117 (2.8%) |
Employment Occupations by Sex in Cuming County
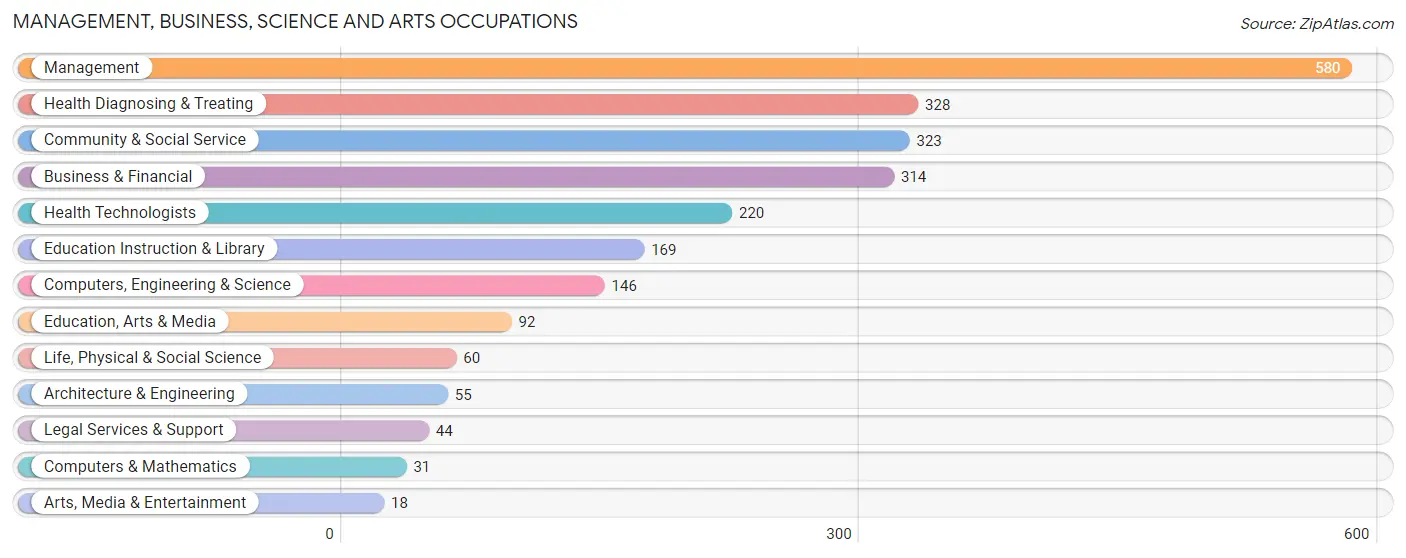
Management, Business, Science and Arts Occupations
The most common Management, Business, Science and Arts occupations in Cuming County are Management (580 | 12.4%), Health Diagnosing & Treating (328 | 7.0%), Community & Social Service (323 | 6.9%), Business & Financial (314 | 6.7%), and Health Technologists (220 | 4.7%).
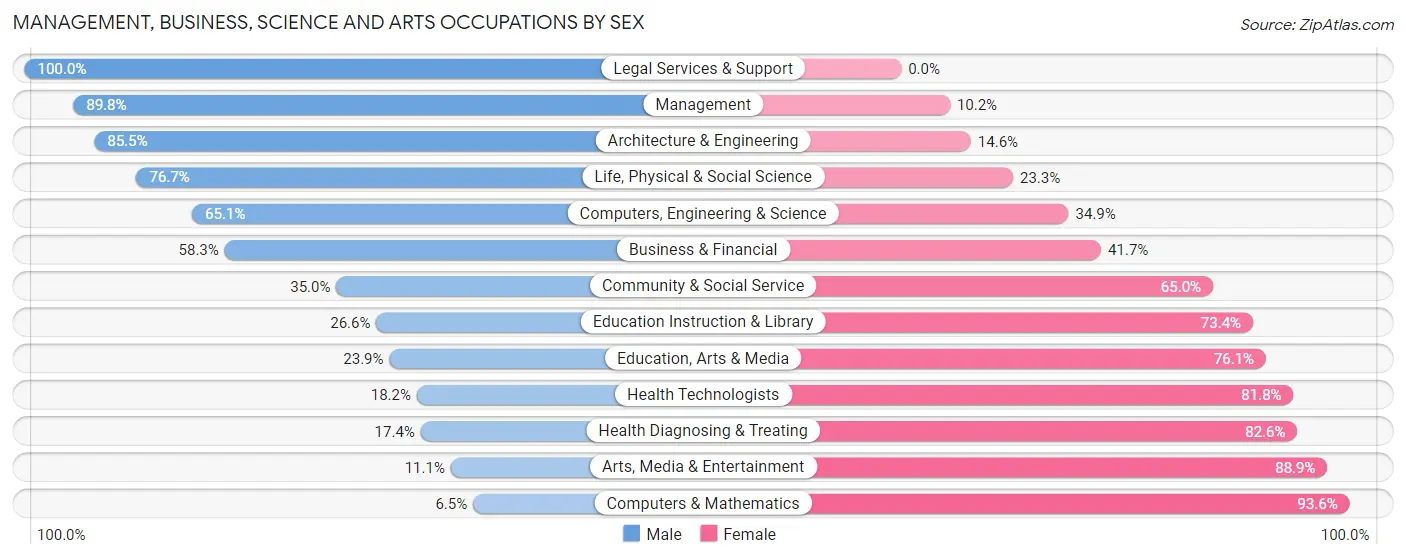
Management, Business, Science and Arts Occupations by Sex
Within the Management, Business, Science and Arts occupations in Cuming County, the most male-oriented occupations are Legal Services & Support (100.0%), Management (89.8%), and Architecture & Engineering (85.5%), while the most female-oriented occupations are Computers & Mathematics (93.5%), Arts, Media & Entertainment (88.9%), and Health Diagnosing & Treating (82.6%).
| Occupation | Male | Female |
| Management | 521 (89.8%) | 59 (10.2%) |
| Business & Financial | 183 (58.3%) | 131 (41.7%) |
| Computers, Engineering & Science | 95 (65.1%) | 51 (34.9%) |
| Computers & Mathematics | 2 (6.5%) | 29 (93.5%) |
| Architecture & Engineering | 47 (85.5%) | 8 (14.5%) |
| Life, Physical & Social Science | 46 (76.7%) | 14 (23.3%) |
| Community & Social Service | 113 (35.0%) | 210 (65.0%) |
| Education, Arts & Media | 22 (23.9%) | 70 (76.1%) |
| Legal Services & Support | 44 (100.0%) | 0 (0.0%) |
| Education Instruction & Library | 45 (26.6%) | 124 (73.4%) |
| Arts, Media & Entertainment | 2 (11.1%) | 16 (88.9%) |
| Health Diagnosing & Treating | 57 (17.4%) | 271 (82.6%) |
| Health Technologists | 40 (18.2%) | 180 (81.8%) |
| Total (Category) | 969 (57.3%) | 722 (42.7%) |
| Total (Overall) | 2,657 (56.7%) | 2,027 (43.3%) |
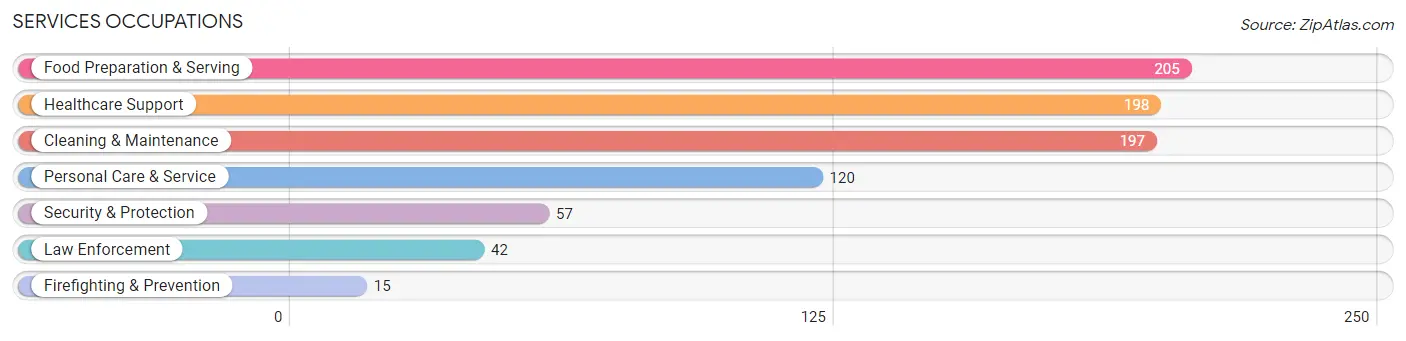
Services Occupations
The most common Services occupations in Cuming County are Food Preparation & Serving (205 | 4.4%), Healthcare Support (198 | 4.2%), Cleaning & Maintenance (197 | 4.2%), Personal Care & Service (120 | 2.6%), and Security & Protection (57 | 1.2%).
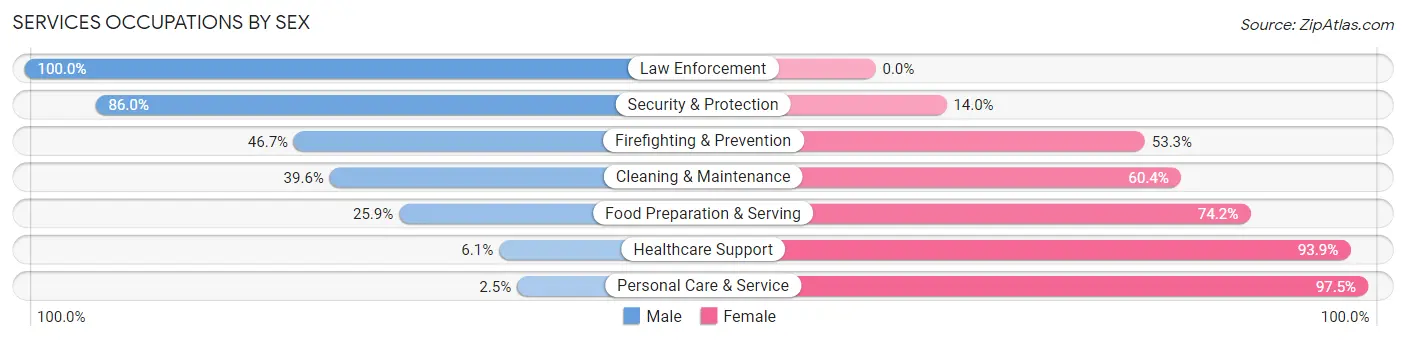
Services Occupations by Sex
Within the Services occupations in Cuming County, the most male-oriented occupations are Law Enforcement (100.0%), Security & Protection (86.0%), and Firefighting & Prevention (46.7%), while the most female-oriented occupations are Personal Care & Service (97.5%), Healthcare Support (93.9%), and Food Preparation & Serving (74.2%).
| Occupation | Male | Female |
| Healthcare Support | 12 (6.1%) | 186 (93.9%) |
| Security & Protection | 49 (86.0%) | 8 (14.0%) |
| Firefighting & Prevention | 7 (46.7%) | 8 (53.3%) |
| Law Enforcement | 42 (100.0%) | 0 (0.0%) |
| Food Preparation & Serving | 53 (25.9%) | 152 (74.2%) |
| Cleaning & Maintenance | 78 (39.6%) | 119 (60.4%) |
| Personal Care & Service | 3 (2.5%) | 117 (97.5%) |
| Total (Category) | 195 (25.1%) | 582 (74.9%) |
| Total (Overall) | 2,657 (56.7%) | 2,027 (43.3%) |
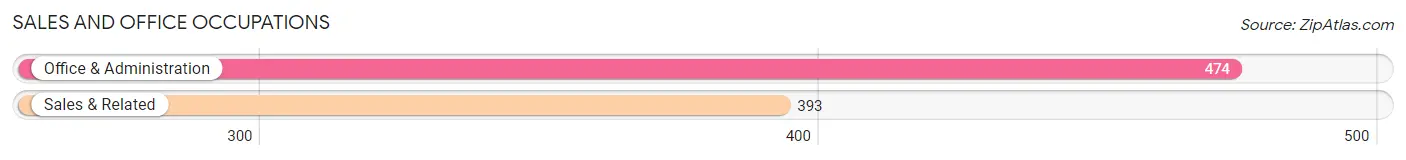
Sales and Office Occupations
The most common Sales and Office occupations in Cuming County are Office & Administration (474 | 10.1%), and Sales & Related (393 | 8.4%).
Sales and Office Occupations by Sex
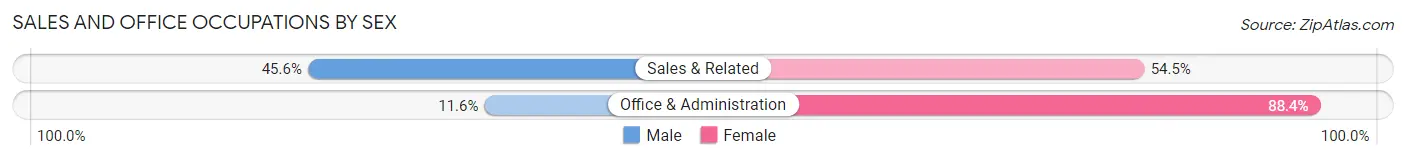
| Occupation | Male | Female |
| Sales & Related | 179 (45.6%) | 214 (54.4%) |
| Office & Administration | 55 (11.6%) | 419 (88.4%) |
| Total (Category) | 234 (27.0%) | 633 (73.0%) |
| Total (Overall) | 2,657 (56.7%) | 2,027 (43.3%) |
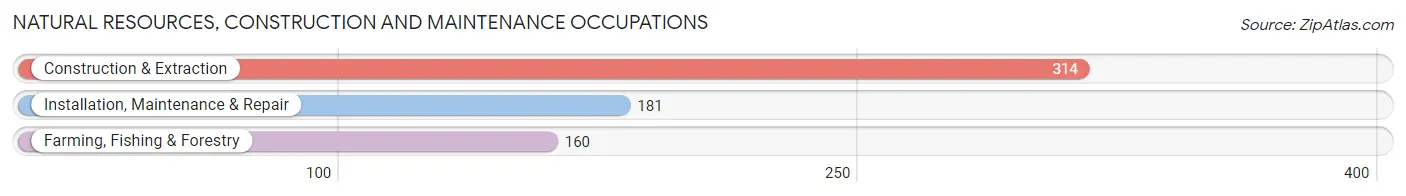
Natural Resources, Construction and Maintenance Occupations
The most common Natural Resources, Construction and Maintenance occupations in Cuming County are Construction & Extraction (314 | 6.7%), Installation, Maintenance & Repair (181 | 3.9%), and Farming, Fishing & Forestry (160 | 3.4%).
Natural Resources, Construction and Maintenance Occupations by Sex
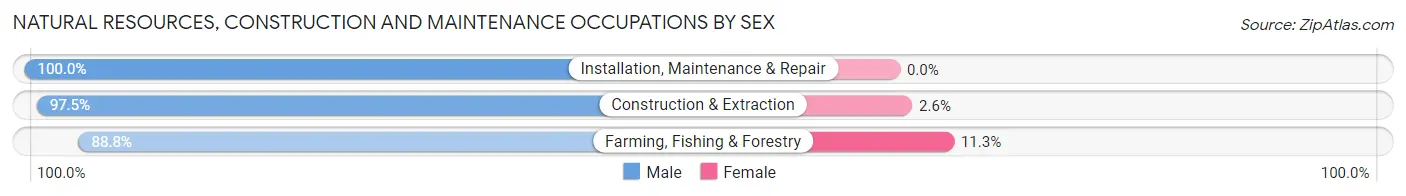
| Occupation | Male | Female |
| Farming, Fishing & Forestry | 142 (88.7%) | 18 (11.3%) |
| Construction & Extraction | 306 (97.5%) | 8 (2.5%) |
| Installation, Maintenance & Repair | 181 (100.0%) | 0 (0.0%) |
| Total (Category) | 629 (96.0%) | 26 (4.0%) |
| Total (Overall) | 2,657 (56.7%) | 2,027 (43.3%) |
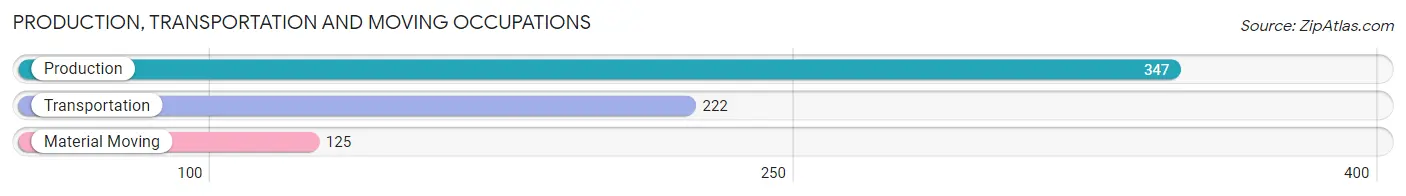
Production, Transportation and Moving Occupations
The most common Production, Transportation and Moving occupations in Cuming County are Production (347 | 7.4%), Transportation (222 | 4.7%), and Material Moving (125 | 2.7%).
Production, Transportation and Moving Occupations by Sex

| Occupation | Male | Female |
| Production | 311 (89.6%) | 36 (10.4%) |
| Transportation | 222 (100.0%) | 0 (0.0%) |
| Material Moving | 97 (77.6%) | 28 (22.4%) |
| Total (Category) | 630 (90.8%) | 64 (9.2%) |
| Total (Overall) | 2,657 (56.7%) | 2,027 (43.3%) |
Employment Industries by Sex in Cuming County
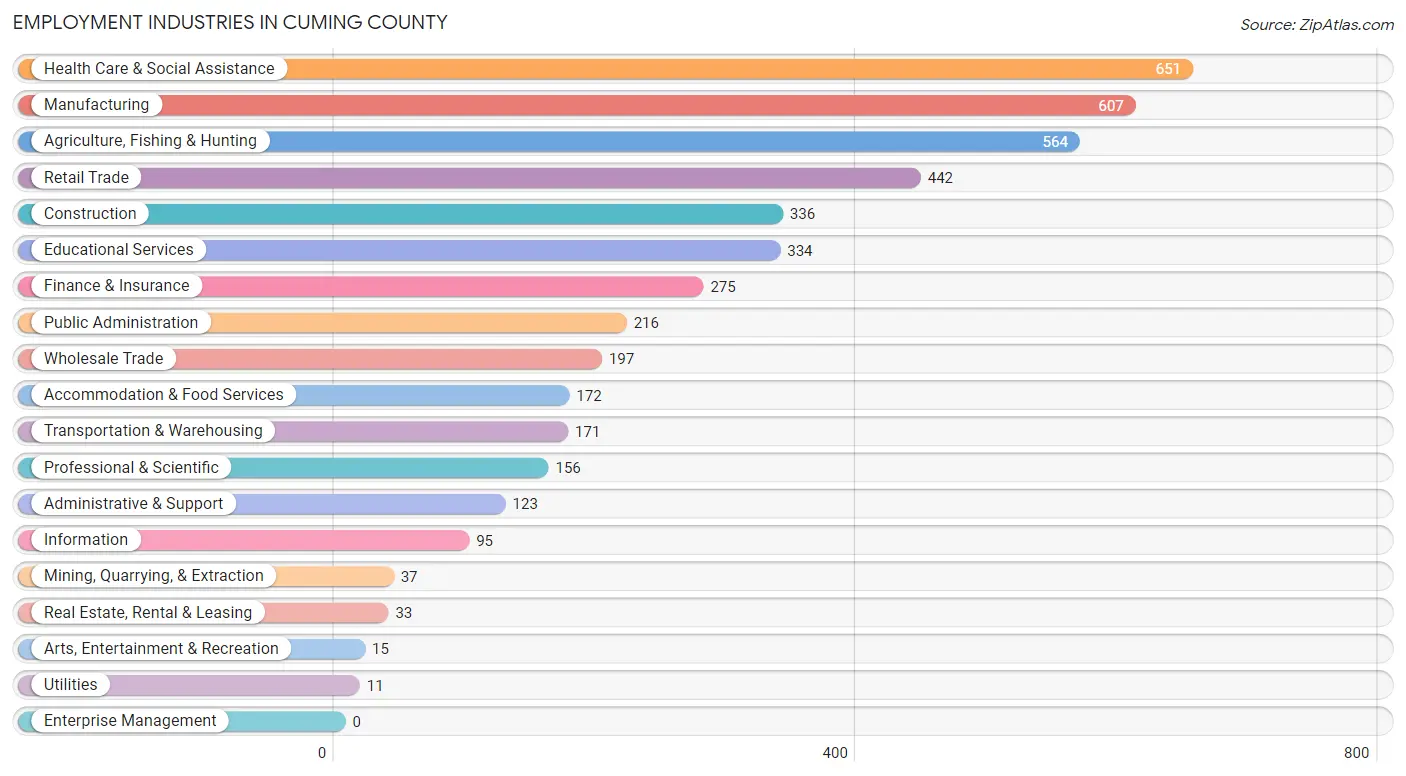
Employment Industries in Cuming County
The major employment industries in Cuming County include Health Care & Social Assistance (651 | 13.9%), Manufacturing (607 | 13.0%), Agriculture, Fishing & Hunting (564 | 12.0%), Retail Trade (442 | 9.4%), and Construction (336 | 7.2%).
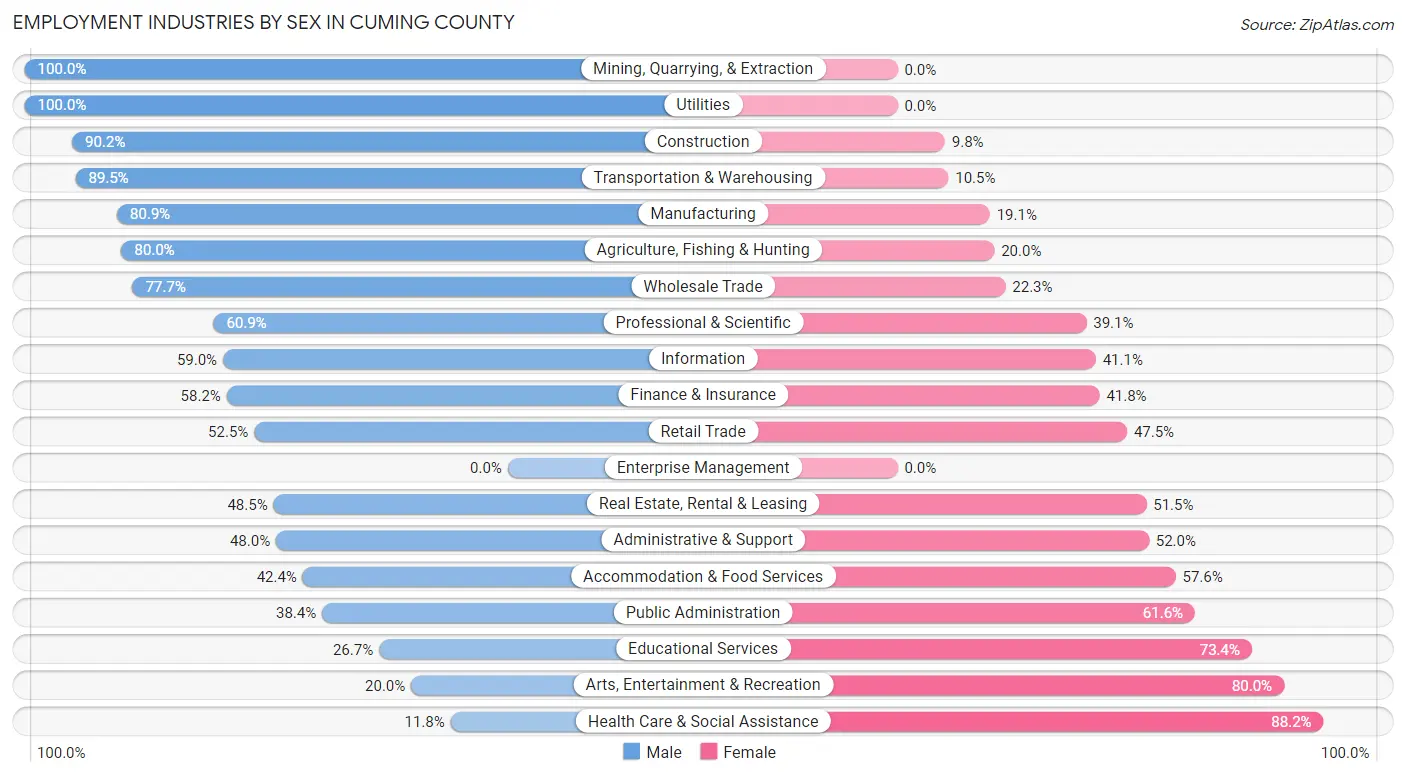
Employment Industries by Sex in Cuming County
The Cuming County industries that see more men than women are Mining, Quarrying, & Extraction (100.0%), Utilities (100.0%), and Construction (90.2%), whereas the industries that tend to have a higher number of women are Health Care & Social Assistance (88.2%), Arts, Entertainment & Recreation (80.0%), and Educational Services (73.4%).
| Industry | Male | Female |
| Agriculture, Fishing & Hunting | 451 (80.0%) | 113 (20.0%) |
| Mining, Quarrying, & Extraction | 37 (100.0%) | 0 (0.0%) |
| Construction | 303 (90.2%) | 33 (9.8%) |
| Manufacturing | 491 (80.9%) | 116 (19.1%) |
| Wholesale Trade | 153 (77.7%) | 44 (22.3%) |
| Retail Trade | 232 (52.5%) | 210 (47.5%) |
| Transportation & Warehousing | 153 (89.5%) | 18 (10.5%) |
| Utilities | 11 (100.0%) | 0 (0.0%) |
| Information | 56 (59.0%) | 39 (41.0%) |
| Finance & Insurance | 160 (58.2%) | 115 (41.8%) |
| Real Estate, Rental & Leasing | 16 (48.5%) | 17 (51.5%) |
| Professional & Scientific | 95 (60.9%) | 61 (39.1%) |
| Enterprise Management | 0 (0.0%) | 0 (0.0%) |
| Administrative & Support | 59 (48.0%) | 64 (52.0%) |
| Educational Services | 89 (26.7%) | 245 (73.4%) |
| Health Care & Social Assistance | 77 (11.8%) | 574 (88.2%) |
| Arts, Entertainment & Recreation | 3 (20.0%) | 12 (80.0%) |
| Accommodation & Food Services | 73 (42.4%) | 99 (57.6%) |
| Public Administration | 83 (38.4%) | 133 (61.6%) |
| Total | 2,657 (56.7%) | 2,027 (43.3%) |
Education in Cuming County
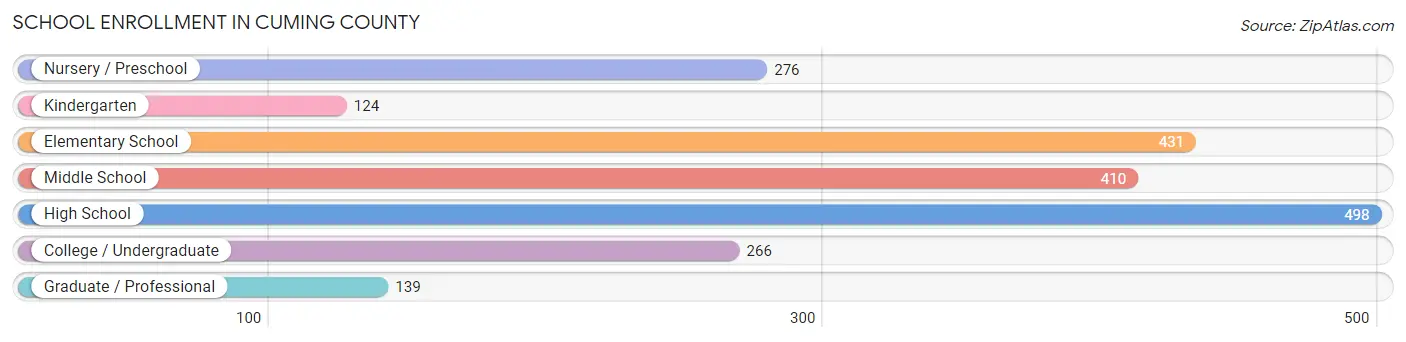
School Enrollment in Cuming County
The most common levels of schooling among the 2,144 students in Cuming County are high school (498 | 23.2%), elementary school (431 | 20.1%), and middle school (410 | 19.1%).
| School Level | # Students | % Students |
| Nursery / Preschool | 276 | 12.9% |
| Kindergarten | 124 | 5.8% |
| Elementary School | 431 | 20.1% |
| Middle School | 410 | 19.1% |
| High School | 498 | 23.2% |
| College / Undergraduate | 266 | 12.4% |
| Graduate / Professional | 139 | 6.5% |
| Total | 2,144 | 100.0% |
School Enrollment by Age by Funding Source in Cuming County
Out of a total of 2,144 students who are enrolled in schools in Cuming County, 551 (25.7%) attend a private institution, while the remaining 1,593 (74.3%) are enrolled in public schools. The age group of 3 to 4 year olds has the highest likelihood of being enrolled in private schools, with 69 (61.1% in the age bracket) enrolled. Conversely, the age group of 18 to 19 year olds has the lowest likelihood of being enrolled in a private school, with 159 (100.0% in the age bracket) attending a public institution.
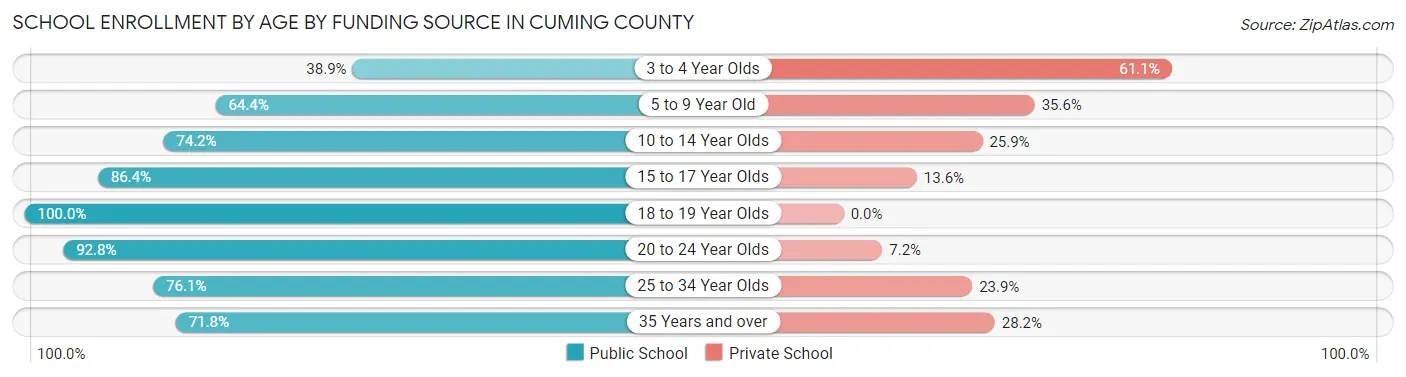
| Age Bracket | Public School | Private School |
| 3 to 4 Year Olds | 44 (38.9%) | 69 (61.1%) |
| 5 to 9 Year Old | 431 (64.4%) | 238 (35.6%) |
| 10 to 14 Year Olds | 393 (74.2%) | 137 (25.9%) |
| 15 to 17 Year Olds | 323 (86.4%) | 51 (13.6%) |
| 18 to 19 Year Olds | 159 (100.0%) | 0 (0.0%) |
| 20 to 24 Year Olds | 116 (92.8%) | 9 (7.2%) |
| 25 to 34 Year Olds | 54 (76.1%) | 17 (23.9%) |
| 35 Years and over | 74 (71.8%) | 29 (28.2%) |
| Total | 1,593 (74.3%) | 551 (25.7%) |
Educational Attainment by Field of Study in Cuming County
Education (370 | 23.3%), business (283 | 17.8%), science & technology (264 | 16.6%), bio, nature & agricultural (223 | 14.0%), and arts & humanities (184 | 11.6%) are the most common fields of study among 1,590 individuals in Cuming County who have obtained a bachelor's degree or higher.
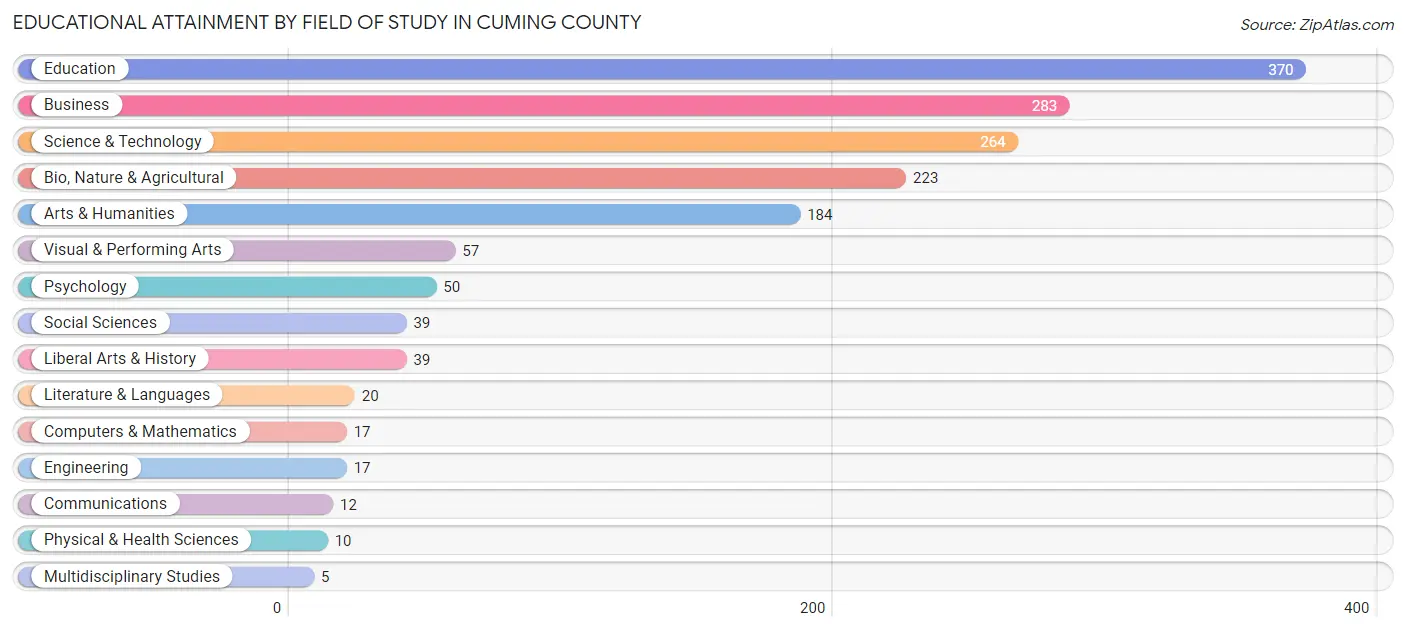
| Field of Study | # Graduates | % Graduates |
| Computers & Mathematics | 17 | 1.1% |
| Bio, Nature & Agricultural | 223 | 14.0% |
| Physical & Health Sciences | 10 | 0.6% |
| Psychology | 50 | 3.1% |
| Social Sciences | 39 | 2.5% |
| Engineering | 17 | 1.1% |
| Multidisciplinary Studies | 5 | 0.3% |
| Science & Technology | 264 | 16.6% |
| Business | 283 | 17.8% |
| Education | 370 | 23.3% |
| Literature & Languages | 20 | 1.3% |
| Liberal Arts & History | 39 | 2.5% |
| Visual & Performing Arts | 57 | 3.6% |
| Communications | 12 | 0.7% |
| Arts & Humanities | 184 | 11.6% |
| Total | 1,590 | 100.0% |
Transportation & Commute in Cuming County
Vehicle Availability by Sex in Cuming County
The most prevalent vehicle ownership categories in Cuming County are males with 2 vehicles (971, accounting for 37.3%) and females with 2 vehicles (829, making up 48.2%).
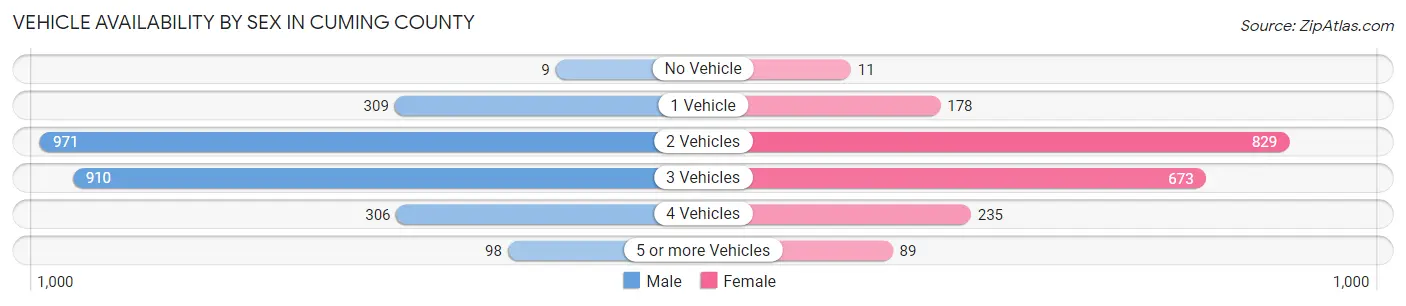
| Vehicles Available | Male | Female |
| No Vehicle | 9 (0.4%) | 11 (0.5%) |
| 1 Vehicle | 309 (11.9%) | 178 (8.8%) |
| 2 Vehicles | 971 (37.3%) | 829 (41.1%) |
| 3 Vehicles | 910 (35.0%) | 673 (33.4%) |
| 4 Vehicles | 306 (11.8%) | 235 (11.7%) |
| 5 or more Vehicles | 98 (3.8%) | 89 (4.4%) |
| Total | 2,603 (100.0%) | 2,015 (100.0%) |
Commute Time in Cuming County
The most frequently occuring commute durations in Cuming County are 5 to 9 minutes (1,208 commuters, 28.0%), less than 5 minutes (723 commuters, 16.8%), and 15 to 19 minutes (549 commuters, 12.7%).
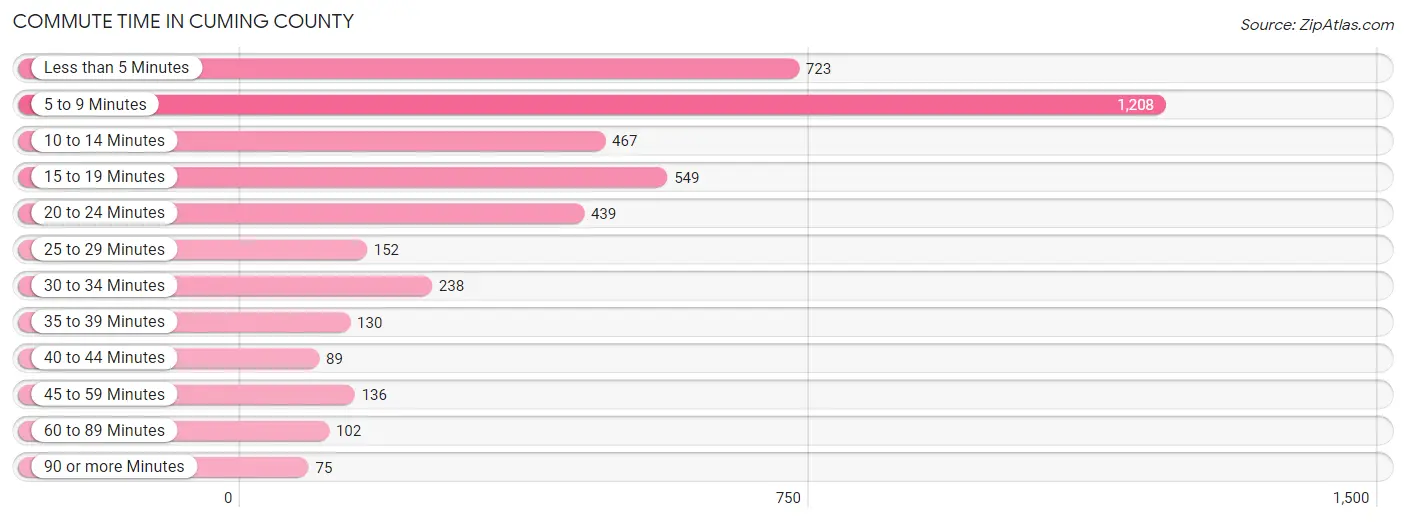
| Commute Time | # Commuters | % Commuters |
| Less than 5 Minutes | 723 | 16.8% |
| 5 to 9 Minutes | 1,208 | 28.0% |
| 10 to 14 Minutes | 467 | 10.8% |
| 15 to 19 Minutes | 549 | 12.7% |
| 20 to 24 Minutes | 439 | 10.2% |
| 25 to 29 Minutes | 152 | 3.5% |
| 30 to 34 Minutes | 238 | 5.5% |
| 35 to 39 Minutes | 130 | 3.0% |
| 40 to 44 Minutes | 89 | 2.1% |
| 45 to 59 Minutes | 136 | 3.2% |
| 60 to 89 Minutes | 102 | 2.4% |
| 90 or more Minutes | 75 | 1.7% |
Commute Time by Sex in Cuming County
The most common commute times in Cuming County are 5 to 9 minutes (745 commuters, 30.3%) for males and 5 to 9 minutes (463 commuters, 25.0%) for females.
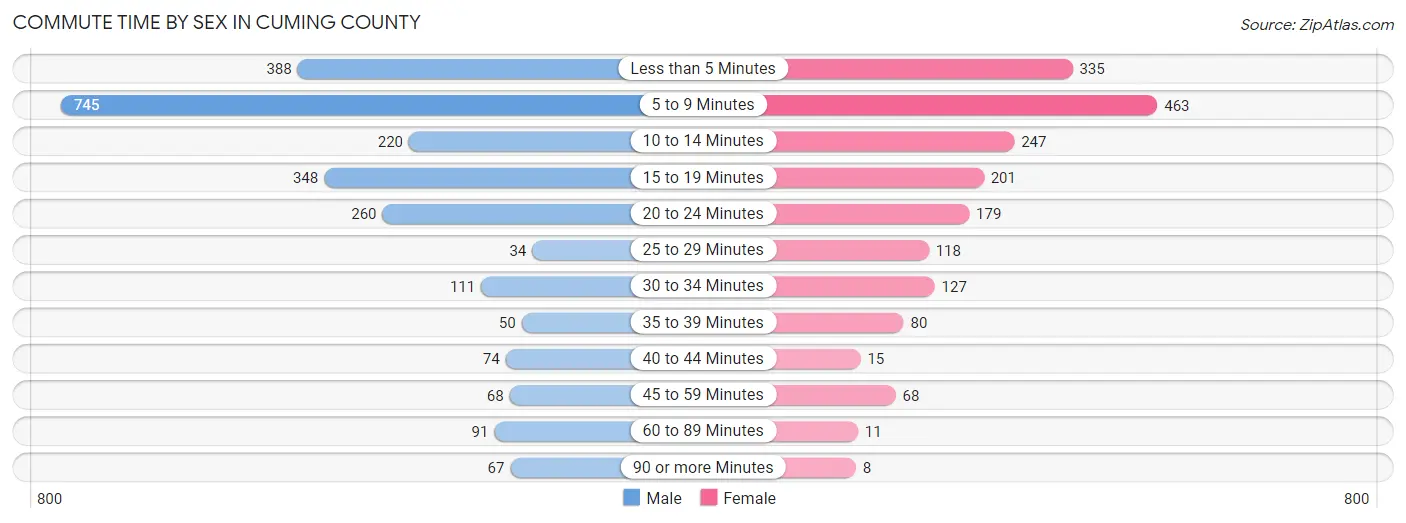
| Commute Time | Male | Female |
| Less than 5 Minutes | 388 (15.8%) | 335 (18.1%) |
| 5 to 9 Minutes | 745 (30.3%) | 463 (25.0%) |
| 10 to 14 Minutes | 220 (9.0%) | 247 (13.3%) |
| 15 to 19 Minutes | 348 (14.2%) | 201 (10.8%) |
| 20 to 24 Minutes | 260 (10.6%) | 179 (9.7%) |
| 25 to 29 Minutes | 34 (1.4%) | 118 (6.4%) |
| 30 to 34 Minutes | 111 (4.5%) | 127 (6.9%) |
| 35 to 39 Minutes | 50 (2.0%) | 80 (4.3%) |
| 40 to 44 Minutes | 74 (3.0%) | 15 (0.8%) |
| 45 to 59 Minutes | 68 (2.8%) | 68 (3.7%) |
| 60 to 89 Minutes | 91 (3.7%) | 11 (0.6%) |
| 90 or more Minutes | 67 (2.7%) | 8 (0.4%) |
Time of Departure to Work by Sex in Cuming County
The most frequent times of departure to work in Cuming County are 7:30 AM to 7:59 AM (486, 19.8%) for males and 7:30 AM to 7:59 AM (439, 23.7%) for females.
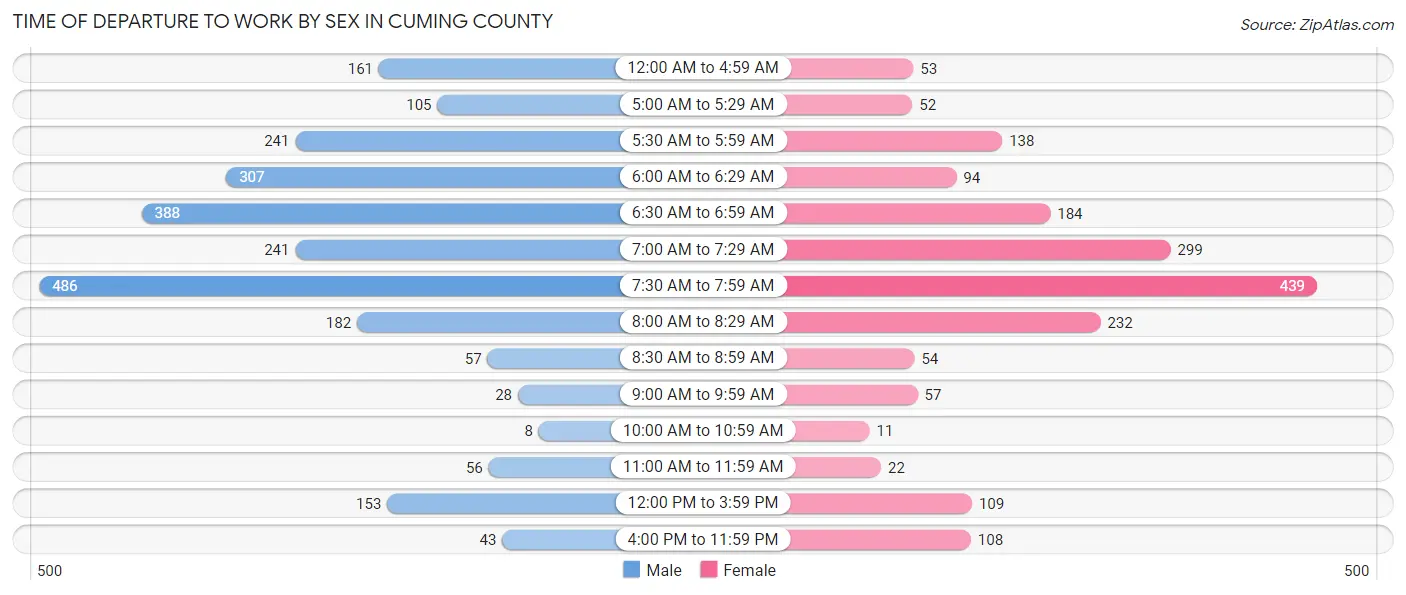
| Time of Departure | Male | Female |
| 12:00 AM to 4:59 AM | 161 (6.6%) | 53 (2.9%) |
| 5:00 AM to 5:29 AM | 105 (4.3%) | 52 (2.8%) |
| 5:30 AM to 5:59 AM | 241 (9.8%) | 138 (7.4%) |
| 6:00 AM to 6:29 AM | 307 (12.5%) | 94 (5.1%) |
| 6:30 AM to 6:59 AM | 388 (15.8%) | 184 (9.9%) |
| 7:00 AM to 7:29 AM | 241 (9.8%) | 299 (16.1%) |
| 7:30 AM to 7:59 AM | 486 (19.8%) | 439 (23.7%) |
| 8:00 AM to 8:29 AM | 182 (7.4%) | 232 (12.5%) |
| 8:30 AM to 8:59 AM | 57 (2.3%) | 54 (2.9%) |
| 9:00 AM to 9:59 AM | 28 (1.1%) | 57 (3.1%) |
| 10:00 AM to 10:59 AM | 8 (0.3%) | 11 (0.6%) |
| 11:00 AM to 11:59 AM | 56 (2.3%) | 22 (1.2%) |
| 12:00 PM to 3:59 PM | 153 (6.2%) | 109 (5.9%) |
| 4:00 PM to 11:59 PM | 43 (1.8%) | 108 (5.8%) |
| Total | 2,456 (100.0%) | 1,852 (100.0%) |
Housing Occupancy in Cuming County
Occupancy by Ownership in Cuming County
Of the total 3,711 dwellings in Cuming County, owner-occupied units account for 2,636 (71.0%), while renter-occupied units make up 1,075 (29.0%).
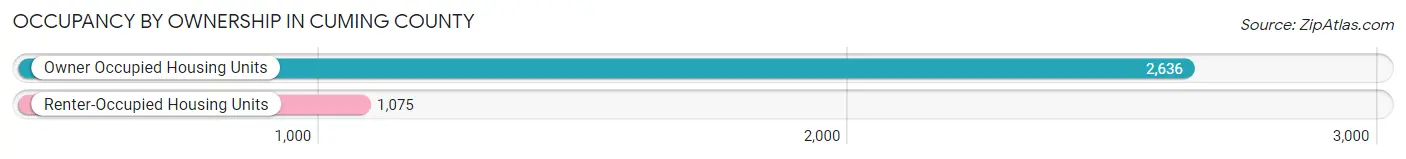
| Occupancy | # Housing Units | % Housing Units |
| Owner Occupied Housing Units | 2,636 | 71.0% |
| Renter-Occupied Housing Units | 1,075 | 29.0% |
| Total Occupied Housing Units | 3,711 | 100.0% |
Occupancy by Household Size in Cuming County
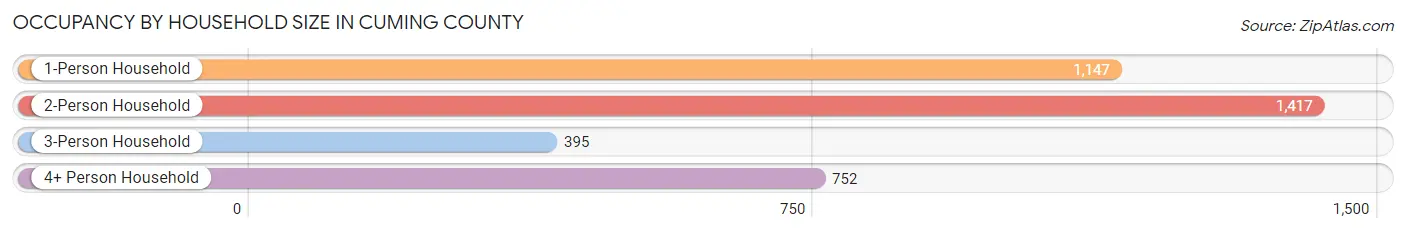
| Household Size | # Housing Units | % Housing Units |
| 1-Person Household | 1,147 | 30.9% |
| 2-Person Household | 1,417 | 38.2% |
| 3-Person Household | 395 | 10.6% |
| 4+ Person Household | 752 | 20.3% |
| Total Housing Units | 3,711 | 100.0% |
Occupancy by Ownership by Household Size in Cuming County
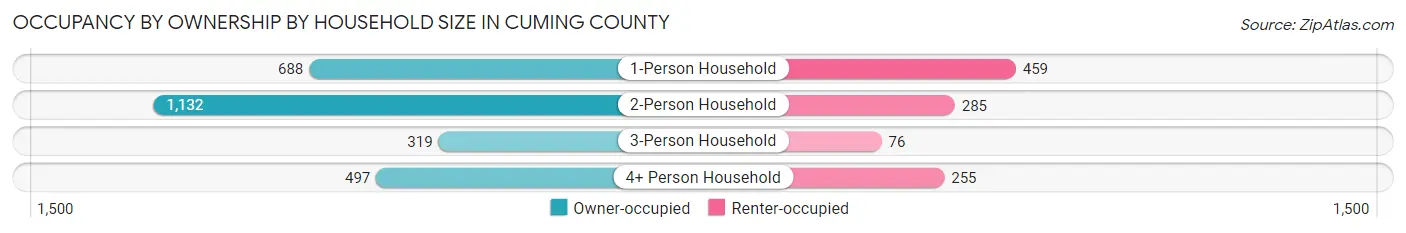
| Household Size | Owner-occupied | Renter-occupied |
| 1-Person Household | 688 (60.0%) | 459 (40.0%) |
| 2-Person Household | 1,132 (79.9%) | 285 (20.1%) |
| 3-Person Household | 319 (80.8%) | 76 (19.2%) |
| 4+ Person Household | 497 (66.1%) | 255 (33.9%) |
| Total Housing Units | 2,636 (71.0%) | 1,075 (29.0%) |
Occupancy by Educational Attainment in Cuming County
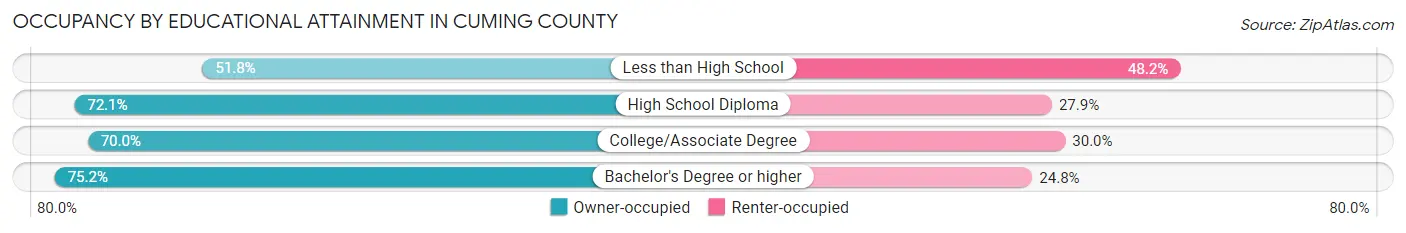
| Household Size | Owner-occupied | Renter-occupied |
| Less than High School | 101 (51.8%) | 94 (48.2%) |
| High School Diploma | 905 (72.1%) | 350 (27.9%) |
| College/Associate Degree | 947 (70.0%) | 406 (30.0%) |
| Bachelor's Degree or higher | 683 (75.2%) | 225 (24.8%) |
Occupancy by Age of Householder in Cuming County
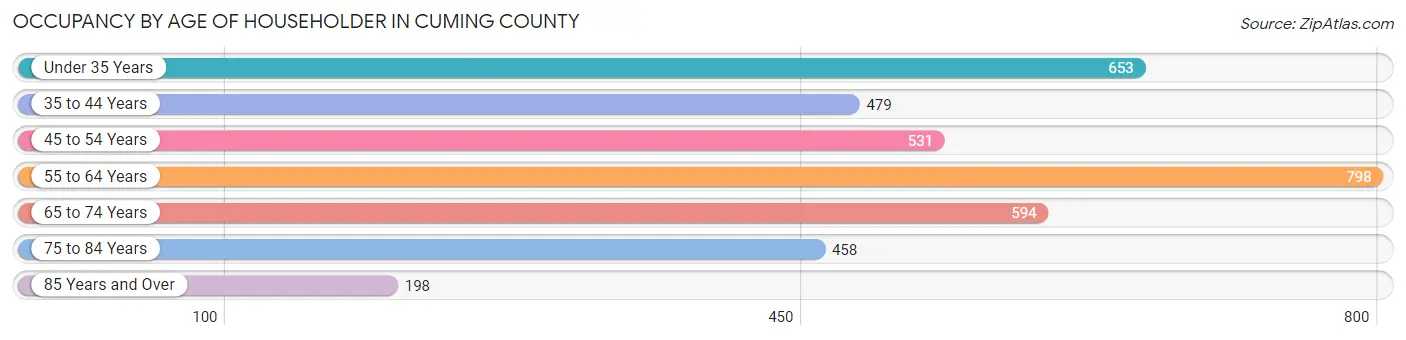
| Age Bracket | # Households | % Households |
| Under 35 Years | 653 | 17.6% |
| 35 to 44 Years | 479 | 12.9% |
| 45 to 54 Years | 531 | 14.3% |
| 55 to 64 Years | 798 | 21.5% |
| 65 to 74 Years | 594 | 16.0% |
| 75 to 84 Years | 458 | 12.3% |
| 85 Years and Over | 198 | 5.3% |
| Total | 3,711 | 100.0% |
Housing Finances in Cuming County
Median Income by Occupancy in Cuming County
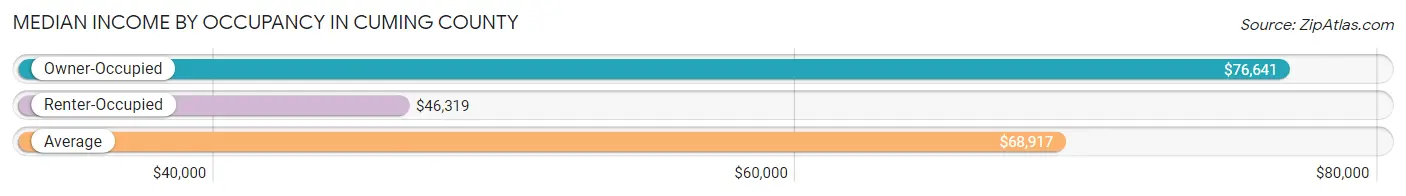
| Occupancy Type | # Households | Median Income |
| Owner-Occupied | 2,636 (71.0%) | $76,641 |
| Renter-Occupied | 1,075 (29.0%) | $46,319 |
| Average | 3,711 (100.0%) | $68,917 |
Occupancy by Householder Income Bracket in Cuming County
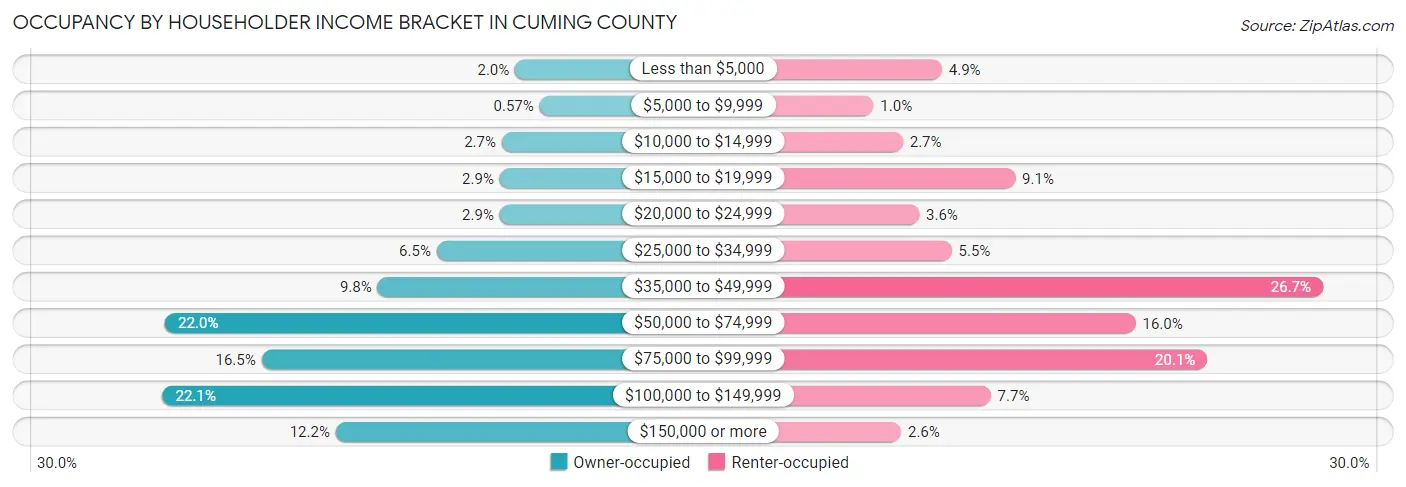
| Income Bracket | Owner-occupied | Renter-occupied |
| Less than $5,000 | 52 (2.0%) | 53 (4.9%) |
| $5,000 to $9,999 | 15 (0.6%) | 11 (1.0%) |
| $10,000 to $14,999 | 72 (2.7%) | 29 (2.7%) |
| $15,000 to $19,999 | 75 (2.9%) | 98 (9.1%) |
| $20,000 to $24,999 | 75 (2.9%) | 39 (3.6%) |
| $25,000 to $34,999 | 170 (6.5%) | 59 (5.5%) |
| $35,000 to $49,999 | 259 (9.8%) | 287 (26.7%) |
| $50,000 to $74,999 | 579 (22.0%) | 172 (16.0%) |
| $75,000 to $99,999 | 434 (16.5%) | 216 (20.1%) |
| $100,000 to $149,999 | 583 (22.1%) | 83 (7.7%) |
| $150,000 or more | 322 (12.2%) | 28 (2.6%) |
| Total | 2,636 (100.0%) | 1,075 (100.0%) |
Monthly Housing Cost Tiers in Cuming County
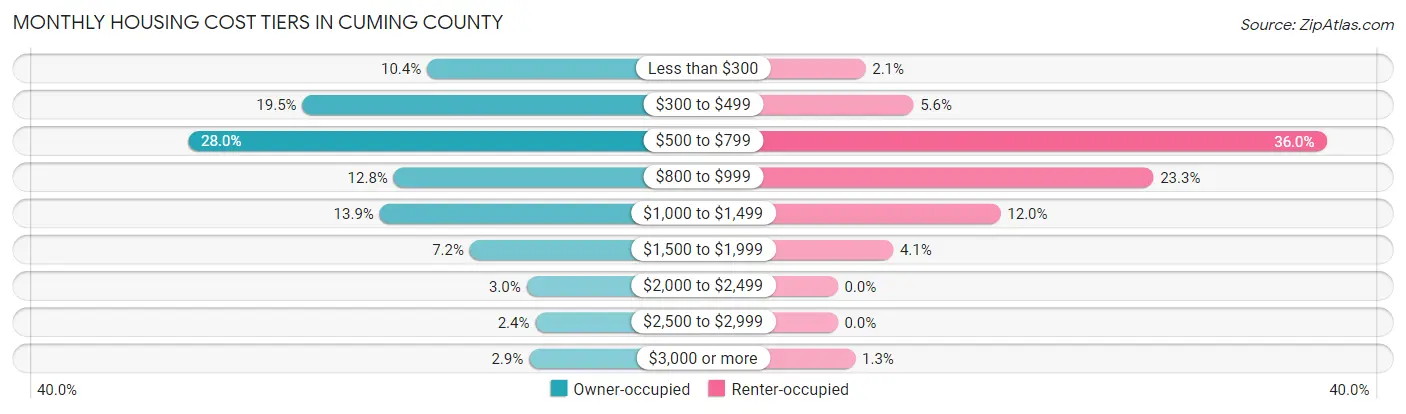
| Monthly Cost | Owner-occupied | Renter-occupied |
| Less than $300 | 273 (10.4%) | 22 (2.1%) |
| $300 to $499 | 515 (19.5%) | 60 (5.6%) |
| $500 to $799 | 737 (28.0%) | 387 (36.0%) |
| $800 to $999 | 338 (12.8%) | 250 (23.3%) |
| $1,000 to $1,499 | 365 (13.9%) | 129 (12.0%) |
| $1,500 to $1,999 | 190 (7.2%) | 44 (4.1%) |
| $2,000 to $2,499 | 80 (3.0%) | 0 (0.0%) |
| $2,500 to $2,999 | 63 (2.4%) | 0 (0.0%) |
| $3,000 or more | 75 (2.9%) | 14 (1.3%) |
| Total | 2,636 (100.0%) | 1,075 (100.0%) |
Physical Housing Characteristics in Cuming County
Housing Structures in Cuming County
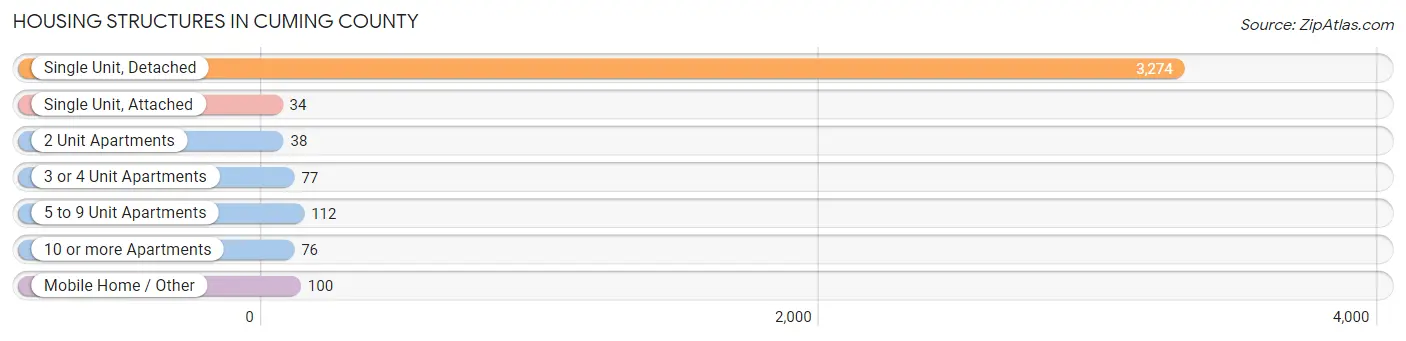
| Structure Type | # Housing Units | % Housing Units |
| Single Unit, Detached | 3,274 | 88.2% |
| Single Unit, Attached | 34 | 0.9% |
| 2 Unit Apartments | 38 | 1.0% |
| 3 or 4 Unit Apartments | 77 | 2.1% |
| 5 to 9 Unit Apartments | 112 | 3.0% |
| 10 or more Apartments | 76 | 2.1% |
| Mobile Home / Other | 100 | 2.7% |
| Total | 3,711 | 100.0% |
Housing Structures by Occupancy in Cuming County
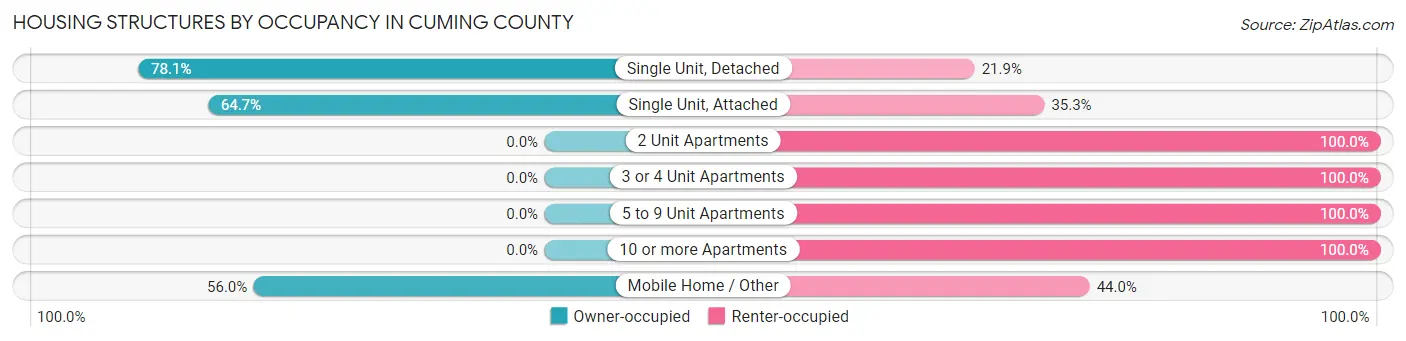
| Structure Type | Owner-occupied | Renter-occupied |
| Single Unit, Detached | 2,558 (78.1%) | 716 (21.9%) |
| Single Unit, Attached | 22 (64.7%) | 12 (35.3%) |
| 2 Unit Apartments | 0 (0.0%) | 38 (100.0%) |
| 3 or 4 Unit Apartments | 0 (0.0%) | 77 (100.0%) |
| 5 to 9 Unit Apartments | 0 (0.0%) | 112 (100.0%) |
| 10 or more Apartments | 0 (0.0%) | 76 (100.0%) |
| Mobile Home / Other | 56 (56.0%) | 44 (44.0%) |
| Total | 2,636 (71.0%) | 1,075 (29.0%) |
Housing Structures by Number of Rooms in Cuming County
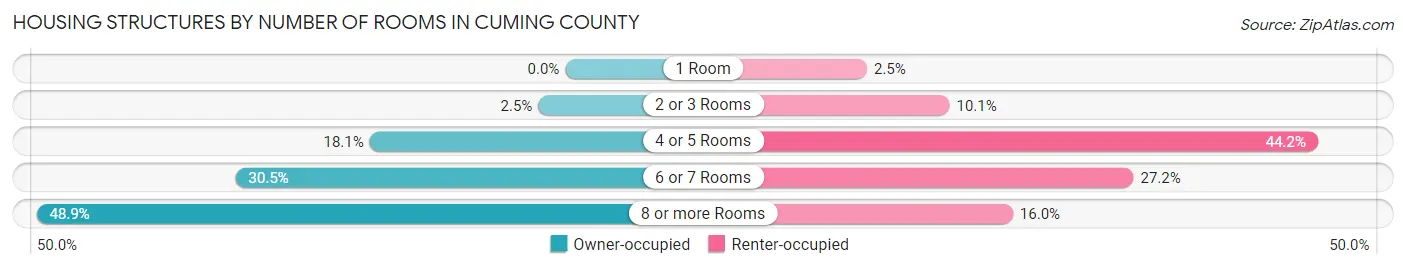
| Number of Rooms | Owner-occupied | Renter-occupied |
| 1 Room | 0 (0.0%) | 27 (2.5%) |
| 2 or 3 Rooms | 66 (2.5%) | 109 (10.1%) |
| 4 or 5 Rooms | 477 (18.1%) | 475 (44.2%) |
| 6 or 7 Rooms | 804 (30.5%) | 292 (27.2%) |
| 8 or more Rooms | 1,289 (48.9%) | 172 (16.0%) |
| Total | 2,636 (100.0%) | 1,075 (100.0%) |
Housing Structure by Heating Type in Cuming County
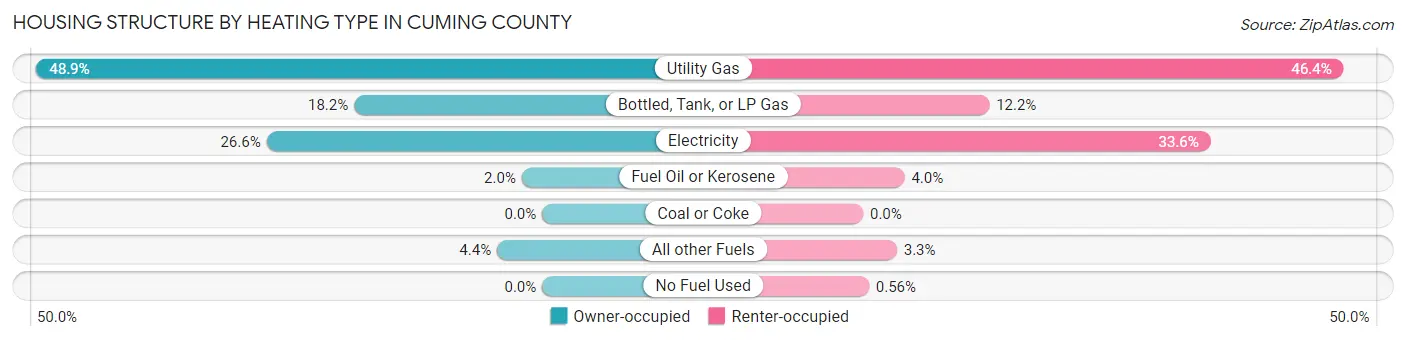
| Heating Type | Owner-occupied | Renter-occupied |
| Utility Gas | 1,288 (48.9%) | 499 (46.4%) |
| Bottled, Tank, or LP Gas | 479 (18.2%) | 131 (12.2%) |
| Electricity | 702 (26.6%) | 361 (33.6%) |
| Fuel Oil or Kerosene | 52 (2.0%) | 43 (4.0%) |
| Coal or Coke | 0 (0.0%) | 0 (0.0%) |
| All other Fuels | 115 (4.4%) | 35 (3.3%) |
| No Fuel Used | 0 (0.0%) | 6 (0.6%) |
| Total | 2,636 (100.0%) | 1,075 (100.0%) |
Household Vehicle Usage in Cuming County
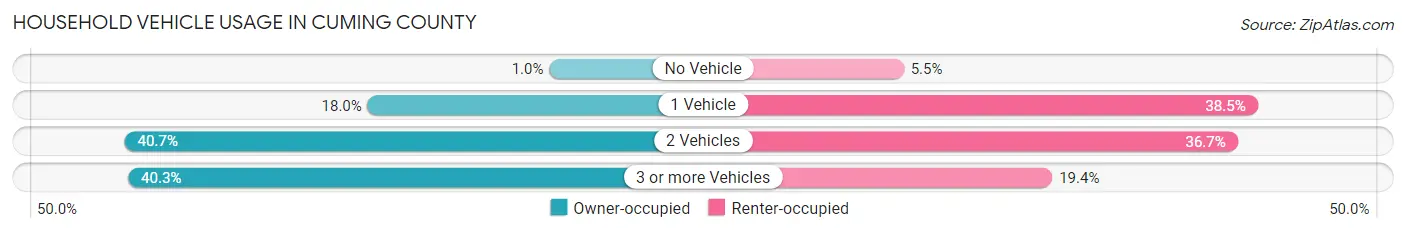
| Vehicles per Household | Owner-occupied | Renter-occupied |
| No Vehicle | 27 (1.0%) | 59 (5.5%) |
| 1 Vehicle | 474 (18.0%) | 414 (38.5%) |
| 2 Vehicles | 1,072 (40.7%) | 394 (36.6%) |
| 3 or more Vehicles | 1,063 (40.3%) | 208 (19.4%) |
| Total | 2,636 (100.0%) | 1,075 (100.0%) |
Real Estate & Mortgages in Cuming County
Real Estate and Mortgage Overview in Cuming County
| Characteristic | Without Mortgage | With Mortgage |
| Housing Units | 1,639 | 997 |
| Median Property Value | $141,700 | $203,200 |
| Median Household Income | $66,976 | $175 |
| Monthly Housing Costs | $525 | $75 |
| Real Estate Taxes | $1,615 | $34 |
Property Value by Mortgage Status in Cuming County
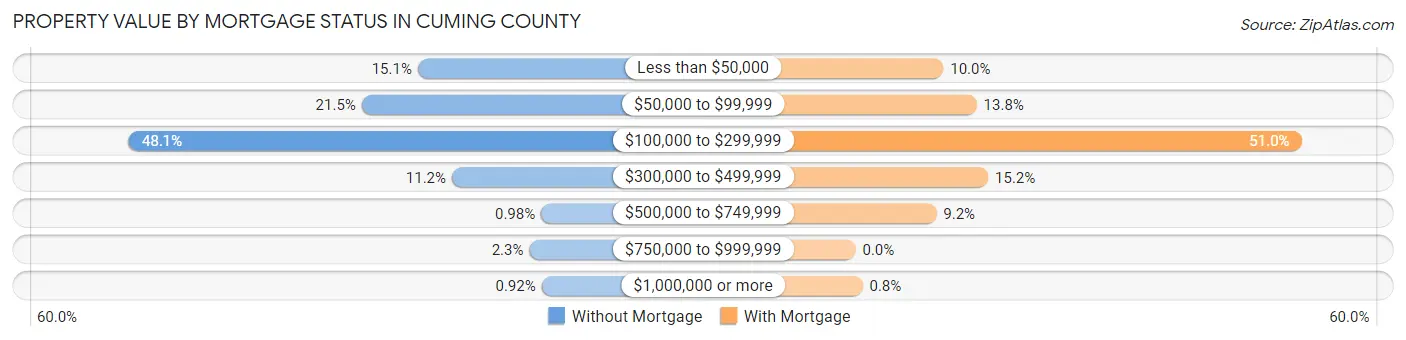
| Property Value | Without Mortgage | With Mortgage |
| Less than $50,000 | 247 (15.1%) | 100 (10.0%) |
| $50,000 to $99,999 | 352 (21.5%) | 138 (13.8%) |
| $100,000 to $299,999 | 788 (48.1%) | 508 (50.9%) |
| $300,000 to $499,999 | 183 (11.2%) | 151 (15.1%) |
| $500,000 to $749,999 | 16 (1.0%) | 92 (9.2%) |
| $750,000 to $999,999 | 38 (2.3%) | 0 (0.0%) |
| $1,000,000 or more | 15 (0.9%) | 8 (0.8%) |
| Total | 1,639 (100.0%) | 997 (100.0%) |
Household Income by Mortgage Status in Cuming County
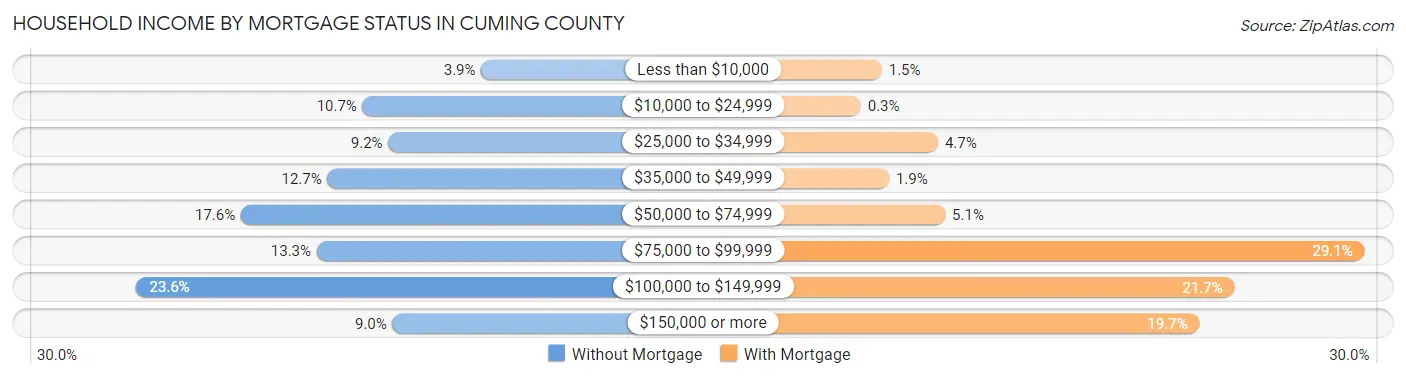
| Household Income | Without Mortgage | With Mortgage |
| Less than $10,000 | 64 (3.9%) | 15 (1.5%) |
| $10,000 to $24,999 | 175 (10.7%) | 3 (0.3%) |
| $25,000 to $34,999 | 151 (9.2%) | 47 (4.7%) |
| $35,000 to $49,999 | 208 (12.7%) | 19 (1.9%) |
| $50,000 to $74,999 | 289 (17.6%) | 51 (5.1%) |
| $75,000 to $99,999 | 218 (13.3%) | 290 (29.1%) |
| $100,000 to $149,999 | 387 (23.6%) | 216 (21.7%) |
| $150,000 or more | 147 (9.0%) | 196 (19.7%) |
| Total | 1,639 (100.0%) | 997 (100.0%) |
Property Value to Household Income Ratio in Cuming County
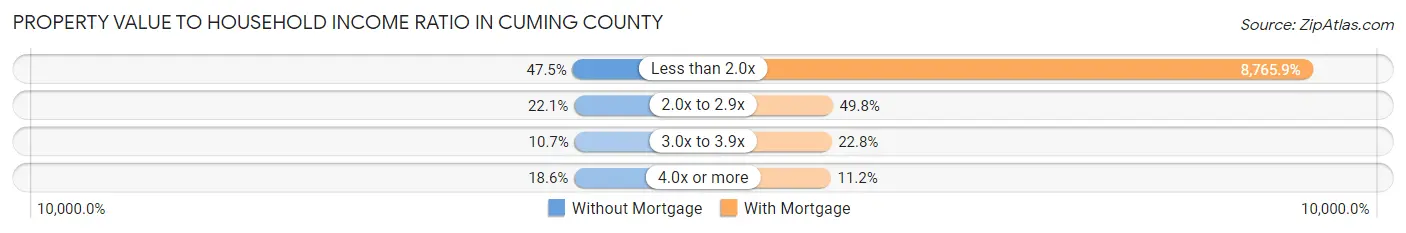
| Value-to-Income Ratio | Without Mortgage | With Mortgage |
| Less than 2.0x | 778 (47.5%) | 87,396 (8,765.9%) |
| 2.0x to 2.9x | 362 (22.1%) | 496 (49.7%) |
| 3.0x to 3.9x | 175 (10.7%) | 227 (22.8%) |
| 4.0x or more | 305 (18.6%) | 112 (11.2%) |
| Total | 1,639 (100.0%) | 997 (100.0%) |
Real Estate Taxes by Mortgage Status in Cuming County
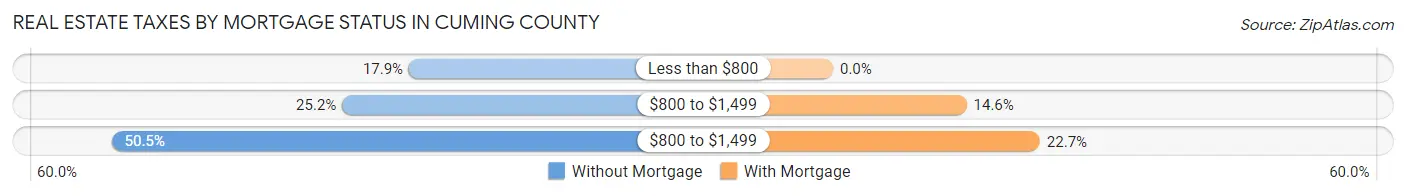
| Property Taxes | Without Mortgage | With Mortgage |
| Less than $800 | 293 (17.9%) | 0 (0.0%) |
| $800 to $1,499 | 413 (25.2%) | 146 (14.6%) |
| $800 to $1,499 | 827 (50.5%) | 226 (22.7%) |
| Total | 1,639 (100.0%) | 997 (100.0%) |
Health & Disability in Cuming County
Health Insurance Coverage by Age in Cuming County
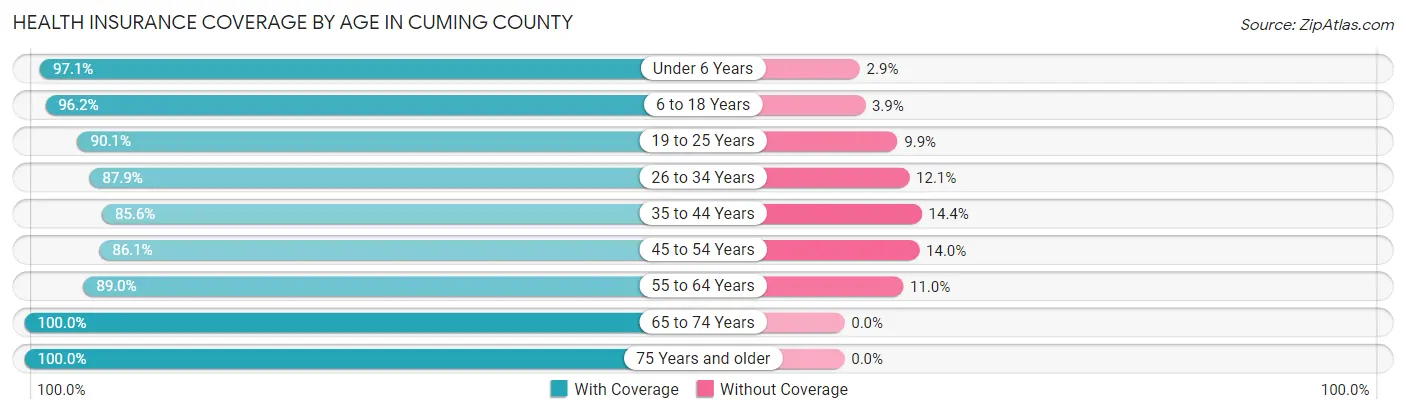
| Age Bracket | With Coverage | Without Coverage |
| Under 6 Years | 813 (97.1%) | 24 (2.9%) |
| 6 to 18 Years | 1,448 (96.2%) | 58 (3.8%) |
| 19 to 25 Years | 556 (90.1%) | 61 (9.9%) |
| 26 to 34 Years | 742 (87.9%) | 102 (12.1%) |
| 35 to 44 Years | 813 (85.6%) | 137 (14.4%) |
| 45 to 54 Years | 870 (86.1%) | 141 (14.0%) |
| 55 to 64 Years | 1,137 (89.0%) | 140 (11.0%) |
| 65 to 74 Years | 959 (100.0%) | 0 (0.0%) |
| 75 Years and older | 871 (100.0%) | 0 (0.0%) |
| Total | 8,209 (92.5%) | 663 (7.5%) |
Health Insurance Coverage by Citizenship Status in Cuming County
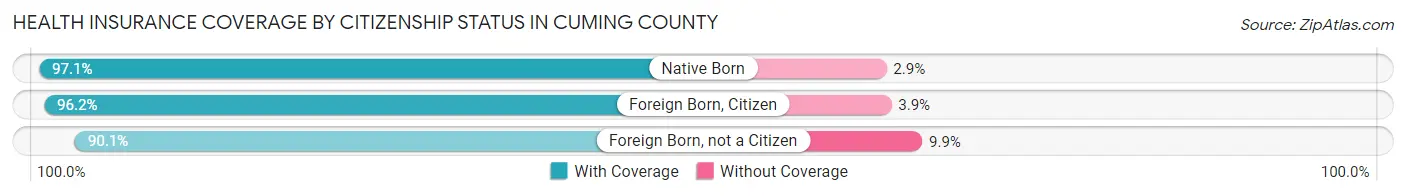
| Citizenship Status | With Coverage | Without Coverage |
| Native Born | 813 (97.1%) | 24 (2.9%) |
| Foreign Born, Citizen | 1,448 (96.2%) | 58 (3.8%) |
| Foreign Born, not a Citizen | 556 (90.1%) | 61 (9.9%) |
Health Insurance Coverage by Household Income in Cuming County
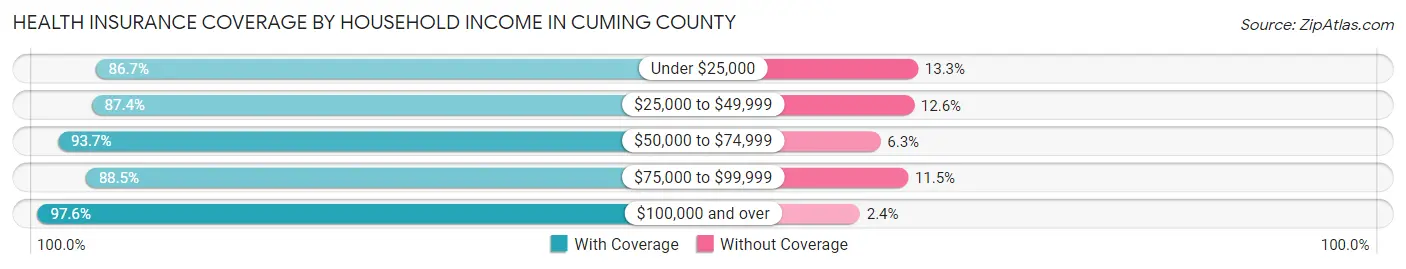
| Household Income | With Coverage | Without Coverage |
| Under $25,000 | 645 (86.7%) | 99 (13.3%) |
| $25,000 to $49,999 | 1,252 (87.4%) | 180 (12.6%) |
| $50,000 to $74,999 | 1,906 (93.7%) | 128 (6.3%) |
| $75,000 to $99,999 | 1,398 (88.5%) | 181 (11.5%) |
| $100,000 and over | 3,007 (97.6%) | 75 (2.4%) |
Public vs Private Health Insurance Coverage by Age in Cuming County
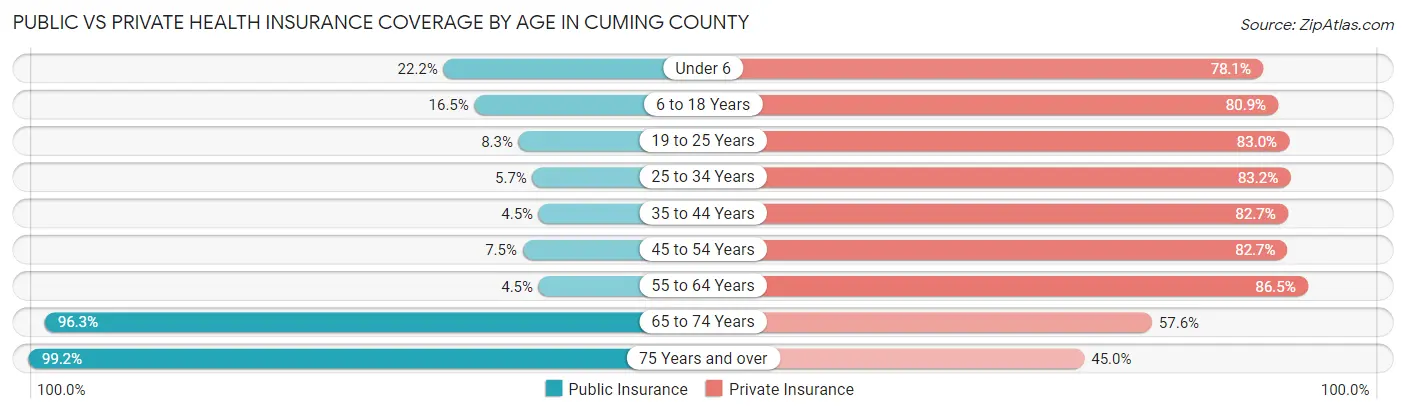
| Age Bracket | Public Insurance | Private Insurance |
| Under 6 | 186 (22.2%) | 654 (78.1%) |
| 6 to 18 Years | 248 (16.5%) | 1,219 (80.9%) |
| 19 to 25 Years | 51 (8.3%) | 512 (83.0%) |
| 25 to 34 Years | 48 (5.7%) | 702 (83.2%) |
| 35 to 44 Years | 43 (4.5%) | 786 (82.7%) |
| 45 to 54 Years | 76 (7.5%) | 836 (82.7%) |
| 55 to 64 Years | 58 (4.5%) | 1,104 (86.5%) |
| 65 to 74 Years | 923 (96.3%) | 552 (57.6%) |
| 75 Years and over | 864 (99.2%) | 392 (45.0%) |
| Total | 2,497 (28.1%) | 6,757 (76.2%) |
Disability Status by Sex by Age in Cuming County
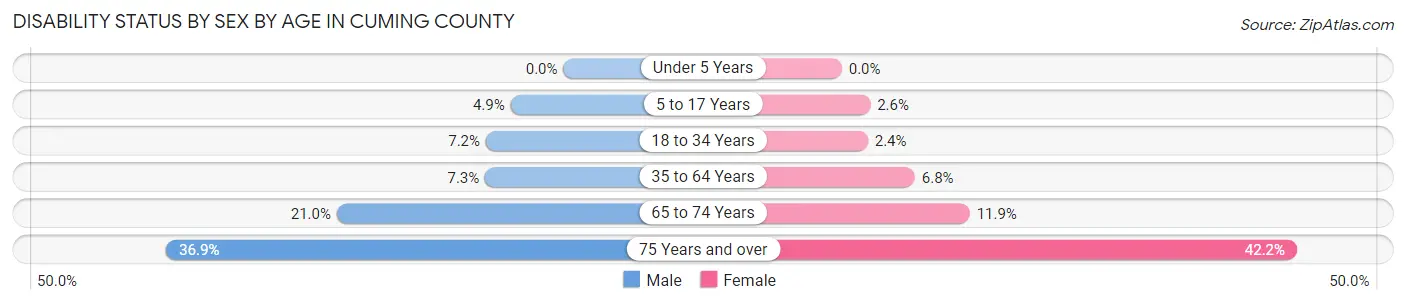
| Age Bracket | Male | Female |
| Under 5 Years | 0 (0.0%) | 0 (0.0%) |
| 5 to 17 Years | 38 (4.9%) | 22 (2.6%) |
| 18 to 34 Years | 58 (7.2%) | 19 (2.4%) |
| 35 to 64 Years | 127 (7.3%) | 101 (6.8%) |
| 65 to 74 Years | 106 (21.0%) | 54 (11.9%) |
| 75 Years and over | 129 (36.9%) | 220 (42.2%) |
Disability Class by Sex by Age in Cuming County
Disability Class: Hearing Difficulty
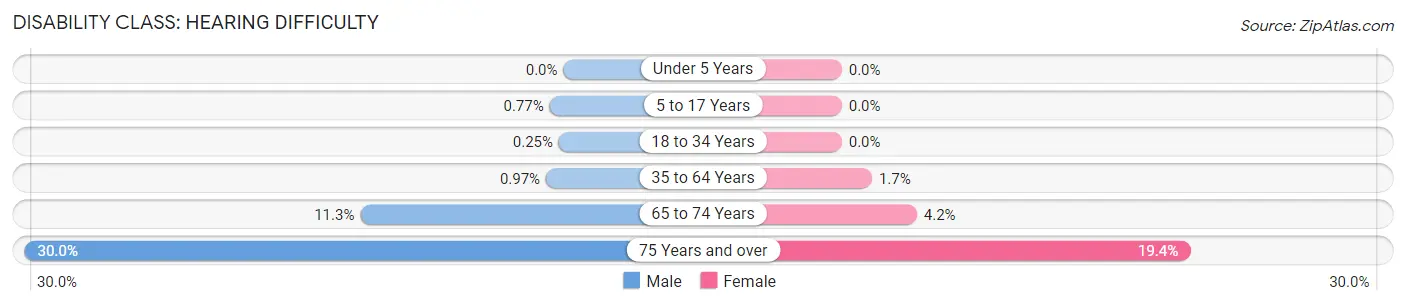
| Age Bracket | Male | Female |
| Under 5 Years | 0 (0.0%) | 0 (0.0%) |
| 5 to 17 Years | 6 (0.8%) | 0 (0.0%) |
| 18 to 34 Years | 2 (0.3%) | 0 (0.0%) |
| 35 to 64 Years | 17 (1.0%) | 25 (1.7%) |
| 65 to 74 Years | 57 (11.3%) | 19 (4.2%) |
| 75 Years and over | 105 (30.0%) | 101 (19.4%) |
Disability Class: Vision Difficulty
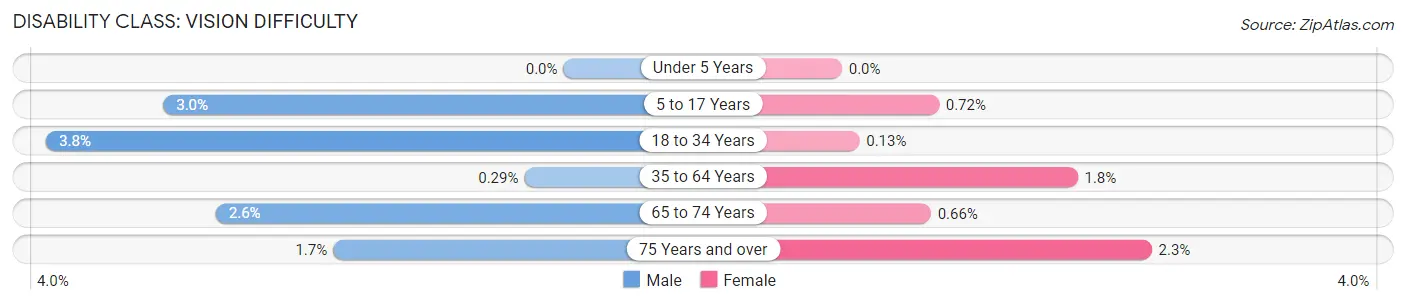
| Age Bracket | Male | Female |
| Under 5 Years | 0 (0.0%) | 0 (0.0%) |
| 5 to 17 Years | 23 (3.0%) | 6 (0.7%) |
| 18 to 34 Years | 31 (3.8%) | 1 (0.1%) |
| 35 to 64 Years | 5 (0.3%) | 26 (1.8%) |
| 65 to 74 Years | 13 (2.6%) | 3 (0.7%) |
| 75 Years and over | 6 (1.7%) | 12 (2.3%) |
Disability Class: Cognitive Difficulty
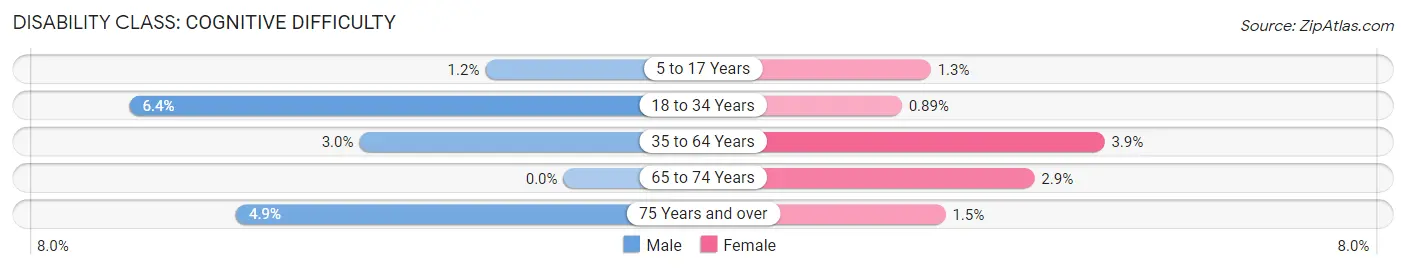
| Age Bracket | Male | Female |
| 5 to 17 Years | 9 (1.2%) | 11 (1.3%) |
| 18 to 34 Years | 52 (6.4%) | 7 (0.9%) |
| 35 to 64 Years | 53 (3.0%) | 58 (3.9%) |
| 65 to 74 Years | 0 (0.0%) | 13 (2.9%) |
| 75 Years and over | 17 (4.9%) | 8 (1.5%) |
Disability Class: Ambulatory Difficulty
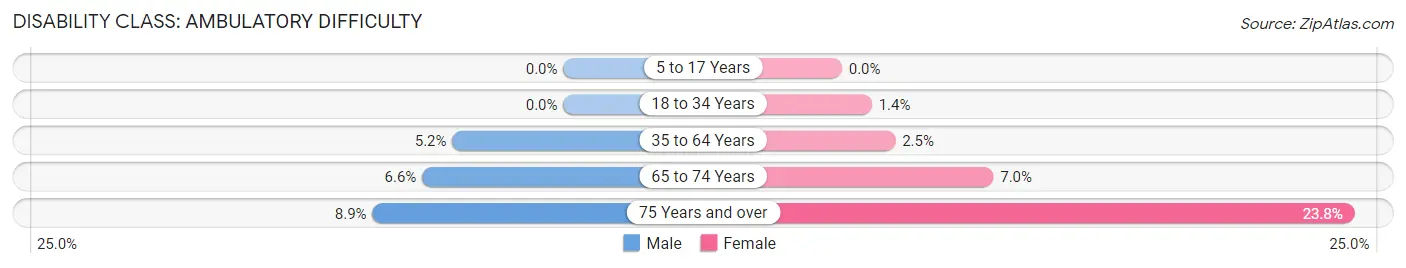
| Age Bracket | Male | Female |
| 5 to 17 Years | 0 (0.0%) | 0 (0.0%) |
| 18 to 34 Years | 0 (0.0%) | 11 (1.4%) |
| 35 to 64 Years | 90 (5.1%) | 37 (2.5%) |
| 65 to 74 Years | 33 (6.6%) | 32 (7.0%) |
| 75 Years and over | 31 (8.9%) | 124 (23.8%) |
Disability Class: Self-Care Difficulty
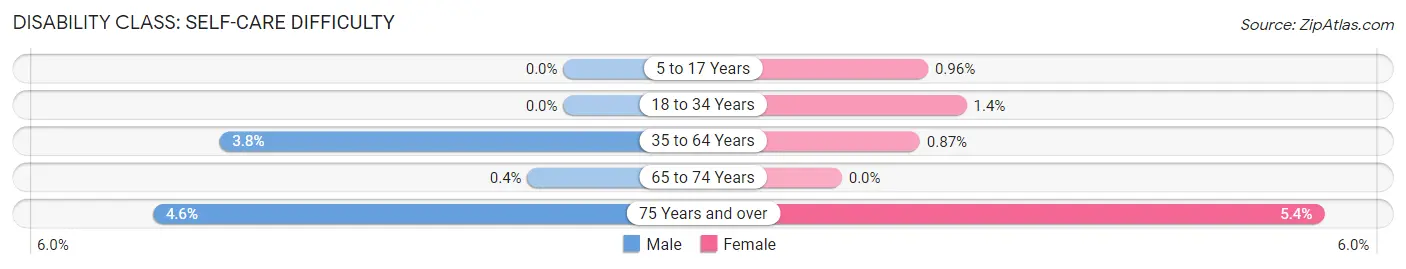
| Age Bracket | Male | Female |
| 5 to 17 Years | 0 (0.0%) | 8 (1.0%) |
| 18 to 34 Years | 0 (0.0%) | 11 (1.4%) |
| 35 to 64 Years | 67 (3.8%) | 13 (0.9%) |
| 65 to 74 Years | 2 (0.4%) | 0 (0.0%) |
| 75 Years and over | 16 (4.6%) | 28 (5.4%) |
Technology Access in Cuming County
Computing Device Access in Cuming County
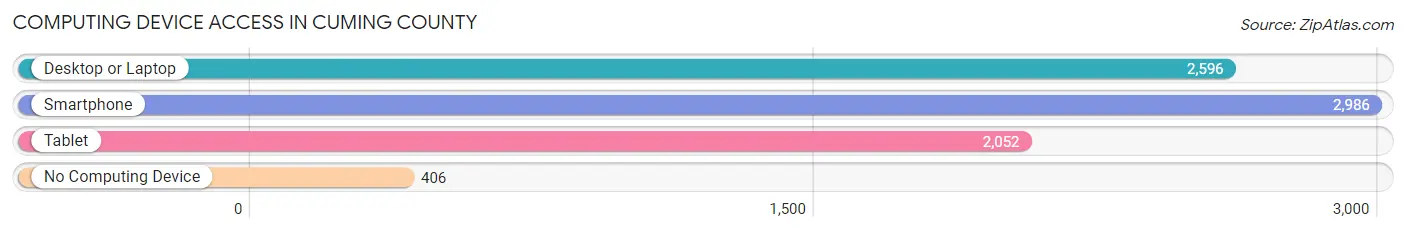
| Device Type | # Households | % Households |
| Desktop or Laptop | 2,596 | 70.0% |
| Smartphone | 2,986 | 80.5% |
| Tablet | 2,052 | 55.3% |
| No Computing Device | 406 | 10.9% |
| Total | 3,711 | 100.0% |
Internet Access in Cuming County
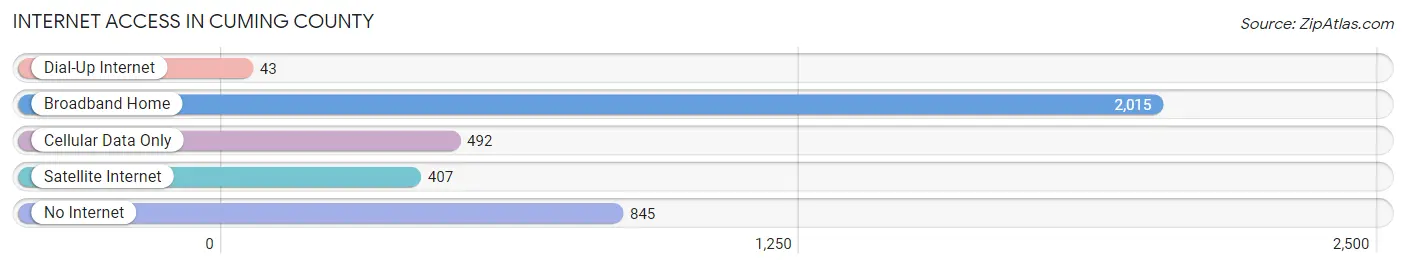
| Internet Type | # Households | % Households |
| Dial-Up Internet | 43 | 1.2% |
| Broadband Home | 2,015 | 54.3% |
| Cellular Data Only | 492 | 13.3% |
| Satellite Internet | 407 | 11.0% |
| No Internet | 845 | 22.8% |
| Total | 3,711 | 100.0% |
Cuming County Summary
Cuming County is located in the northeastern corner of Nebraska, and is bordered by the states of Iowa and South Dakota. It is part of the Omaha-Council Bluffs Metropolitan Statistical Area. The county was named after Fort Cuming, which was established in 1819 by Colonel Stephen W. Kearny.
History
The area that is now Cuming County was originally inhabited by the Omaha and Pawnee tribes. The first white settlers arrived in the area in the early 1840s, and the county was officially established in 1855. The county seat is West Point, which was founded in 1857.
The county was largely agricultural in the 19th century, with the main crops being corn, wheat, and oats. In the early 20th century, the county began to diversify its economy, with the establishment of several manufacturing plants.
Geography
Cuming County covers an area of 576 square miles, and is located in the northeastern corner of Nebraska. It is bordered by the states of Iowa and South Dakota. The county is mostly flat, with some rolling hills in the western part. The county is drained by the Elkhorn River and its tributaries.
The county has a humid continental climate, with cold winters and hot, humid summers. The average annual temperature is 48°F, and the average annual precipitation is 30 inches.
Economy
The economy of Cuming County is largely based on agriculture and manufacturing. The main crops grown in the county are corn, soybeans, wheat, and oats. The county also has several manufacturing plants, including a meat packing plant, a plastics plant, and a furniture factory.
The county also has a thriving tourism industry, with several attractions, including the West Point Historical Museum, the West Point Aquatic Center, and the West Point Golf Course.
Demographics
As of the 2010 census, the population of Cuming County was 10,149. The population is predominantly white (94.3%), with small percentages of African American (2.2%), Native American (1.2%), and Asian (0.7%) residents. The median household income is $50,945, and the median home value is $117,400.
The county has a relatively low unemployment rate of 3.2%, and a poverty rate of 8.7%. The largest employers in the county are the West Point Public Schools, the West Point Community Hospital, and the West Point Manufacturing Company.
Conclusion
Cuming County is a rural county located in the northeastern corner of Nebraska. It has a largely agricultural economy, with some manufacturing and tourism. The population is predominantly white, with small percentages of African American, Native American, and Asian residents. The county has a low unemployment rate and a median household income of $50,945.
Common Questions
What is the Total Population of Cuming County?
Total Population of Cuming County is 9,000.
What is the Total Male Population of Cuming County?
Total Male Population of Cuming County is 4,582.
What is the Total Female Population of Cuming County?
Total Female Population of Cuming County is 4,418.
What is the Ratio of Males per 100 Females in Cuming County?
There are 103.71 Males per 100 Females in Cuming County.
What is the Ratio of Females per 100 Males in Cuming County?
There are 96.42 Females per 100 Males in Cuming County.
What is the Median Population Age in Cuming County?
Median Population Age in Cuming County is 41.8 Years.
What is the Average Family Size in Cuming County
Average Family Size in Cuming County is 3.0 People.
What is the Average Household Size in Cuming County
Average Household Size in Cuming County is 2.4 People.
What is Per Capita Income in Cuming County?
Per Capita income in Cuming County is $34,825.
What is the Median Family Income in Cuming County?
Median Family Income in Cuming County is $83,687.
What is the Median Household income in Cuming County?
Median Household Income in Cuming County is $68,917.
What is Income or Wage Gap in Cuming County?
Income or Wage Gap in Cuming County is 38.7%.
Women in Cuming County earn 61.3 cents for every dollar earned by a man.
What is Inequality or Gini Index in Cuming County?
Inequality or Gini Index in Cuming County is 0.40.
How Large is the Labor Force in Cuming County?
There are 4,821 People in the Labor Forcein in Cuming County.
What is the Percentage of People in the Labor Force in Cuming County?
68.0% of People are in the Labor Force in Cuming County.
What is the Unemployment Rate in Cuming County?
Unemployment Rate in Cuming County is 2.6%.