Colfax County, NE
Colfax County Overview
10,563
TOTAL POPULATION
5,742
MALE POPULATION
4,821
FEMALE POPULATION
119.10
MALES / 100 FEMALES
83.96
FEMALES / 100 MALES
36.4
MEDIAN AGE
3.3
AVG FAMILY SIZE
2.9
AVG HOUSEHOLD SIZE
$29,436
PER CAPITA INCOME
$75,430
AVG FAMILY INCOME
$71,205
AVG HOUSEHOLD INCOME
21.9%
WAGE / INCOME GAP [ % ]
78.1¢/ $1
WAGE / INCOME GAP [ $ ]
$8,715
FAMILY INCOME DEFICIT
0.39
INEQUALITY / GINI INDEX
5,452
LABOR FORCE [ PEOPLE ]
70.4%
PERCENT IN LABOR FORCE
1.7%
UNEMPLOYMENT RATE
Colfax County Area Codes
Race in Colfax County
The most populous races in Colfax County are White / Caucasian (6,883 | 65.2%), Hispanic or Latino (4,874 | 46.1%), and Two or more Races (1,414 | 13.4%).
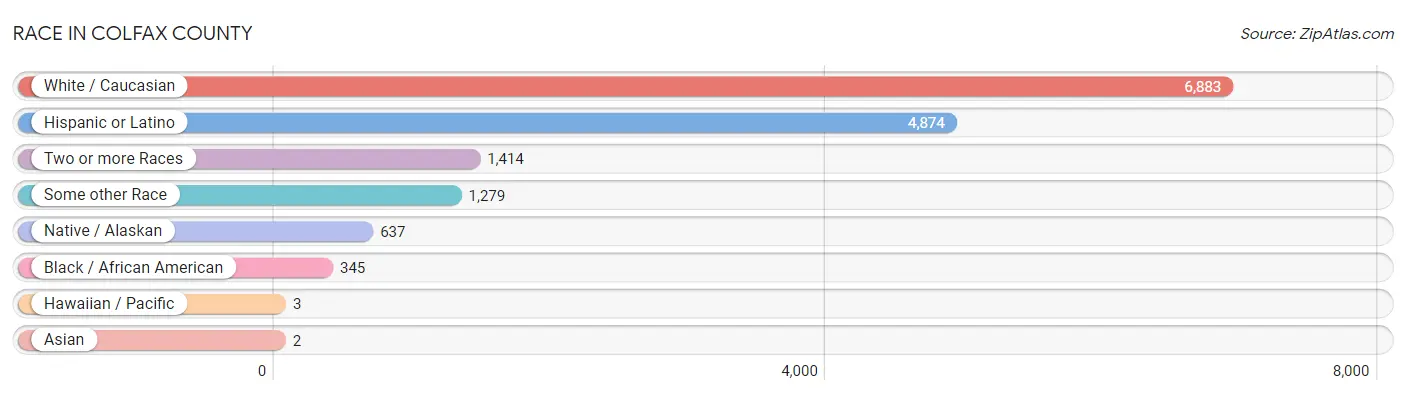
| Race | # Population | % Population |
| Asian | 2 | 0.0% |
| Black / African American | 345 | 3.3% |
| Hawaiian / Pacific | 3 | 0.0% |
| Hispanic or Latino | 4,874 | 46.1% |
| Native / Alaskan | 637 | 6.0% |
| White / Caucasian | 6,883 | 65.2% |
| Two or more Races | 1,414 | 13.4% |
| Some other Race | 1,279 | 12.1% |
| Total | 10,563 | 100.0% |
Ancestry in Colfax County
The most populous ancestries reported in Colfax County are Mexican (3,015 | 28.5%), German (2,091 | 19.8%), Central American (1,255 | 11.9%), Czech (1,247 | 11.8%), and Guatemalan (1,192 | 11.3%), together accounting for 83.3% of all Colfax County residents.
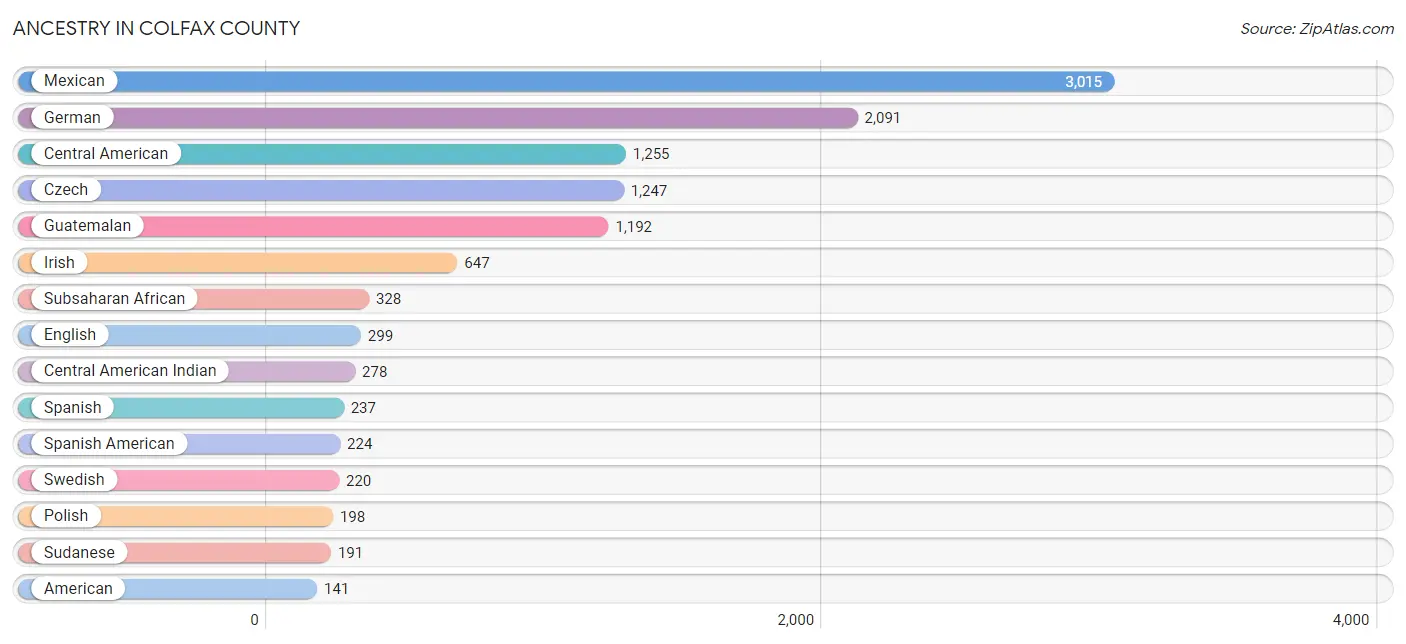
| Ancestry | # Population | % Population |
| African | 137 | 1.3% |
| American | 141 | 1.3% |
| Apache | 39 | 0.4% |
| Austrian | 7 | 0.1% |
| Central American | 1,255 | 11.9% |
| Central American Indian | 278 | 2.6% |
| Chippewa | 6 | 0.1% |
| Colombian | 1 | 0.0% |
| Cuban | 23 | 0.2% |
| Czech | 1,247 | 11.8% |
| Czechoslovakian | 32 | 0.3% |
| Danish | 82 | 0.8% |
| Dutch | 56 | 0.5% |
| English | 299 | 2.8% |
| European | 16 | 0.2% |
| French | 16 | 0.2% |
| French Canadian | 30 | 0.3% |
| German | 2,091 | 19.8% |
| Guatemalan | 1,192 | 11.3% |
| Irish | 647 | 6.1% |
| Italian | 59 | 0.6% |
| Korean | 64 | 0.6% |
| Luxembourger | 5 | 0.1% |
| Mexican | 3,015 | 28.5% |
| Mexican American Indian | 10 | 0.1% |
| Native Hawaiian | 3 | 0.0% |
| Northern European | 3 | 0.0% |
| Norwegian | 19 | 0.2% |
| Polish | 198 | 1.9% |
| Russian | 15 | 0.1% |
| Salvadoran | 46 | 0.4% |
| Scandinavian | 1 | 0.0% |
| Scotch-Irish | 1 | 0.0% |
| Scottish | 21 | 0.2% |
| Sioux | 90 | 0.9% |
| Slovak | 17 | 0.2% |
| South American | 1 | 0.0% |
| Spaniard | 39 | 0.4% |
| Spanish | 237 | 2.2% |
| Spanish American | 224 | 2.1% |
| Subsaharan African | 328 | 3.1% |
| Sudanese | 191 | 1.8% |
| Swedish | 220 | 2.1% |
| Swiss | 29 | 0.3% |
| Thai | 2 | 0.0% |
| Welsh | 47 | 0.4% | View All 46 Rows |
Immigrants in Colfax County
The most numerous immigrant groups reported in Colfax County came from Latin America (3,069 | 29.0%), Central America (3,045 | 28.8%), Mexico (2,275 | 21.5%), Guatemala (638 | 6.0%), and Africa (328 | 3.1%), together accounting for 88.6% of all Colfax County residents.
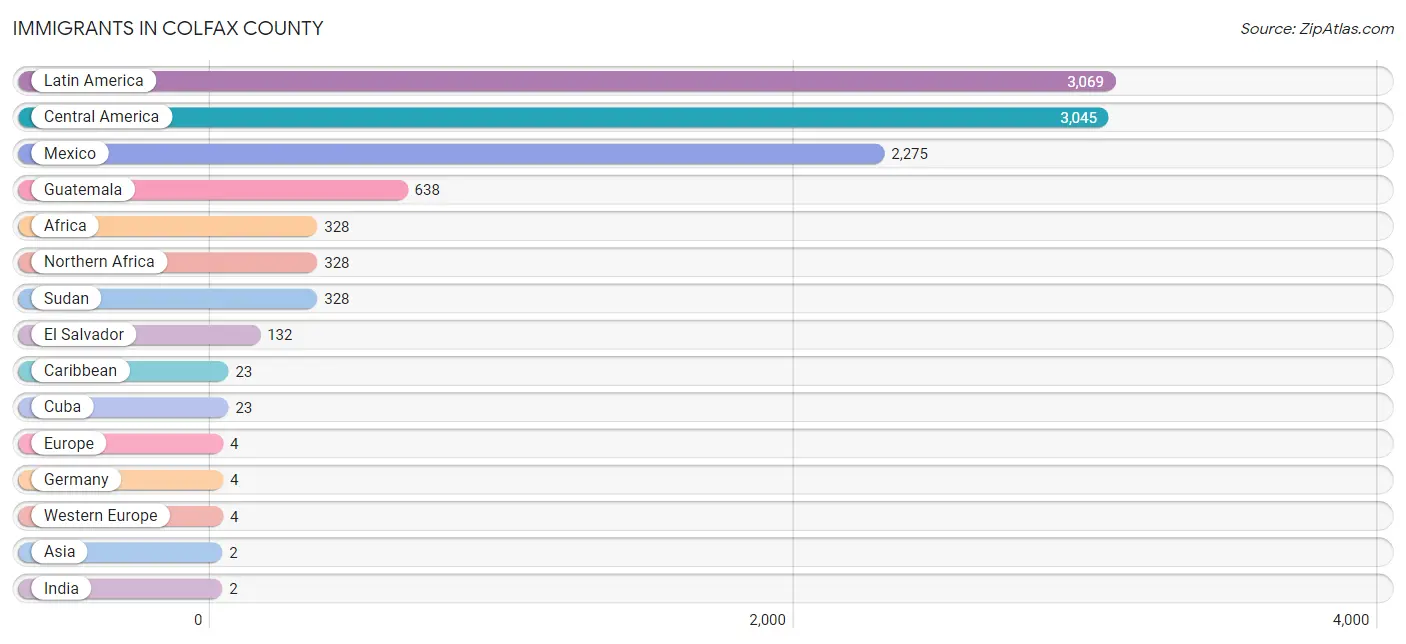
| Immigration Origin | # Population | % Population |
| Africa | 328 | 3.1% |
| Asia | 2 | 0.0% |
| Caribbean | 23 | 0.2% |
| Central America | 3,045 | 28.8% |
| Colombia | 1 | 0.0% |
| Cuba | 23 | 0.2% |
| El Salvador | 132 | 1.3% |
| Europe | 4 | 0.0% |
| Germany | 4 | 0.0% |
| Guatemala | 638 | 6.0% |
| India | 2 | 0.0% |
| Latin America | 3,069 | 29.0% |
| Mexico | 2,275 | 21.5% |
| Northern Africa | 328 | 3.1% |
| South America | 1 | 0.0% |
| South Central Asia | 2 | 0.0% |
| Sudan | 328 | 3.1% |
| Western Europe | 4 | 0.0% | View All 18 Rows |
Sex and Age in Colfax County
Sex and Age in Colfax County
The most populous age groups in Colfax County are 50 to 54 Years (603 | 10.5%) for men and 10 to 14 Years (559 | 11.6%) for women.
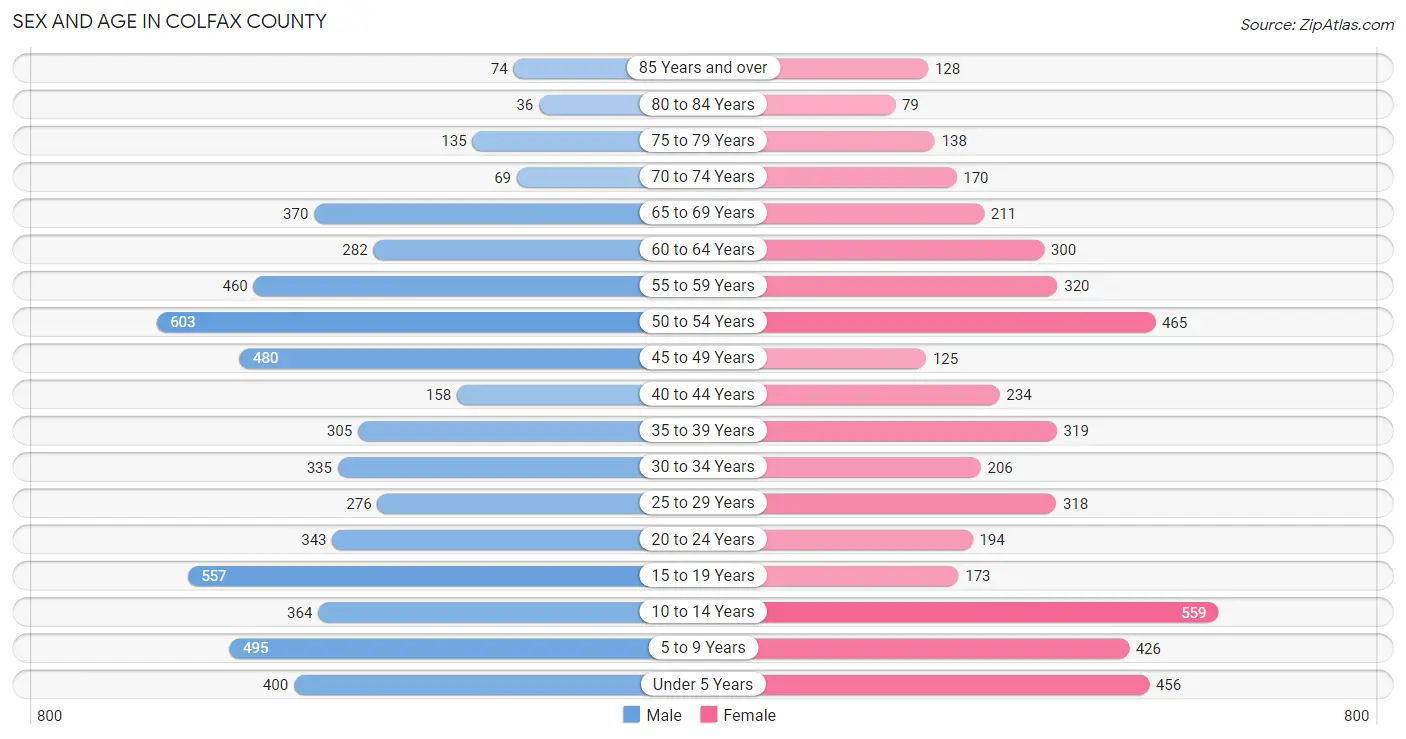
| Age Bracket | Male | Female |
| Under 5 Years | 400 (7.0%) | 456 (9.5%) |
| 5 to 9 Years | 495 (8.6%) | 426 (8.8%) |
| 10 to 14 Years | 364 (6.3%) | 559 (11.6%) |
| 15 to 19 Years | 557 (9.7%) | 173 (3.6%) |
| 20 to 24 Years | 343 (6.0%) | 194 (4.0%) |
| 25 to 29 Years | 276 (4.8%) | 318 (6.6%) |
| 30 to 34 Years | 335 (5.8%) | 206 (4.3%) |
| 35 to 39 Years | 305 (5.3%) | 319 (6.6%) |
| 40 to 44 Years | 158 (2.8%) | 234 (4.9%) |
| 45 to 49 Years | 480 (8.4%) | 125 (2.6%) |
| 50 to 54 Years | 603 (10.5%) | 465 (9.7%) |
| 55 to 59 Years | 460 (8.0%) | 320 (6.6%) |
| 60 to 64 Years | 282 (4.9%) | 300 (6.2%) |
| 65 to 69 Years | 370 (6.4%) | 211 (4.4%) |
| 70 to 74 Years | 69 (1.2%) | 170 (3.5%) |
| 75 to 79 Years | 135 (2.4%) | 138 (2.9%) |
| 80 to 84 Years | 36 (0.6%) | 79 (1.6%) |
| 85 Years and over | 74 (1.3%) | 128 (2.7%) |
| Total | 5,742 (100.0%) | 4,821 (100.0%) |
Families and Households in Colfax County
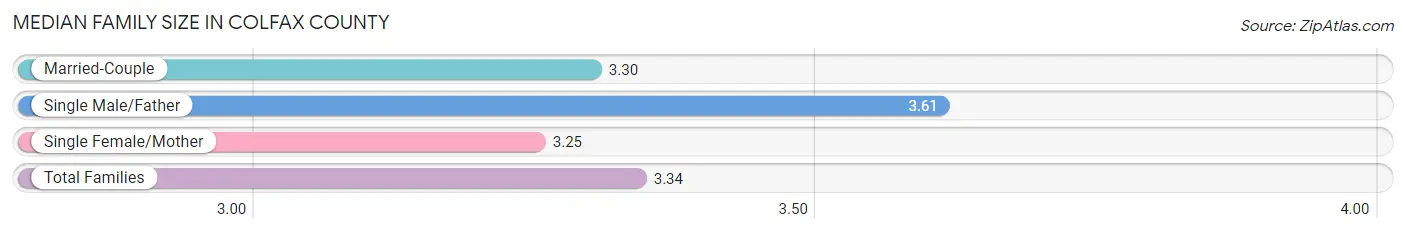
Median Family Size in Colfax County
The median family size in Colfax County is 3.34 persons per family, with single male/father families (414 | 16.0%) accounting for the largest median family size of 3.61 persons per family. On the other hand, single female/mother families (234 | 9.0%) represent the smallest median family size with 3.25 persons per family.
| Family Type | # Families | Family Size |
| Married-Couple | 1,940 (75.0%) | 3.30 |
| Single Male/Father | 414 (16.0%) | 3.61 |
| Single Female/Mother | 234 (9.0%) | 3.25 |
| Total Families | 2,588 (100.0%) | 3.34 |
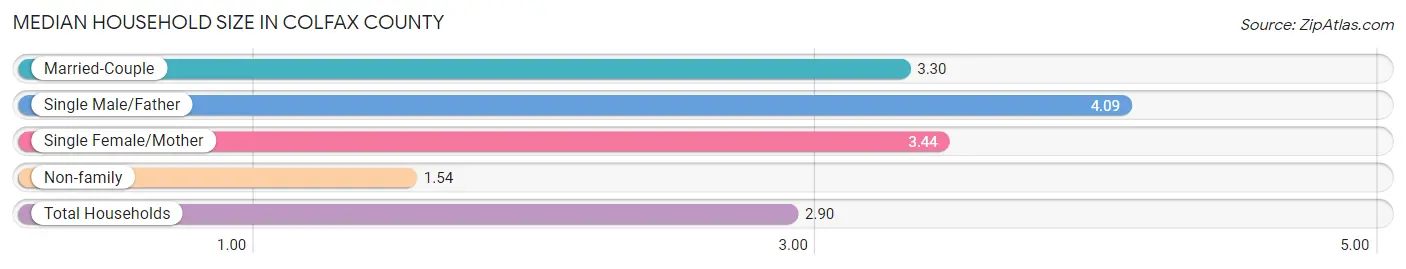
Median Household Size in Colfax County
The median household size in Colfax County is 2.90 persons per household, with single male/father households (414 | 11.5%) accounting for the largest median household size of 4.09 persons per household. non-family households (1,028 | 28.4%) represent the smallest median household size with 1.54 persons per household.
| Household Type | # Households | Household Size |
| Married-Couple | 1,940 (53.6%) | 3.30 |
| Single Male/Father | 414 (11.5%) | 4.09 |
| Single Female/Mother | 234 (6.5%) | 3.44 |
| Non-family | 1,028 (28.4%) | 1.54 |
| Total Households | 3,616 (100.0%) | 2.90 |
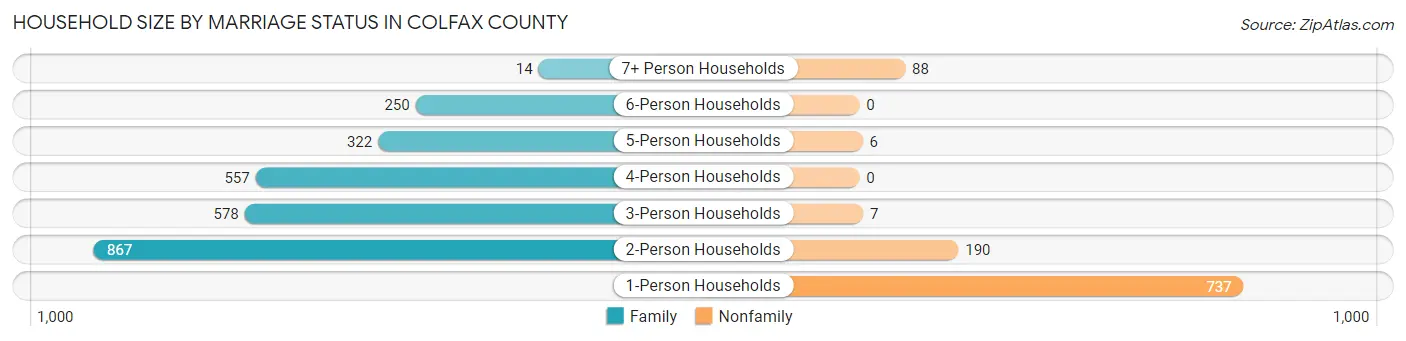
Household Size by Marriage Status in Colfax County
Out of a total of 3,616 households in Colfax County, 2,588 (71.6%) are family households, while 1,028 (28.4%) are nonfamily households. The most numerous type of family households are 2-person households, comprising 867, and the most common type of nonfamily households are 1-person households, comprising 737.
| Household Size | Family Households | Nonfamily Households |
| 1-Person Households | - | 737 (20.4%) |
| 2-Person Households | 867 (24.0%) | 190 (5.2%) |
| 3-Person Households | 578 (16.0%) | 7 (0.2%) |
| 4-Person Households | 557 (15.4%) | 0 (0.0%) |
| 5-Person Households | 322 (8.9%) | 6 (0.2%) |
| 6-Person Households | 250 (6.9%) | 0 (0.0%) |
| 7+ Person Households | 14 (0.4%) | 88 (2.4%) |
| Total | 2,588 (71.6%) | 1,028 (28.4%) |
Female Fertility in Colfax County
Fertility by Age in Colfax County
Average fertility rate in Colfax County is 122.0 births per 1,000 women. Women in the age bracket of 20 to 34 years have the highest fertility rate with 228.0 births per 1,000 women. Women in the age bracket of 20 to 34 years acount for 72.9% of all women with births.
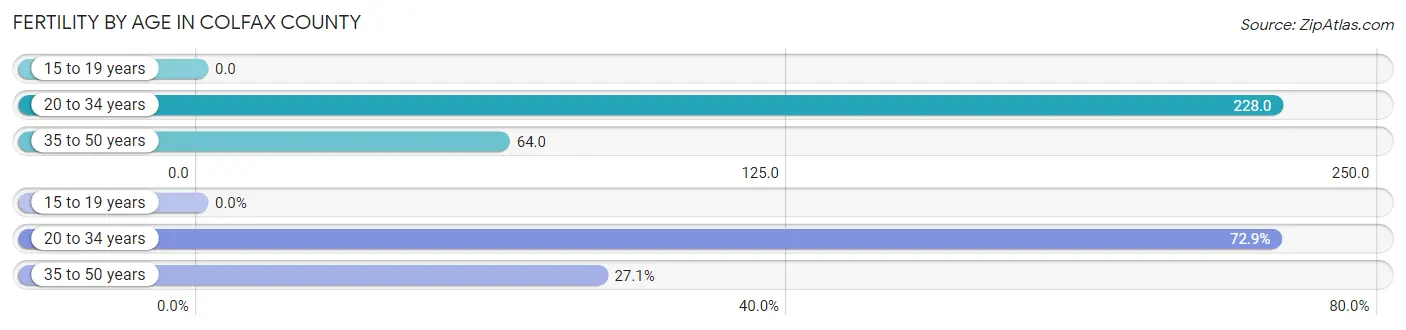
| Age Bracket | Women with Births | Births / 1,000 Women |
| 15 to 19 years | 0 (0.0%) | 0.0 |
| 20 to 34 years | 164 (72.9%) | 228.0 |
| 35 to 50 years | 61 (27.1%) | 64.0 |
| Total | 225 (100.0%) | 122.0 |
Fertility by Age by Marriage Status in Colfax County
61.3% of women with births (225) in Colfax County are married. The highest percentage of unmarried women with births falls into 20 to 34 years age bracket with 53.0% of them unmarried at the time of birth, while the lowest percentage of unmarried women with births belong to 35 to 50 years age bracket with 0.0% of them unmarried.
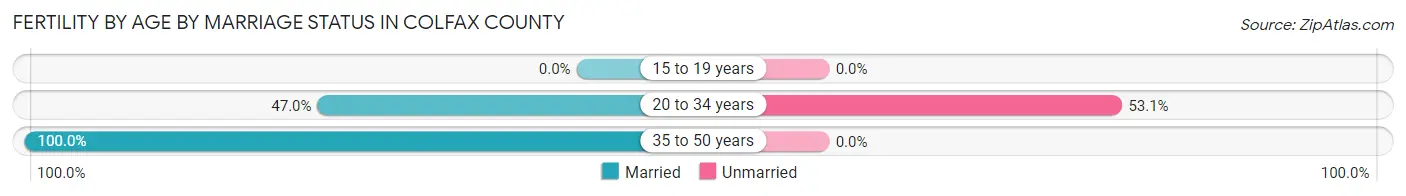
| Age Bracket | Married | Unmarried |
| 15 to 19 years | 0 (0.0%) | 0 (0.0%) |
| 20 to 34 years | 77 (46.9%) | 87 (53.0%) |
| 35 to 50 years | 61 (100.0%) | 0 (0.0%) |
| Total | 138 (61.3%) | 87 (38.7%) |
Fertility by Education in Colfax County
Average fertility rate in Colfax County is 122.0 births per 1,000 women. Women with the education attainment of less than high school have the highest fertility rate of 216.0 births per 1,000 women, while women with the education attainment of college or associate's degree have the lowest fertility at 19.0 births per 1,000 women. Women with the education attainment of less than high school represent 64.4% of all women with births.
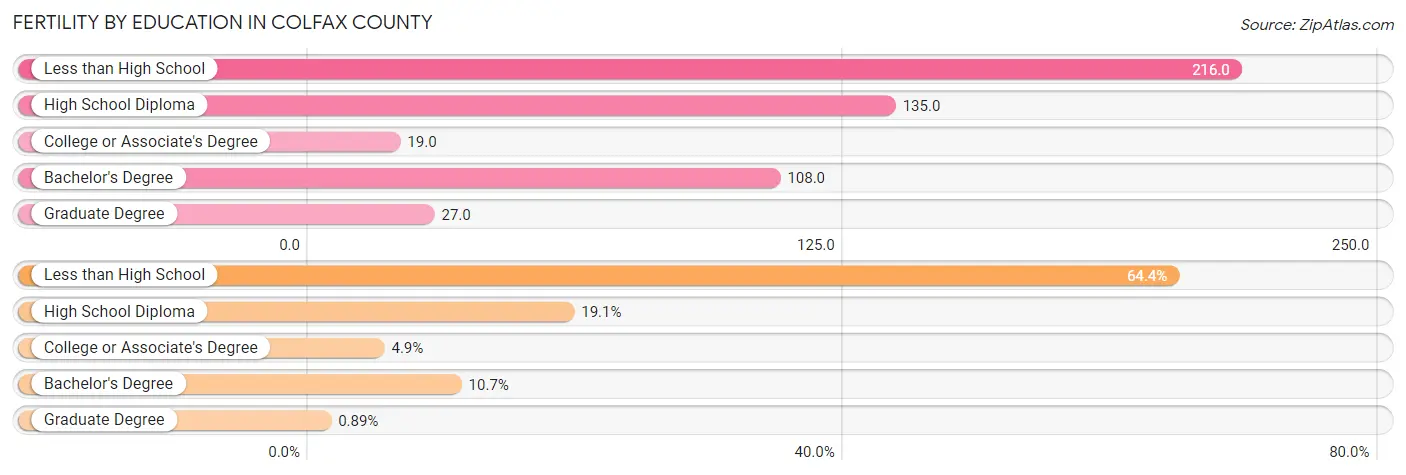
| Educational Attainment | Women with Births | Births / 1,000 Women |
| Less than High School | 145 (64.4%) | 216.0 |
| High School Diploma | 43 (19.1%) | 135.0 |
| College or Associate's Degree | 11 (4.9%) | 19.0 |
| Bachelor's Degree | 24 (10.7%) | 108.0 |
| Graduate Degree | 2 (0.9%) | 27.0 |
| Total | 225 (100.0%) | 122.0 |
Fertility by Education by Marriage Status in Colfax County
38.7% of women with births in Colfax County are unmarried. Women with the educational attainment of college or associate's degree are most likely to be married with 100.0% of them married at childbirth, while women with the educational attainment of less than high school are least likely to be married with 58.6% of them unmarried at childbirth.
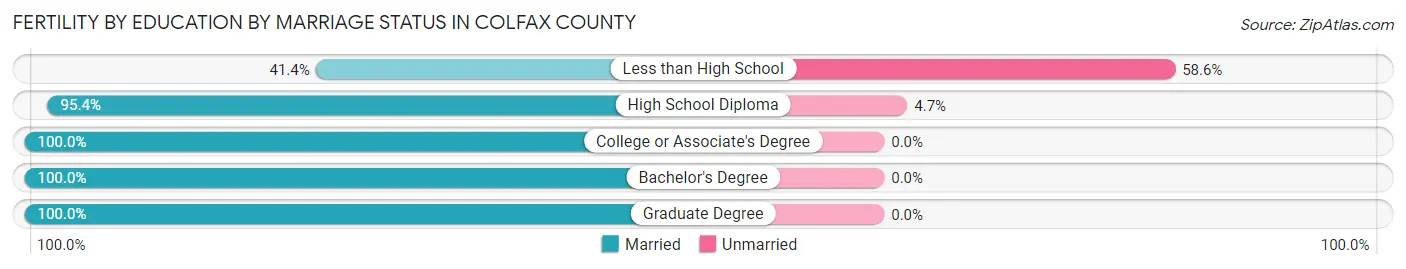
| Educational Attainment | Married | Unmarried |
| Less than High School | 60 (41.4%) | 85 (58.6%) |
| High School Diploma | 41 (95.4%) | 2 (4.6%) |
| College or Associate's Degree | 11 (100.0%) | 0 (0.0%) |
| Bachelor's Degree | 24 (100.0%) | 0 (0.0%) |
| Graduate Degree | 2 (100.0%) | 0 (0.0%) |
| Total | 138 (61.3%) | 87 (38.7%) |
Income in Colfax County
Income Overview in Colfax County
Per Capita Income in Colfax County is $29,436, while median incomes of families and households are $75,430 and $71,205 respectively.
| Characteristic | Number | Measure |
| Per Capita Income | 10,563 | $29,436 |
| Median Family Income | 2,588 | $75,430 |
| Mean Family Income | 2,588 | $89,764 |
| Median Household Income | 3,616 | $71,205 |
| Mean Household Income | 3,616 | $84,258 |
| Income Deficit | 2,588 | $8,715 |
| Wage / Income Gap (%) | 10,563 | 21.92% |
| Wage / Income Gap ($) | 10,563 | 78.08¢ per $1 |
| Gini / Inequality Index | 10,563 | 0.39 |
Earnings by Sex in Colfax County
Average Earnings in Colfax County are $39,385, $45,093 for men and $35,210 for women, a difference of 21.9%.
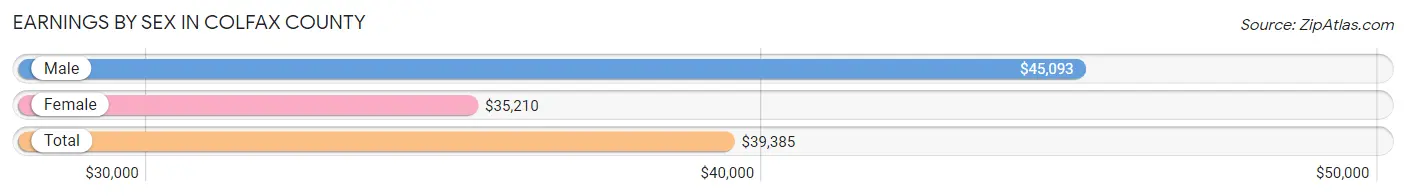
| Sex | Number | Average Earnings |
| Male | 3,530 (61.1%) | $45,093 |
| Female | 2,251 (38.9%) | $35,210 |
| Total | 5,781 (100.0%) | $39,385 |
Earnings by Sex by Income Bracket in Colfax County
The most common earnings brackets in Colfax County are $65,000 to $74,999 for men (606 | 17.2%) and $35,000 to $39,999 for women (239 | 10.6%).
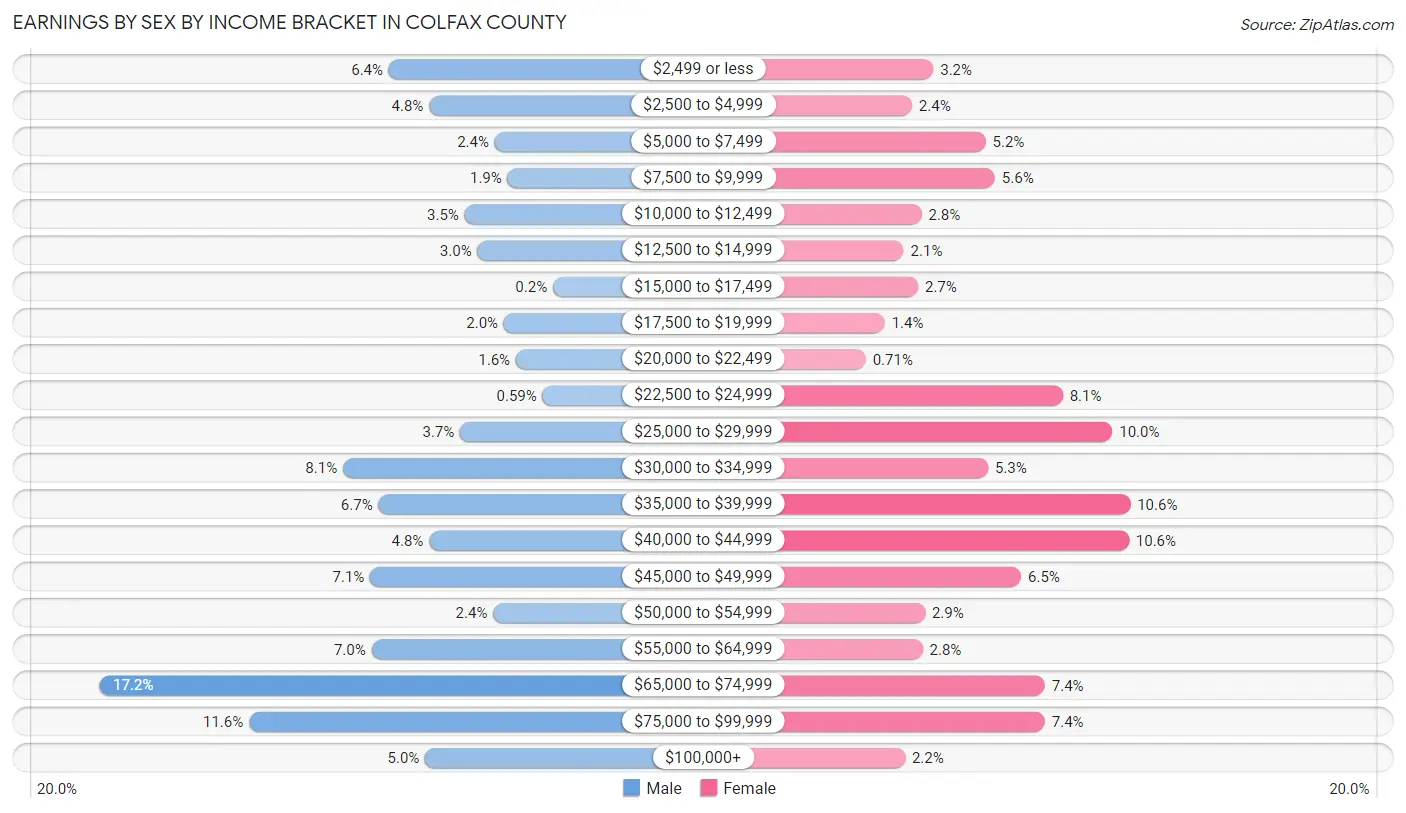
| Income | Male | Female |
| $2,499 or less | 224 (6.4%) | 73 (3.2%) |
| $2,500 to $4,999 | 171 (4.8%) | 55 (2.4%) |
| $5,000 to $7,499 | 84 (2.4%) | 117 (5.2%) |
| $7,500 to $9,999 | 67 (1.9%) | 125 (5.6%) |
| $10,000 to $12,499 | 124 (3.5%) | 63 (2.8%) |
| $12,500 to $14,999 | 107 (3.0%) | 48 (2.1%) |
| $15,000 to $17,499 | 7 (0.2%) | 60 (2.7%) |
| $17,500 to $19,999 | 72 (2.0%) | 32 (1.4%) |
| $20,000 to $22,499 | 56 (1.6%) | 16 (0.7%) |
| $22,500 to $24,999 | 21 (0.6%) | 182 (8.1%) |
| $25,000 to $29,999 | 130 (3.7%) | 224 (10.0%) |
| $30,000 to $34,999 | 285 (8.1%) | 119 (5.3%) |
| $35,000 to $39,999 | 238 (6.7%) | 239 (10.6%) |
| $40,000 to $44,999 | 171 (4.8%) | 238 (10.6%) |
| $45,000 to $49,999 | 249 (7.0%) | 147 (6.5%) |
| $50,000 to $54,999 | 86 (2.4%) | 66 (2.9%) |
| $55,000 to $64,999 | 247 (7.0%) | 64 (2.8%) |
| $65,000 to $74,999 | 606 (17.2%) | 167 (7.4%) |
| $75,000 to $99,999 | 409 (11.6%) | 167 (7.4%) |
| $100,000+ | 176 (5.0%) | 49 (2.2%) |
| Total | 3,530 (100.0%) | 2,251 (100.0%) |
Earnings by Sex by Educational Attainment in Colfax County
Average earnings in Colfax County are $55,408 for men and $37,561 for women, a difference of 32.2%. Men with an educational attainment of graduate degree enjoy the highest average annual earnings of $87,961, while those with less than high school education earn the least with $45,233. Women with an educational attainment of graduate degree earn the most with the average annual earnings of $63,125, while those with bachelor's degree education have the smallest earnings of $33,235.
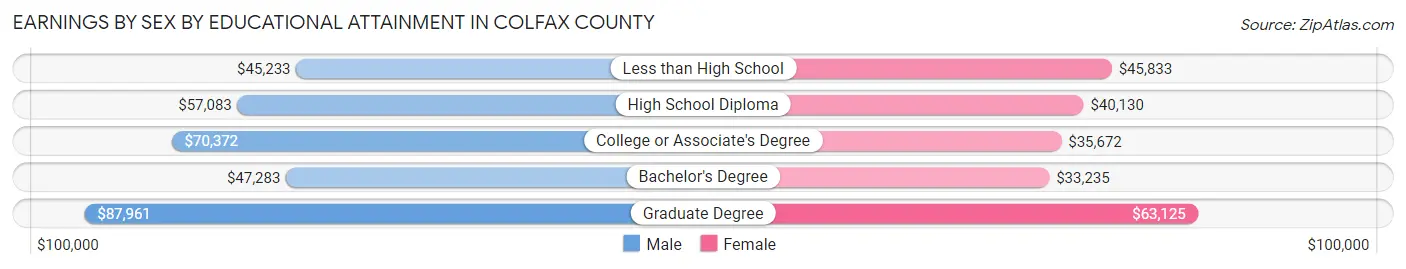
| Educational Attainment | Male Income | Female Income |
| Less than High School | $45,233 | $45,833 |
| High School Diploma | $57,083 | $40,130 |
| College or Associate's Degree | $70,372 | $35,672 |
| Bachelor's Degree | $47,283 | $33,235 |
| Graduate Degree | $87,961 | $63,125 |
| Total | $55,408 | $37,561 |
Family Income in Colfax County
Family Income Brackets in Colfax County
According to the Colfax County family income data, there are 688 families falling into the $50,000 to $74,999 income range, which is the most common income bracket and makes up 26.6% of all families. Conversely, the less than $10,000 income bracket is the least frequent group with only 13 families (0.5%) belonging to this category.
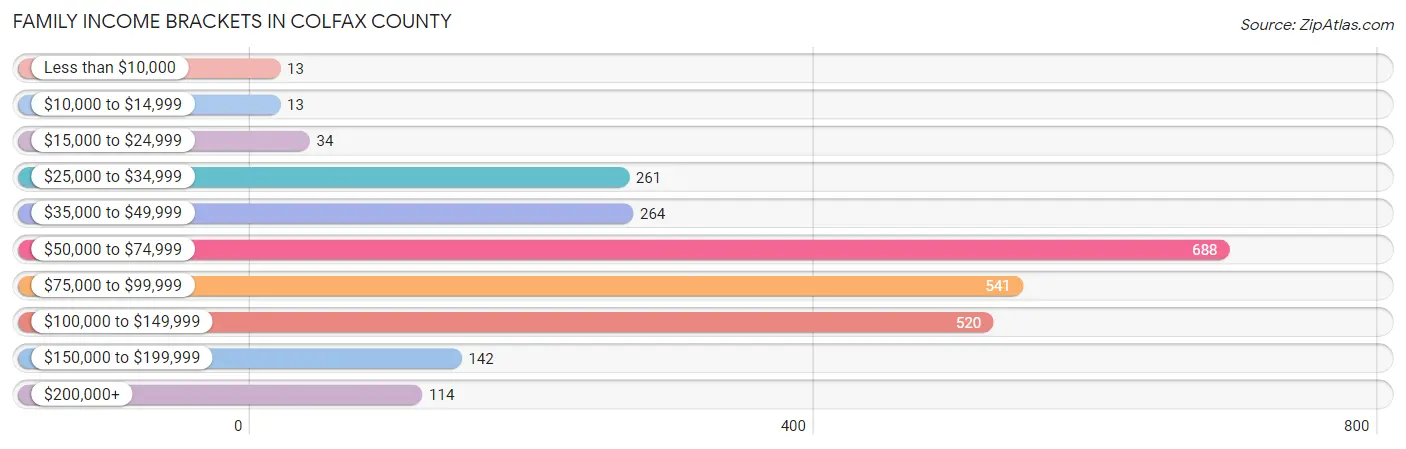
| Income Bracket | # Families | % Families |
| Less than $10,000 | 13 | 0.5% |
| $10,000 to $14,999 | 13 | 0.5% |
| $15,000 to $24,999 | 34 | 1.3% |
| $25,000 to $34,999 | 261 | 10.1% |
| $35,000 to $49,999 | 264 | 10.2% |
| $50,000 to $74,999 | 688 | 26.6% |
| $75,000 to $99,999 | 541 | 20.9% |
| $100,000 to $149,999 | 520 | 20.1% |
| $150,000 to $199,999 | 142 | 5.5% |
| $200,000+ | 114 | 4.4% |
Family Income by Famaliy Size in Colfax County
7+ person families (14 | 0.5%) account for the highest median family income in Colfax County with $221,389 per family, while 2-person families (871 | 33.7%) have the highest median income of $34,317 per family member.
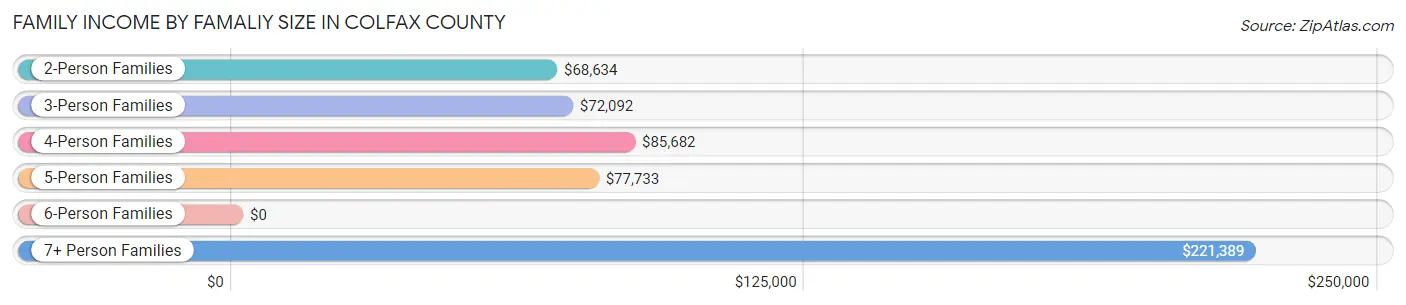
| Income Bracket | # Families | Median Income |
| 2-Person Families | 871 (33.7%) | $68,634 |
| 3-Person Families | 815 (31.5%) | $72,092 |
| 4-Person Families | 386 (14.9%) | $85,682 |
| 5-Person Families | 261 (10.1%) | $77,733 |
| 6-Person Families | 241 (9.3%) | $0 |
| 7+ Person Families | 14 (0.5%) | $221,389 |
| Total | 2,588 (100.0%) | $75,430 |
Family Income by Number of Earners in Colfax County
The median family income in Colfax County is $75,430, with families comprising 3+ earners (336) having the highest median family income of $132,667, while families with no earners (105) have the lowest median family income of $34,250, accounting for 13.0% and 4.1% of families, respectively.
| Number of Earners | # Families | Median Income |
| No Earners | 105 (4.1%) | $34,250 |
| 1 Earner | 777 (30.0%) | $70,331 |
| 2 Earners | 1,370 (52.9%) | $79,029 |
| 3+ Earners | 336 (13.0%) | $132,667 |
| Total | 2,588 (100.0%) | $75,430 |
Household Income in Colfax County
Household Income Brackets in Colfax County
With 799 households falling in the category, the $50,000 to $74,999 income range is the most frequent in Colfax County, accounting for 22.1% of all households. In contrast, only 25 households (0.7%) fall into the $10,000 to $14,999 income bracket, making it the least populous group.
| Income Bracket | # Households | % Households |
| Less than $10,000 | 148 | 4.1% |
| $10,000 to $14,999 | 25 | 0.7% |
| $15,000 to $24,999 | 268 | 7.4% |
| $25,000 to $34,999 | 304 | 8.4% |
| $35,000 to $49,999 | 419 | 11.6% |
| $50,000 to $74,999 | 799 | 22.1% |
| $75,000 to $99,999 | 607 | 16.8% |
| $100,000 to $149,999 | 644 | 17.8% |
| $150,000 to $199,999 | 202 | 5.6% |
| $200,000+ | 202 | 5.6% |
Household Income by Householder Age in Colfax County
The median household income in Colfax County is $71,205, with the highest median household income of $88,611 found in the 25 to 44 years age bracket for the primary householder. A total of 814 households (22.5%) fall into this category. Meanwhile, the 15 to 24 years age bracket for the primary householder has the lowest median household income of $41,000, with 182 households (5.0%) in this group.
| Income Bracket | # Households | Median Income |
| 15 to 24 Years | 182 (5.0%) | $41,000 |
| 25 to 44 Years | 814 (22.5%) | $88,611 |
| 45 to 64 Years | 1,826 (50.5%) | $76,071 |
| 65+ Years | 794 (22.0%) | $53,182 |
| Total | 3,616 (100.0%) | $71,205 |
Poverty in Colfax County
Income Below Poverty by Sex and Age in Colfax County
With 11.5% poverty level for males and 8.7% for females among the residents of Colfax County, 6 to 11 year old males and 75 year old and over females are the most vulnerable to poverty, with 148 males (35.5%) and 77 females (24.4%) in their respective age groups living below the poverty level.
| Age Bracket | Male | Female |
| Under 5 Years | 4 (1.3%) | 9 (2.0%) |
| 5 Years | 0 (0.0%) | 0 (0.0%) |
| 6 to 11 Years | 148 (35.5%) | 4 (0.6%) |
| 12 to 14 Years | 64 (21.1%) | 0 (0.0%) |
| 15 Years | 6 (6.2%) | 0 (0.0%) |
| 16 and 17 Years | 4 (1.4%) | 7 (8.2%) |
| 18 to 24 Years | 117 (22.3%) | 45 (17.2%) |
| 25 to 34 Years | 47 (7.7%) | 8 (1.5%) |
| 35 to 44 Years | 59 (12.7%) | 111 (20.1%) |
| 45 to 54 Years | 159 (14.7%) | 119 (20.2%) |
| 55 to 64 Years | 8 (1.1%) | 24 (3.9%) |
| 65 to 74 Years | 14 (3.3%) | 13 (3.4%) |
| 75 Years and over | 10 (4.3%) | 77 (24.4%) |
| Total | 640 (11.5%) | 417 (8.7%) |
Income Above Poverty by Sex and Age in Colfax County
According to the poverty statistics in Colfax County, males aged 5 years and females aged 5 years are the age groups that are most secure financially, with 100.0% of males and 100.0% of females in these age groups living above the poverty line.
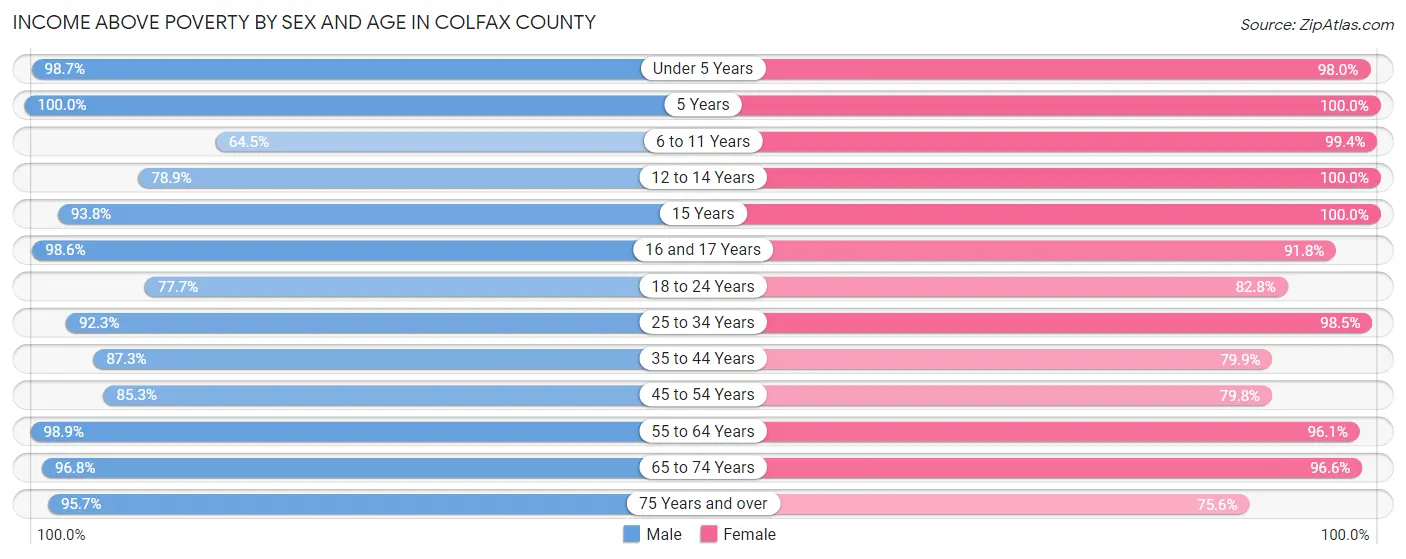
| Age Bracket | Male | Female |
| Under 5 Years | 305 (98.7%) | 447 (98.0%) |
| 5 Years | 86 (100.0%) | 30 (100.0%) |
| 6 to 11 Years | 269 (64.5%) | 672 (99.4%) |
| 12 to 14 Years | 239 (78.9%) | 266 (100.0%) |
| 15 Years | 91 (93.8%) | 21 (100.0%) |
| 16 and 17 Years | 275 (98.6%) | 78 (91.8%) |
| 18 to 24 Years | 407 (77.7%) | 216 (82.8%) |
| 25 to 34 Years | 564 (92.3%) | 516 (98.5%) |
| 35 to 44 Years | 404 (87.3%) | 442 (79.9%) |
| 45 to 54 Years | 924 (85.3%) | 471 (79.8%) |
| 55 to 64 Years | 718 (98.9%) | 596 (96.1%) |
| 65 to 74 Years | 417 (96.8%) | 368 (96.6%) |
| 75 Years and over | 220 (95.7%) | 239 (75.6%) |
| Total | 4,919 (88.5%) | 4,362 (91.3%) |
Income Below Poverty Among Married-Couple Families in Colfax County
The poverty statistics for married-couple families in Colfax County show that 7.4% or 144 of the total 1,940 families live below the poverty line. Families with 3 or 4 children have the highest poverty rate of 29.9%, comprising of 127 families. On the other hand, families with 5 or more children have the lowest poverty rate of 0.0%, which includes 0 families.
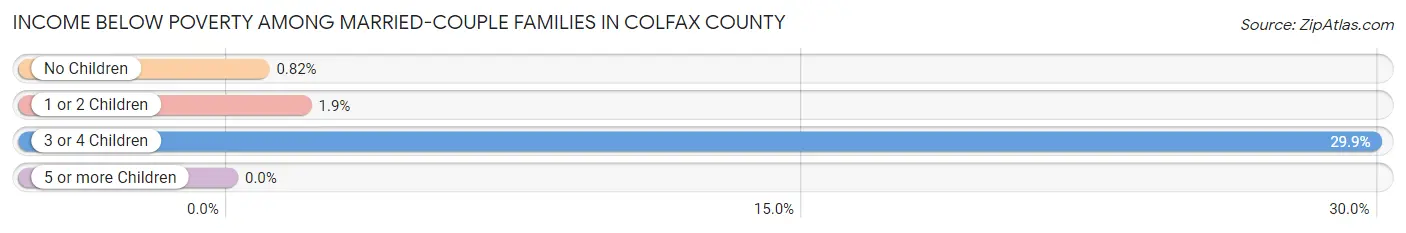
| Children | Above Poverty | Below Poverty |
| No Children | 1,087 (99.2%) | 9 (0.8%) |
| 1 or 2 Children | 408 (98.1%) | 8 (1.9%) |
| 3 or 4 Children | 298 (70.1%) | 127 (29.9%) |
| 5 or more Children | 3 (100.0%) | 0 (0.0%) |
| Total | 1,796 (92.6%) | 144 (7.4%) |
Income Below Poverty Among Single-Parent Households in Colfax County
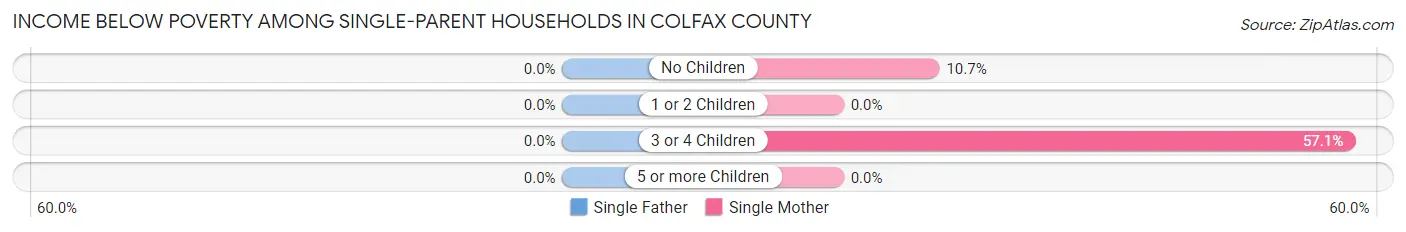
| Children | Single Father | Single Mother |
| No Children | 0 (0.0%) | 9 (10.7%) |
| 1 or 2 Children | 0 (0.0%) | 0 (0.0%) |
| 3 or 4 Children | 0 (0.0%) | 8 (57.1%) |
| 5 or more Children | 0 (0.0%) | 0 (0.0%) |
| Total | 0 (0.0%) | 17 (7.3%) |
Income Below Poverty Among Married-Couple vs Single-Parent Households in Colfax County
The poverty data for Colfax County shows that 144 of the married-couple family households (7.4%) and 17 of the single-parent households (2.6%) are living below the poverty level. Within the married-couple family households, those with 3 or 4 children have the highest poverty rate, with 127 households (29.9%) falling below the poverty line. Among the single-parent households, those with 3 or 4 children have the highest poverty rate, with 8 household (34.8%) living below poverty.
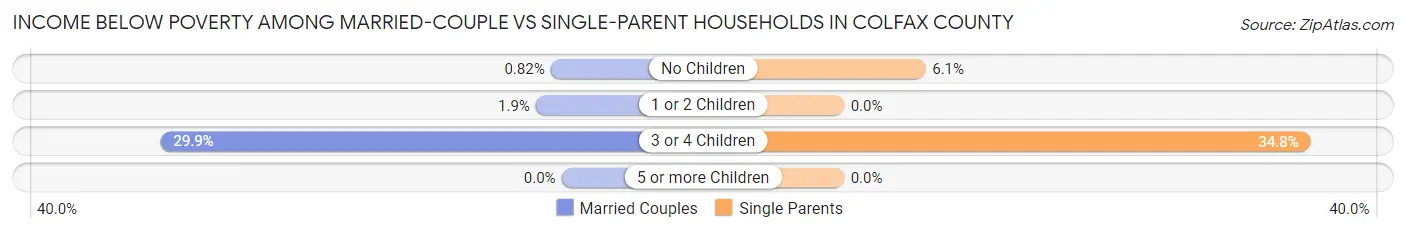
| Children | Married-Couple Families | Single-Parent Households |
| No Children | 9 (0.8%) | 9 (6.1%) |
| 1 or 2 Children | 8 (1.9%) | 0 (0.0%) |
| 3 or 4 Children | 127 (29.9%) | 8 (34.8%) |
| 5 or more Children | 0 (0.0%) | 0 (0.0%) |
| Total | 144 (7.4%) | 17 (2.6%) |
Employment Characteristics in Colfax County
Employment by Class of Employer in Colfax County
Among the 5,301 employed individuals in Colfax County, private company employees (3,844 | 72.5%), local government employees (394 | 7.4%), and self-employed (not incorporated) (349 | 6.6%) make up the most common classes of employment.
| Employer Class | # Employees | % Employees |
| Private Company Employees | 3,844 | 72.5% |
| Self-Employed (Incorporated) | 233 | 4.4% |
| Self-Employed (Not Incorporated) | 349 | 6.6% |
| Not-for-profit Organizations | 168 | 3.2% |
| Local Government Employees | 394 | 7.4% |
| State Government Employees | 31 | 0.6% |
| Federal Government Employees | 271 | 5.1% |
| Unpaid Family Workers | 11 | 0.2% |
| Total | 5,301 | 100.0% |
Employment Status by Age in Colfax County
According to the labor force statistics for Colfax County, out of the total population over 16 years of age (7,745), 70.4% or 5,452 individuals are in the labor force, with 1.7% or 93 of them unemployed. The age group with the highest labor force participation rate is 20 to 24 years, with 98.1% or 527 individuals in the labor force. Within the labor force, the 55 to 59 years age range has the highest percentage of unemployed individuals, with 8.0% or 47 of them being unemployed.
| Age Bracket | In Labor Force | Unemployed |
| 16 to 19 Years | 440 (71.9%) | 9 (2.0%) |
| 20 to 24 Years | 527 (98.1%) | 12 (2.3%) |
| 25 to 29 Years | 500 (84.2%) | 4 (0.8%) |
| 30 to 34 Years | 519 (95.9%) | 0 (0.0%) |
| 35 to 44 Years | 847 (83.4%) | 20 (2.4%) |
| 45 to 54 Years | 1,265 (75.6%) | 0 (0.0%) |
| 55 to 59 Years | 584 (74.9%) | 47 (8.0%) |
| 60 to 64 Years | 436 (74.9%) | 0 (0.0%) |
| 65 to 74 Years | 280 (34.1%) | 0 (0.0%) |
| 75 Years and over | 57 (9.7%) | 0 (0.0%) |
| Total | 5,452 (70.4%) | 93 (1.7%) |
Employment Status by Educational Attainment in Colfax County
According to labor force statistics for Colfax County, 80.0% of individuals (4,149) out of the total population between 25 and 64 years of age (5,186) are in the labor force, with 1.7% or 71 of them being unemployed. The group with the highest labor force participation rate are those with the educational attainment of college / associate degree, with 95.1% or 1,537 individuals in the labor force. Within the labor force, individuals with less than high school education have the highest percentage of unemployment, with 5.7% or 65 of them being unemployed.
| Educational Attainment | In Labor Force | Unemployed |
| Less than High School | 1,145 (71.1%) | 92 (5.7%) |
| High School Diploma | 892 (67.8%) | 5 (0.4%) |
| College / Associate Degree | 1,537 (95.1%) | 2 (0.1%) |
| Bachelor's Degree or higher | 575 (89.4%) | 0 (0.0%) |
| Total | 4,149 (80.0%) | 88 (1.7%) |
Employment Occupations by Sex in Colfax County
Management, Business, Science and Arts Occupations
The most common Management, Business, Science and Arts occupations in Colfax County are Management (421 | 8.0%), Community & Social Service (300 | 5.7%), Education Instruction & Library (278 | 5.3%), Health Diagnosing & Treating (166 | 3.2%), and Health Technologists (130 | 2.5%).
Management, Business, Science and Arts Occupations by Sex
Within the Management, Business, Science and Arts occupations in Colfax County, the most male-oriented occupations are Education, Arts & Media (81.2%), Life, Physical & Social Science (76.9%), and Computers & Mathematics (75.0%), while the most female-oriented occupations are Legal Services & Support (100.0%), Arts, Media & Entertainment (100.0%), and Health Technologists (96.2%).
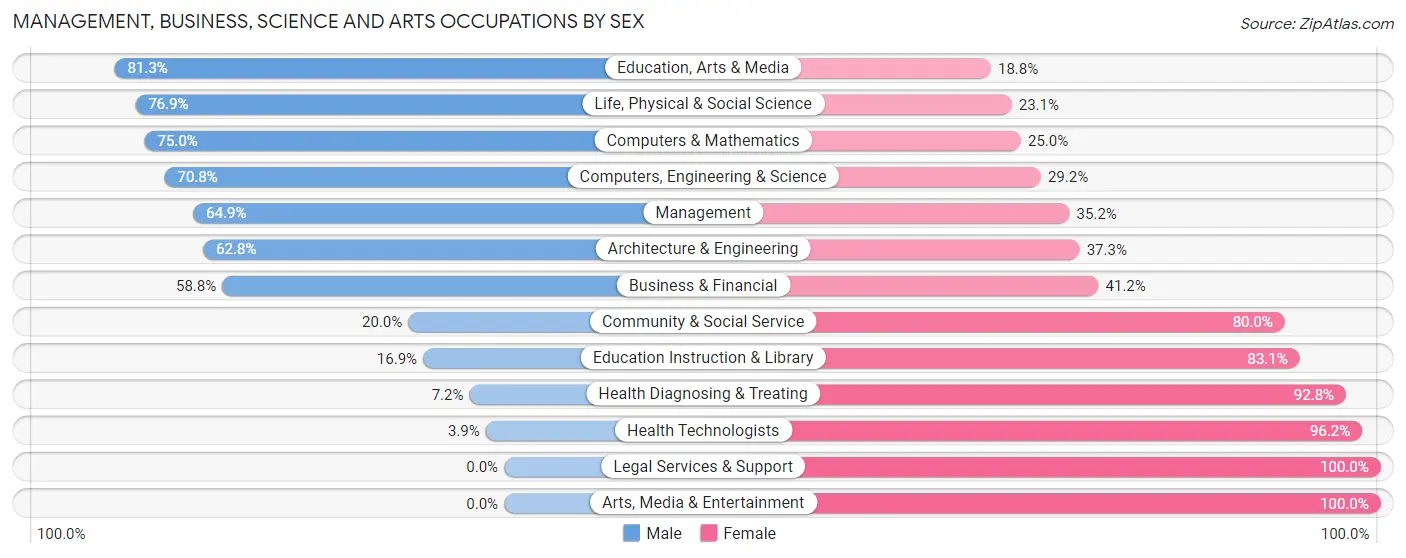
| Occupation | Male | Female |
| Management | 273 (64.8%) | 148 (35.1%) |
| Business & Financial | 40 (58.8%) | 28 (41.2%) |
| Computers, Engineering & Science | 85 (70.8%) | 35 (29.2%) |
| Computers & Mathematics | 3 (75.0%) | 1 (25.0%) |
| Architecture & Engineering | 32 (62.7%) | 19 (37.2%) |
| Life, Physical & Social Science | 50 (76.9%) | 15 (23.1%) |
| Community & Social Service | 60 (20.0%) | 240 (80.0%) |
| Education, Arts & Media | 13 (81.2%) | 3 (18.8%) |
| Legal Services & Support | 0 (0.0%) | 3 (100.0%) |
| Education Instruction & Library | 47 (16.9%) | 231 (83.1%) |
| Arts, Media & Entertainment | 0 (0.0%) | 3 (100.0%) |
| Health Diagnosing & Treating | 12 (7.2%) | 154 (92.8%) |
| Health Technologists | 5 (3.8%) | 125 (96.2%) |
| Total (Category) | 470 (43.7%) | 605 (56.3%) |
| Total (Overall) | 3,182 (60.3%) | 2,093 (39.7%) |
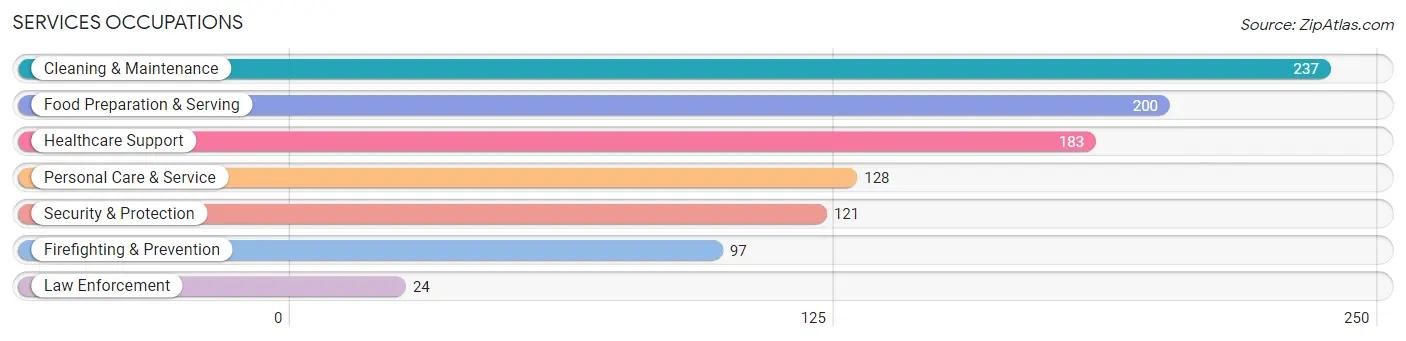
Services Occupations
The most common Services occupations in Colfax County are Cleaning & Maintenance (237 | 4.5%), Food Preparation & Serving (200 | 3.8%), Healthcare Support (183 | 3.5%), Personal Care & Service (128 | 2.4%), and Security & Protection (121 | 2.3%).
Services Occupations by Sex
Within the Services occupations in Colfax County, the most male-oriented occupations are Law Enforcement (100.0%), Cleaning & Maintenance (86.9%), and Security & Protection (74.4%), while the most female-oriented occupations are Healthcare Support (98.4%), Personal Care & Service (66.4%), and Food Preparation & Serving (64.0%).
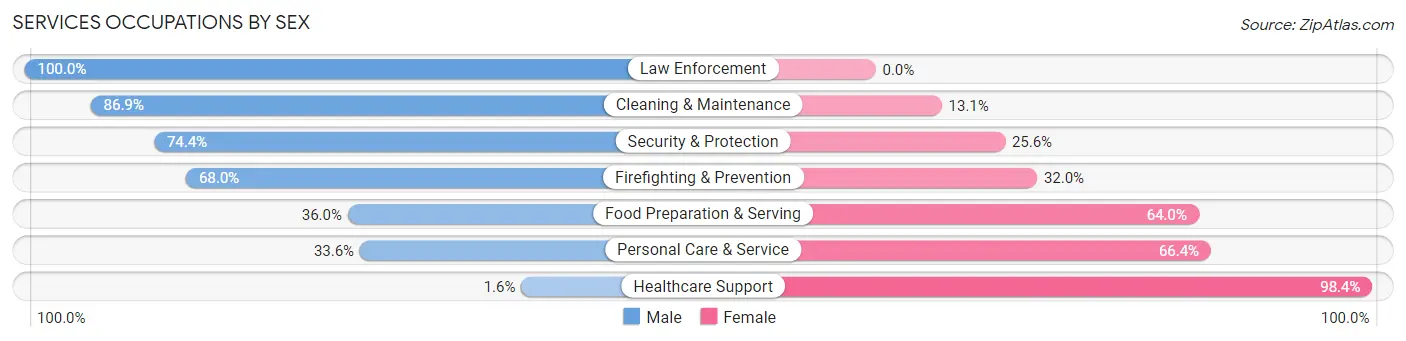
| Occupation | Male | Female |
| Healthcare Support | 3 (1.6%) | 180 (98.4%) |
| Security & Protection | 90 (74.4%) | 31 (25.6%) |
| Firefighting & Prevention | 66 (68.0%) | 31 (32.0%) |
| Law Enforcement | 24 (100.0%) | 0 (0.0%) |
| Food Preparation & Serving | 72 (36.0%) | 128 (64.0%) |
| Cleaning & Maintenance | 206 (86.9%) | 31 (13.1%) |
| Personal Care & Service | 43 (33.6%) | 85 (66.4%) |
| Total (Category) | 414 (47.6%) | 455 (52.4%) |
| Total (Overall) | 3,182 (60.3%) | 2,093 (39.7%) |
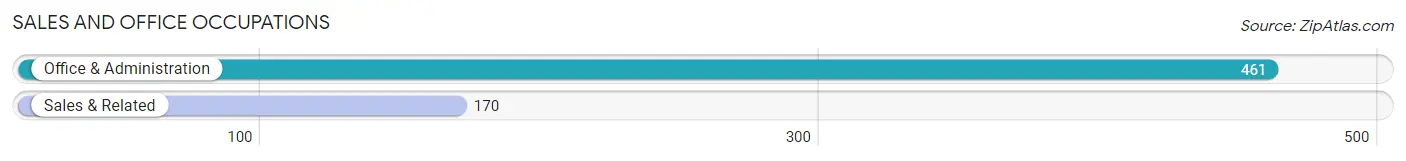
Sales and Office Occupations
The most common Sales and Office occupations in Colfax County are Office & Administration (461 | 8.7%), and Sales & Related (170 | 3.2%).
Sales and Office Occupations by Sex
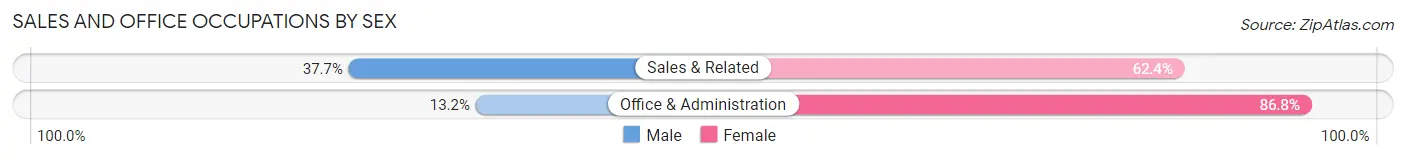
| Occupation | Male | Female |
| Sales & Related | 64 (37.7%) | 106 (62.4%) |
| Office & Administration | 61 (13.2%) | 400 (86.8%) |
| Total (Category) | 125 (19.8%) | 506 (80.2%) |
| Total (Overall) | 3,182 (60.3%) | 2,093 (39.7%) |
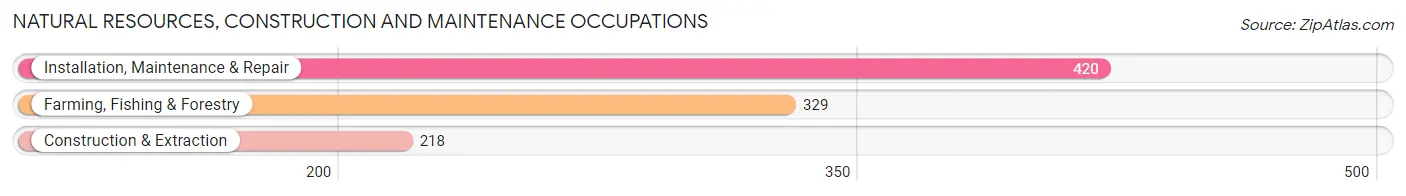
Natural Resources, Construction and Maintenance Occupations
The most common Natural Resources, Construction and Maintenance occupations in Colfax County are Installation, Maintenance & Repair (420 | 8.0%), Farming, Fishing & Forestry (329 | 6.2%), and Construction & Extraction (218 | 4.1%).
Natural Resources, Construction and Maintenance Occupations by Sex
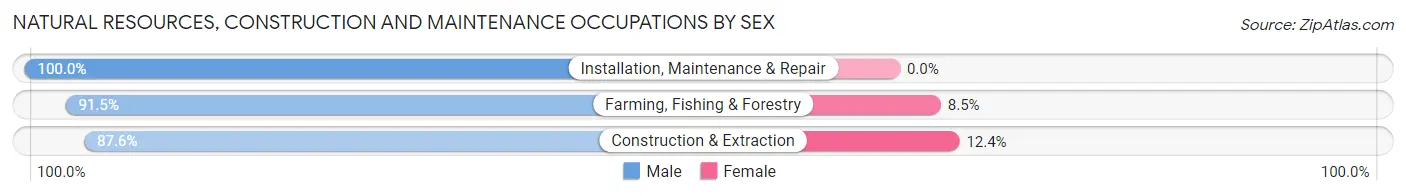
| Occupation | Male | Female |
| Farming, Fishing & Forestry | 301 (91.5%) | 28 (8.5%) |
| Construction & Extraction | 191 (87.6%) | 27 (12.4%) |
| Installation, Maintenance & Repair | 420 (100.0%) | 0 (0.0%) |
| Total (Category) | 912 (94.3%) | 55 (5.7%) |
| Total (Overall) | 3,182 (60.3%) | 2,093 (39.7%) |
Production, Transportation and Moving Occupations
The most common Production, Transportation and Moving occupations in Colfax County are Production (1,084 | 20.5%), Material Moving (352 | 6.7%), and Transportation (297 | 5.6%).
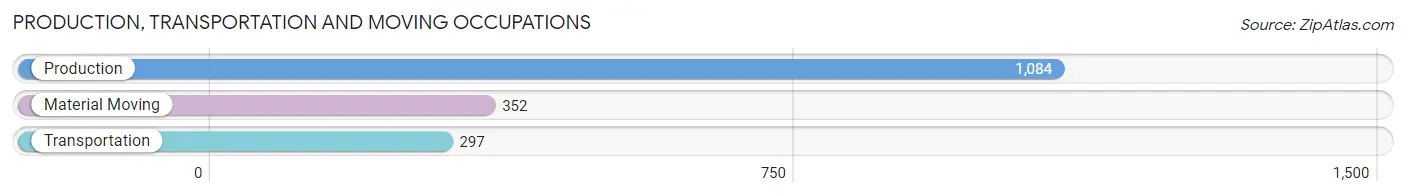
Production, Transportation and Moving Occupations by Sex
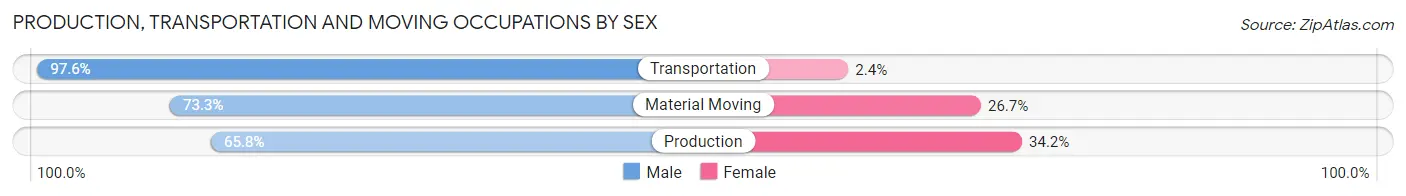
| Occupation | Male | Female |
| Production | 713 (65.8%) | 371 (34.2%) |
| Transportation | 290 (97.6%) | 7 (2.4%) |
| Material Moving | 258 (73.3%) | 94 (26.7%) |
| Total (Category) | 1,261 (72.8%) | 472 (27.2%) |
| Total (Overall) | 3,182 (60.3%) | 2,093 (39.7%) |
Employment Industries by Sex in Colfax County
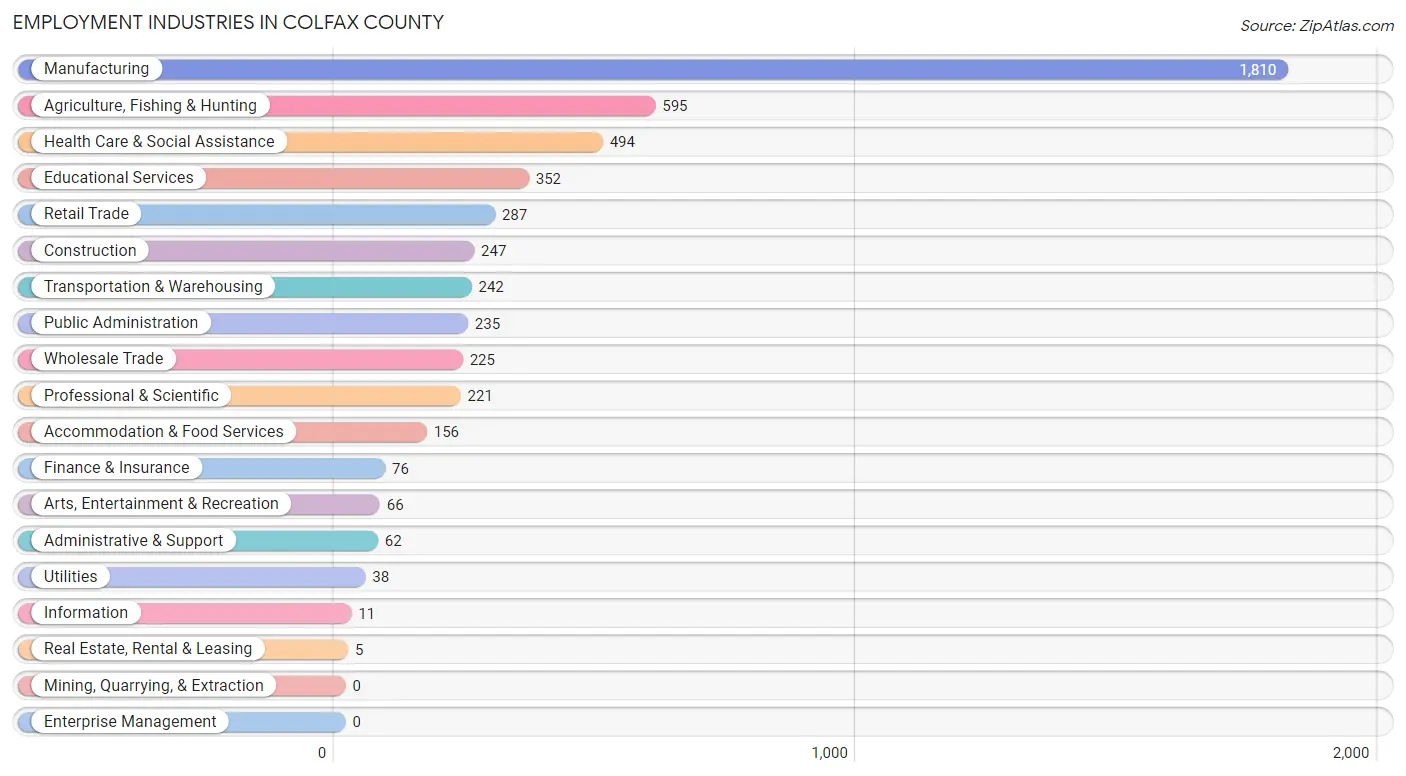
Employment Industries in Colfax County
The major employment industries in Colfax County include Manufacturing (1,810 | 34.3%), Agriculture, Fishing & Hunting (595 | 11.3%), Health Care & Social Assistance (494 | 9.4%), Educational Services (352 | 6.7%), and Retail Trade (287 | 5.4%).
Employment Industries by Sex in Colfax County
The Colfax County industries that see more men than women are Construction (97.2%), Utilities (94.7%), and Agriculture, Fishing & Hunting (88.4%), whereas the industries that tend to have a higher number of women are Health Care & Social Assistance (89.3%), Arts, Entertainment & Recreation (81.8%), and Finance & Insurance (81.6%).
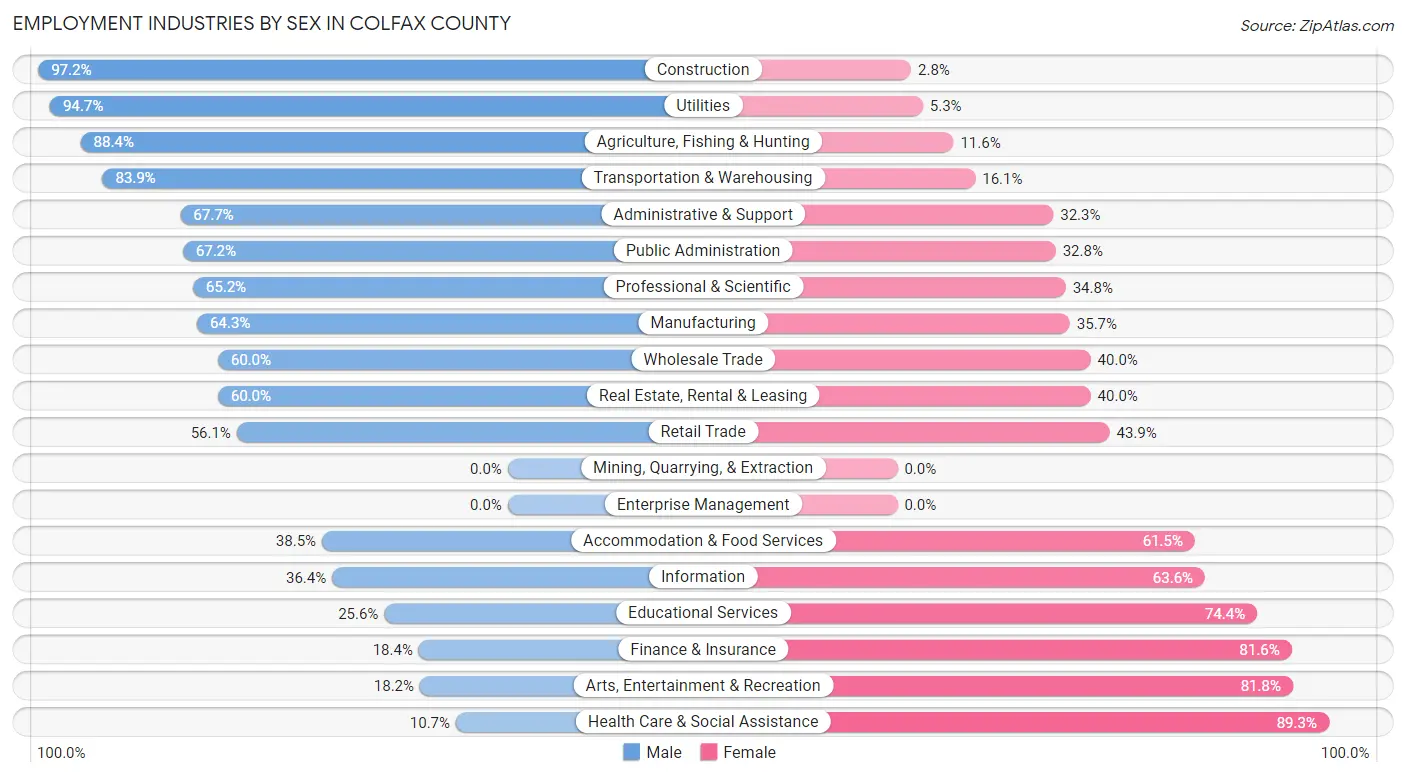
| Industry | Male | Female |
| Agriculture, Fishing & Hunting | 526 (88.4%) | 69 (11.6%) |
| Mining, Quarrying, & Extraction | 0 (0.0%) | 0 (0.0%) |
| Construction | 240 (97.2%) | 7 (2.8%) |
| Manufacturing | 1,164 (64.3%) | 646 (35.7%) |
| Wholesale Trade | 135 (60.0%) | 90 (40.0%) |
| Retail Trade | 161 (56.1%) | 126 (43.9%) |
| Transportation & Warehousing | 203 (83.9%) | 39 (16.1%) |
| Utilities | 36 (94.7%) | 2 (5.3%) |
| Information | 4 (36.4%) | 7 (63.6%) |
| Finance & Insurance | 14 (18.4%) | 62 (81.6%) |
| Real Estate, Rental & Leasing | 3 (60.0%) | 2 (40.0%) |
| Professional & Scientific | 144 (65.2%) | 77 (34.8%) |
| Enterprise Management | 0 (0.0%) | 0 (0.0%) |
| Administrative & Support | 42 (67.7%) | 20 (32.3%) |
| Educational Services | 90 (25.6%) | 262 (74.4%) |
| Health Care & Social Assistance | 53 (10.7%) | 441 (89.3%) |
| Arts, Entertainment & Recreation | 12 (18.2%) | 54 (81.8%) |
| Accommodation & Food Services | 60 (38.5%) | 96 (61.5%) |
| Public Administration | 158 (67.2%) | 77 (32.8%) |
| Total | 3,182 (60.3%) | 2,093 (39.7%) |
Education in Colfax County
School Enrollment in Colfax County
The most common levels of schooling among the 2,712 students in Colfax County are elementary school (920 | 33.9%), middle school (659 | 24.3%), and high school (646 | 23.8%).
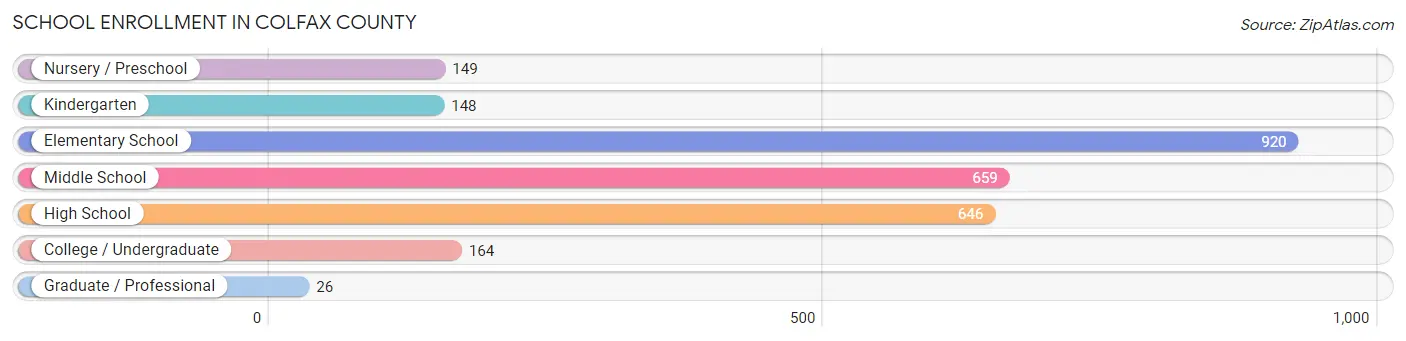
| School Level | # Students | % Students |
| Nursery / Preschool | 149 | 5.5% |
| Kindergarten | 148 | 5.5% |
| Elementary School | 920 | 33.9% |
| Middle School | 659 | 24.3% |
| High School | 646 | 23.8% |
| College / Undergraduate | 164 | 6.0% |
| Graduate / Professional | 26 | 1.0% |
| Total | 2,712 | 100.0% |
School Enrollment by Age by Funding Source in Colfax County
Out of a total of 2,712 students who are enrolled in schools in Colfax County, 141 (5.2%) attend a private institution, while the remaining 2,571 (94.8%) are enrolled in public schools. The age group of 25 to 34 year olds has the highest likelihood of being enrolled in private schools, with 11 (84.6% in the age bracket) enrolled. Conversely, the age group of 20 to 24 year olds has the lowest likelihood of being enrolled in a private school, with 113 (100.0% in the age bracket) attending a public institution.
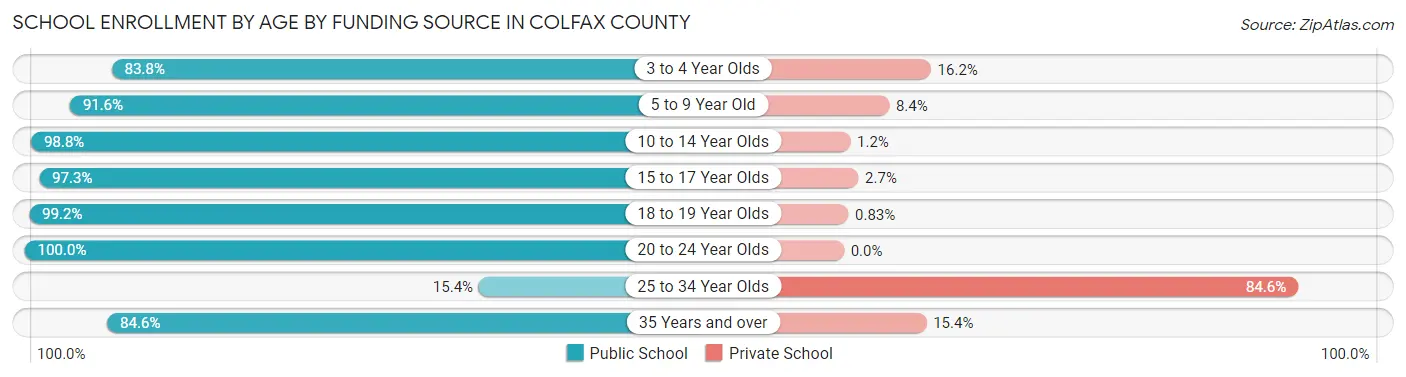
| Age Bracket | Public School | Private School |
| 3 to 4 Year Olds | 119 (83.8%) | 23 (16.2%) |
| 5 to 9 Year Old | 793 (91.6%) | 73 (8.4%) |
| 10 to 14 Year Olds | 912 (98.8%) | 11 (1.2%) |
| 15 to 17 Year Olds | 469 (97.3%) | 13 (2.7%) |
| 18 to 19 Year Olds | 120 (99.2%) | 1 (0.8%) |
| 20 to 24 Year Olds | 113 (100.0%) | 0 (0.0%) |
| 25 to 34 Year Olds | 2 (15.4%) | 11 (84.6%) |
| 35 Years and over | 44 (84.6%) | 8 (15.4%) |
| Total | 2,571 (94.8%) | 141 (5.2%) |
Educational Attainment by Field of Study in Colfax County
Education (255 | 29.0%), science & technology (148 | 16.8%), bio, nature & agricultural (134 | 15.2%), arts & humanities (100 | 11.4%), and business (82 | 9.3%) are the most common fields of study among 880 individuals in Colfax County who have obtained a bachelor's degree or higher.
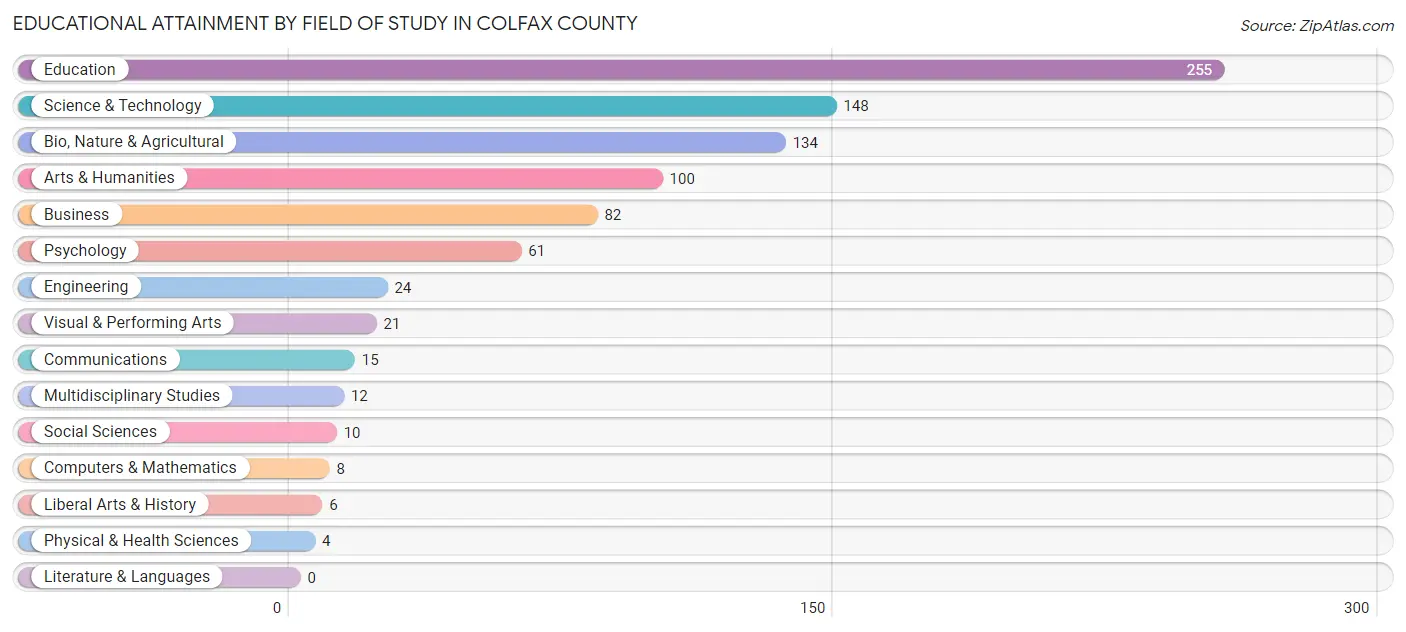
| Field of Study | # Graduates | % Graduates |
| Computers & Mathematics | 8 | 0.9% |
| Bio, Nature & Agricultural | 134 | 15.2% |
| Physical & Health Sciences | 4 | 0.4% |
| Psychology | 61 | 6.9% |
| Social Sciences | 10 | 1.1% |
| Engineering | 24 | 2.7% |
| Multidisciplinary Studies | 12 | 1.4% |
| Science & Technology | 148 | 16.8% |
| Business | 82 | 9.3% |
| Education | 255 | 29.0% |
| Literature & Languages | 0 | 0.0% |
| Liberal Arts & History | 6 | 0.7% |
| Visual & Performing Arts | 21 | 2.4% |
| Communications | 15 | 1.7% |
| Arts & Humanities | 100 | 11.4% |
| Total | 880 | 100.0% |
Transportation & Commute in Colfax County
Vehicle Availability by Sex in Colfax County
The most prevalent vehicle ownership categories in Colfax County are males with 2 vehicles (1,141, accounting for 35.3%) and females with 2 vehicles (774, making up 55.1%).
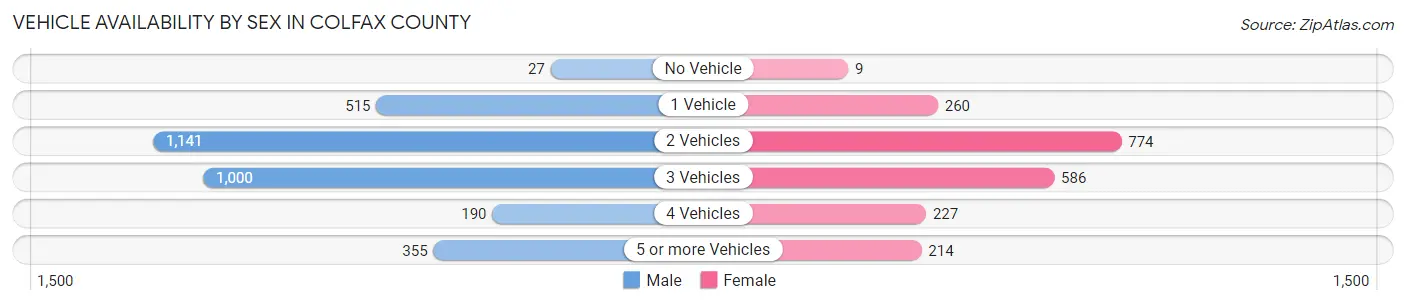
| Vehicles Available | Male | Female |
| No Vehicle | 27 (0.8%) | 9 (0.4%) |
| 1 Vehicle | 515 (16.0%) | 260 (12.6%) |
| 2 Vehicles | 1,141 (35.3%) | 774 (37.4%) |
| 3 Vehicles | 1,000 (31.0%) | 586 (28.3%) |
| 4 Vehicles | 190 (5.9%) | 227 (11.0%) |
| 5 or more Vehicles | 355 (11.0%) | 214 (10.3%) |
| Total | 3,228 (100.0%) | 2,070 (100.0%) |
Commute Time in Colfax County
The most frequently occuring commute durations in Colfax County are 5 to 9 minutes (1,060 commuters, 20.9%), 10 to 14 minutes (925 commuters, 18.2%), and 20 to 24 minutes (800 commuters, 15.7%).
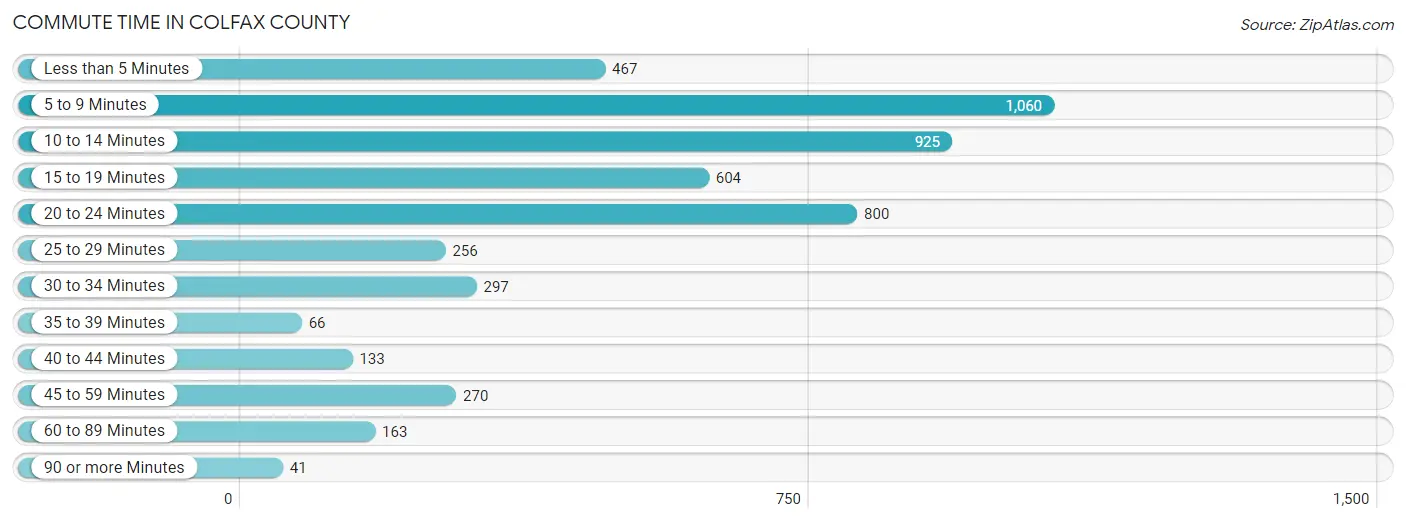
| Commute Time | # Commuters | % Commuters |
| Less than 5 Minutes | 467 | 9.2% |
| 5 to 9 Minutes | 1,060 | 20.9% |
| 10 to 14 Minutes | 925 | 18.2% |
| 15 to 19 Minutes | 604 | 11.9% |
| 20 to 24 Minutes | 800 | 15.7% |
| 25 to 29 Minutes | 256 | 5.0% |
| 30 to 34 Minutes | 297 | 5.8% |
| 35 to 39 Minutes | 66 | 1.3% |
| 40 to 44 Minutes | 133 | 2.6% |
| 45 to 59 Minutes | 270 | 5.3% |
| 60 to 89 Minutes | 163 | 3.2% |
| 90 or more Minutes | 41 | 0.8% |
Commute Time by Sex in Colfax County
The most common commute times in Colfax County are 5 to 9 minutes (671 commuters, 22.0%) for males and 20 to 24 minutes (430 commuters, 21.2%) for females.
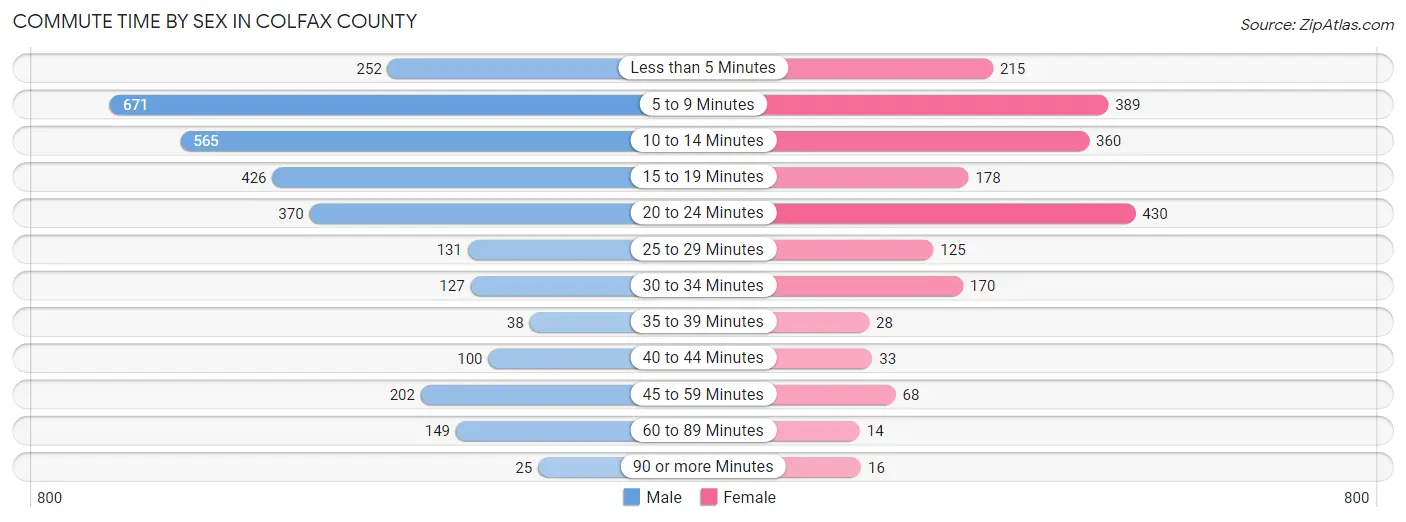
| Commute Time | Male | Female |
| Less than 5 Minutes | 252 (8.3%) | 215 (10.6%) |
| 5 to 9 Minutes | 671 (22.0%) | 389 (19.2%) |
| 10 to 14 Minutes | 565 (18.5%) | 360 (17.8%) |
| 15 to 19 Minutes | 426 (13.9%) | 178 (8.8%) |
| 20 to 24 Minutes | 370 (12.1%) | 430 (21.2%) |
| 25 to 29 Minutes | 131 (4.3%) | 125 (6.2%) |
| 30 to 34 Minutes | 127 (4.2%) | 170 (8.4%) |
| 35 to 39 Minutes | 38 (1.2%) | 28 (1.4%) |
| 40 to 44 Minutes | 100 (3.3%) | 33 (1.6%) |
| 45 to 59 Minutes | 202 (6.6%) | 68 (3.4%) |
| 60 to 89 Minutes | 149 (4.9%) | 14 (0.7%) |
| 90 or more Minutes | 25 (0.8%) | 16 (0.8%) |
Time of Departure to Work by Sex in Colfax County
The most frequent times of departure to work in Colfax County are 12:00 PM to 3:59 PM (580, 19.0%) for males and 7:30 AM to 7:59 AM (449, 22.2%) for females.
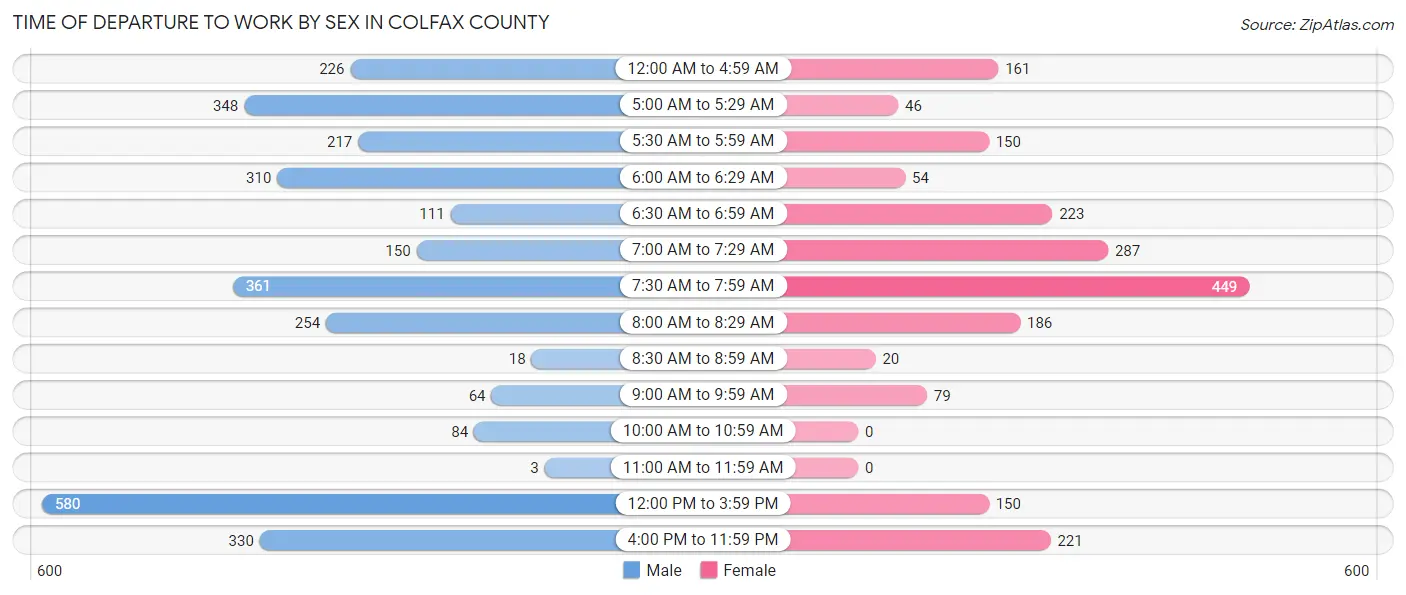
| Time of Departure | Male | Female |
| 12:00 AM to 4:59 AM | 226 (7.4%) | 161 (8.0%) |
| 5:00 AM to 5:29 AM | 348 (11.4%) | 46 (2.3%) |
| 5:30 AM to 5:59 AM | 217 (7.1%) | 150 (7.4%) |
| 6:00 AM to 6:29 AM | 310 (10.1%) | 54 (2.7%) |
| 6:30 AM to 6:59 AM | 111 (3.6%) | 223 (11.0%) |
| 7:00 AM to 7:29 AM | 150 (4.9%) | 287 (14.2%) |
| 7:30 AM to 7:59 AM | 361 (11.8%) | 449 (22.2%) |
| 8:00 AM to 8:29 AM | 254 (8.3%) | 186 (9.2%) |
| 8:30 AM to 8:59 AM | 18 (0.6%) | 20 (1.0%) |
| 9:00 AM to 9:59 AM | 64 (2.1%) | 79 (3.9%) |
| 10:00 AM to 10:59 AM | 84 (2.8%) | 0 (0.0%) |
| 11:00 AM to 11:59 AM | 3 (0.1%) | 0 (0.0%) |
| 12:00 PM to 3:59 PM | 580 (19.0%) | 150 (7.4%) |
| 4:00 PM to 11:59 PM | 330 (10.8%) | 221 (10.9%) |
| Total | 3,056 (100.0%) | 2,026 (100.0%) |
Housing Occupancy in Colfax County
Occupancy by Ownership in Colfax County
Of the total 3,616 dwellings in Colfax County, owner-occupied units account for 2,831 (78.3%), while renter-occupied units make up 785 (21.7%).
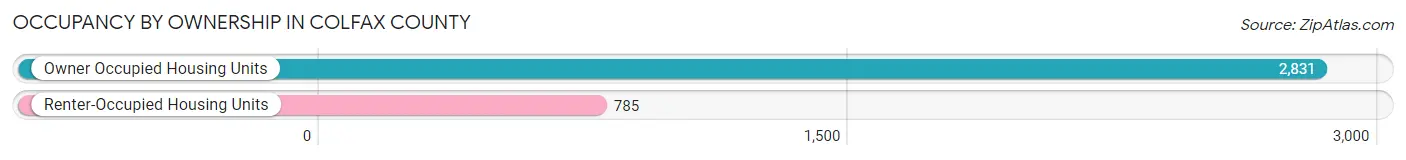
| Occupancy | # Housing Units | % Housing Units |
| Owner Occupied Housing Units | 2,831 | 78.3% |
| Renter-Occupied Housing Units | 785 | 21.7% |
| Total Occupied Housing Units | 3,616 | 100.0% |
Occupancy by Household Size in Colfax County
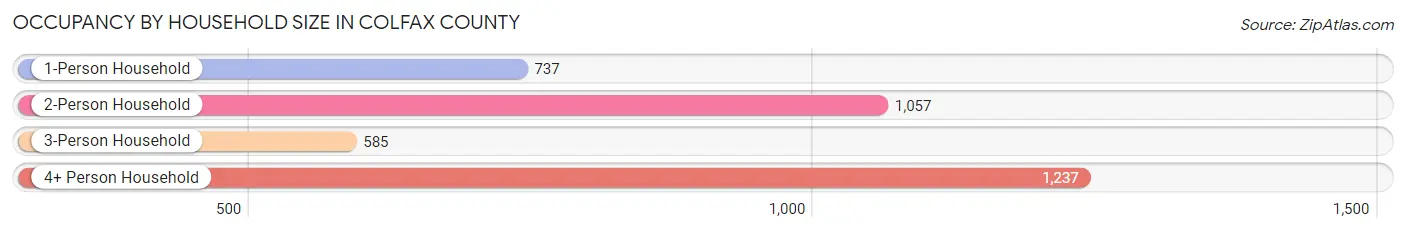
| Household Size | # Housing Units | % Housing Units |
| 1-Person Household | 737 | 20.4% |
| 2-Person Household | 1,057 | 29.2% |
| 3-Person Household | 585 | 16.2% |
| 4+ Person Household | 1,237 | 34.2% |
| Total Housing Units | 3,616 | 100.0% |
Occupancy by Ownership by Household Size in Colfax County
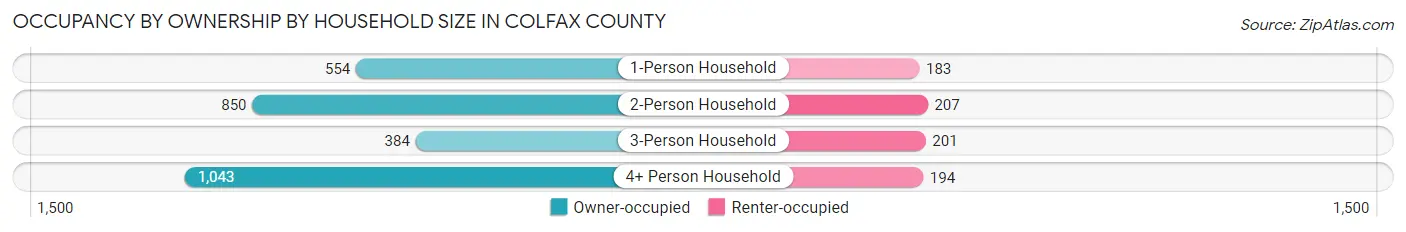
| Household Size | Owner-occupied | Renter-occupied |
| 1-Person Household | 554 (75.2%) | 183 (24.8%) |
| 2-Person Household | 850 (80.4%) | 207 (19.6%) |
| 3-Person Household | 384 (65.6%) | 201 (34.4%) |
| 4+ Person Household | 1,043 (84.3%) | 194 (15.7%) |
| Total Housing Units | 2,831 (78.3%) | 785 (21.7%) |
Occupancy by Educational Attainment in Colfax County
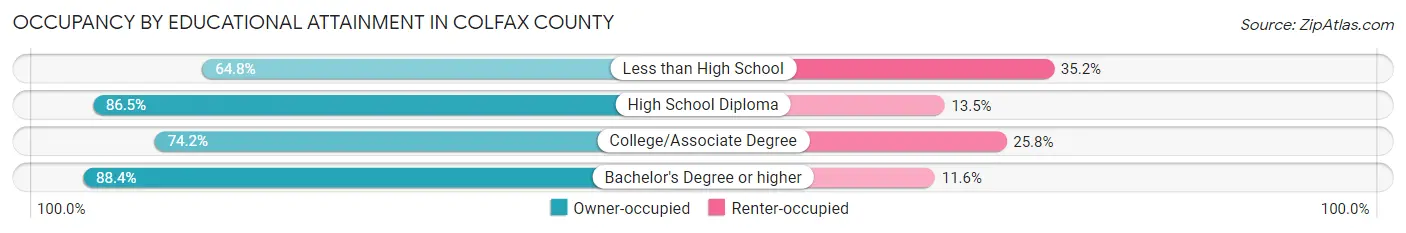
| Household Size | Owner-occupied | Renter-occupied |
| Less than High School | 498 (64.8%) | 271 (35.2%) |
| High School Diploma | 1,073 (86.5%) | 168 (13.5%) |
| College/Associate Degree | 834 (74.2%) | 290 (25.8%) |
| Bachelor's Degree or higher | 426 (88.4%) | 56 (11.6%) |
Occupancy by Age of Householder in Colfax County
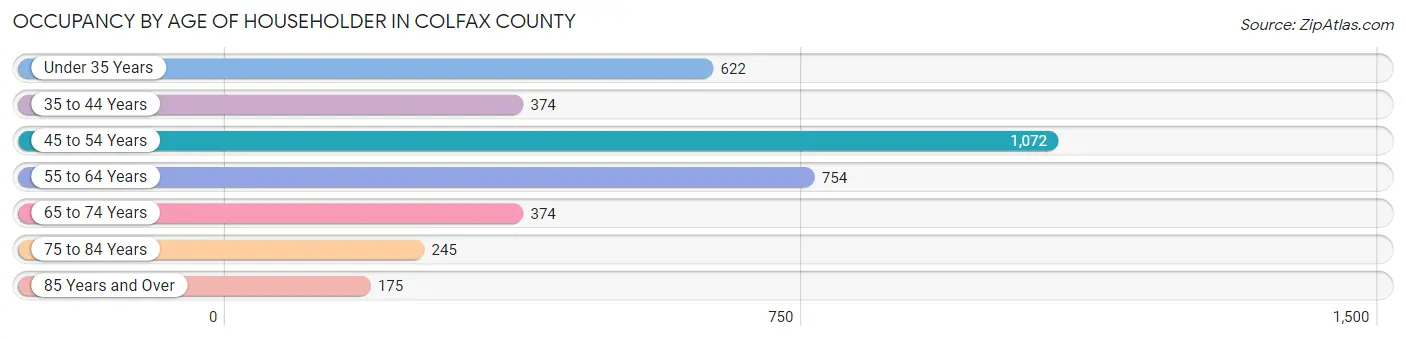
| Age Bracket | # Households | % Households |
| Under 35 Years | 622 | 17.2% |
| 35 to 44 Years | 374 | 10.3% |
| 45 to 54 Years | 1,072 | 29.6% |
| 55 to 64 Years | 754 | 20.8% |
| 65 to 74 Years | 374 | 10.3% |
| 75 to 84 Years | 245 | 6.8% |
| 85 Years and Over | 175 | 4.8% |
| Total | 3,616 | 100.0% |
Housing Finances in Colfax County
Median Income by Occupancy in Colfax County
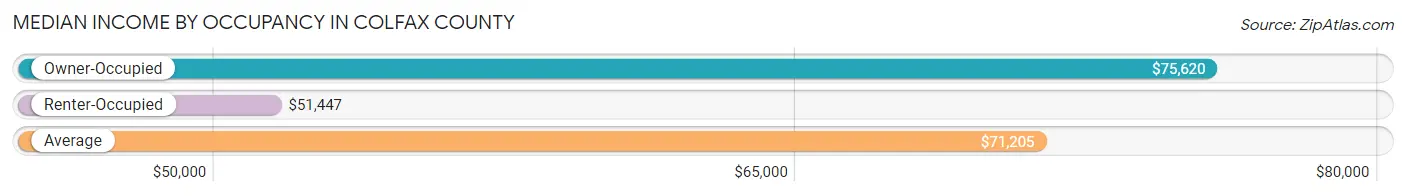
| Occupancy Type | # Households | Median Income |
| Owner-Occupied | 2,831 (78.3%) | $75,620 |
| Renter-Occupied | 785 (21.7%) | $51,447 |
| Average | 3,616 (100.0%) | $71,205 |
Occupancy by Householder Income Bracket in Colfax County
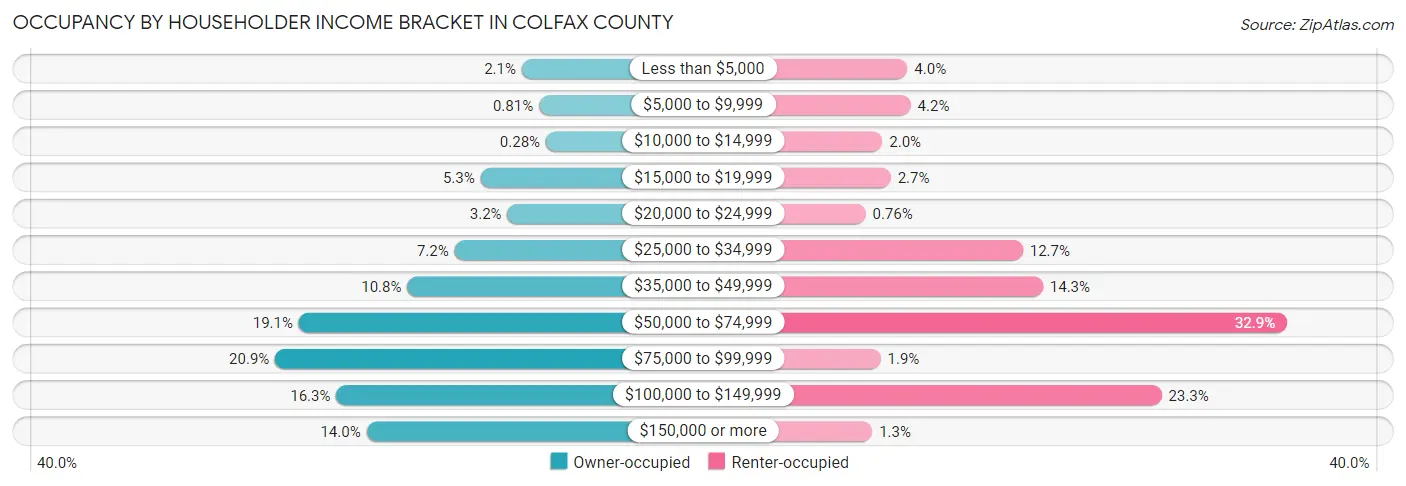
| Income Bracket | Owner-occupied | Renter-occupied |
| Less than $5,000 | 60 (2.1%) | 31 (4.0%) |
| $5,000 to $9,999 | 23 (0.8%) | 33 (4.2%) |
| $10,000 to $14,999 | 8 (0.3%) | 16 (2.0%) |
| $15,000 to $19,999 | 149 (5.3%) | 21 (2.7%) |
| $20,000 to $24,999 | 91 (3.2%) | 6 (0.8%) |
| $25,000 to $34,999 | 205 (7.2%) | 100 (12.7%) |
| $35,000 to $49,999 | 307 (10.8%) | 112 (14.3%) |
| $50,000 to $74,999 | 541 (19.1%) | 258 (32.9%) |
| $75,000 to $99,999 | 592 (20.9%) | 15 (1.9%) |
| $100,000 to $149,999 | 460 (16.3%) | 183 (23.3%) |
| $150,000 or more | 395 (14.0%) | 10 (1.3%) |
| Total | 2,831 (100.0%) | 785 (100.0%) |
Monthly Housing Cost Tiers in Colfax County
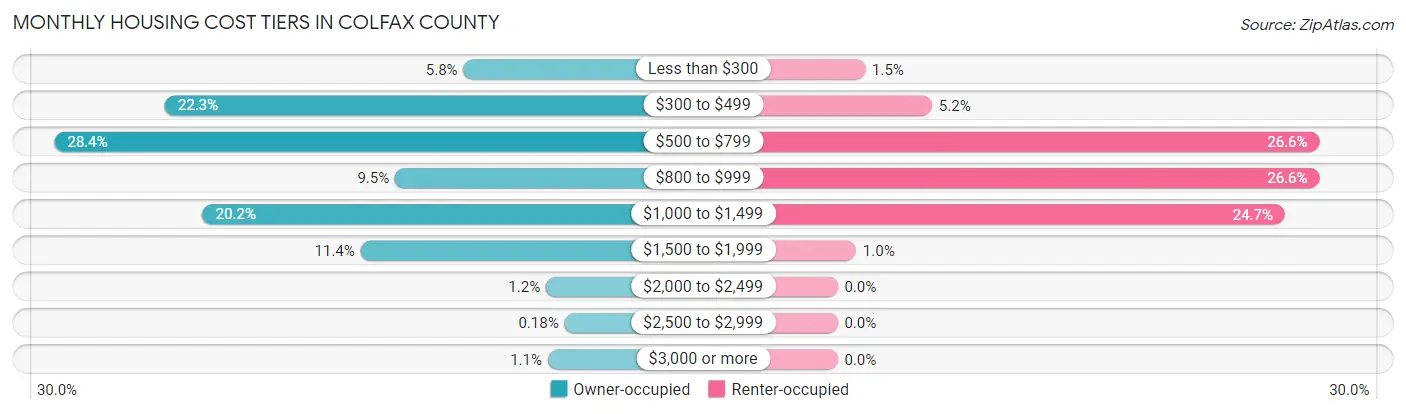
| Monthly Cost | Owner-occupied | Renter-occupied |
| Less than $300 | 163 (5.8%) | 12 (1.5%) |
| $300 to $499 | 630 (22.3%) | 41 (5.2%) |
| $500 to $799 | 803 (28.4%) | 209 (26.6%) |
| $800 to $999 | 270 (9.5%) | 209 (26.6%) |
| $1,000 to $1,499 | 571 (20.2%) | 194 (24.7%) |
| $1,500 to $1,999 | 324 (11.4%) | 8 (1.0%) |
| $2,000 to $2,499 | 34 (1.2%) | 0 (0.0%) |
| $2,500 to $2,999 | 5 (0.2%) | 0 (0.0%) |
| $3,000 or more | 31 (1.1%) | 0 (0.0%) |
| Total | 2,831 (100.0%) | 785 (100.0%) |
Physical Housing Characteristics in Colfax County
Housing Structures in Colfax County
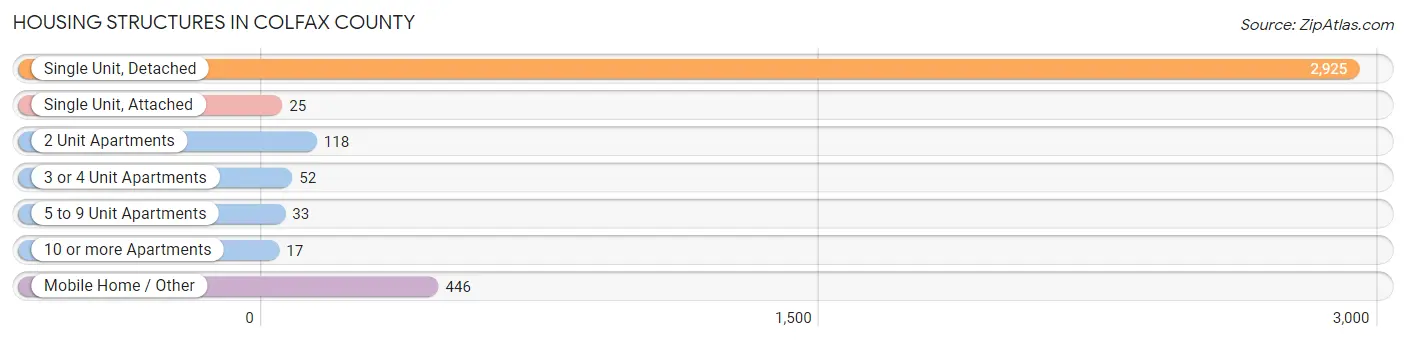
| Structure Type | # Housing Units | % Housing Units |
| Single Unit, Detached | 2,925 | 80.9% |
| Single Unit, Attached | 25 | 0.7% |
| 2 Unit Apartments | 118 | 3.3% |
| 3 or 4 Unit Apartments | 52 | 1.4% |
| 5 to 9 Unit Apartments | 33 | 0.9% |
| 10 or more Apartments | 17 | 0.5% |
| Mobile Home / Other | 446 | 12.3% |
| Total | 3,616 | 100.0% |
Housing Structures by Occupancy in Colfax County
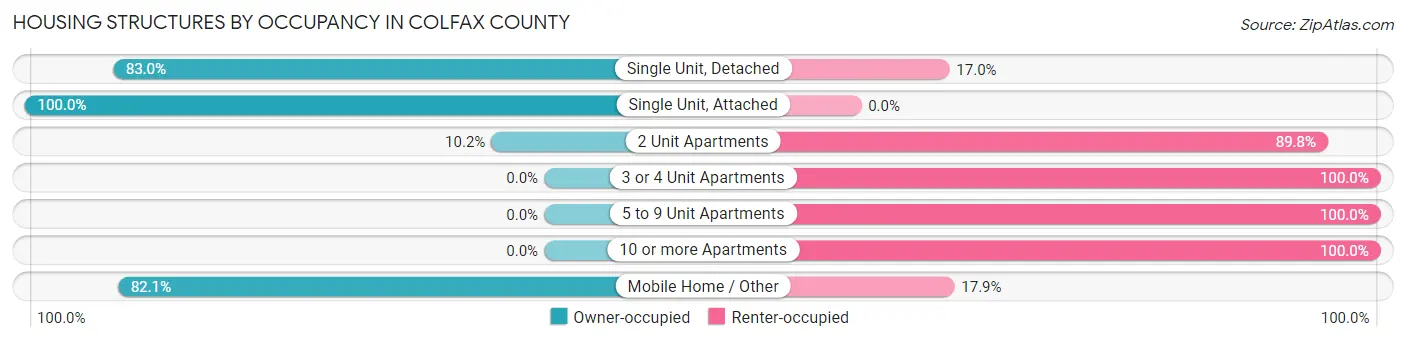
| Structure Type | Owner-occupied | Renter-occupied |
| Single Unit, Detached | 2,428 (83.0%) | 497 (17.0%) |
| Single Unit, Attached | 25 (100.0%) | 0 (0.0%) |
| 2 Unit Apartments | 12 (10.2%) | 106 (89.8%) |
| 3 or 4 Unit Apartments | 0 (0.0%) | 52 (100.0%) |
| 5 to 9 Unit Apartments | 0 (0.0%) | 33 (100.0%) |
| 10 or more Apartments | 0 (0.0%) | 17 (100.0%) |
| Mobile Home / Other | 366 (82.1%) | 80 (17.9%) |
| Total | 2,831 (78.3%) | 785 (21.7%) |
Housing Structures by Number of Rooms in Colfax County
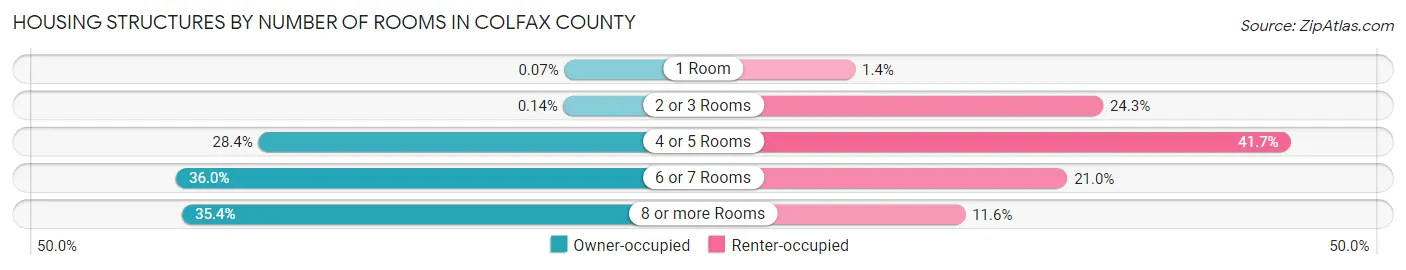
| Number of Rooms | Owner-occupied | Renter-occupied |
| 1 Room | 2 (0.1%) | 11 (1.4%) |
| 2 or 3 Rooms | 4 (0.1%) | 191 (24.3%) |
| 4 or 5 Rooms | 803 (28.4%) | 327 (41.7%) |
| 6 or 7 Rooms | 1,019 (36.0%) | 165 (21.0%) |
| 8 or more Rooms | 1,003 (35.4%) | 91 (11.6%) |
| Total | 2,831 (100.0%) | 785 (100.0%) |
Housing Structure by Heating Type in Colfax County
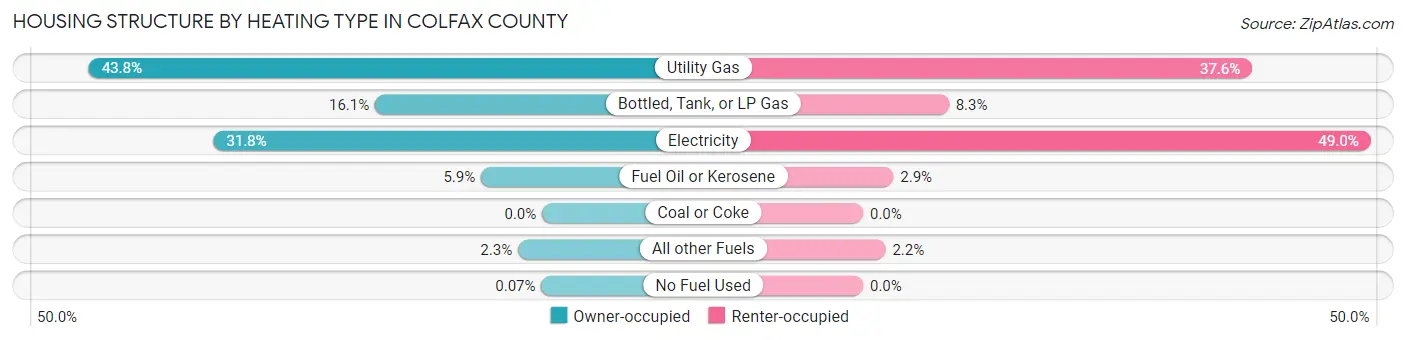
| Heating Type | Owner-occupied | Renter-occupied |
| Utility Gas | 1,240 (43.8%) | 295 (37.6%) |
| Bottled, Tank, or LP Gas | 457 (16.1%) | 65 (8.3%) |
| Electricity | 899 (31.8%) | 385 (49.0%) |
| Fuel Oil or Kerosene | 167 (5.9%) | 23 (2.9%) |
| Coal or Coke | 0 (0.0%) | 0 (0.0%) |
| All other Fuels | 66 (2.3%) | 17 (2.2%) |
| No Fuel Used | 2 (0.1%) | 0 (0.0%) |
| Total | 2,831 (100.0%) | 785 (100.0%) |
Household Vehicle Usage in Colfax County
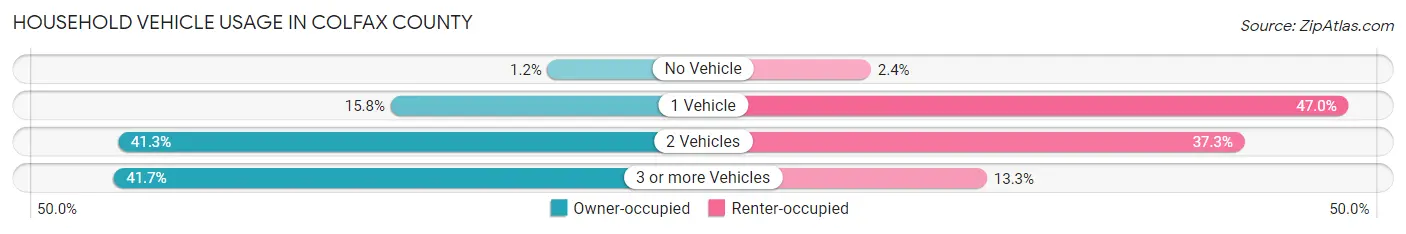
| Vehicles per Household | Owner-occupied | Renter-occupied |
| No Vehicle | 33 (1.2%) | 19 (2.4%) |
| 1 Vehicle | 448 (15.8%) | 369 (47.0%) |
| 2 Vehicles | 1,169 (41.3%) | 293 (37.3%) |
| 3 or more Vehicles | 1,181 (41.7%) | 104 (13.3%) |
| Total | 2,831 (100.0%) | 785 (100.0%) |
Real Estate & Mortgages in Colfax County
Real Estate and Mortgage Overview in Colfax County
| Characteristic | Without Mortgage | With Mortgage |
| Housing Units | 1,727 | 1,104 |
| Median Property Value | $95,000 | $117,000 |
| Median Household Income | $70,608 | $252 |
| Monthly Housing Costs | $521 | $31 |
| Real Estate Taxes | $1,503 | $52 |
Property Value by Mortgage Status in Colfax County
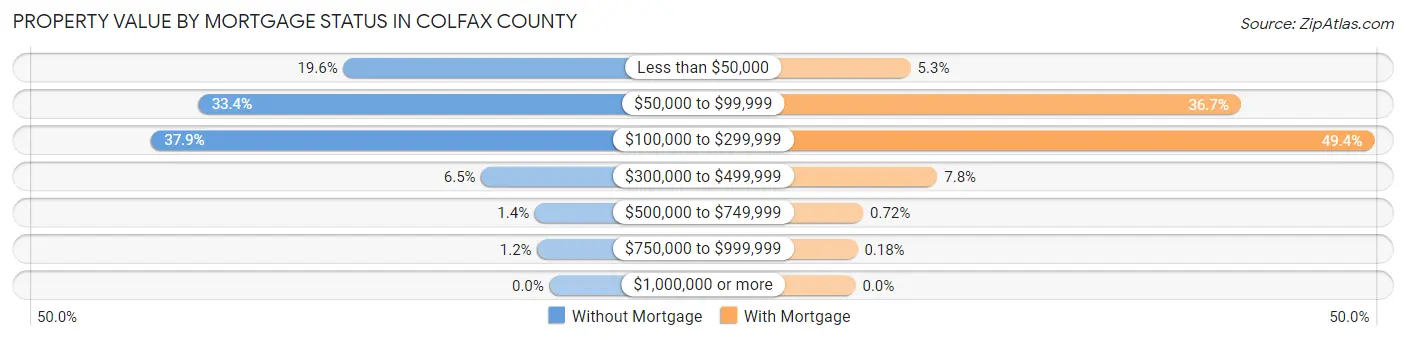
| Property Value | Without Mortgage | With Mortgage |
| Less than $50,000 | 339 (19.6%) | 58 (5.2%) |
| $50,000 to $99,999 | 577 (33.4%) | 405 (36.7%) |
| $100,000 to $299,999 | 655 (37.9%) | 545 (49.4%) |
| $300,000 to $499,999 | 112 (6.5%) | 86 (7.8%) |
| $500,000 to $749,999 | 24 (1.4%) | 8 (0.7%) |
| $750,000 to $999,999 | 20 (1.2%) | 2 (0.2%) |
| $1,000,000 or more | 0 (0.0%) | 0 (0.0%) |
| Total | 1,727 (100.0%) | 1,104 (100.0%) |
Household Income by Mortgage Status in Colfax County
| Household Income | Without Mortgage | With Mortgage |
| Less than $10,000 | 70 (4.1%) | 20 (1.8%) |
| $10,000 to $24,999 | 191 (11.1%) | 13 (1.2%) |
| $25,000 to $34,999 | 186 (10.8%) | 57 (5.2%) |
| $35,000 to $49,999 | 164 (9.5%) | 19 (1.7%) |
| $50,000 to $74,999 | 453 (26.2%) | 143 (13.0%) |
| $75,000 to $99,999 | 334 (19.3%) | 88 (8.0%) |
| $100,000 to $149,999 | 186 (10.8%) | 258 (23.4%) |
| $150,000 or more | 143 (8.3%) | 274 (24.8%) |
| Total | 1,727 (100.0%) | 1,104 (100.0%) |
Property Value to Household Income Ratio in Colfax County
| Value-to-Income Ratio | Without Mortgage | With Mortgage |
| Less than 2.0x | 1,008 (58.4%) | 92,500 (8,378.6%) |
| 2.0x to 2.9x | 242 (14.0%) | 792 (71.7%) |
| 3.0x to 3.9x | 194 (11.2%) | 145 (13.1%) |
| 4.0x or more | 251 (14.5%) | 44 (4.0%) |
| Total | 1,727 (100.0%) | 1,104 (100.0%) |
Real Estate Taxes by Mortgage Status in Colfax County
| Property Taxes | Without Mortgage | With Mortgage |
| Less than $800 | 515 (29.8%) | 7 (0.6%) |
| $800 to $1,499 | 272 (15.8%) | 51 (4.6%) |
| $800 to $1,499 | 790 (45.7%) | 507 (45.9%) |
| Total | 1,727 (100.0%) | 1,104 (100.0%) |
Health & Disability in Colfax County
Health Insurance Coverage by Age in Colfax County
| Age Bracket | With Coverage | Without Coverage |
| Under 6 Years | 965 (94.7%) | 54 (5.3%) |
| 6 to 18 Years | 2,259 (98.7%) | 30 (1.3%) |
| 19 to 25 Years | 606 (98.2%) | 11 (1.8%) |
| 26 to 34 Years | 857 (78.8%) | 231 (21.2%) |
| 35 to 44 Years | 832 (81.9%) | 184 (18.1%) |
| 45 to 54 Years | 1,212 (72.4%) | 461 (27.6%) |
| 55 to 64 Years | 1,291 (95.9%) | 55 (4.1%) |
| 65 to 74 Years | 738 (90.9%) | 74 (9.1%) |
| 75 Years and older | 546 (100.0%) | 0 (0.0%) |
| Total | 9,306 (89.4%) | 1,100 (10.6%) |
Health Insurance Coverage by Citizenship Status in Colfax County
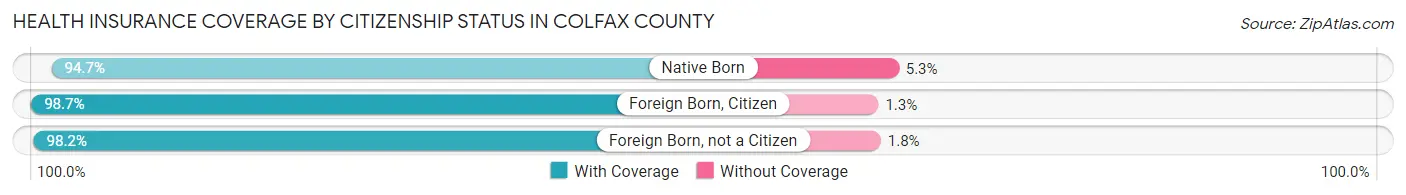
| Citizenship Status | With Coverage | Without Coverage |
| Native Born | 965 (94.7%) | 54 (5.3%) |
| Foreign Born, Citizen | 2,259 (98.7%) | 30 (1.3%) |
| Foreign Born, not a Citizen | 606 (98.2%) | 11 (1.8%) |
Health Insurance Coverage by Household Income in Colfax County
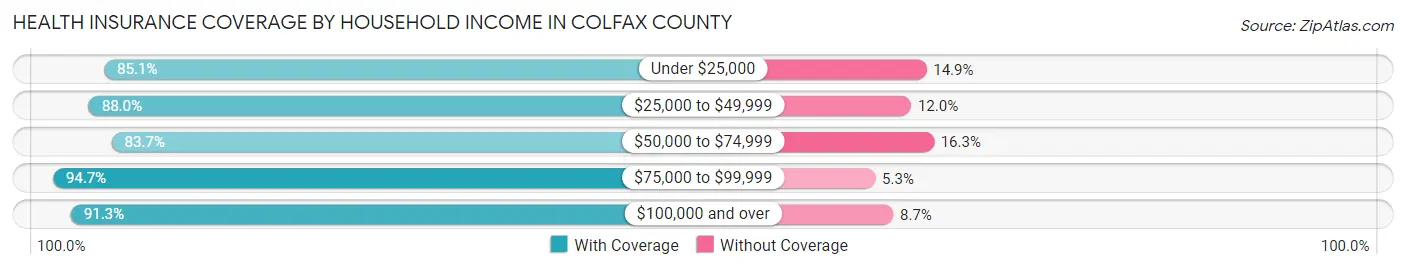
| Household Income | With Coverage | Without Coverage |
| Under $25,000 | 571 (85.1%) | 100 (14.9%) |
| $25,000 to $49,999 | 1,638 (88.0%) | 224 (12.0%) |
| $50,000 to $74,999 | 1,629 (83.7%) | 317 (16.3%) |
| $75,000 to $99,999 | 1,746 (94.7%) | 98 (5.3%) |
| $100,000 and over | 3,719 (91.3%) | 353 (8.7%) |
Public vs Private Health Insurance Coverage by Age in Colfax County
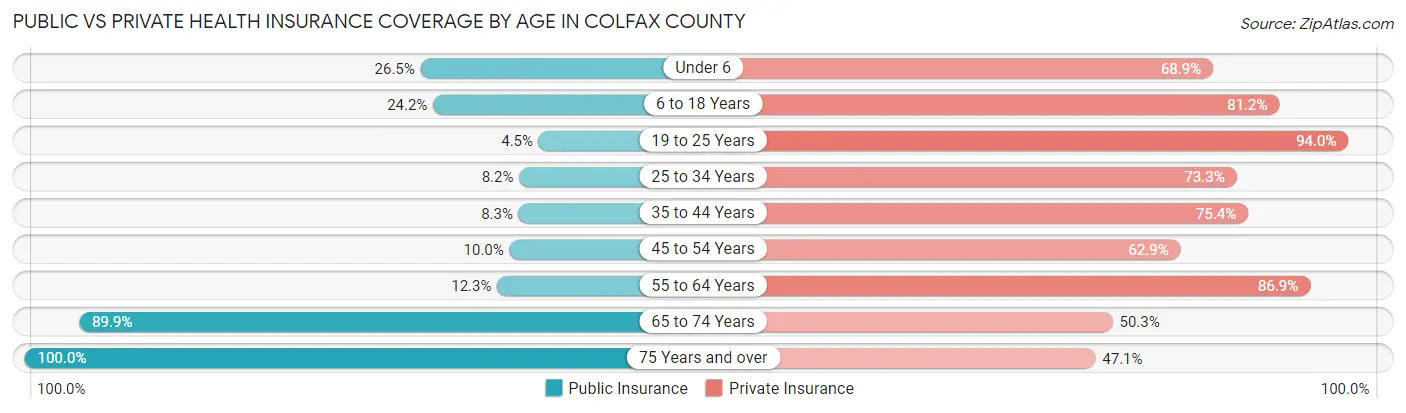
| Age Bracket | Public Insurance | Private Insurance |
| Under 6 | 270 (26.5%) | 702 (68.9%) |
| 6 to 18 Years | 553 (24.2%) | 1,859 (81.2%) |
| 19 to 25 Years | 28 (4.5%) | 580 (94.0%) |
| 25 to 34 Years | 89 (8.2%) | 797 (73.3%) |
| 35 to 44 Years | 84 (8.3%) | 766 (75.4%) |
| 45 to 54 Years | 167 (10.0%) | 1,052 (62.9%) |
| 55 to 64 Years | 165 (12.3%) | 1,170 (86.9%) |
| 65 to 74 Years | 730 (89.9%) | 408 (50.2%) |
| 75 Years and over | 546 (100.0%) | 257 (47.1%) |
| Total | 2,632 (25.3%) | 7,591 (73.0%) |
Disability Status by Sex by Age in Colfax County
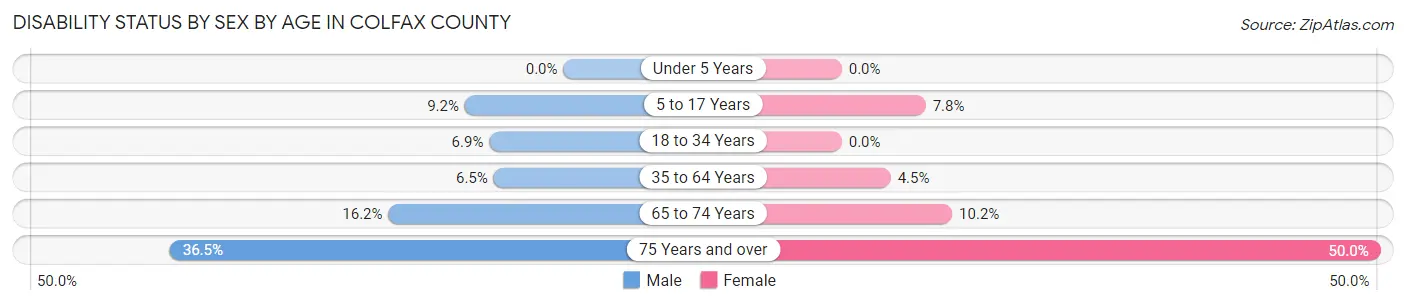
| Age Bracket | Male | Female |
| Under 5 Years | 0 (0.0%) | 0 (0.0%) |
| 5 to 17 Years | 113 (9.1%) | 85 (7.8%) |
| 18 to 34 Years | 72 (6.9%) | 0 (0.0%) |
| 35 to 64 Years | 147 (6.5%) | 80 (4.5%) |
| 65 to 74 Years | 70 (16.2%) | 39 (10.2%) |
| 75 Years and over | 84 (36.5%) | 158 (50.0%) |
Disability Class by Sex by Age in Colfax County
Disability Class: Hearing Difficulty
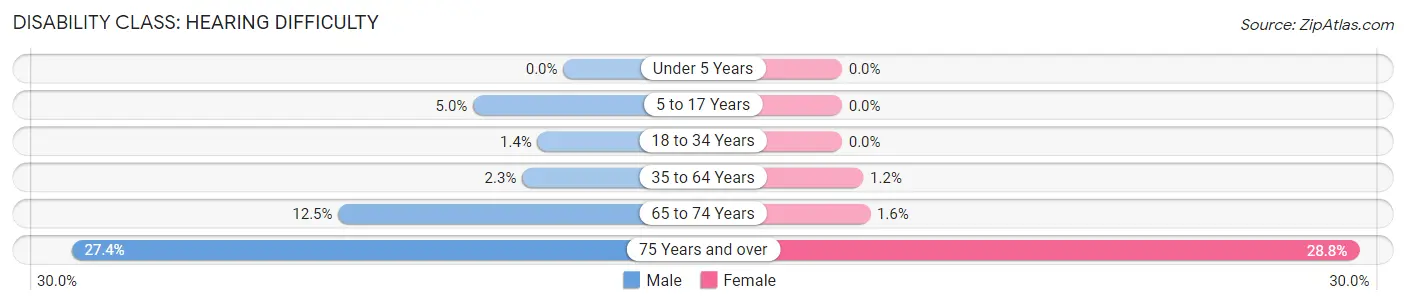
| Age Bracket | Male | Female |
| Under 5 Years | 0 (0.0%) | 0 (0.0%) |
| 5 to 17 Years | 62 (5.0%) | 0 (0.0%) |
| 18 to 34 Years | 15 (1.4%) | 0 (0.0%) |
| 35 to 64 Years | 52 (2.3%) | 21 (1.2%) |
| 65 to 74 Years | 54 (12.5%) | 6 (1.6%) |
| 75 Years and over | 63 (27.4%) | 91 (28.8%) |
Disability Class: Vision Difficulty
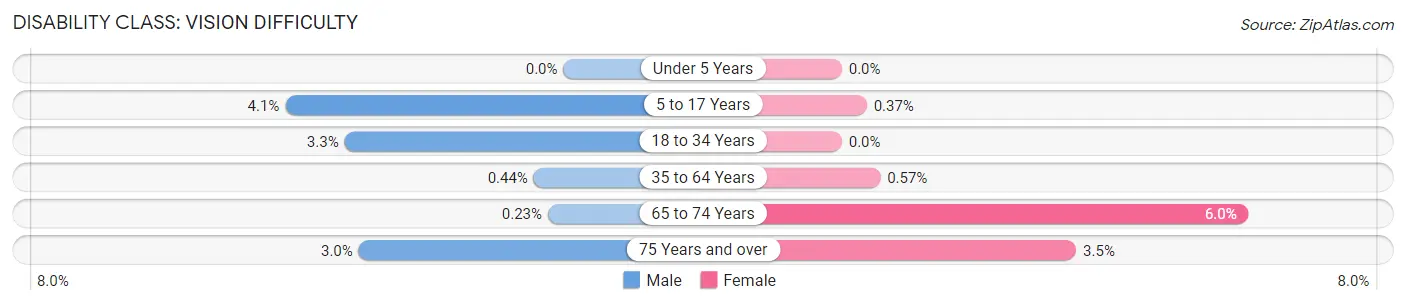
| Age Bracket | Male | Female |
| Under 5 Years | 0 (0.0%) | 0 (0.0%) |
| 5 to 17 Years | 51 (4.1%) | 4 (0.4%) |
| 18 to 34 Years | 34 (3.3%) | 0 (0.0%) |
| 35 to 64 Years | 10 (0.4%) | 10 (0.6%) |
| 65 to 74 Years | 1 (0.2%) | 23 (6.0%) |
| 75 Years and over | 7 (3.0%) | 11 (3.5%) |
Disability Class: Cognitive Difficulty
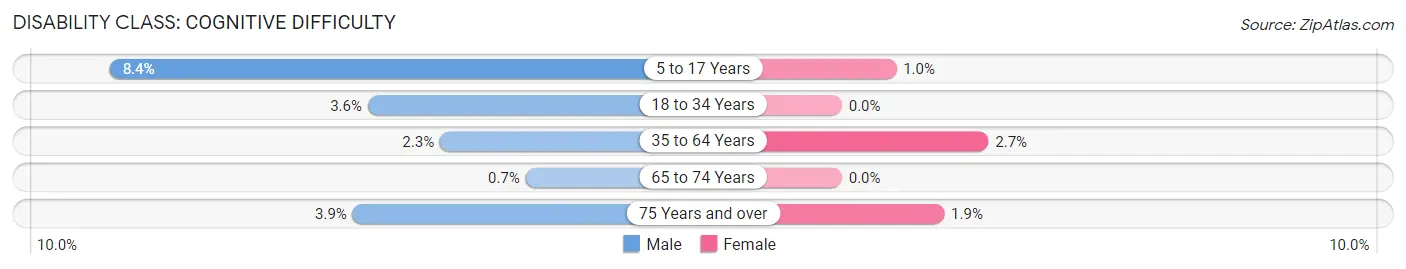
| Age Bracket | Male | Female |
| 5 to 17 Years | 104 (8.4%) | 11 (1.0%) |
| 18 to 34 Years | 38 (3.6%) | 0 (0.0%) |
| 35 to 64 Years | 52 (2.3%) | 48 (2.7%) |
| 65 to 74 Years | 3 (0.7%) | 0 (0.0%) |
| 75 Years and over | 9 (3.9%) | 6 (1.9%) |
Disability Class: Ambulatory Difficulty
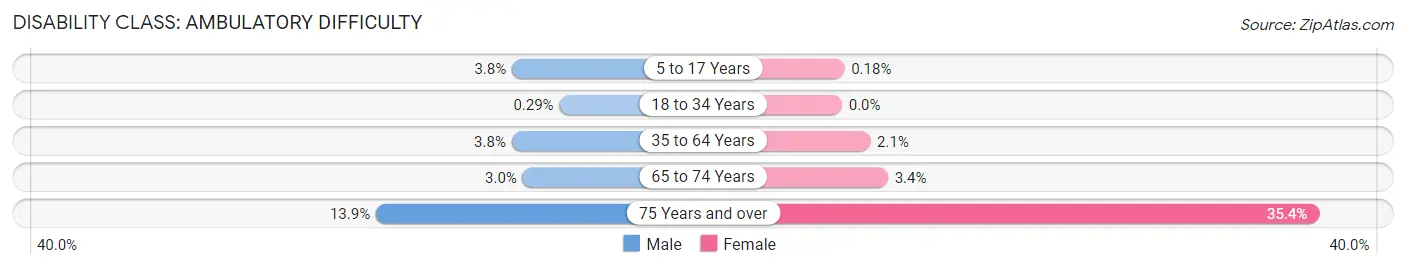
| Age Bracket | Male | Female |
| 5 to 17 Years | 47 (3.8%) | 2 (0.2%) |
| 18 to 34 Years | 3 (0.3%) | 0 (0.0%) |
| 35 to 64 Years | 87 (3.8%) | 37 (2.1%) |
| 65 to 74 Years | 13 (3.0%) | 13 (3.4%) |
| 75 Years and over | 32 (13.9%) | 112 (35.4%) |
Disability Class: Self-Care Difficulty
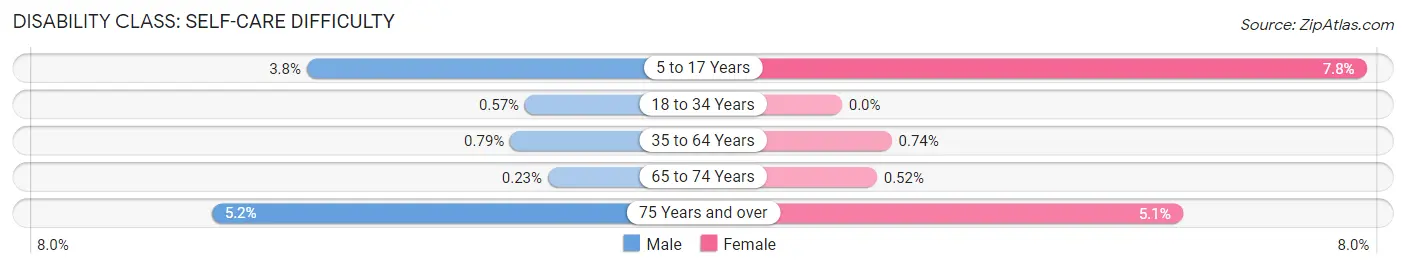
| Age Bracket | Male | Female |
| 5 to 17 Years | 47 (3.8%) | 85 (7.8%) |
| 18 to 34 Years | 6 (0.6%) | 0 (0.0%) |
| 35 to 64 Years | 18 (0.8%) | 13 (0.7%) |
| 65 to 74 Years | 1 (0.2%) | 2 (0.5%) |
| 75 Years and over | 12 (5.2%) | 16 (5.1%) |
Technology Access in Colfax County
Computing Device Access in Colfax County
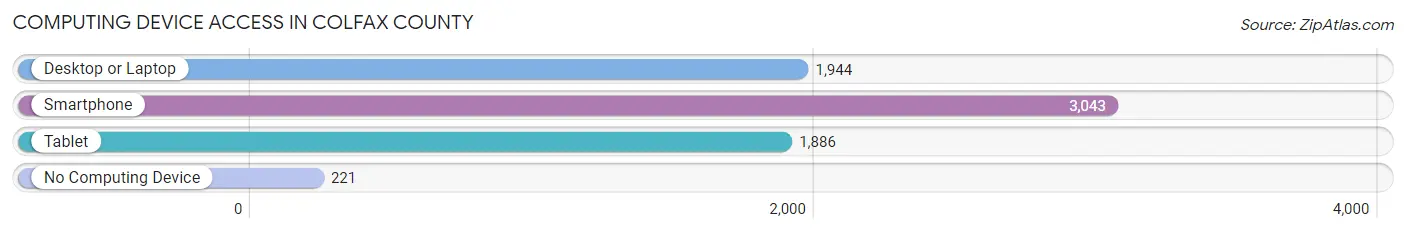
| Device Type | # Households | % Households |
| Desktop or Laptop | 1,944 | 53.8% |
| Smartphone | 3,043 | 84.2% |
| Tablet | 1,886 | 52.2% |
| No Computing Device | 221 | 6.1% |
| Total | 3,616 | 100.0% |
Internet Access in Colfax County
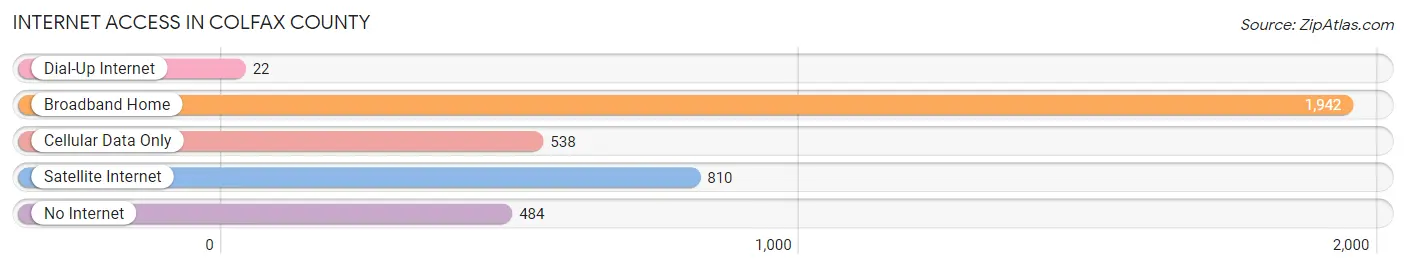
| Internet Type | # Households | % Households |
| Dial-Up Internet | 22 | 0.6% |
| Broadband Home | 1,942 | 53.7% |
| Cellular Data Only | 538 | 14.9% |
| Satellite Internet | 810 | 22.4% |
| No Internet | 484 | 13.4% |
| Total | 3,616 | 100.0% |
Colfax County Summary
Colfax County is located in the eastern part of Nebraska, in the Midwestern United States. It is bordered by Platte County to the north, Dodge County to the east, Saunders County to the south, and Butler County to the west. The county seat is Schuyler, and the largest city is Clarkson. The county was named after Schuyler Colfax, the 17th Vice President of the United States.
History
Colfax County was established in 1871, and was named after Schuyler Colfax, the 17th Vice President of the United States. The county was originally part of the Omaha Indian Reservation, and was opened to white settlement in 1854. The first settlers arrived in the area in 1856, and the county was officially organized in 1871.
The county was largely agricultural in its early years, with the main crops being corn, wheat, and oats. The county also had a thriving livestock industry, with cattle, hogs, and sheep being raised in the area.
In the late 19th century, the county began to experience a population boom, as immigrants from Germany, Bohemia, and other European countries began to settle in the area. This influx of immigrants helped to diversify the county’s economy, and also helped to create a vibrant cultural scene.
Geography
Colfax County covers an area of 845 square miles, and is located in the eastern part of Nebraska. The county is bordered by Platte County to the north, Dodge County to the east, Saunders County to the south, and Butler County to the west.
The county is mostly flat, with some rolling hills in the western part of the county. The Platte River runs through the county, and there are several small lakes and ponds scattered throughout the area. The county is also home to several state parks, including Platte River State Park and Schuyler State Recreation Area.
Economy
Colfax County’s economy is largely based on agriculture, with corn, soybeans, and wheat being the main crops. The county also has a thriving livestock industry, with cattle, hogs, and sheep being raised in the area.
In addition to agriculture, the county also has a strong manufacturing sector, with several companies producing a variety of products, including furniture, plastics, and automotive parts. The county also has a growing tourism industry, with several attractions, including the Platte River State Park and Schuyler State Recreation Area.
Demographics
As of the 2010 census, Colfax County had a population of 10,541. The population was spread out, with 49.3% male and 50.7% female. The median age was 38.7 years.
The racial makeup of the county was 95.2% White, 0.7% African American, 0.3% Native American, 0.4% Asian, 0.1% Pacific Islander, 2.2% from other races, and 1.1% from two or more races. Hispanic or Latino of any race were 4.2% of the population.
The median income for a household in the county was $45,945, and the median income for a family was $54,945. The per capita income for the county was $21,945. About 8.2% of families and 10.7% of the population were below the poverty line, including 14.2% of those under age 18 and 8.2% of those age 65 or over.
Common Questions
What is the Total Population of Colfax County?
Total Population of Colfax County is 10,563.
What is the Total Male Population of Colfax County?
Total Male Population of Colfax County is 5,742.
What is the Total Female Population of Colfax County?
Total Female Population of Colfax County is 4,821.
What is the Ratio of Males per 100 Females in Colfax County?
There are 119.10 Males per 100 Females in Colfax County.
What is the Ratio of Females per 100 Males in Colfax County?
There are 83.96 Females per 100 Males in Colfax County.
What is the Median Population Age in Colfax County?
Median Population Age in Colfax County is 36.4 Years.
What is the Average Family Size in Colfax County
Average Family Size in Colfax County is 3.3 People.
What is the Average Household Size in Colfax County
Average Household Size in Colfax County is 2.9 People.
What is Per Capita Income in Colfax County?
Per Capita income in Colfax County is $29,436.
What is the Median Family Income in Colfax County?
Median Family Income in Colfax County is $75,430.
What is the Median Household income in Colfax County?
Median Household Income in Colfax County is $71,205.
What is Income or Wage Gap in Colfax County?
Income or Wage Gap in Colfax County is 21.9%.
Women in Colfax County earn 78.1 cents for every dollar earned by a man.
What is Family Income Deficit in Colfax County?
Family Income Deficit in Colfax County is $8,715.
Families that are below poverty line in Colfax County earn $8,715 less on average than the poverty threshold level.
What is Inequality or Gini Index in Colfax County?
Inequality or Gini Index in Colfax County is 0.39.
How Large is the Labor Force in Colfax County?
There are 5,452 People in the Labor Forcein in Colfax County.
What is the Percentage of People in the Labor Force in Colfax County?
70.4% of People are in the Labor Force in Colfax County.
What is the Unemployment Rate in Colfax County?
Unemployment Rate in Colfax County is 1.7%.