Buffalo County, NE
Buffalo County Map

Buffalo County Overview
50,103
TOTAL POPULATION
25,127
MALE POPULATION
24,976
FEMALE POPULATION
100.60
MALES / 100 FEMALES
99.40
FEMALES / 100 MALES
34.2
MEDIAN AGE
3.0
AVG FAMILY SIZE
2.5
AVG HOUSEHOLD SIZE
$36,327
PER CAPITA INCOME
$93,464
AVG FAMILY INCOME
$70,093
AVG HOUSEHOLD INCOME
32.8%
WAGE / INCOME GAP [ % ]
67.2¢/ $1
WAGE / INCOME GAP [ $ ]
$9,409
FAMILY INCOME DEFICIT
0.44
INEQUALITY / GINI INDEX
28,413
LABOR FORCE [ PEOPLE ]
71.0%
PERCENT IN LABOR FORCE
2.9%
UNEMPLOYMENT RATE
Buffalo County Area Codes
Race in Buffalo County
The most populous races in Buffalo County are White / Caucasian (44,442 | 88.7%), Hispanic or Latino (4,867 | 9.7%), and Some other Race (2,243 | 4.5%).
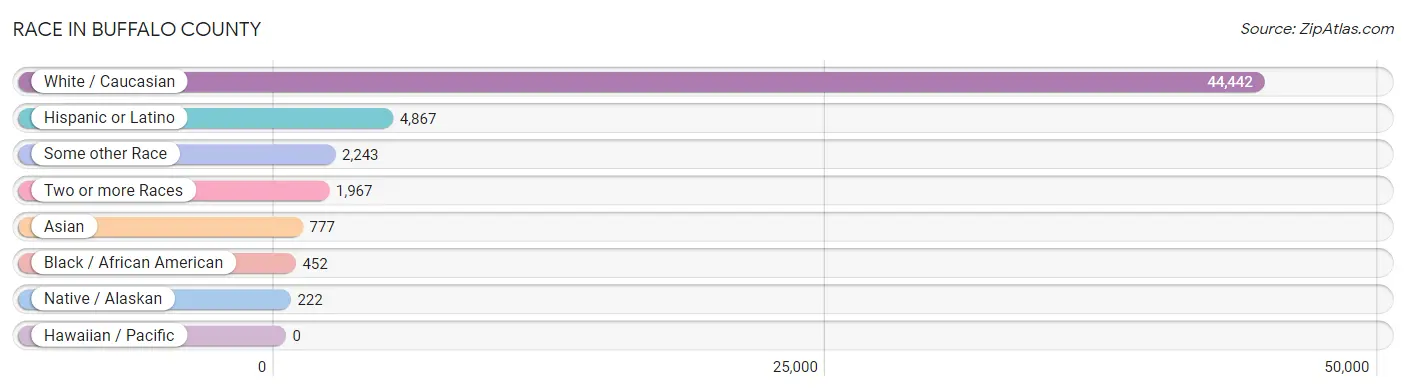
| Race | # Population | % Population |
| Asian | 777 | 1.5% |
| Black / African American | 452 | 0.9% |
| Hawaiian / Pacific | 0 | 0.0% |
| Hispanic or Latino | 4,867 | 9.7% |
| Native / Alaskan | 222 | 0.4% |
| White / Caucasian | 44,442 | 88.7% |
| Two or more Races | 1,967 | 3.9% |
| Some other Race | 2,243 | 4.5% |
| Total | 50,103 | 100.0% |
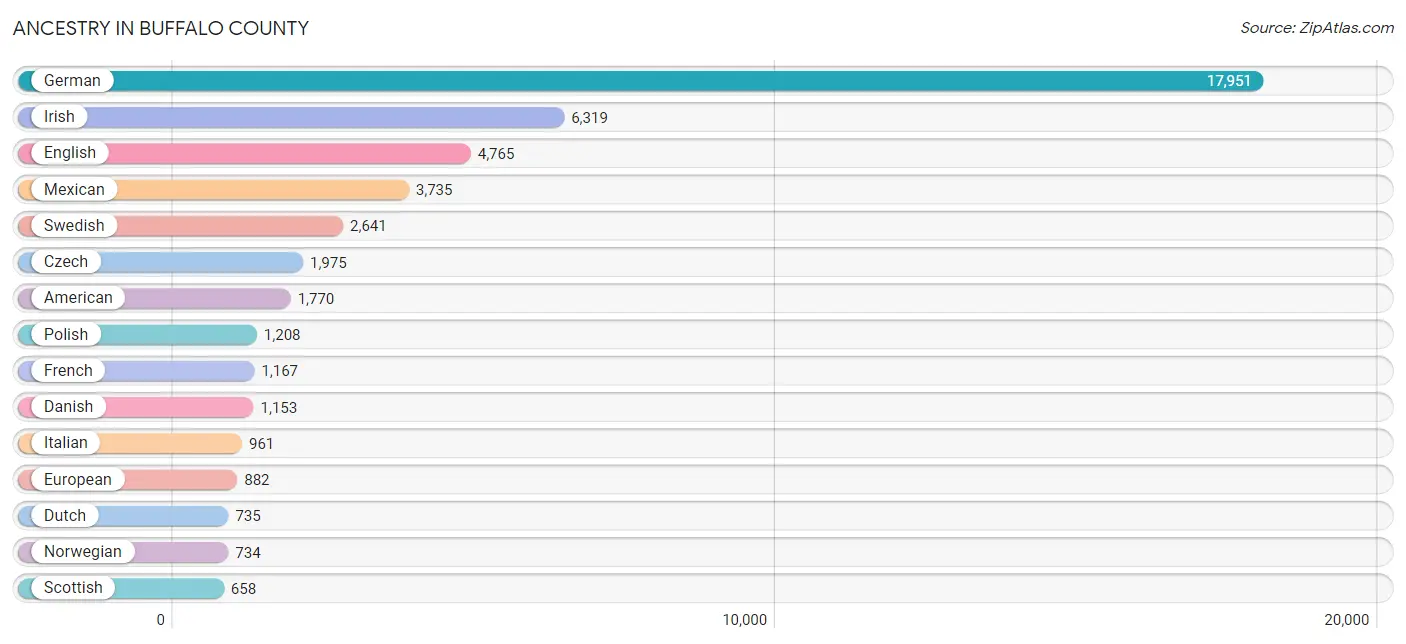
Ancestry in Buffalo County
The most populous ancestries reported in Buffalo County are German (17,951 | 35.8%), Irish (6,319 | 12.6%), English (4,765 | 9.5%), Mexican (3,735 | 7.4%), and Swedish (2,641 | 5.3%), together accounting for 70.7% of all Buffalo County residents.
| Ancestry | # Population | % Population |
| African | 114 | 0.2% |
| American | 1,770 | 3.5% |
| Arab | 94 | 0.2% |
| Argentinean | 5 | 0.0% |
| Armenian | 12 | 0.0% |
| Assyrian / Chaldean / Syriac | 8 | 0.0% |
| Australian | 61 | 0.1% |
| Austrian | 66 | 0.1% |
| Basque | 2 | 0.0% |
| Belgian | 64 | 0.1% |
| Bhutanese | 184 | 0.4% |
| Bolivian | 72 | 0.1% |
| British | 306 | 0.6% |
| Bulgarian | 8 | 0.0% |
| Burmese | 261 | 0.5% |
| Cajun | 10 | 0.0% |
| Canadian | 2 | 0.0% |
| Central American | 639 | 1.3% |
| Central American Indian | 3 | 0.0% |
| Cherokee | 86 | 0.2% |
| Colombian | 41 | 0.1% |
| Czech | 1,975 | 3.9% |
| Czechoslovakian | 161 | 0.3% |
| Danish | 1,153 | 2.3% |
| Dutch | 735 | 1.5% |
| Eastern European | 7 | 0.0% |
| English | 4,765 | 9.5% |
| Ethiopian | 9 | 0.0% |
| European | 882 | 1.8% |
| Finnish | 30 | 0.1% |
| French | 1,167 | 2.3% |
| French Canadian | 114 | 0.2% |
| German | 17,951 | 35.8% |
| German Russian | 36 | 0.1% |
| Greek | 30 | 0.1% |
| Guatemalan | 304 | 0.6% |
| Haitian | 14 | 0.0% |
| Honduran | 101 | 0.2% |
| Hungarian | 44 | 0.1% |
| Indian (Asian) | 368 | 0.7% |
| Iraqi | 7 | 0.0% |
| Irish | 6,319 | 12.6% |
| Italian | 961 | 1.9% |
| Jamaican | 2 | 0.0% |
| Korean | 4 | 0.0% |
| Lebanese | 45 | 0.1% |
| Lumbee | 1 | 0.0% |
| Luxembourger | 15 | 0.0% |
| Mexican | 3,735 | 7.4% |
| Mexican American Indian | 88 | 0.2% |
| Mongolian | 7 | 0.0% |
| Moroccan | 5 | 0.0% |
| Native Hawaiian | 30 | 0.1% |
| Navajo | 4 | 0.0% |
| Nicaraguan | 20 | 0.0% |
| Northern European | 18 | 0.0% |
| Norwegian | 734 | 1.5% |
| Osage | 14 | 0.0% |
| Paiute | 2 | 0.0% |
| Pakistani | 19 | 0.0% |
| Palestinian | 35 | 0.1% |
| Pennsylvania German | 13 | 0.0% |
| Polish | 1,208 | 2.4% |
| Portuguese | 63 | 0.1% |
| Puerto Rican | 108 | 0.2% |
| Romanian | 2 | 0.0% |
| Russian | 172 | 0.3% |
| Salvadoran | 214 | 0.4% |
| Scandinavian | 450 | 0.9% |
| Scotch-Irish | 320 | 0.6% |
| Scottish | 658 | 1.3% |
| Sioux | 133 | 0.3% |
| South African | 24 | 0.1% |
| South American | 181 | 0.4% |
| Spaniard | 60 | 0.1% |
| Spanish | 11 | 0.0% |
| Sri Lankan | 68 | 0.1% |
| Subsaharan African | 159 | 0.3% |
| Swedish | 2,641 | 5.3% |
| Swiss | 193 | 0.4% |
| Syrian | 2 | 0.0% |
| Thai | 41 | 0.1% |
| Trinidadian and Tobagonian | 16 | 0.0% |
| Ukrainian | 12 | 0.0% |
| Venezuelan | 63 | 0.1% |
| Vietnamese | 25 | 0.1% |
| Welsh | 260 | 0.5% | View All 87 Rows |
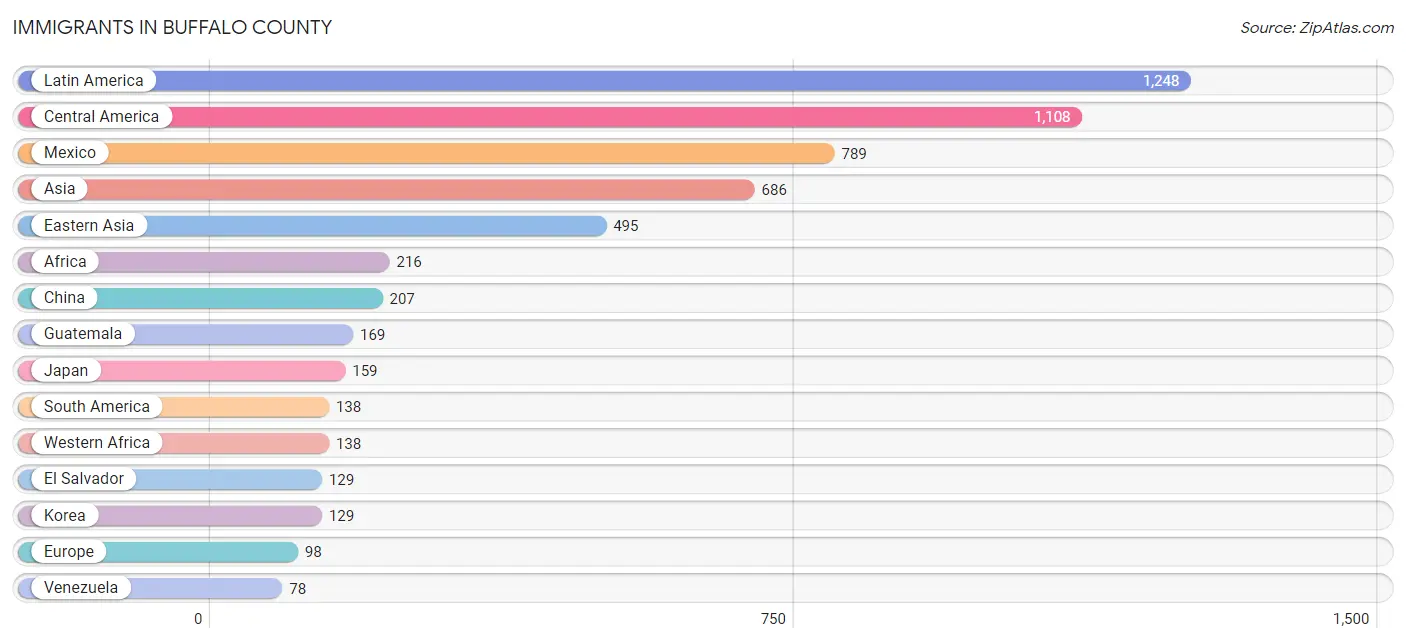
Immigrants in Buffalo County
The most numerous immigrant groups reported in Buffalo County came from Latin America (1,248 | 2.5%), Central America (1,108 | 2.2%), Mexico (789 | 1.6%), Asia (686 | 1.4%), and Eastern Asia (495 | 1.0%), together accounting for 8.6% of all Buffalo County residents.
| Immigration Origin | # Population | % Population |
| Africa | 216 | 0.4% |
| Asia | 686 | 1.4% |
| Austria | 19 | 0.0% |
| Bangladesh | 25 | 0.1% |
| Bolivia | 11 | 0.0% |
| Bulgaria | 8 | 0.0% |
| Canada | 22 | 0.0% |
| Caribbean | 2 | 0.0% |
| Central America | 1,108 | 2.2% |
| China | 207 | 0.4% |
| Colombia | 23 | 0.1% |
| Congo | 22 | 0.0% |
| Eastern Africa | 29 | 0.1% |
| Eastern Asia | 495 | 1.0% |
| Eastern Europe | 20 | 0.0% |
| El Salvador | 129 | 0.3% |
| Ethiopia | 9 | 0.0% |
| Europe | 98 | 0.2% |
| France | 7 | 0.0% |
| Germany | 37 | 0.1% |
| Guatemala | 169 | 0.3% |
| Honduras | 1 | 0.0% |
| India | 41 | 0.1% |
| Iraq | 15 | 0.0% |
| Israel | 22 | 0.0% |
| Jamaica | 2 | 0.0% |
| Japan | 159 | 0.3% |
| Korea | 129 | 0.3% |
| Latin America | 1,248 | 2.5% |
| Mexico | 789 | 1.6% |
| Middle Africa | 22 | 0.0% |
| Morocco | 5 | 0.0% |
| Nicaragua | 20 | 0.0% |
| Nigeria | 55 | 0.1% |
| Northern Africa | 5 | 0.0% |
| Northern Europe | 11 | 0.0% |
| Peru | 22 | 0.0% |
| Scotland | 8 | 0.0% |
| South Africa | 22 | 0.0% |
| South America | 138 | 0.3% |
| South Central Asia | 66 | 0.1% |
| South Eastern Asia | 67 | 0.1% |
| Southern Europe | 4 | 0.0% |
| Spain | 4 | 0.0% |
| Syria | 5 | 0.0% |
| Taiwan | 6 | 0.0% |
| Thailand | 19 | 0.0% |
| Turkey | 16 | 0.0% |
| Ukraine | 12 | 0.0% |
| Venezuela | 78 | 0.2% |
| Vietnam | 48 | 0.1% |
| Western Africa | 138 | 0.3% |
| Western Asia | 58 | 0.1% |
| Western Europe | 63 | 0.1% | View All 54 Rows |
Sex and Age in Buffalo County
Sex and Age in Buffalo County
The most populous age groups in Buffalo County are 20 to 24 Years (2,723 | 10.8%) for men and 20 to 24 Years (2,630 | 10.5%) for women.
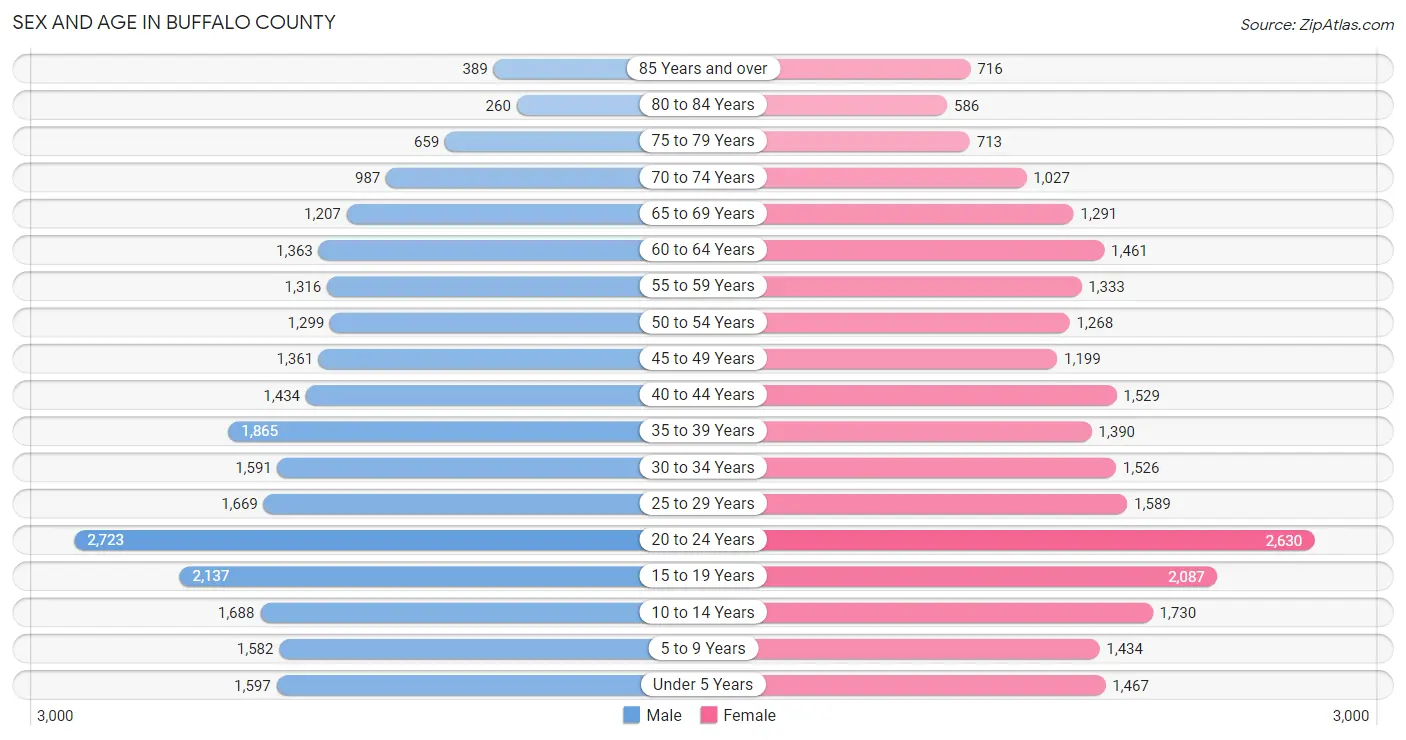
| Age Bracket | Male | Female |
| Under 5 Years | 1,597 (6.4%) | 1,467 (5.9%) |
| 5 to 9 Years | 1,582 (6.3%) | 1,434 (5.7%) |
| 10 to 14 Years | 1,688 (6.7%) | 1,730 (6.9%) |
| 15 to 19 Years | 2,137 (8.5%) | 2,087 (8.4%) |
| 20 to 24 Years | 2,723 (10.8%) | 2,630 (10.5%) |
| 25 to 29 Years | 1,669 (6.6%) | 1,589 (6.4%) |
| 30 to 34 Years | 1,591 (6.3%) | 1,526 (6.1%) |
| 35 to 39 Years | 1,865 (7.4%) | 1,390 (5.6%) |
| 40 to 44 Years | 1,434 (5.7%) | 1,529 (6.1%) |
| 45 to 49 Years | 1,361 (5.4%) | 1,199 (4.8%) |
| 50 to 54 Years | 1,299 (5.2%) | 1,268 (5.1%) |
| 55 to 59 Years | 1,316 (5.2%) | 1,333 (5.3%) |
| 60 to 64 Years | 1,363 (5.4%) | 1,461 (5.9%) |
| 65 to 69 Years | 1,207 (4.8%) | 1,291 (5.2%) |
| 70 to 74 Years | 987 (3.9%) | 1,027 (4.1%) |
| 75 to 79 Years | 659 (2.6%) | 713 (2.9%) |
| 80 to 84 Years | 260 (1.0%) | 586 (2.4%) |
| 85 Years and over | 389 (1.5%) | 716 (2.9%) |
| Total | 25,127 (100.0%) | 24,976 (100.0%) |
Families and Households in Buffalo County
Median Family Size in Buffalo County
The median family size in Buffalo County is 3.02 persons per family, with married-couple families (9,294 | 77.5%) accounting for the largest median family size of 3.06 persons per family. On the other hand, single male/father families (707 | 5.9%) represent the smallest median family size with 2.86 persons per family.
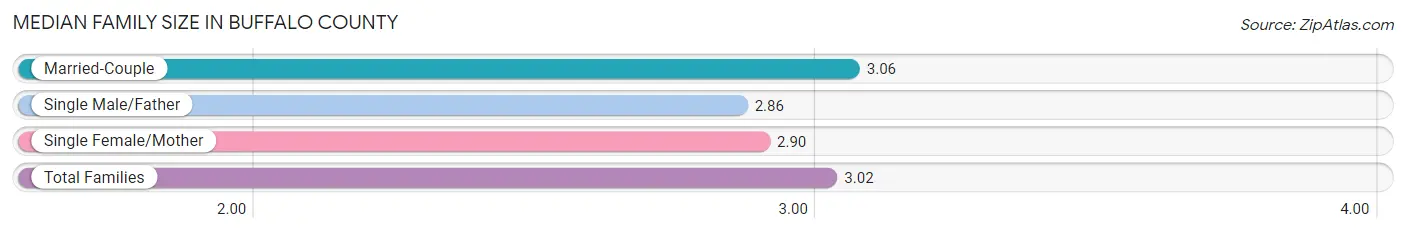
| Family Type | # Families | Family Size |
| Married-Couple | 9,294 (77.5%) | 3.06 |
| Single Male/Father | 707 (5.9%) | 2.86 |
| Single Female/Mother | 1,989 (16.6%) | 2.90 |
| Total Families | 11,990 (100.0%) | 3.02 |
Median Household Size in Buffalo County
The median household size in Buffalo County is 2.46 persons per household, with single male/father households (707 | 3.6%) accounting for the largest median household size of 3.43 persons per household. non-family households (7,554 | 38.7%) represent the smallest median household size with 1.42 persons per household.
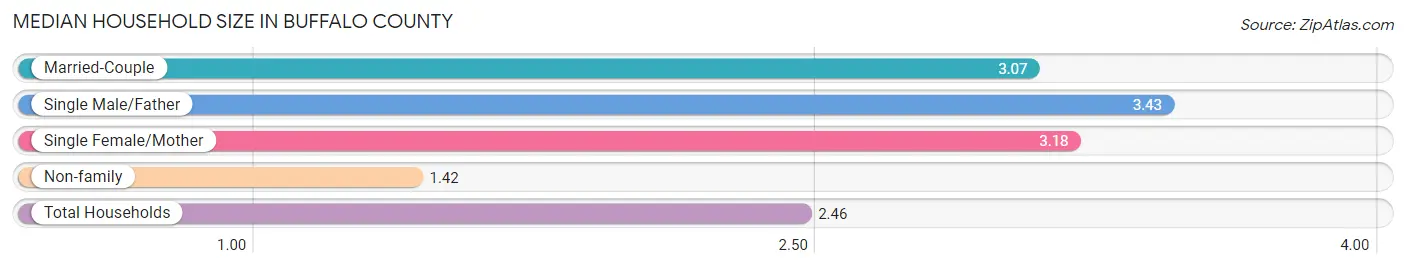
| Household Type | # Households | Household Size |
| Married-Couple | 9,294 (47.5%) | 3.07 |
| Single Male/Father | 707 (3.6%) | 3.43 |
| Single Female/Mother | 1,989 (10.2%) | 3.18 |
| Non-family | 7,554 (38.7%) | 1.42 |
| Total Households | 19,544 (100.0%) | 2.46 |
Household Size by Marriage Status in Buffalo County
Out of a total of 19,544 households in Buffalo County, 11,990 (61.4%) are family households, while 7,554 (38.7%) are nonfamily households. The most numerous type of family households are 2-person households, comprising 5,785, and the most common type of nonfamily households are 1-person households, comprising 5,736.
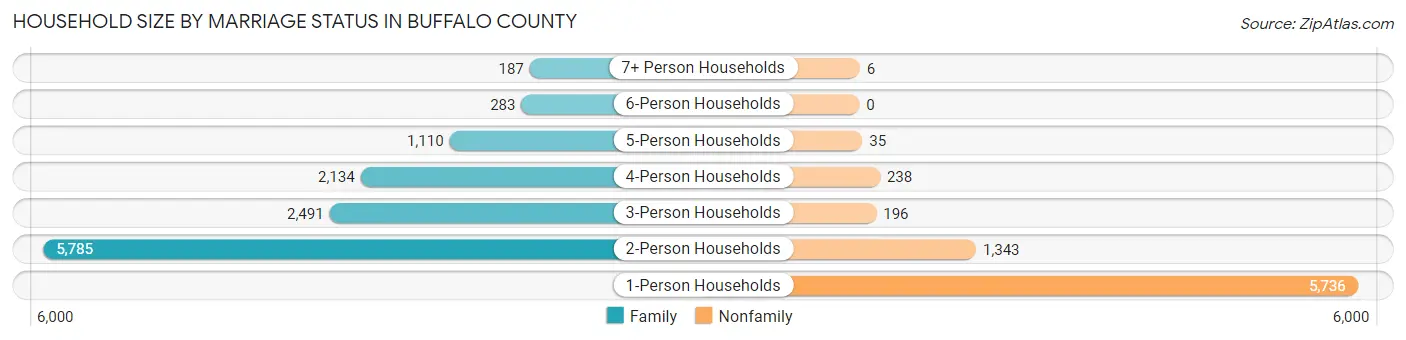
| Household Size | Family Households | Nonfamily Households |
| 1-Person Households | - | 5,736 (29.3%) |
| 2-Person Households | 5,785 (29.6%) | 1,343 (6.9%) |
| 3-Person Households | 2,491 (12.8%) | 196 (1.0%) |
| 4-Person Households | 2,134 (10.9%) | 238 (1.2%) |
| 5-Person Households | 1,110 (5.7%) | 35 (0.2%) |
| 6-Person Households | 283 (1.5%) | 0 (0.0%) |
| 7+ Person Households | 187 (1.0%) | 6 (0.0%) |
| Total | 11,990 (61.4%) | 7,554 (38.7%) |
Female Fertility in Buffalo County
Fertility by Age in Buffalo County
Average fertility rate in Buffalo County is 68.0 births per 1,000 women. Women in the age bracket of 20 to 34 years have the highest fertility rate with 105.0 births per 1,000 women. Women in the age bracket of 20 to 34 years acount for 71.6% of all women with births.
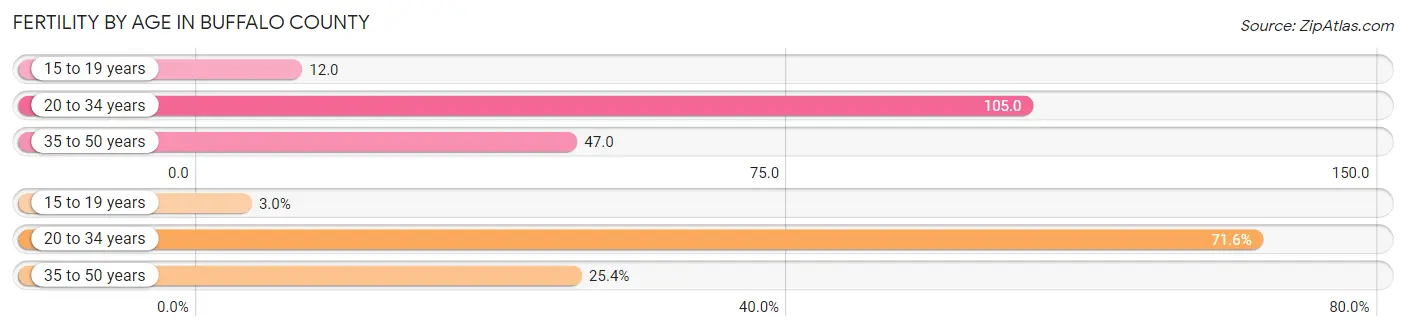
| Age Bracket | Women with Births | Births / 1,000 Women |
| 15 to 19 years | 25 (3.0%) | 12.0 |
| 20 to 34 years | 601 (71.6%) | 105.0 |
| 35 to 50 years | 213 (25.4%) | 47.0 |
| Total | 839 (100.0%) | 68.0 |
Fertility by Age by Marriage Status in Buffalo County
60.3% of women with births (839) in Buffalo County are married. The highest percentage of unmarried women with births falls into 15 to 19 years age bracket with 100.0% of them unmarried at the time of birth, while the lowest percentage of unmarried women with births belong to 20 to 34 years age bracket with 27.8% of them unmarried.
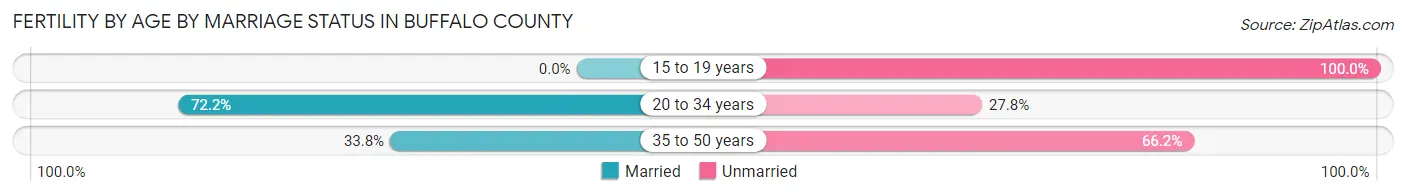
| Age Bracket | Married | Unmarried |
| 15 to 19 years | 0 (0.0%) | 25 (100.0%) |
| 20 to 34 years | 434 (72.2%) | 167 (27.8%) |
| 35 to 50 years | 72 (33.8%) | 141 (66.2%) |
| Total | 506 (60.3%) | 333 (39.7%) |
Fertility by Education in Buffalo County
Average fertility rate in Buffalo County is 68.0 births per 1,000 women. Women with the education attainment of graduate degree have the highest fertility rate of 200.0 births per 1,000 women, while women with the education attainment of high school diploma have the lowest fertility at 21.0 births per 1,000 women. Women with the education attainment of bachelor's degree represent 29.9% of all women with births.
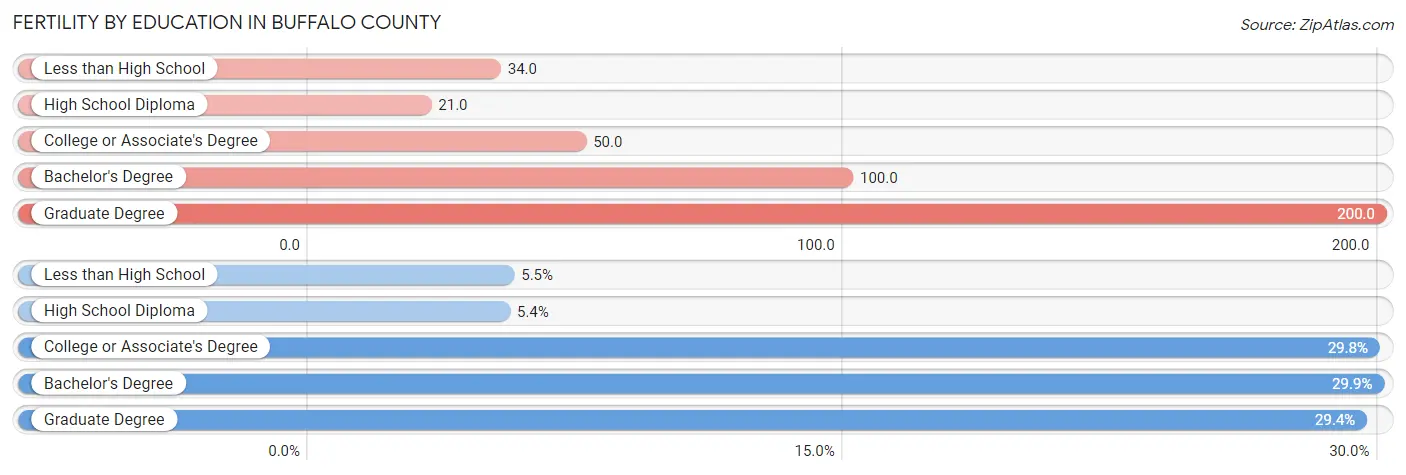
| Educational Attainment | Women with Births | Births / 1,000 Women |
| Less than High School | 46 (5.5%) | 34.0 |
| High School Diploma | 45 (5.4%) | 21.0 |
| College or Associate's Degree | 250 (29.8%) | 50.0 |
| Bachelor's Degree | 251 (29.9%) | 100.0 |
| Graduate Degree | 247 (29.4%) | 200.0 |
| Total | 839 (100.0%) | 68.0 |
Fertility by Education by Marriage Status in Buffalo County
39.7% of women with births in Buffalo County are unmarried. Women with the educational attainment of bachelor's degree are most likely to be married with 83.7% of them married at childbirth, while women with the educational attainment of less than high school are least likely to be married with 80.4% of them unmarried at childbirth.
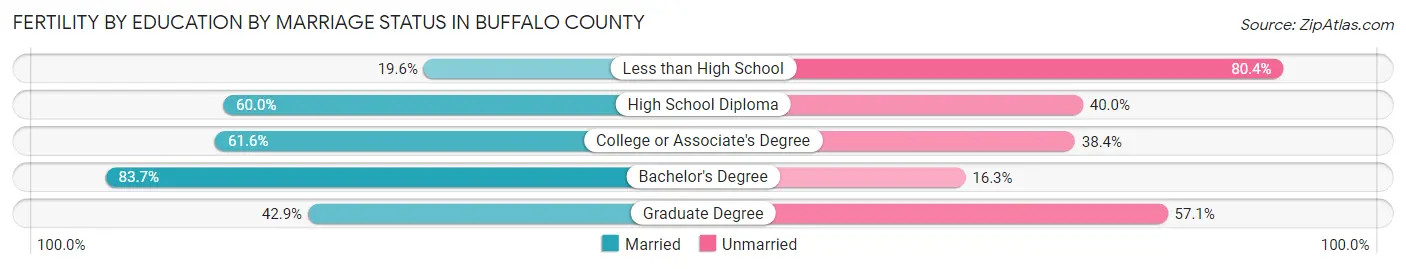
| Educational Attainment | Married | Unmarried |
| Less than High School | 9 (19.6%) | 37 (80.4%) |
| High School Diploma | 27 (60.0%) | 18 (40.0%) |
| College or Associate's Degree | 154 (61.6%) | 96 (38.4%) |
| Bachelor's Degree | 210 (83.7%) | 41 (16.3%) |
| Graduate Degree | 106 (42.9%) | 141 (57.1%) |
| Total | 506 (60.3%) | 333 (39.7%) |
Income in Buffalo County
Income Overview in Buffalo County
Per Capita Income in Buffalo County is $36,327, while median incomes of families and households are $93,464 and $70,093 respectively.
| Characteristic | Number | Measure |
| Per Capita Income | 50,103 | $36,327 |
| Median Family Income | 11,990 | $93,464 |
| Mean Family Income | 11,990 | $111,733 |
| Median Household Income | 19,544 | $70,093 |
| Mean Household Income | 19,544 | $89,555 |
| Income Deficit | 11,990 | $9,409 |
| Wage / Income Gap (%) | 50,103 | 32.76% |
| Wage / Income Gap ($) | 50,103 | 67.24¢ per $1 |
| Gini / Inequality Index | 50,103 | 0.44 |
Earnings by Sex in Buffalo County
Average Earnings in Buffalo County are $35,755, $43,012 for men and $28,920 for women, a difference of 32.8%.
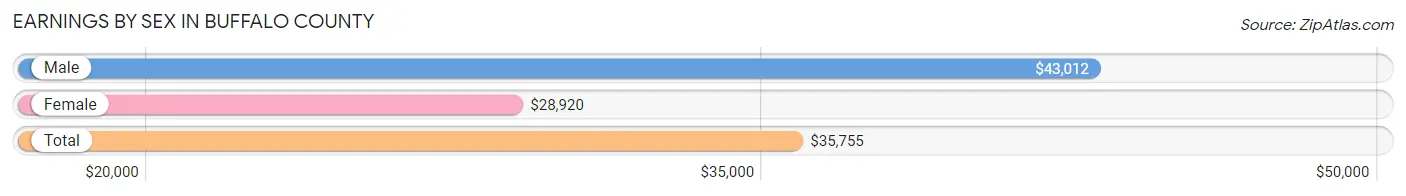
| Sex | Number | Average Earnings |
| Male | 15,985 (52.8%) | $43,012 |
| Female | 14,308 (47.2%) | $28,920 |
| Total | 30,293 (100.0%) | $35,755 |
Earnings by Sex by Income Bracket in Buffalo County
The most common earnings brackets in Buffalo County are $100,000+ for men (2,079 | 13.0%) and $2,499 or less for women (1,199 | 8.4%).
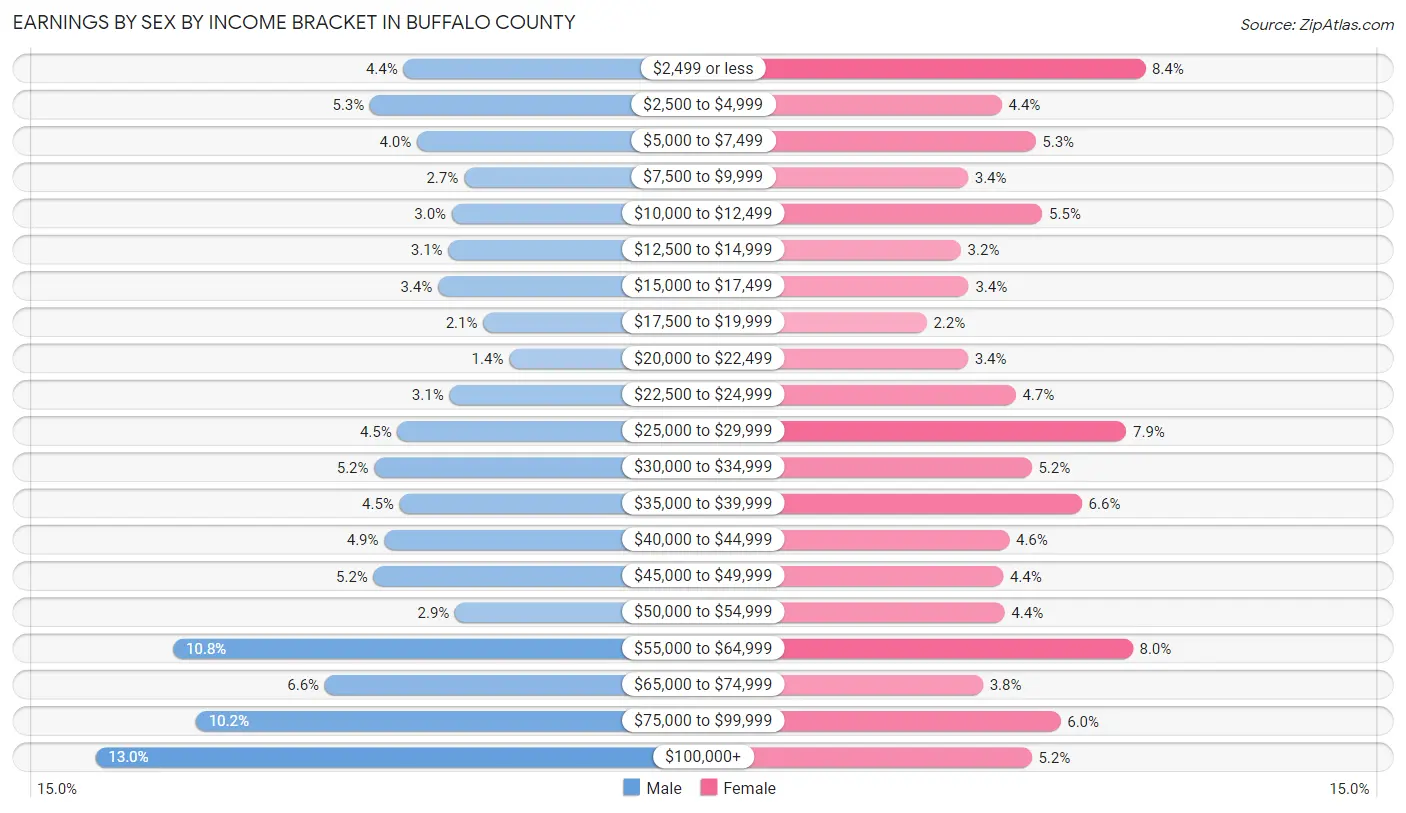
| Income | Male | Female |
| $2,499 or less | 695 (4.3%) | 1,199 (8.4%) |
| $2,500 to $4,999 | 845 (5.3%) | 623 (4.3%) |
| $5,000 to $7,499 | 635 (4.0%) | 759 (5.3%) |
| $7,500 to $9,999 | 424 (2.6%) | 486 (3.4%) |
| $10,000 to $12,499 | 478 (3.0%) | 785 (5.5%) |
| $12,500 to $14,999 | 494 (3.1%) | 458 (3.2%) |
| $15,000 to $17,499 | 541 (3.4%) | 489 (3.4%) |
| $17,500 to $19,999 | 338 (2.1%) | 321 (2.2%) |
| $20,000 to $22,499 | 220 (1.4%) | 487 (3.4%) |
| $22,500 to $24,999 | 489 (3.1%) | 678 (4.7%) |
| $25,000 to $29,999 | 723 (4.5%) | 1,123 (7.9%) |
| $30,000 to $34,999 | 827 (5.2%) | 743 (5.2%) |
| $35,000 to $39,999 | 713 (4.5%) | 945 (6.6%) |
| $40,000 to $44,999 | 782 (4.9%) | 653 (4.6%) |
| $45,000 to $49,999 | 829 (5.2%) | 628 (4.4%) |
| $50,000 to $54,999 | 464 (2.9%) | 634 (4.4%) |
| $55,000 to $64,999 | 1,731 (10.8%) | 1,149 (8.0%) |
| $65,000 to $74,999 | 1,049 (6.6%) | 547 (3.8%) |
| $75,000 to $99,999 | 1,629 (10.2%) | 858 (6.0%) |
| $100,000+ | 2,079 (13.0%) | 743 (5.2%) |
| Total | 15,985 (100.0%) | 14,308 (100.0%) |
Earnings by Sex by Educational Attainment in Buffalo County
Average earnings in Buffalo County are $57,700 for men and $39,215 for women, a difference of 32.0%. Men with an educational attainment of graduate degree enjoy the highest average annual earnings of $105,333, while those with high school diploma education earn the least with $41,558. Women with an educational attainment of graduate degree earn the most with the average annual earnings of $72,059, while those with less than high school education have the smallest earnings of $24,911.
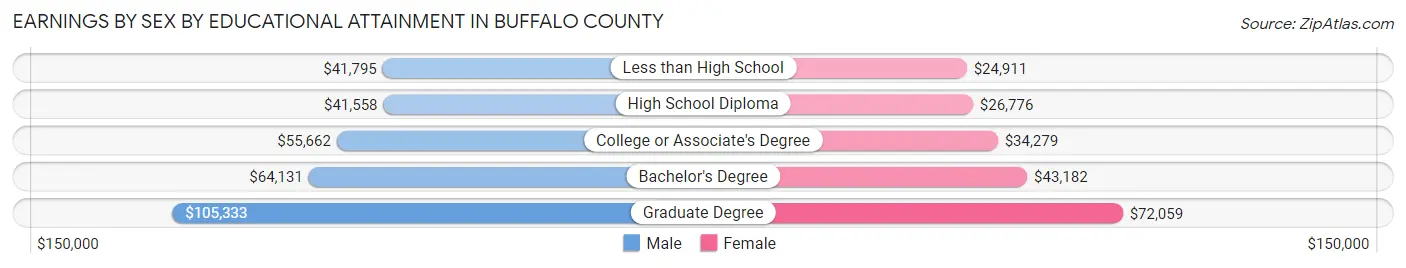
| Educational Attainment | Male Income | Female Income |
| Less than High School | $41,795 | $24,911 |
| High School Diploma | $41,558 | $26,776 |
| College or Associate's Degree | $55,662 | $34,279 |
| Bachelor's Degree | $64,131 | $43,182 |
| Graduate Degree | $105,333 | $72,059 |
| Total | $57,700 | $39,215 |
Family Income in Buffalo County
Family Income Brackets in Buffalo County
According to the Buffalo County family income data, there are 2,914 families falling into the $100,000 to $149,999 income range, which is the most common income bracket and makes up 24.3% of all families. Conversely, the $10,000 to $14,999 income bracket is the least frequent group with only 60 families (0.5%) belonging to this category.
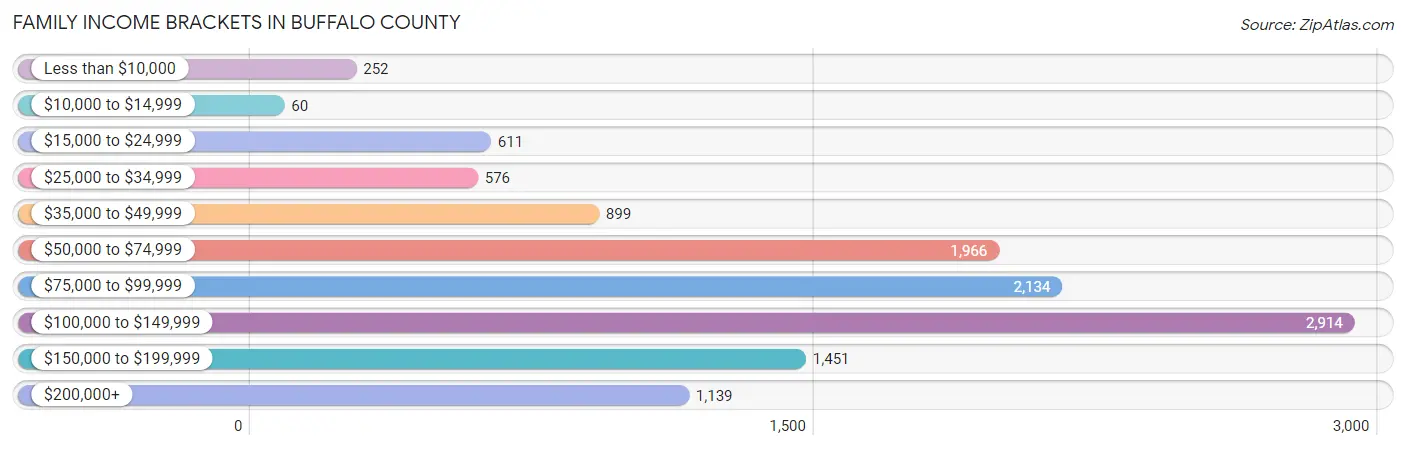
| Income Bracket | # Families | % Families |
| Less than $10,000 | 252 | 2.1% |
| $10,000 to $14,999 | 60 | 0.5% |
| $15,000 to $24,999 | 611 | 5.1% |
| $25,000 to $34,999 | 576 | 4.8% |
| $35,000 to $49,999 | 899 | 7.5% |
| $50,000 to $74,999 | 1,966 | 16.4% |
| $75,000 to $99,999 | 2,134 | 17.8% |
| $100,000 to $149,999 | 2,914 | 24.3% |
| $150,000 to $199,999 | 1,451 | 12.1% |
| $200,000+ | 1,139 | 9.5% |
Family Income by Famaliy Size in Buffalo County
6-person families (209 | 1.7%) account for the highest median family income in Buffalo County with $118,594 per family, while 2-person families (6,170 | 51.5%) have the highest median income of $43,370 per family member.
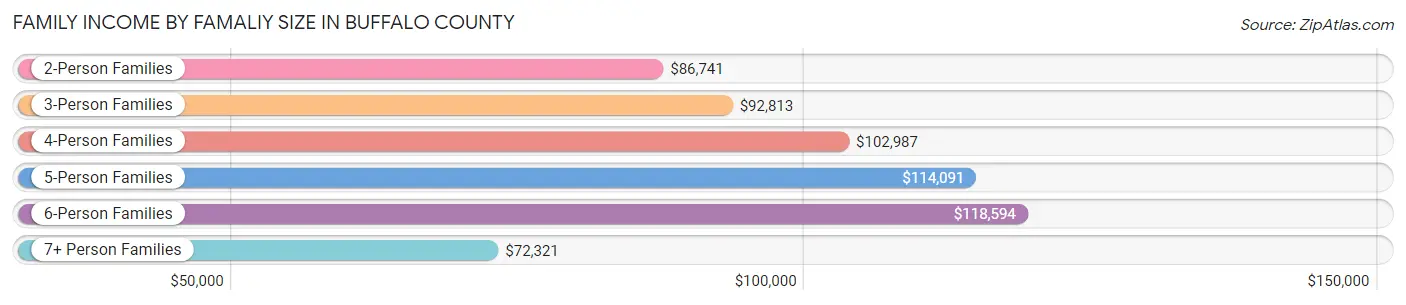
| Income Bracket | # Families | Median Income |
| 2-Person Families | 6,170 (51.5%) | $86,741 |
| 3-Person Families | 2,441 (20.4%) | $92,813 |
| 4-Person Families | 2,067 (17.2%) | $102,987 |
| 5-Person Families | 952 (7.9%) | $114,091 |
| 6-Person Families | 209 (1.7%) | $118,594 |
| 7+ Person Families | 151 (1.3%) | $72,321 |
| Total | 11,990 (100.0%) | $93,464 |
Family Income by Number of Earners in Buffalo County
The median family income in Buffalo County is $93,464, with families comprising 3+ earners (1,304) having the highest median family income of $118,913, while families with no earners (1,468) have the lowest median family income of $62,900, accounting for 10.9% and 12.2% of families, respectively.
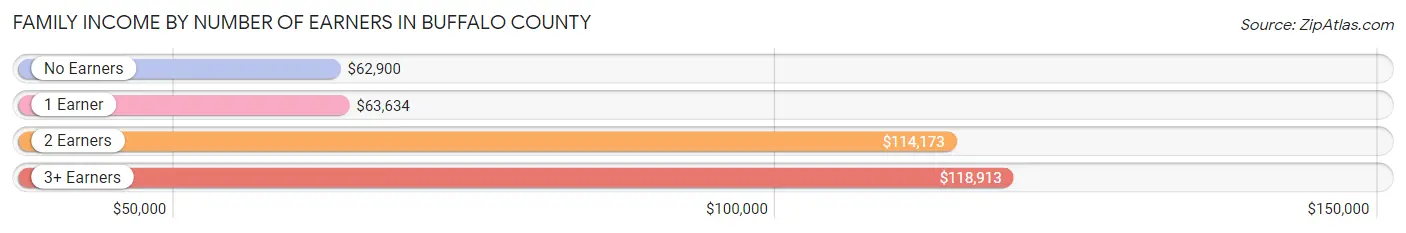
| Number of Earners | # Families | Median Income |
| No Earners | 1,468 (12.2%) | $62,900 |
| 1 Earner | 3,313 (27.6%) | $63,634 |
| 2 Earners | 5,905 (49.2%) | $114,173 |
| 3+ Earners | 1,304 (10.9%) | $118,913 |
| Total | 11,990 (100.0%) | $93,464 |
Household Income in Buffalo County
Household Income Brackets in Buffalo County
With 3,381 households falling in the category, the $100,000 to $149,999 income range is the most frequent in Buffalo County, accounting for 17.3% of all households. In contrast, only 528 households (2.7%) fall into the $10,000 to $14,999 income bracket, making it the least populous group.
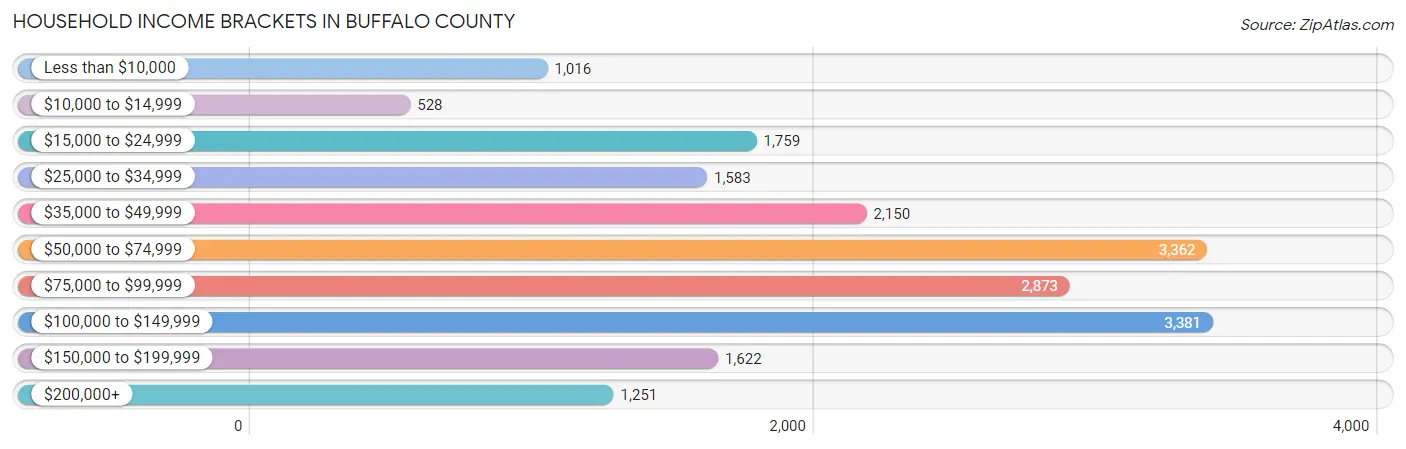
| Income Bracket | # Households | % Households |
| Less than $10,000 | 1,016 | 5.2% |
| $10,000 to $14,999 | 528 | 2.7% |
| $15,000 to $24,999 | 1,759 | 9.0% |
| $25,000 to $34,999 | 1,583 | 8.1% |
| $35,000 to $49,999 | 2,150 | 11.0% |
| $50,000 to $74,999 | 3,362 | 17.2% |
| $75,000 to $99,999 | 2,873 | 14.7% |
| $100,000 to $149,999 | 3,381 | 17.3% |
| $150,000 to $199,999 | 1,622 | 8.3% |
| $200,000+ | 1,251 | 6.4% |
Household Income by Householder Age in Buffalo County
The median household income in Buffalo County is $70,093, with the highest median household income of $86,042 found in the 45 to 64 years age bracket for the primary householder. A total of 6,062 households (31.0%) fall into this category. Meanwhile, the 15 to 24 years age bracket for the primary householder has the lowest median household income of $39,914, with 1,899 households (9.7%) in this group.
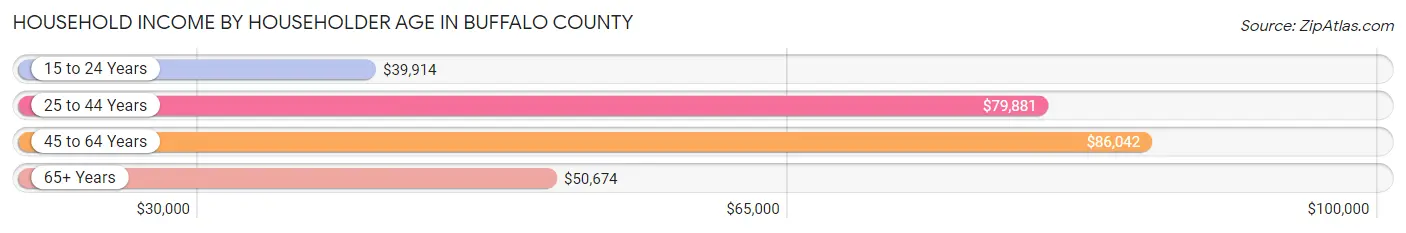
| Income Bracket | # Households | Median Income |
| 15 to 24 Years | 1,899 (9.7%) | $39,914 |
| 25 to 44 Years | 6,673 (34.1%) | $79,881 |
| 45 to 64 Years | 6,062 (31.0%) | $86,042 |
| 65+ Years | 4,910 (25.1%) | $50,674 |
| Total | 19,544 (100.0%) | $70,093 |
Poverty in Buffalo County
Income Below Poverty by Sex and Age in Buffalo County
With 10.1% poverty level for males and 13.6% for females among the residents of Buffalo County, 18 to 24 year old males and 18 to 24 year old females are the most vulnerable to poverty, with 859 males (26.3%) and 984 females (33.5%) in their respective age groups living below the poverty level.
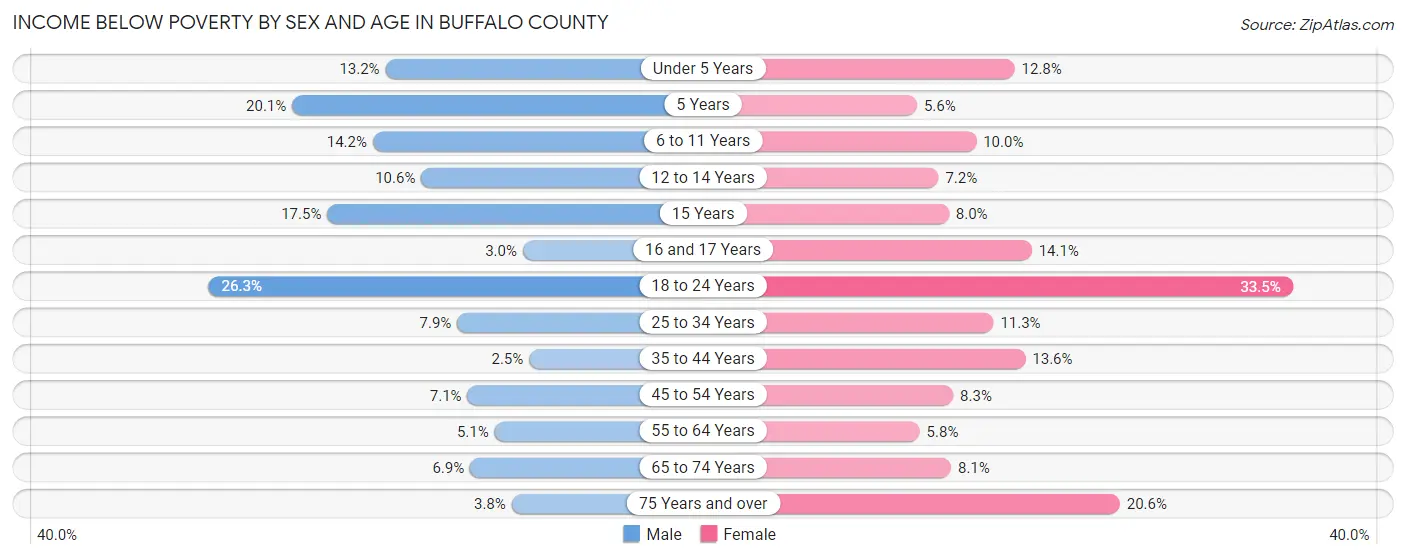
| Age Bracket | Male | Female |
| Under 5 Years | 208 (13.2%) | 187 (12.8%) |
| 5 Years | 57 (20.1%) | 14 (5.6%) |
| 6 to 11 Years | 287 (14.1%) | 183 (10.0%) |
| 12 to 14 Years | 98 (10.5%) | 73 (7.2%) |
| 15 Years | 44 (17.5%) | 26 (8.0%) |
| 16 and 17 Years | 23 (3.0%) | 77 (14.1%) |
| 18 to 24 Years | 859 (26.3%) | 984 (33.5%) |
| 25 to 34 Years | 254 (7.9%) | 348 (11.3%) |
| 35 to 44 Years | 83 (2.5%) | 396 (13.6%) |
| 45 to 54 Years | 187 (7.1%) | 202 (8.3%) |
| 55 to 64 Years | 136 (5.1%) | 161 (5.8%) |
| 65 to 74 Years | 151 (6.9%) | 186 (8.1%) |
| 75 Years and over | 44 (3.8%) | 385 (20.6%) |
| Total | 2,431 (10.1%) | 3,222 (13.6%) |
Income Above Poverty by Sex and Age in Buffalo County
According to the poverty statistics in Buffalo County, males aged 35 to 44 years and females aged 5 years are the age groups that are most secure financially, with 97.5% of males and 94.4% of females in these age groups living above the poverty line.
| Age Bracket | Male | Female |
| Under 5 Years | 1,366 (86.8%) | 1,271 (87.2%) |
| 5 Years | 226 (79.9%) | 237 (94.4%) |
| 6 to 11 Years | 1,741 (85.9%) | 1,650 (90.0%) |
| 12 to 14 Years | 831 (89.4%) | 944 (92.8%) |
| 15 Years | 207 (82.5%) | 301 (92.0%) |
| 16 and 17 Years | 742 (97.0%) | 469 (85.9%) |
| 18 to 24 Years | 2,404 (73.7%) | 1,957 (66.5%) |
| 25 to 34 Years | 2,970 (92.1%) | 2,742 (88.7%) |
| 35 to 44 Years | 3,189 (97.5%) | 2,510 (86.4%) |
| 45 to 54 Years | 2,438 (92.9%) | 2,241 (91.7%) |
| 55 to 64 Years | 2,524 (94.9%) | 2,624 (94.2%) |
| 65 to 74 Years | 2,027 (93.1%) | 2,107 (91.9%) |
| 75 Years and over | 1,101 (96.2%) | 1,480 (79.4%) |
| Total | 21,766 (89.9%) | 20,533 (86.4%) |
Income Below Poverty Among Married-Couple Families in Buffalo County
The poverty statistics for married-couple families in Buffalo County show that 2.2% or 203 of the total 9,294 families live below the poverty line. Families with 5 or more children have the highest poverty rate of 6.4%, comprising of 8 families. On the other hand, families with no children have the lowest poverty rate of 1.8%, which includes 103 families.
| Children | Above Poverty | Below Poverty |
| No Children | 5,533 (98.2%) | 103 (1.8%) |
| 1 or 2 Children | 2,587 (97.2%) | 76 (2.9%) |
| 3 or 4 Children | 854 (98.2%) | 16 (1.8%) |
| 5 or more Children | 117 (93.6%) | 8 (6.4%) |
| Total | 9,091 (97.8%) | 203 (2.2%) |
Income Below Poverty Among Single-Parent Households in Buffalo County
According to the poverty data in Buffalo County, 10.9% or 77 single-father households and 26.6% or 528 single-mother households are living below the poverty line. Among single-father households, those with 1 or 2 children have the highest poverty rate, with 48 households (14.8%) experiencing poverty. Likewise, among single-mother households, those with 5 or more children have the highest poverty rate, with 19 households (100.0%) falling below the poverty line.
| Children | Single Father | Single Mother |
| No Children | 29 (8.6%) | 52 (13.0%) |
| 1 or 2 Children | 48 (14.8%) | 242 (21.7%) |
| 3 or 4 Children | 0 (0.0%) | 215 (46.9%) |
| 5 or more Children | 0 (0.0%) | 19 (100.0%) |
| Total | 77 (10.9%) | 528 (26.6%) |
Income Below Poverty Among Married-Couple vs Single-Parent Households in Buffalo County
The poverty data for Buffalo County shows that 203 of the married-couple family households (2.2%) and 605 of the single-parent households (22.4%) are living below the poverty level. Within the married-couple family households, those with 5 or more children have the highest poverty rate, with 8 households (6.4%) falling below the poverty line. Among the single-parent households, those with 5 or more children have the highest poverty rate, with 19 household (100.0%) living below poverty.
| Children | Married-Couple Families | Single-Parent Households |
| No Children | 103 (1.8%) | 81 (11.0%) |
| 1 or 2 Children | 76 (2.9%) | 290 (20.2%) |
| 3 or 4 Children | 16 (1.8%) | 215 (42.7%) |
| 5 or more Children | 8 (6.4%) | 19 (100.0%) |
| Total | 203 (2.2%) | 605 (22.4%) |
Employment Characteristics in Buffalo County
Employment by Class of Employer in Buffalo County
Among the 27,193 employed individuals in Buffalo County, private company employees (17,824 | 65.5%), not-for-profit organizations (2,339 | 8.6%), and local government employees (1,995 | 7.3%) make up the most common classes of employment.
| Employer Class | # Employees | % Employees |
| Private Company Employees | 17,824 | 65.5% |
| Self-Employed (Incorporated) | 1,486 | 5.5% |
| Self-Employed (Not Incorporated) | 1,491 | 5.5% |
| Not-for-profit Organizations | 2,339 | 8.6% |
| Local Government Employees | 1,995 | 7.3% |
| State Government Employees | 1,464 | 5.4% |
| Federal Government Employees | 485 | 1.8% |
| Unpaid Family Workers | 109 | 0.4% |
| Total | 27,193 | 100.0% |
Employment Status by Age in Buffalo County
According to the labor force statistics for Buffalo County, out of the total population over 16 years of age (40,018), 71.0% or 28,413 individuals are in the labor force, with 2.9% or 824 of them unemployed. The age group with the highest labor force participation rate is 25 to 29 years, with 91.7% or 2,988 individuals in the labor force. Within the labor force, the 16 to 19 years age range has the highest percentage of unemployed individuals, with 10.2% or 209 of them being unemployed.
| Age Bracket | In Labor Force | Unemployed |
| 16 to 19 Years | 2,051 (56.4%) | 209 (10.2%) |
| 20 to 24 Years | 4,700 (87.8%) | 108 (2.3%) |
| 25 to 29 Years | 2,988 (91.7%) | 99 (3.3%) |
| 30 to 34 Years | 2,852 (91.5%) | 77 (2.7%) |
| 35 to 44 Years | 5,596 (90.0%) | 129 (2.3%) |
| 45 to 54 Years | 4,358 (85.0%) | 48 (1.1%) |
| 55 to 59 Years | 2,156 (81.4%) | 28 (1.3%) |
| 60 to 64 Years | 2,036 (72.1%) | 63 (3.1%) |
| 65 to 74 Years | 1,349 (29.9%) | 53 (3.9%) |
| 75 Years and over | 306 (9.2%) | 0 (0.0%) |
| Total | 28,413 (71.0%) | 824 (2.9%) |
Employment Status by Educational Attainment in Buffalo County
According to labor force statistics for Buffalo County, 86.2% of individuals (19,992) out of the total population between 25 and 64 years of age (23,193) are in the labor force, with 2.2% or 440 of them being unemployed. The group with the highest labor force participation rate are those with the educational attainment of bachelor's degree or higher, with 92.1% or 8,003 individuals in the labor force. Within the labor force, individuals with less than high school education have the highest percentage of unemployment, with 6.0% or 62 of them being unemployed.
| Educational Attainment | In Labor Force | Unemployed |
| Less than High School | 1,038 (64.3%) | 97 (6.0%) |
| High School Diploma | 4,148 (80.8%) | 205 (4.0%) |
| College / Associate Degree | 6,801 (87.7%) | 132 (1.7%) |
| Bachelor's Degree or higher | 8,003 (92.1%) | 104 (1.2%) |
| Total | 19,992 (86.2%) | 510 (2.2%) |
Employment Occupations by Sex in Buffalo County
Management, Business, Science and Arts Occupations
The most common Management, Business, Science and Arts occupations in Buffalo County are Management (2,876 | 10.5%), Community & Social Service (2,667 | 9.7%), Health Diagnosing & Treating (1,959 | 7.1%), Education Instruction & Library (1,696 | 6.2%), and Computers, Engineering & Science (1,352 | 4.9%).
Management, Business, Science and Arts Occupations by Sex
Within the Management, Business, Science and Arts occupations in Buffalo County, the most male-oriented occupations are Architecture & Engineering (94.6%), Computers & Mathematics (87.9%), and Computers, Engineering & Science (84.9%), while the most female-oriented occupations are Education Instruction & Library (80.2%), Health Diagnosing & Treating (74.0%), and Health Technologists (73.9%).
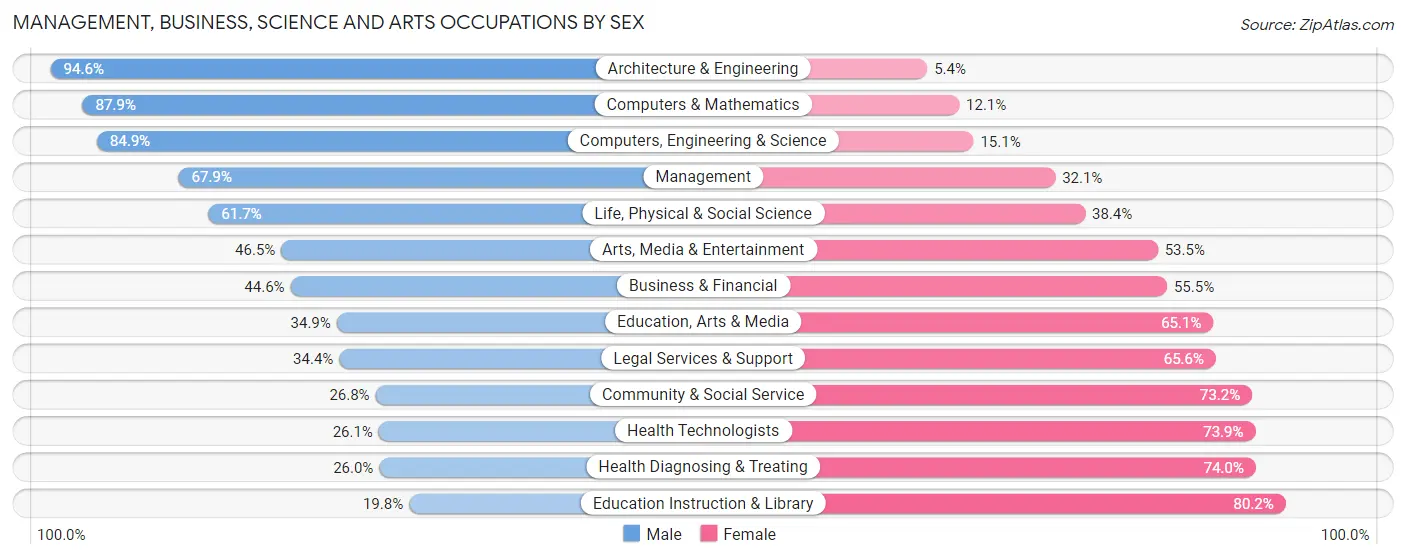
| Occupation | Male | Female |
| Management | 1,952 (67.9%) | 924 (32.1%) |
| Business & Financial | 380 (44.6%) | 473 (55.4%) |
| Computers, Engineering & Science | 1,148 (84.9%) | 204 (15.1%) |
| Computers & Mathematics | 567 (87.9%) | 78 (12.1%) |
| Architecture & Engineering | 417 (94.6%) | 24 (5.4%) |
| Life, Physical & Social Science | 164 (61.7%) | 102 (38.4%) |
| Community & Social Service | 715 (26.8%) | 1,952 (73.2%) |
| Education, Arts & Media | 148 (34.9%) | 276 (65.1%) |
| Legal Services & Support | 66 (34.4%) | 126 (65.6%) |
| Education Instruction & Library | 336 (19.8%) | 1,360 (80.2%) |
| Arts, Media & Entertainment | 165 (46.5%) | 190 (53.5%) |
| Health Diagnosing & Treating | 510 (26.0%) | 1,449 (74.0%) |
| Health Technologists | 347 (26.1%) | 981 (73.9%) |
| Total (Category) | 4,705 (48.5%) | 5,002 (51.5%) |
| Total (Overall) | 14,421 (52.4%) | 13,080 (47.6%) |
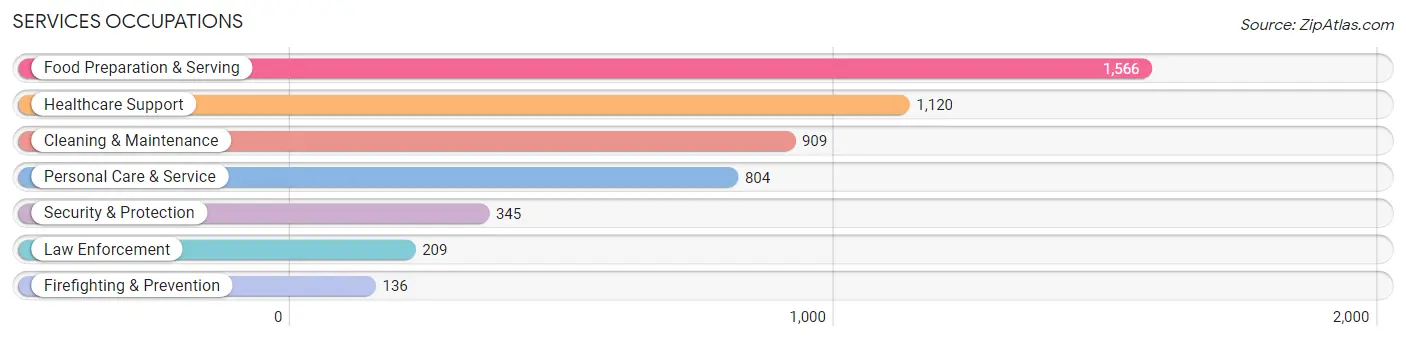
Services Occupations
The most common Services occupations in Buffalo County are Food Preparation & Serving (1,566 | 5.7%), Healthcare Support (1,120 | 4.1%), Cleaning & Maintenance (909 | 3.3%), Personal Care & Service (804 | 2.9%), and Security & Protection (345 | 1.3%).
Services Occupations by Sex
Within the Services occupations in Buffalo County, the most male-oriented occupations are Law Enforcement (80.9%), Security & Protection (74.8%), and Cleaning & Maintenance (65.8%), while the most female-oriented occupations are Healthcare Support (91.7%), Personal Care & Service (83.1%), and Food Preparation & Serving (56.3%).
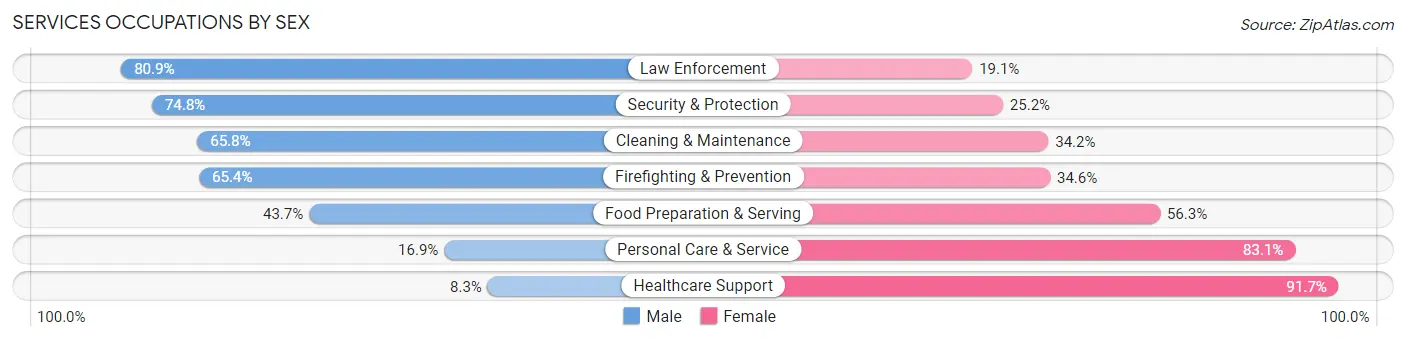
| Occupation | Male | Female |
| Healthcare Support | 93 (8.3%) | 1,027 (91.7%) |
| Security & Protection | 258 (74.8%) | 87 (25.2%) |
| Firefighting & Prevention | 89 (65.4%) | 47 (34.6%) |
| Law Enforcement | 169 (80.9%) | 40 (19.1%) |
| Food Preparation & Serving | 684 (43.7%) | 882 (56.3%) |
| Cleaning & Maintenance | 598 (65.8%) | 311 (34.2%) |
| Personal Care & Service | 136 (16.9%) | 668 (83.1%) |
| Total (Category) | 1,769 (37.3%) | 2,975 (62.7%) |
| Total (Overall) | 14,421 (52.4%) | 13,080 (47.6%) |
Sales and Office Occupations
The most common Sales and Office occupations in Buffalo County are Sales & Related (3,465 | 12.6%), and Office & Administration (2,886 | 10.5%).

Sales and Office Occupations by Sex
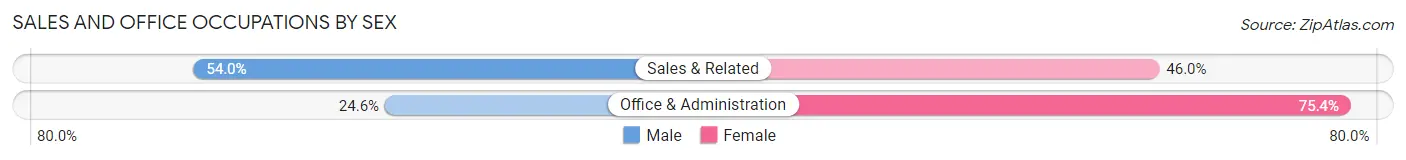
| Occupation | Male | Female |
| Sales & Related | 1,872 (54.0%) | 1,593 (46.0%) |
| Office & Administration | 709 (24.6%) | 2,177 (75.4%) |
| Total (Category) | 2,581 (40.6%) | 3,770 (59.4%) |
| Total (Overall) | 14,421 (52.4%) | 13,080 (47.6%) |
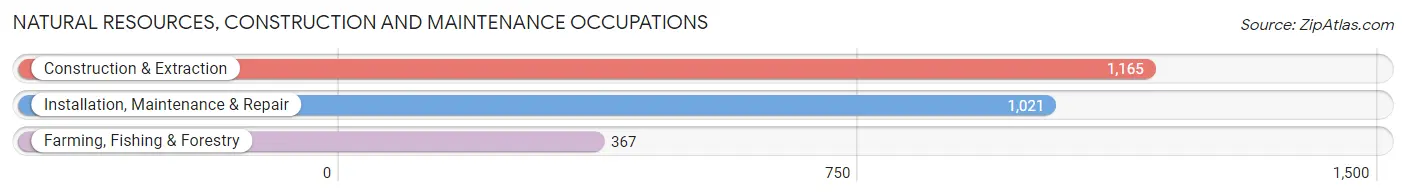
Natural Resources, Construction and Maintenance Occupations
The most common Natural Resources, Construction and Maintenance occupations in Buffalo County are Construction & Extraction (1,165 | 4.2%), Installation, Maintenance & Repair (1,021 | 3.7%), and Farming, Fishing & Forestry (367 | 1.3%).
Natural Resources, Construction and Maintenance Occupations by Sex
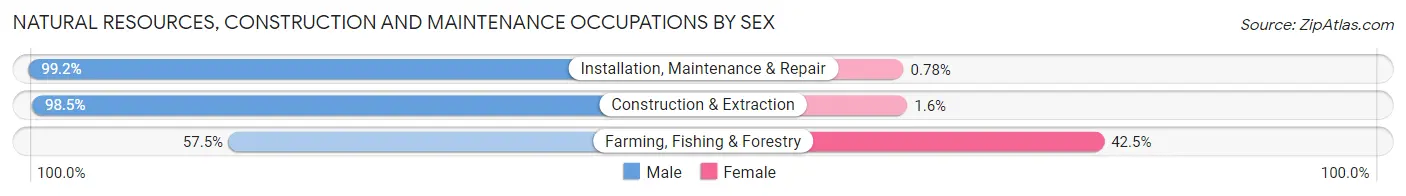
| Occupation | Male | Female |
| Farming, Fishing & Forestry | 211 (57.5%) | 156 (42.5%) |
| Construction & Extraction | 1,147 (98.5%) | 18 (1.5%) |
| Installation, Maintenance & Repair | 1,013 (99.2%) | 8 (0.8%) |
| Total (Category) | 2,371 (92.9%) | 182 (7.1%) |
| Total (Overall) | 14,421 (52.4%) | 13,080 (47.6%) |
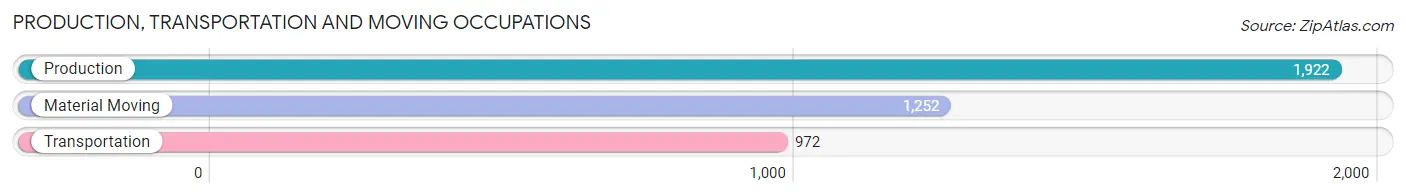
Production, Transportation and Moving Occupations
The most common Production, Transportation and Moving occupations in Buffalo County are Production (1,922 | 7.0%), Material Moving (1,252 | 4.5%), and Transportation (972 | 3.5%).
Production, Transportation and Moving Occupations by Sex
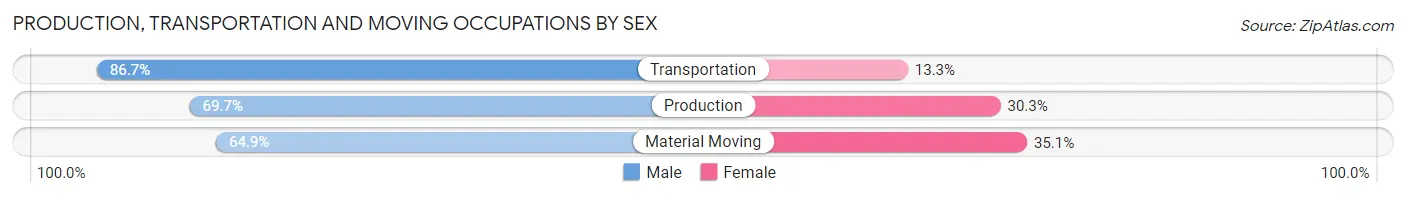
| Occupation | Male | Female |
| Production | 1,340 (69.7%) | 582 (30.3%) |
| Transportation | 843 (86.7%) | 129 (13.3%) |
| Material Moving | 812 (64.9%) | 440 (35.1%) |
| Total (Category) | 2,995 (72.2%) | 1,151 (27.8%) |
| Total (Overall) | 14,421 (52.4%) | 13,080 (47.6%) |
Employment Industries by Sex in Buffalo County
Employment Industries in Buffalo County
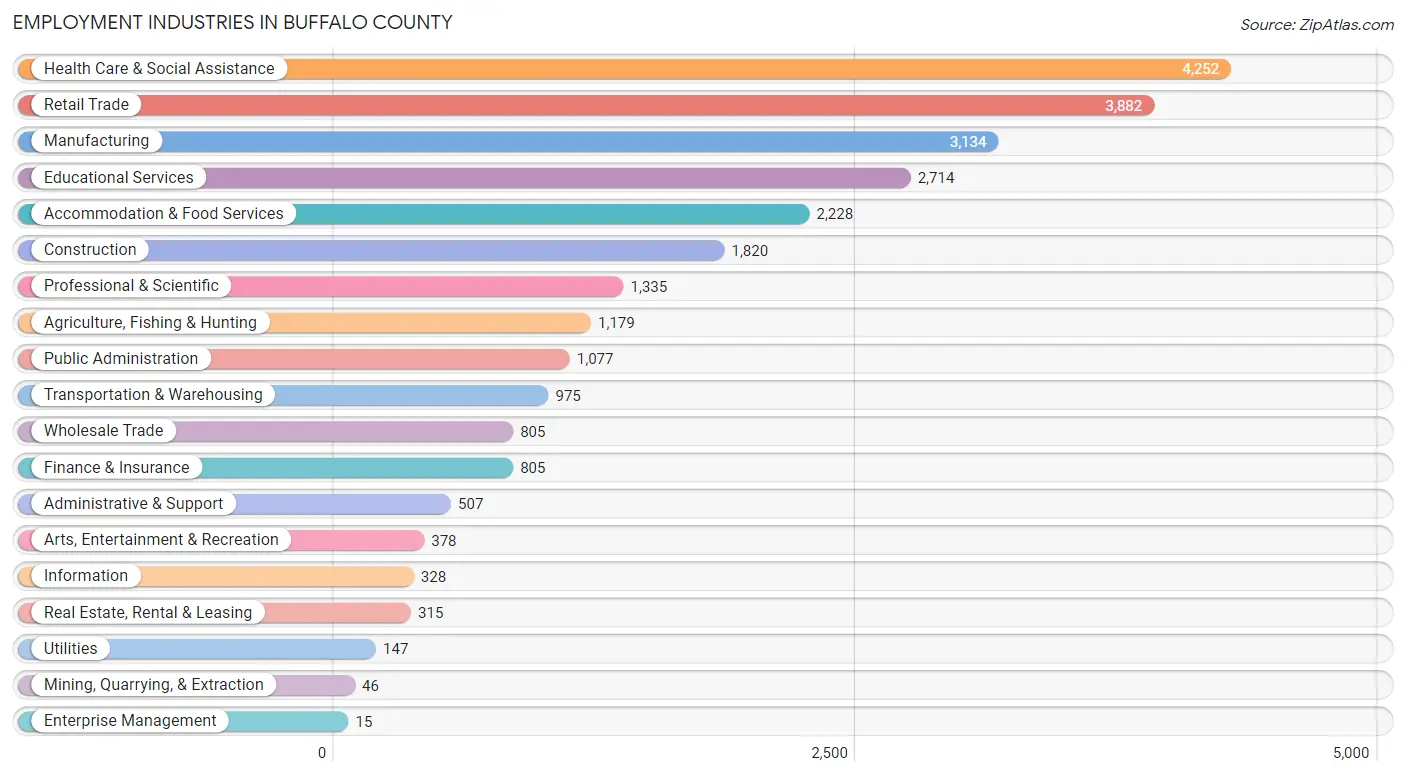
The major employment industries in Buffalo County include Health Care & Social Assistance (4,252 | 15.5%), Retail Trade (3,882 | 14.1%), Manufacturing (3,134 | 11.4%), Educational Services (2,714 | 9.9%), and Accommodation & Food Services (2,228 | 8.1%).
Employment Industries by Sex in Buffalo County
The Buffalo County industries that see more men than women are Mining, Quarrying, & Extraction (100.0%), Utilities (100.0%), and Construction (84.6%), whereas the industries that tend to have a higher number of women are Enterprise Management (100.0%), Health Care & Social Assistance (77.1%), and Arts, Entertainment & Recreation (70.9%).
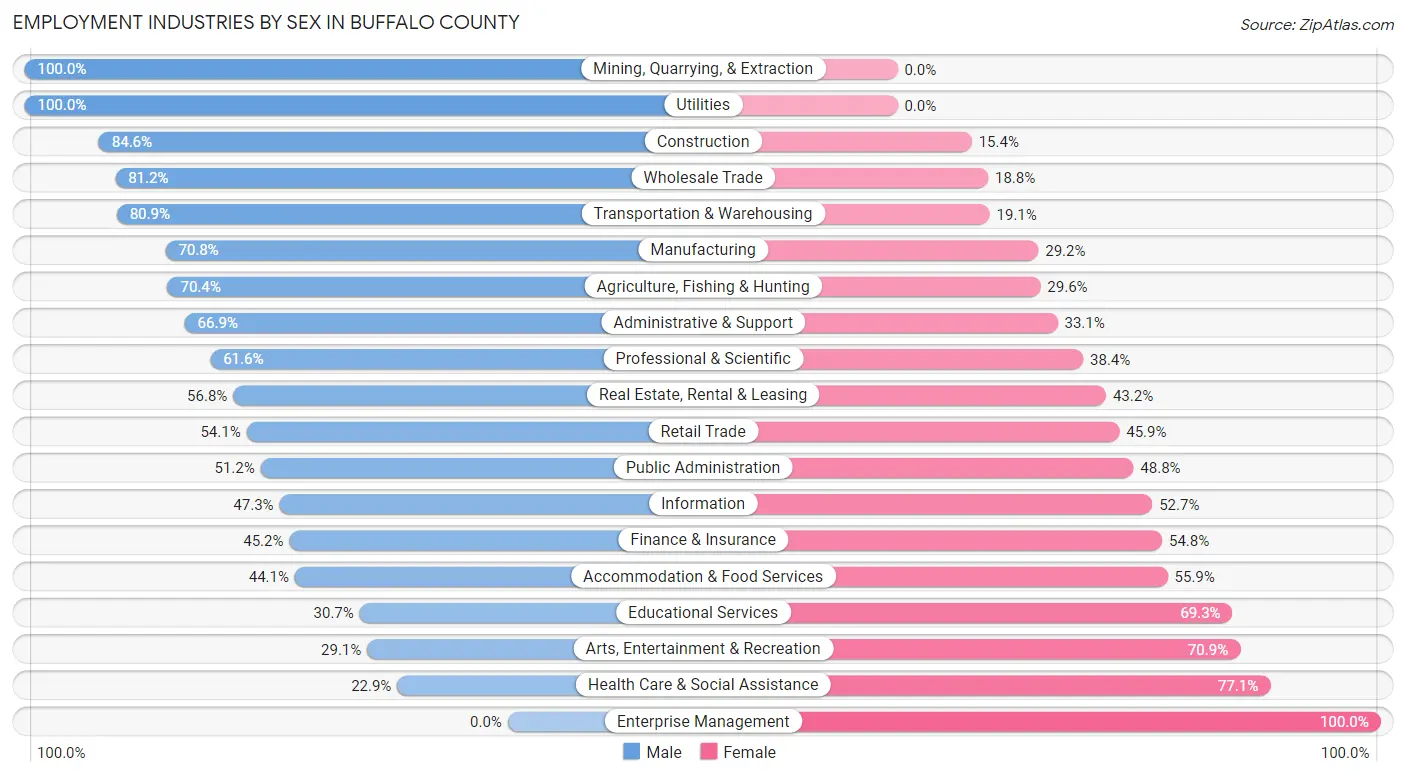
| Industry | Male | Female |
| Agriculture, Fishing & Hunting | 830 (70.4%) | 349 (29.6%) |
| Mining, Quarrying, & Extraction | 46 (100.0%) | 0 (0.0%) |
| Construction | 1,540 (84.6%) | 280 (15.4%) |
| Manufacturing | 2,220 (70.8%) | 914 (29.2%) |
| Wholesale Trade | 654 (81.2%) | 151 (18.8%) |
| Retail Trade | 2,099 (54.1%) | 1,783 (45.9%) |
| Transportation & Warehousing | 789 (80.9%) | 186 (19.1%) |
| Utilities | 147 (100.0%) | 0 (0.0%) |
| Information | 155 (47.3%) | 173 (52.7%) |
| Finance & Insurance | 364 (45.2%) | 441 (54.8%) |
| Real Estate, Rental & Leasing | 179 (56.8%) | 136 (43.2%) |
| Professional & Scientific | 822 (61.6%) | 513 (38.4%) |
| Enterprise Management | 0 (0.0%) | 15 (100.0%) |
| Administrative & Support | 339 (66.9%) | 168 (33.1%) |
| Educational Services | 832 (30.7%) | 1,882 (69.3%) |
| Health Care & Social Assistance | 973 (22.9%) | 3,279 (77.1%) |
| Arts, Entertainment & Recreation | 110 (29.1%) | 268 (70.9%) |
| Accommodation & Food Services | 982 (44.1%) | 1,246 (55.9%) |
| Public Administration | 551 (51.2%) | 526 (48.8%) |
| Total | 14,421 (52.4%) | 13,080 (47.6%) |
Education in Buffalo County
School Enrollment in Buffalo County
The most common levels of schooling among the 14,555 students in Buffalo County are college / undergraduate (4,969 | 34.1%), middle school (2,770 | 19.0%), and high school (2,560 | 17.6%).
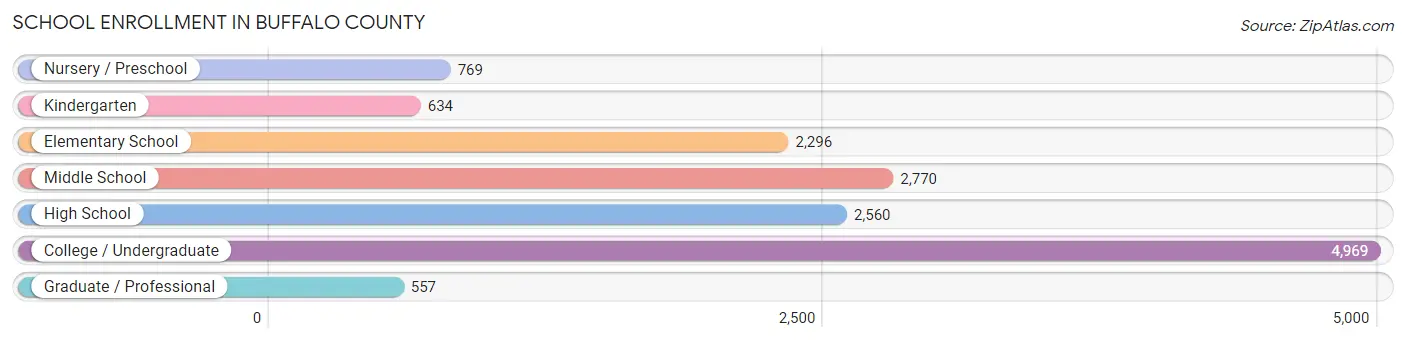
| School Level | # Students | % Students |
| Nursery / Preschool | 769 | 5.3% |
| Kindergarten | 634 | 4.4% |
| Elementary School | 2,296 | 15.8% |
| Middle School | 2,770 | 19.0% |
| High School | 2,560 | 17.6% |
| College / Undergraduate | 4,969 | 34.1% |
| Graduate / Professional | 557 | 3.8% |
| Total | 14,555 | 100.0% |
School Enrollment by Age by Funding Source in Buffalo County
Out of a total of 14,555 students who are enrolled in schools in Buffalo County, 1,325 (9.1%) attend a private institution, while the remaining 13,230 (90.9%) are enrolled in public schools. The age group of 3 to 4 year olds has the highest likelihood of being enrolled in private schools, with 141 (25.9% in the age bracket) enrolled. Conversely, the age group of 18 to 19 year olds has the lowest likelihood of being enrolled in a private school, with 1,804 (97.6% in the age bracket) attending a public institution.
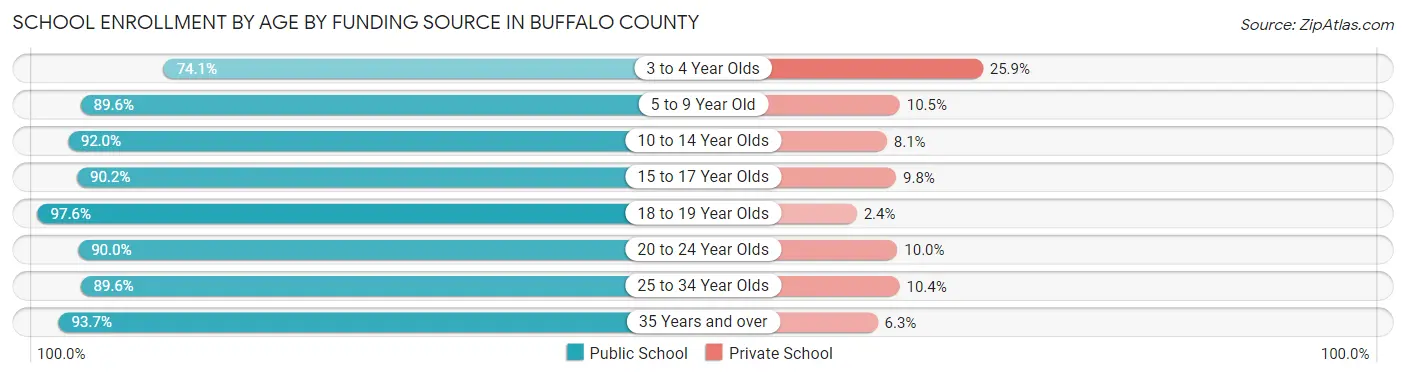
| Age Bracket | Public School | Private School |
| 3 to 4 Year Olds | 403 (74.1%) | 141 (25.9%) |
| 5 to 9 Year Old | 2,537 (89.5%) | 296 (10.4%) |
| 10 to 14 Year Olds | 3,039 (91.9%) | 266 (8.1%) |
| 15 to 17 Year Olds | 1,736 (90.2%) | 188 (9.8%) |
| 18 to 19 Year Olds | 1,804 (97.6%) | 45 (2.4%) |
| 20 to 24 Year Olds | 2,709 (90.0%) | 301 (10.0%) |
| 25 to 34 Year Olds | 551 (89.6%) | 64 (10.4%) |
| 35 Years and over | 445 (93.7%) | 30 (6.3%) |
| Total | 13,230 (90.9%) | 1,325 (9.1%) |
Educational Attainment by Field of Study in Buffalo County
Education (2,468 | 20.5%), business (2,305 | 19.1%), science & technology (1,349 | 11.2%), bio, nature & agricultural (1,156 | 9.6%), and arts & humanities (1,011 | 8.4%) are the most common fields of study among 12,057 individuals in Buffalo County who have obtained a bachelor's degree or higher.
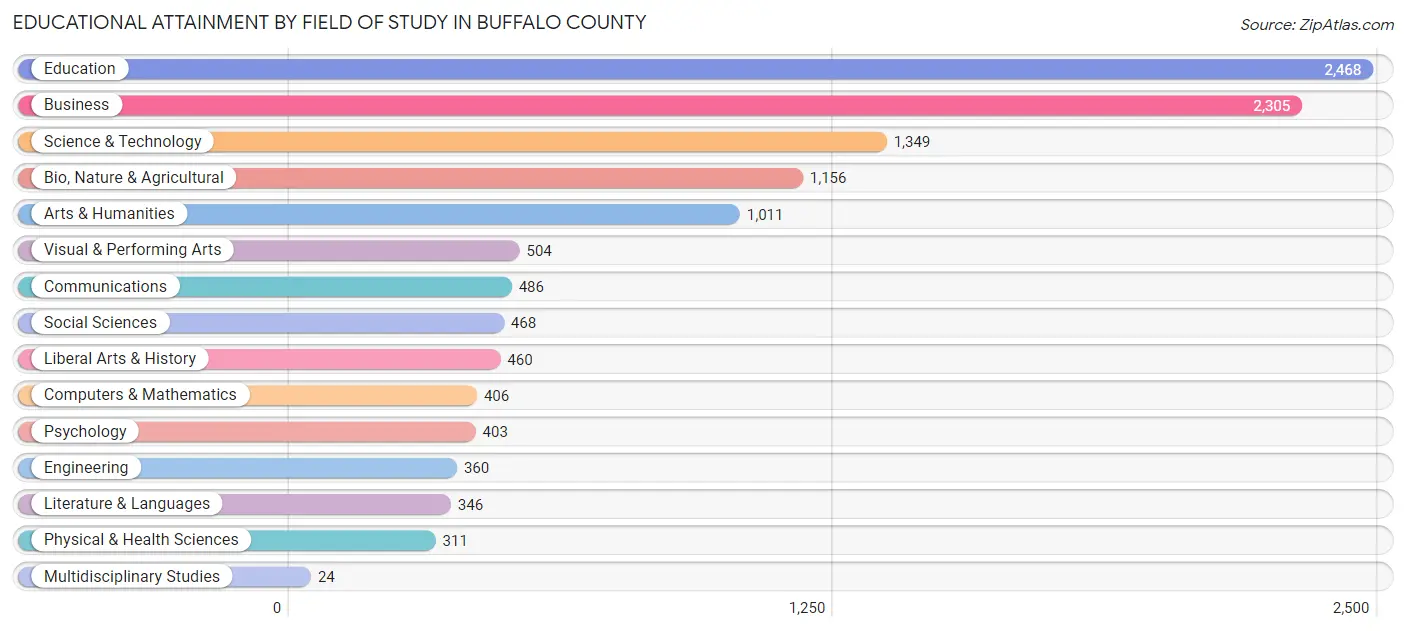
| Field of Study | # Graduates | % Graduates |
| Computers & Mathematics | 406 | 3.4% |
| Bio, Nature & Agricultural | 1,156 | 9.6% |
| Physical & Health Sciences | 311 | 2.6% |
| Psychology | 403 | 3.3% |
| Social Sciences | 468 | 3.9% |
| Engineering | 360 | 3.0% |
| Multidisciplinary Studies | 24 | 0.2% |
| Science & Technology | 1,349 | 11.2% |
| Business | 2,305 | 19.1% |
| Education | 2,468 | 20.5% |
| Literature & Languages | 346 | 2.9% |
| Liberal Arts & History | 460 | 3.8% |
| Visual & Performing Arts | 504 | 4.2% |
| Communications | 486 | 4.0% |
| Arts & Humanities | 1,011 | 8.4% |
| Total | 12,057 | 100.0% |
Transportation & Commute in Buffalo County
Vehicle Availability by Sex in Buffalo County
The most prevalent vehicle ownership categories in Buffalo County are males with 2 vehicles (5,455, accounting for 38.5%) and females with 2 vehicles (4,790, making up 44.4%).
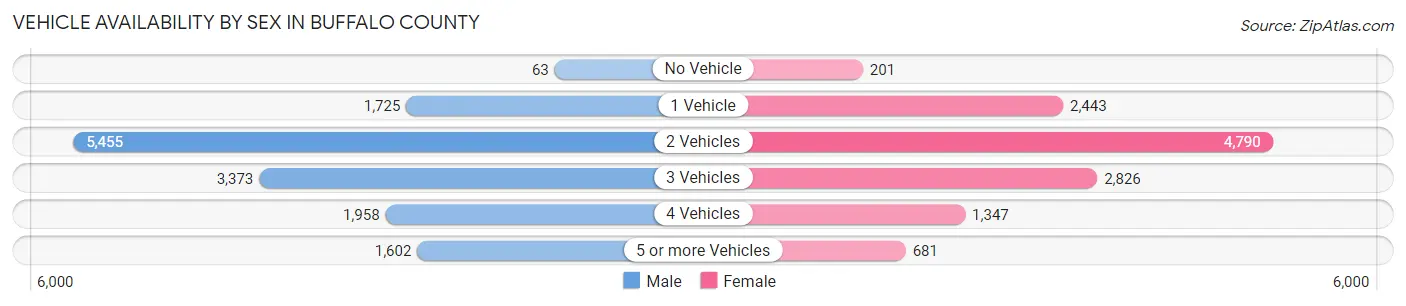
| Vehicles Available | Male | Female |
| No Vehicle | 63 (0.4%) | 201 (1.6%) |
| 1 Vehicle | 1,725 (12.2%) | 2,443 (19.9%) |
| 2 Vehicles | 5,455 (38.5%) | 4,790 (39.0%) |
| 3 Vehicles | 3,373 (23.8%) | 2,826 (23.0%) |
| 4 Vehicles | 1,958 (13.8%) | 1,347 (11.0%) |
| 5 or more Vehicles | 1,602 (11.3%) | 681 (5.5%) |
| Total | 14,176 (100.0%) | 12,288 (100.0%) |
Commute Time in Buffalo County
The most frequently occuring commute durations in Buffalo County are 10 to 14 minutes (7,796 commuters, 30.0%), 5 to 9 minutes (6,553 commuters, 25.2%), and 15 to 19 minutes (3,337 commuters, 12.8%).
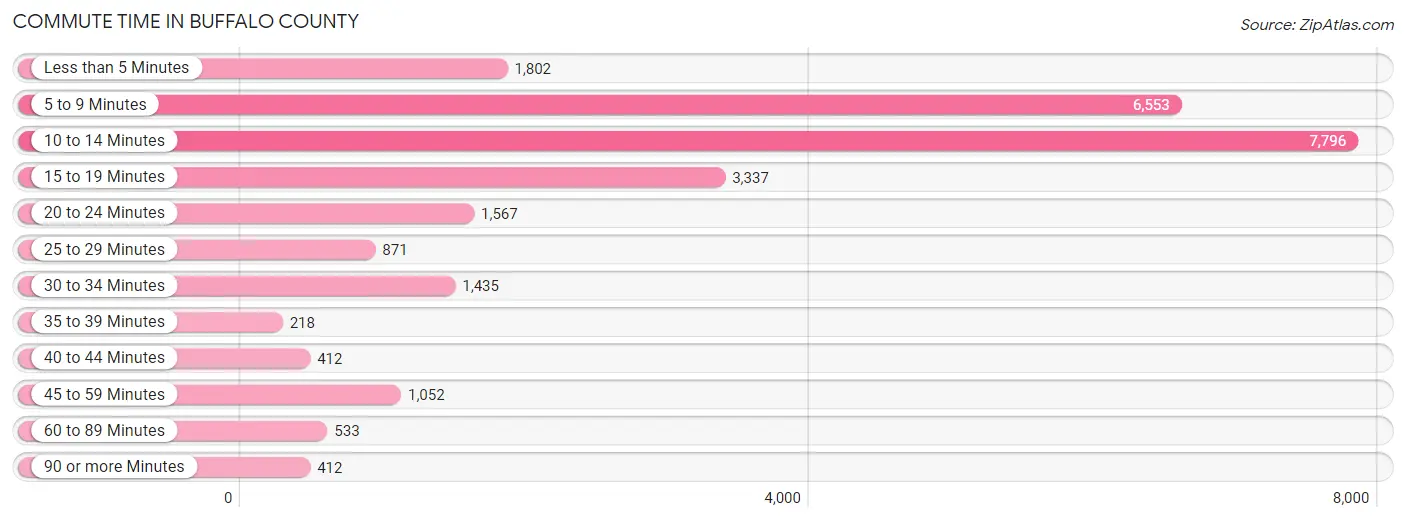
| Commute Time | # Commuters | % Commuters |
| Less than 5 Minutes | 1,802 | 6.9% |
| 5 to 9 Minutes | 6,553 | 25.2% |
| 10 to 14 Minutes | 7,796 | 30.0% |
| 15 to 19 Minutes | 3,337 | 12.8% |
| 20 to 24 Minutes | 1,567 | 6.0% |
| 25 to 29 Minutes | 871 | 3.4% |
| 30 to 34 Minutes | 1,435 | 5.5% |
| 35 to 39 Minutes | 218 | 0.8% |
| 40 to 44 Minutes | 412 | 1.6% |
| 45 to 59 Minutes | 1,052 | 4.1% |
| 60 to 89 Minutes | 533 | 2.1% |
| 90 or more Minutes | 412 | 1.6% |
Commute Time by Sex in Buffalo County
The most common commute times in Buffalo County are 10 to 14 minutes (3,997 commuters, 28.9%) for males and 10 to 14 minutes (3,799 commuters, 31.2%) for females.
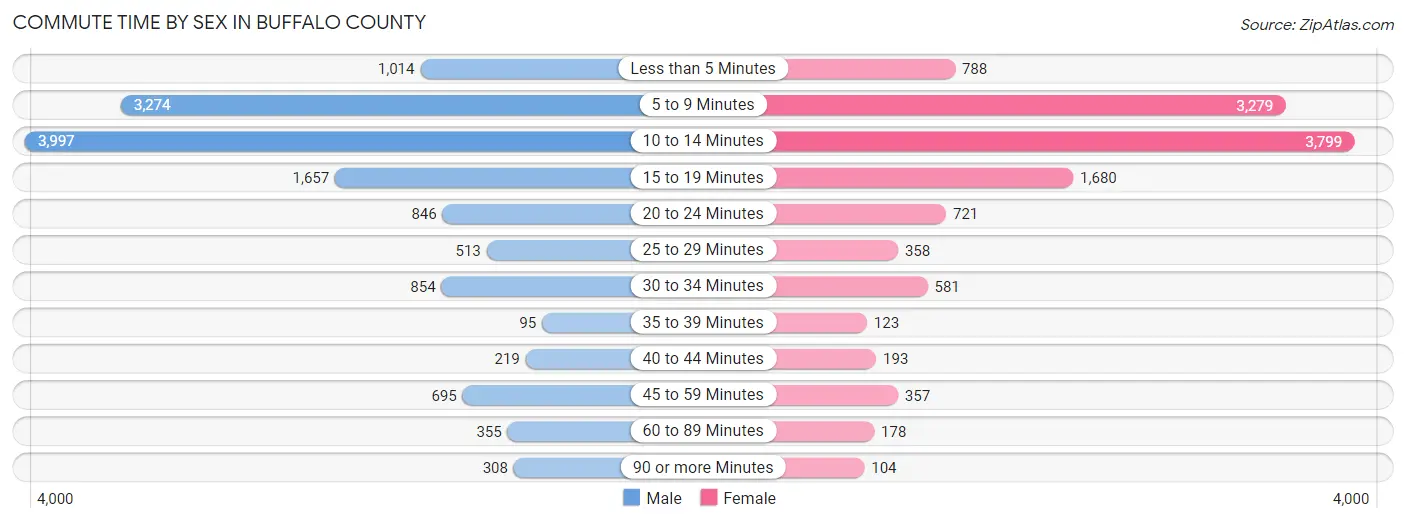
| Commute Time | Male | Female |
| Less than 5 Minutes | 1,014 (7.3%) | 788 (6.5%) |
| 5 to 9 Minutes | 3,274 (23.7%) | 3,279 (27.0%) |
| 10 to 14 Minutes | 3,997 (28.9%) | 3,799 (31.2%) |
| 15 to 19 Minutes | 1,657 (12.0%) | 1,680 (13.8%) |
| 20 to 24 Minutes | 846 (6.1%) | 721 (5.9%) |
| 25 to 29 Minutes | 513 (3.7%) | 358 (2.9%) |
| 30 to 34 Minutes | 854 (6.2%) | 581 (4.8%) |
| 35 to 39 Minutes | 95 (0.7%) | 123 (1.0%) |
| 40 to 44 Minutes | 219 (1.6%) | 193 (1.6%) |
| 45 to 59 Minutes | 695 (5.0%) | 357 (2.9%) |
| 60 to 89 Minutes | 355 (2.6%) | 178 (1.5%) |
| 90 or more Minutes | 308 (2.2%) | 104 (0.9%) |
Time of Departure to Work by Sex in Buffalo County
The most frequent times of departure to work in Buffalo County are 7:30 AM to 7:59 AM (2,482, 17.9%) for males and 7:30 AM to 7:59 AM (2,712, 22.3%) for females.
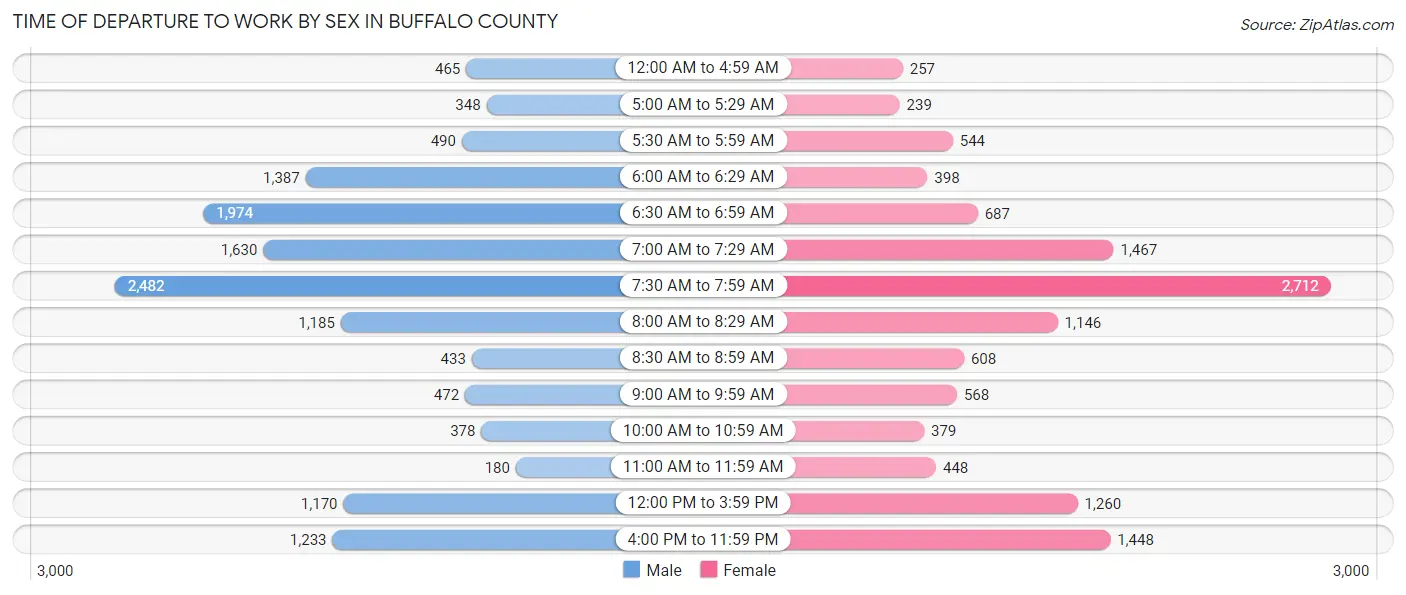
| Time of Departure | Male | Female |
| 12:00 AM to 4:59 AM | 465 (3.4%) | 257 (2.1%) |
| 5:00 AM to 5:29 AM | 348 (2.5%) | 239 (2.0%) |
| 5:30 AM to 5:59 AM | 490 (3.5%) | 544 (4.5%) |
| 6:00 AM to 6:29 AM | 1,387 (10.0%) | 398 (3.3%) |
| 6:30 AM to 6:59 AM | 1,974 (14.3%) | 687 (5.7%) |
| 7:00 AM to 7:29 AM | 1,630 (11.8%) | 1,467 (12.1%) |
| 7:30 AM to 7:59 AM | 2,482 (17.9%) | 2,712 (22.3%) |
| 8:00 AM to 8:29 AM | 1,185 (8.6%) | 1,146 (9.4%) |
| 8:30 AM to 8:59 AM | 433 (3.1%) | 608 (5.0%) |
| 9:00 AM to 9:59 AM | 472 (3.4%) | 568 (4.7%) |
| 10:00 AM to 10:59 AM | 378 (2.7%) | 379 (3.1%) |
| 11:00 AM to 11:59 AM | 180 (1.3%) | 448 (3.7%) |
| 12:00 PM to 3:59 PM | 1,170 (8.5%) | 1,260 (10.4%) |
| 4:00 PM to 11:59 PM | 1,233 (8.9%) | 1,448 (11.9%) |
| Total | 13,827 (100.0%) | 12,161 (100.0%) |
Housing Occupancy in Buffalo County
Occupancy by Ownership in Buffalo County
Of the total 19,544 dwellings in Buffalo County, owner-occupied units account for 12,955 (66.3%), while renter-occupied units make up 6,589 (33.7%).
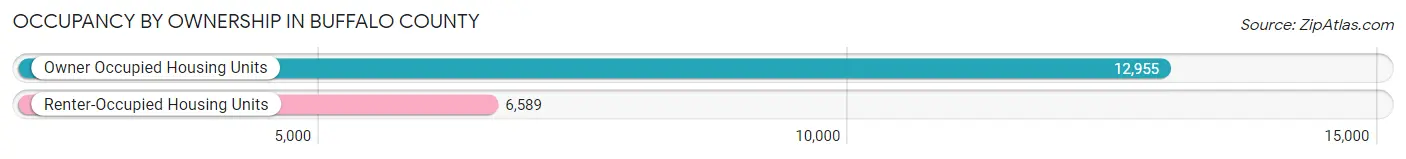
| Occupancy | # Housing Units | % Housing Units |
| Owner Occupied Housing Units | 12,955 | 66.3% |
| Renter-Occupied Housing Units | 6,589 | 33.7% |
| Total Occupied Housing Units | 19,544 | 100.0% |
Occupancy by Household Size in Buffalo County
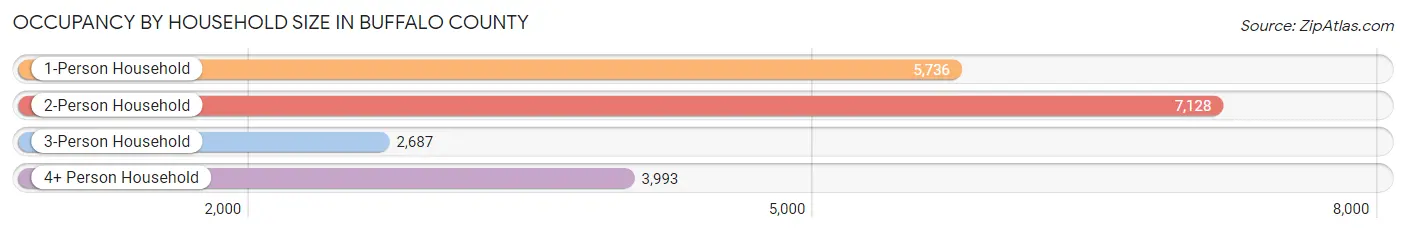
| Household Size | # Housing Units | % Housing Units |
| 1-Person Household | 5,736 | 29.3% |
| 2-Person Household | 7,128 | 36.5% |
| 3-Person Household | 2,687 | 13.8% |
| 4+ Person Household | 3,993 | 20.4% |
| Total Housing Units | 19,544 | 100.0% |
Occupancy by Ownership by Household Size in Buffalo County
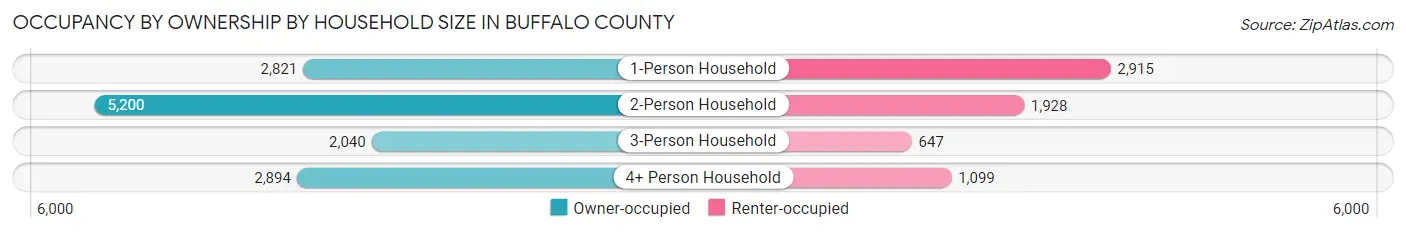
| Household Size | Owner-occupied | Renter-occupied |
| 1-Person Household | 2,821 (49.2%) | 2,915 (50.8%) |
| 2-Person Household | 5,200 (73.0%) | 1,928 (27.1%) |
| 3-Person Household | 2,040 (75.9%) | 647 (24.1%) |
| 4+ Person Household | 2,894 (72.5%) | 1,099 (27.5%) |
| Total Housing Units | 12,955 (66.3%) | 6,589 (33.7%) |
Occupancy by Educational Attainment in Buffalo County
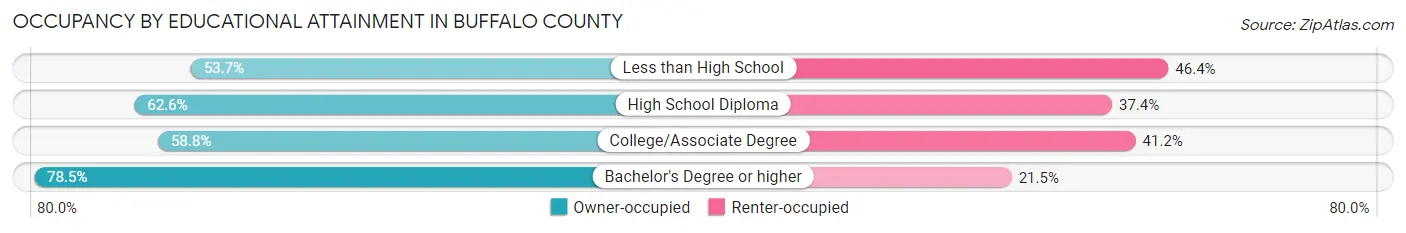
| Household Size | Owner-occupied | Renter-occupied |
| Less than High School | 677 (53.6%) | 585 (46.4%) |
| High School Diploma | 2,647 (62.6%) | 1,582 (37.4%) |
| College/Associate Degree | 4,193 (58.8%) | 2,933 (41.2%) |
| Bachelor's Degree or higher | 5,438 (78.5%) | 1,489 (21.5%) |
Occupancy by Age of Householder in Buffalo County
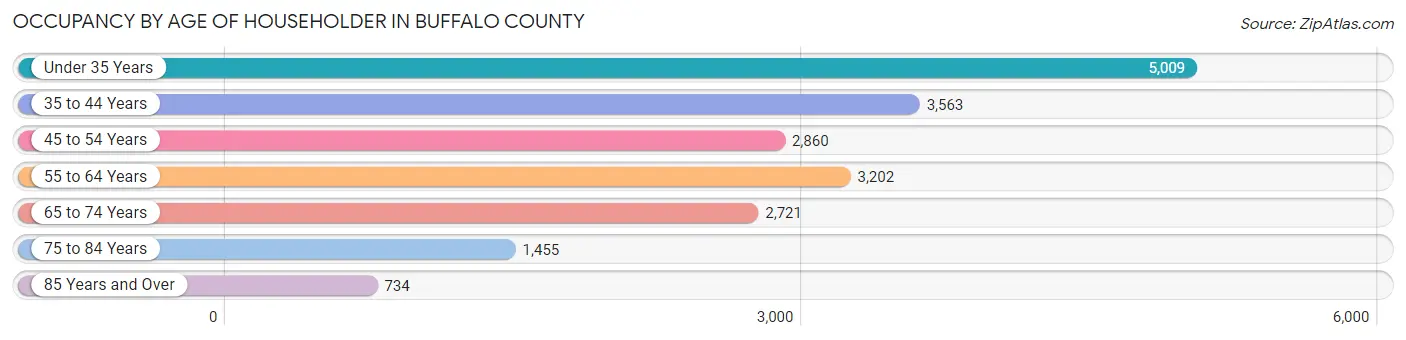
| Age Bracket | # Households | % Households |
| Under 35 Years | 5,009 | 25.6% |
| 35 to 44 Years | 3,563 | 18.2% |
| 45 to 54 Years | 2,860 | 14.6% |
| 55 to 64 Years | 3,202 | 16.4% |
| 65 to 74 Years | 2,721 | 13.9% |
| 75 to 84 Years | 1,455 | 7.4% |
| 85 Years and Over | 734 | 3.8% |
| Total | 19,544 | 100.0% |
Housing Finances in Buffalo County
Median Income by Occupancy in Buffalo County
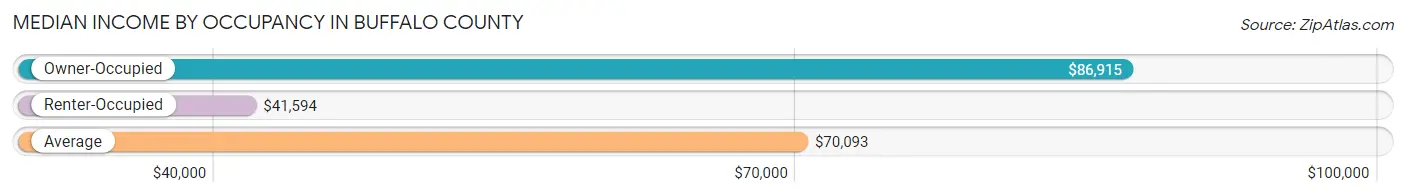
| Occupancy Type | # Households | Median Income |
| Owner-Occupied | 12,955 (66.3%) | $86,915 |
| Renter-Occupied | 6,589 (33.7%) | $41,594 |
| Average | 19,544 (100.0%) | $70,093 |
Occupancy by Householder Income Bracket in Buffalo County
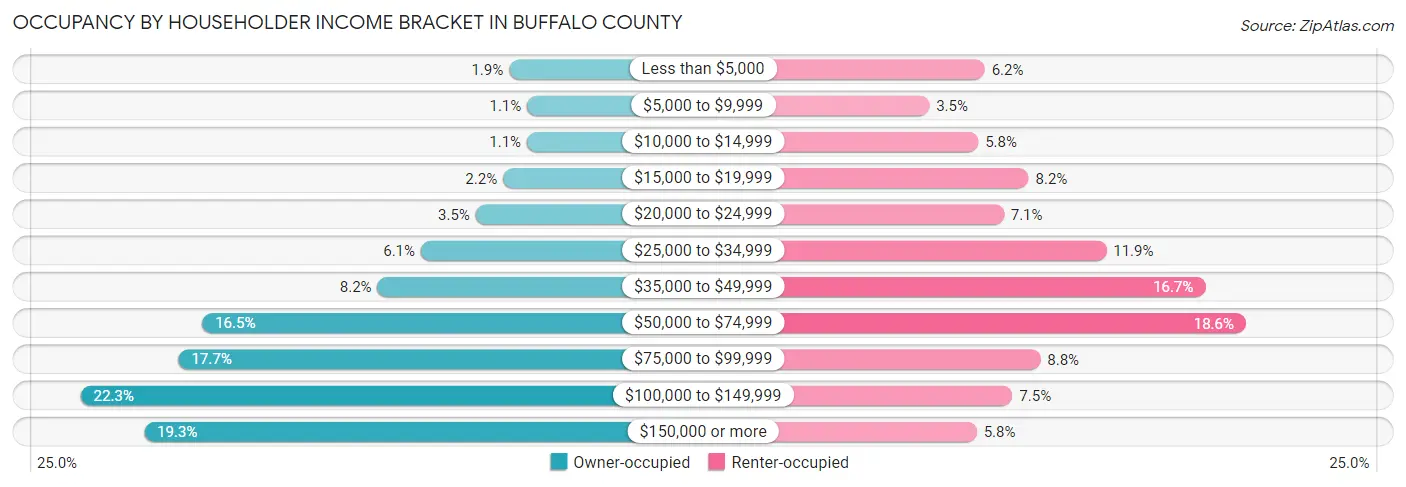
| Income Bracket | Owner-occupied | Renter-occupied |
| Less than $5,000 | 250 (1.9%) | 405 (6.1%) |
| $5,000 to $9,999 | 139 (1.1%) | 231 (3.5%) |
| $10,000 to $14,999 | 140 (1.1%) | 385 (5.8%) |
| $15,000 to $19,999 | 288 (2.2%) | 543 (8.2%) |
| $20,000 to $24,999 | 456 (3.5%) | 465 (7.1%) |
| $25,000 to $34,999 | 794 (6.1%) | 787 (11.9%) |
| $35,000 to $49,999 | 1,062 (8.2%) | 1,097 (16.7%) |
| $50,000 to $74,999 | 2,143 (16.5%) | 1,224 (18.6%) |
| $75,000 to $99,999 | 2,289 (17.7%) | 580 (8.8%) |
| $100,000 to $149,999 | 2,893 (22.3%) | 492 (7.5%) |
| $150,000 or more | 2,501 (19.3%) | 380 (5.8%) |
| Total | 12,955 (100.0%) | 6,589 (100.0%) |
Monthly Housing Cost Tiers in Buffalo County
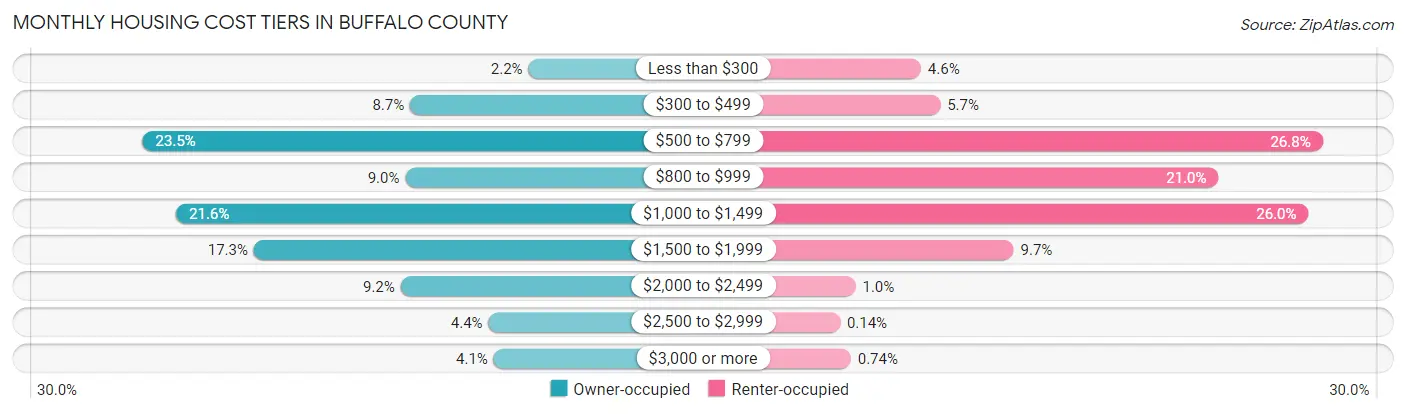
| Monthly Cost | Owner-occupied | Renter-occupied |
| Less than $300 | 281 (2.2%) | 304 (4.6%) |
| $300 to $499 | 1,128 (8.7%) | 374 (5.7%) |
| $500 to $799 | 3,043 (23.5%) | 1,765 (26.8%) |
| $800 to $999 | 1,162 (9.0%) | 1,386 (21.0%) |
| $1,000 to $1,499 | 2,802 (21.6%) | 1,714 (26.0%) |
| $1,500 to $1,999 | 2,246 (17.3%) | 641 (9.7%) |
| $2,000 to $2,499 | 1,196 (9.2%) | 66 (1.0%) |
| $2,500 to $2,999 | 567 (4.4%) | 9 (0.1%) |
| $3,000 or more | 530 (4.1%) | 49 (0.7%) |
| Total | 12,955 (100.0%) | 6,589 (100.0%) |
Physical Housing Characteristics in Buffalo County
Housing Structures in Buffalo County
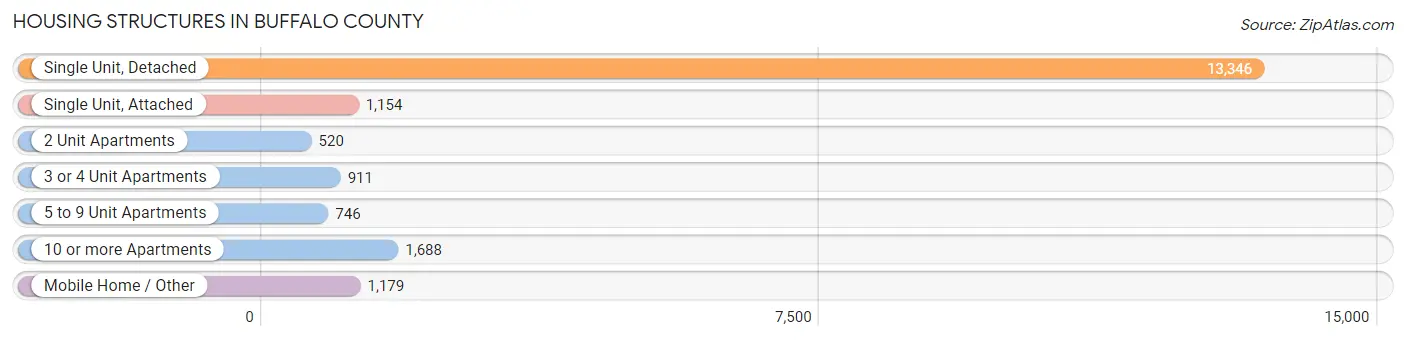
| Structure Type | # Housing Units | % Housing Units |
| Single Unit, Detached | 13,346 | 68.3% |
| Single Unit, Attached | 1,154 | 5.9% |
| 2 Unit Apartments | 520 | 2.7% |
| 3 or 4 Unit Apartments | 911 | 4.7% |
| 5 to 9 Unit Apartments | 746 | 3.8% |
| 10 or more Apartments | 1,688 | 8.6% |
| Mobile Home / Other | 1,179 | 6.0% |
| Total | 19,544 | 100.0% |
Housing Structures by Occupancy in Buffalo County
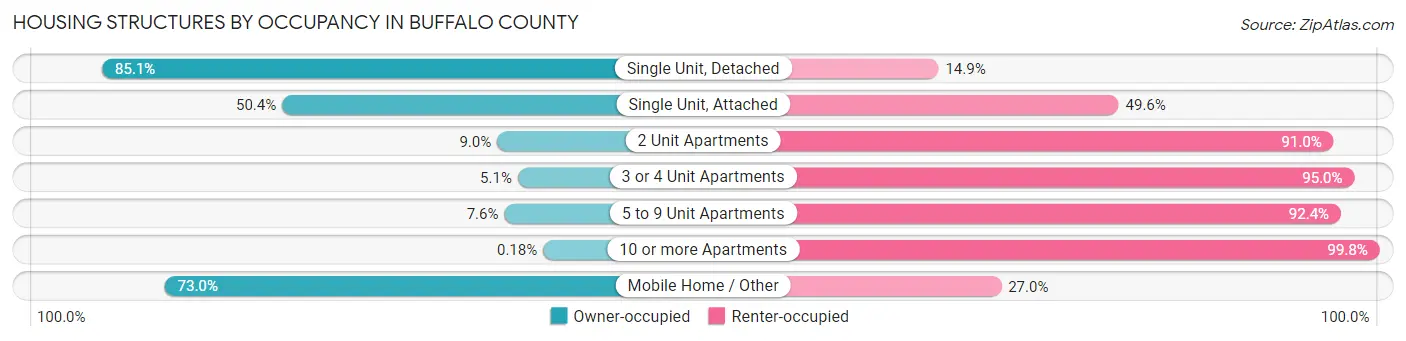
| Structure Type | Owner-occupied | Renter-occupied |
| Single Unit, Detached | 11,359 (85.1%) | 1,987 (14.9%) |
| Single Unit, Attached | 582 (50.4%) | 572 (49.6%) |
| 2 Unit Apartments | 47 (9.0%) | 473 (91.0%) |
| 3 or 4 Unit Apartments | 46 (5.1%) | 865 (95.0%) |
| 5 to 9 Unit Apartments | 57 (7.6%) | 689 (92.4%) |
| 10 or more Apartments | 3 (0.2%) | 1,685 (99.8%) |
| Mobile Home / Other | 861 (73.0%) | 318 (27.0%) |
| Total | 12,955 (66.3%) | 6,589 (33.7%) |
Housing Structures by Number of Rooms in Buffalo County
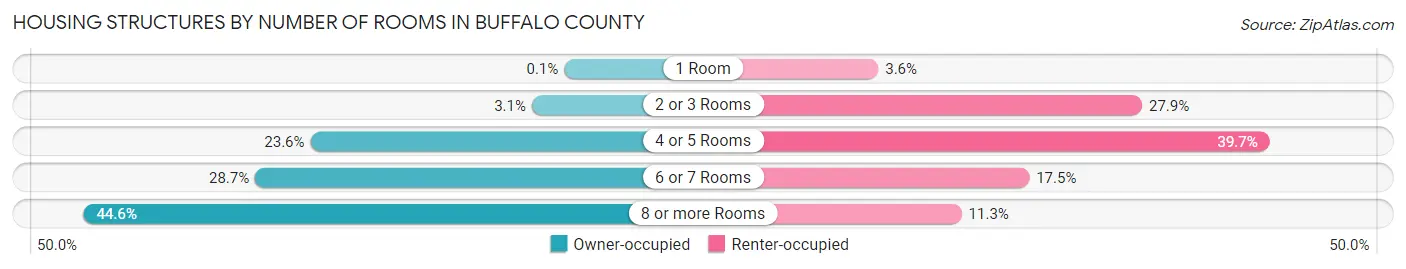
| Number of Rooms | Owner-occupied | Renter-occupied |
| 1 Room | 13 (0.1%) | 234 (3.5%) |
| 2 or 3 Rooms | 400 (3.1%) | 1,841 (27.9%) |
| 4 or 5 Rooms | 3,053 (23.6%) | 2,618 (39.7%) |
| 6 or 7 Rooms | 3,717 (28.7%) | 1,154 (17.5%) |
| 8 or more Rooms | 5,772 (44.6%) | 742 (11.3%) |
| Total | 12,955 (100.0%) | 6,589 (100.0%) |
Housing Structure by Heating Type in Buffalo County
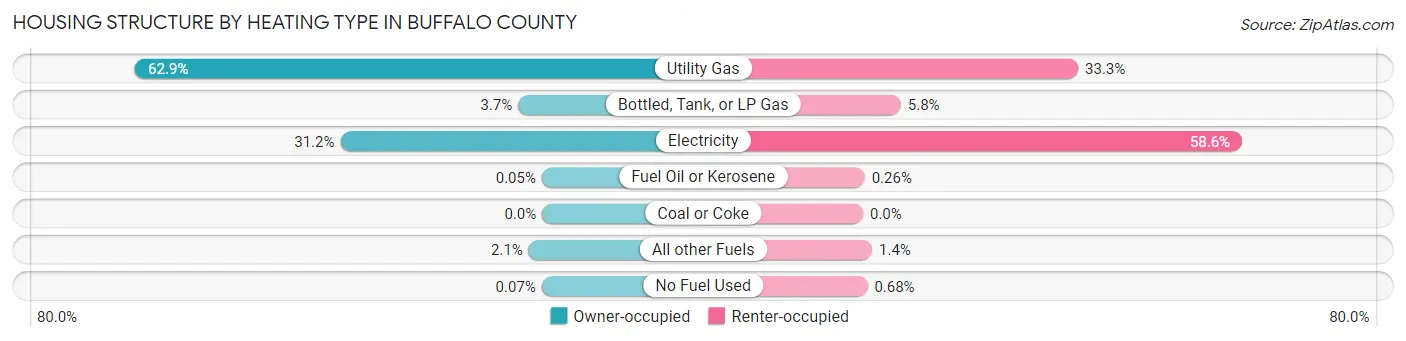
| Heating Type | Owner-occupied | Renter-occupied |
| Utility Gas | 8,150 (62.9%) | 2,191 (33.3%) |
| Bottled, Tank, or LP Gas | 481 (3.7%) | 385 (5.8%) |
| Electricity | 4,041 (31.2%) | 3,859 (58.6%) |
| Fuel Oil or Kerosene | 6 (0.1%) | 17 (0.3%) |
| Coal or Coke | 0 (0.0%) | 0 (0.0%) |
| All other Fuels | 268 (2.1%) | 92 (1.4%) |
| No Fuel Used | 9 (0.1%) | 45 (0.7%) |
| Total | 12,955 (100.0%) | 6,589 (100.0%) |
Household Vehicle Usage in Buffalo County
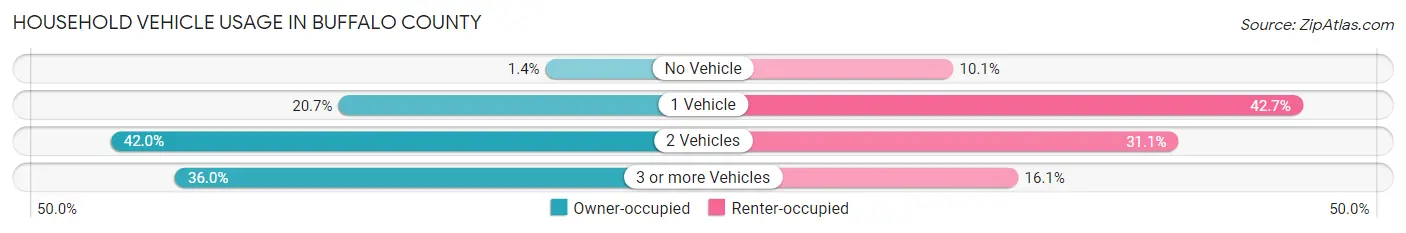
| Vehicles per Household | Owner-occupied | Renter-occupied |
| No Vehicle | 179 (1.4%) | 662 (10.1%) |
| 1 Vehicle | 2,684 (20.7%) | 2,815 (42.7%) |
| 2 Vehicles | 5,435 (41.9%) | 2,050 (31.1%) |
| 3 or more Vehicles | 4,657 (35.9%) | 1,062 (16.1%) |
| Total | 12,955 (100.0%) | 6,589 (100.0%) |
Real Estate & Mortgages in Buffalo County
Real Estate and Mortgage Overview in Buffalo County
| Characteristic | Without Mortgage | With Mortgage |
| Housing Units | 5,559 | 7,396 |
| Median Property Value | $194,800 | $234,000 |
| Median Household Income | $68,842 | $1,752 |
| Monthly Housing Costs | $656 | $516 |
| Real Estate Taxes | $3,197 | $255 |
Property Value by Mortgage Status in Buffalo County
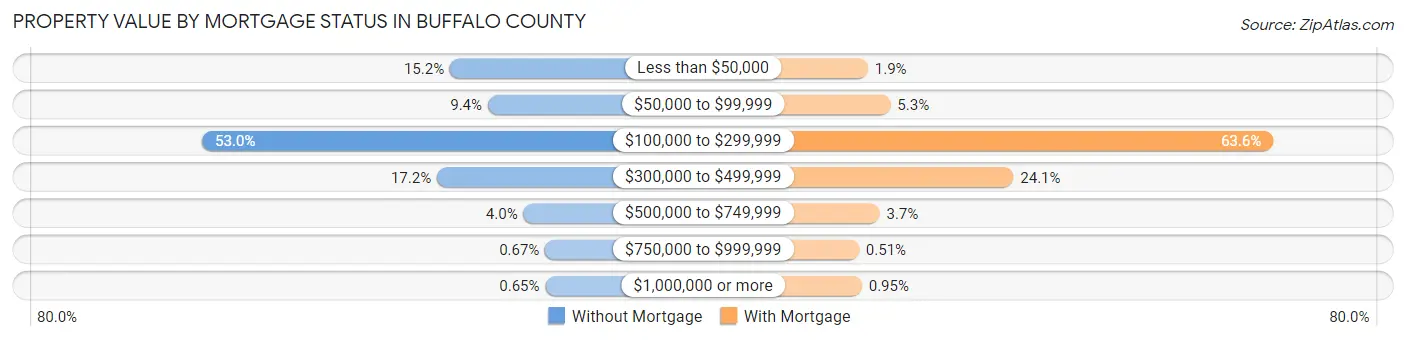
| Property Value | Without Mortgage | With Mortgage |
| Less than $50,000 | 844 (15.2%) | 138 (1.9%) |
| $50,000 to $99,999 | 523 (9.4%) | 393 (5.3%) |
| $100,000 to $299,999 | 2,944 (53.0%) | 4,707 (63.6%) |
| $300,000 to $499,999 | 954 (17.2%) | 1,779 (24.0%) |
| $500,000 to $749,999 | 221 (4.0%) | 271 (3.7%) |
| $750,000 to $999,999 | 37 (0.7%) | 38 (0.5%) |
| $1,000,000 or more | 36 (0.6%) | 70 (0.9%) |
| Total | 5,559 (100.0%) | 7,396 (100.0%) |
Household Income by Mortgage Status in Buffalo County
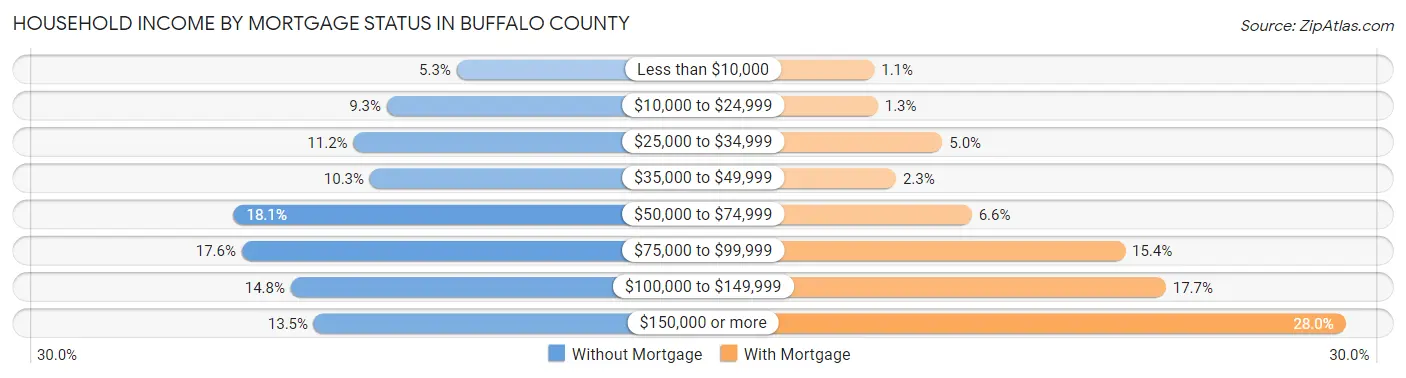
| Household Income | Without Mortgage | With Mortgage |
| Less than $10,000 | 295 (5.3%) | 79 (1.1%) |
| $10,000 to $24,999 | 517 (9.3%) | 94 (1.3%) |
| $25,000 to $34,999 | 623 (11.2%) | 367 (5.0%) |
| $35,000 to $49,999 | 571 (10.3%) | 171 (2.3%) |
| $50,000 to $74,999 | 1,004 (18.1%) | 491 (6.6%) |
| $75,000 to $99,999 | 978 (17.6%) | 1,139 (15.4%) |
| $100,000 to $149,999 | 822 (14.8%) | 1,311 (17.7%) |
| $150,000 or more | 749 (13.5%) | 2,071 (28.0%) |
| Total | 5,559 (100.0%) | 7,396 (100.0%) |
Property Value to Household Income Ratio in Buffalo County
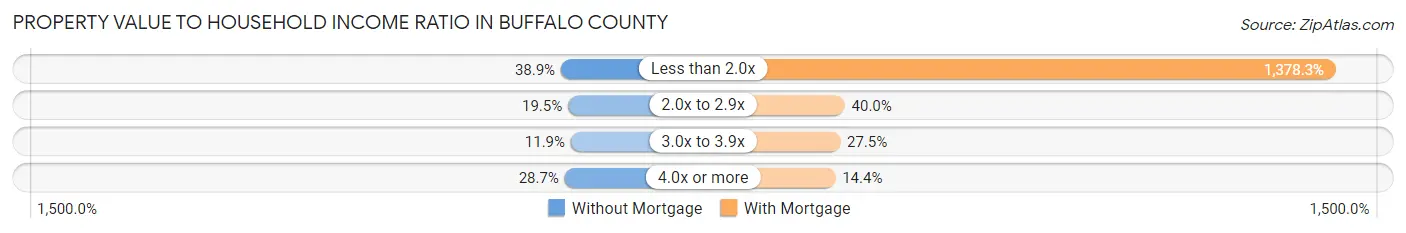
| Value-to-Income Ratio | Without Mortgage | With Mortgage |
| Less than 2.0x | 2,163 (38.9%) | 101,941 (1,378.3%) |
| 2.0x to 2.9x | 1,084 (19.5%) | 2,958 (40.0%) |
| 3.0x to 3.9x | 663 (11.9%) | 2,033 (27.5%) |
| 4.0x or more | 1,597 (28.7%) | 1,068 (14.4%) |
| Total | 5,559 (100.0%) | 7,396 (100.0%) |
Real Estate Taxes by Mortgage Status in Buffalo County
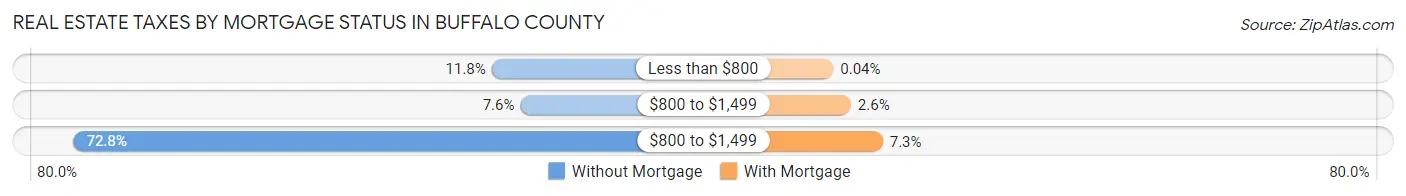
| Property Taxes | Without Mortgage | With Mortgage |
| Less than $800 | 654 (11.8%) | 3 (0.0%) |
| $800 to $1,499 | 421 (7.6%) | 193 (2.6%) |
| $800 to $1,499 | 4,049 (72.8%) | 538 (7.3%) |
| Total | 5,559 (100.0%) | 7,396 (100.0%) |
Health & Disability in Buffalo County
Health Insurance Coverage by Age in Buffalo County
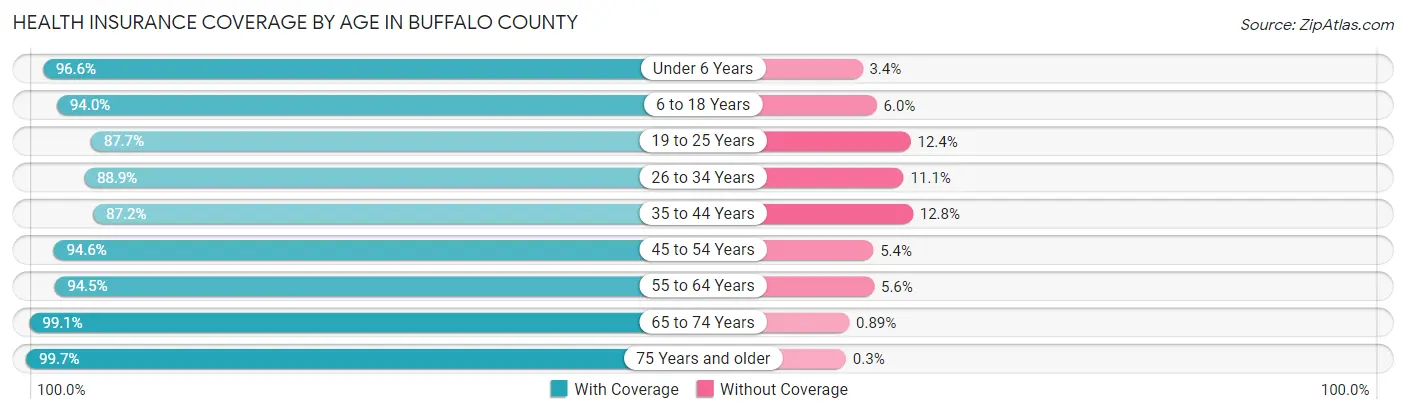
| Age Bracket | With Coverage | Without Coverage |
| Under 6 Years | 3,487 (96.6%) | 122 (3.4%) |
| 6 to 18 Years | 8,272 (94.0%) | 531 (6.0%) |
| 19 to 25 Years | 6,167 (87.6%) | 869 (12.3%) |
| 26 to 34 Years | 5,160 (88.9%) | 642 (11.1%) |
| 35 to 44 Years | 5,385 (87.2%) | 789 (12.8%) |
| 45 to 54 Years | 4,795 (94.6%) | 273 (5.4%) |
| 55 to 64 Years | 5,143 (94.5%) | 302 (5.6%) |
| 65 to 74 Years | 4,431 (99.1%) | 40 (0.9%) |
| 75 Years and older | 3,001 (99.7%) | 9 (0.3%) |
| Total | 45,841 (92.8%) | 3,577 (7.2%) |
Health Insurance Coverage by Citizenship Status in Buffalo County
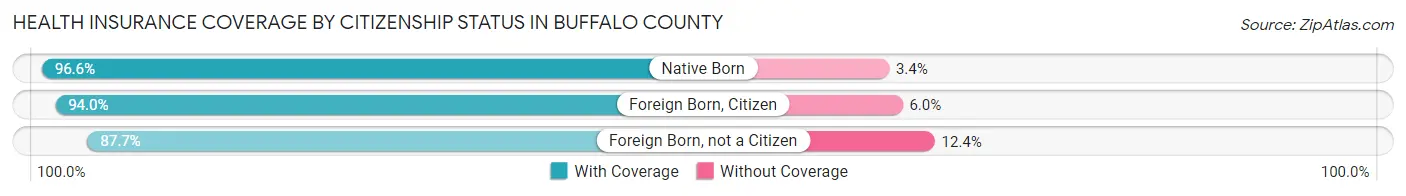
| Citizenship Status | With Coverage | Without Coverage |
| Native Born | 3,487 (96.6%) | 122 (3.4%) |
| Foreign Born, Citizen | 8,272 (94.0%) | 531 (6.0%) |
| Foreign Born, not a Citizen | 6,167 (87.6%) | 869 (12.3%) |
Health Insurance Coverage by Household Income in Buffalo County
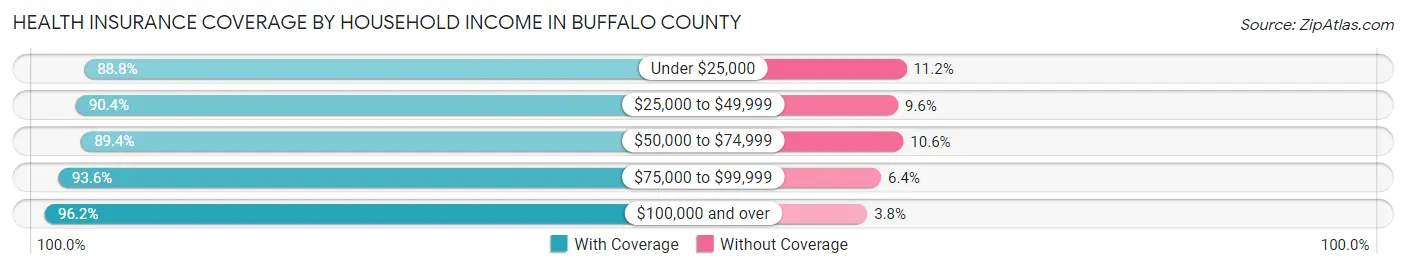
| Household Income | With Coverage | Without Coverage |
| Under $25,000 | 4,212 (88.8%) | 530 (11.2%) |
| $25,000 to $49,999 | 6,687 (90.4%) | 710 (9.6%) |
| $50,000 to $74,999 | 7,633 (89.4%) | 906 (10.6%) |
| $75,000 to $99,999 | 7,614 (93.6%) | 523 (6.4%) |
| $100,000 and over | 18,399 (96.2%) | 735 (3.8%) |
Public vs Private Health Insurance Coverage by Age in Buffalo County
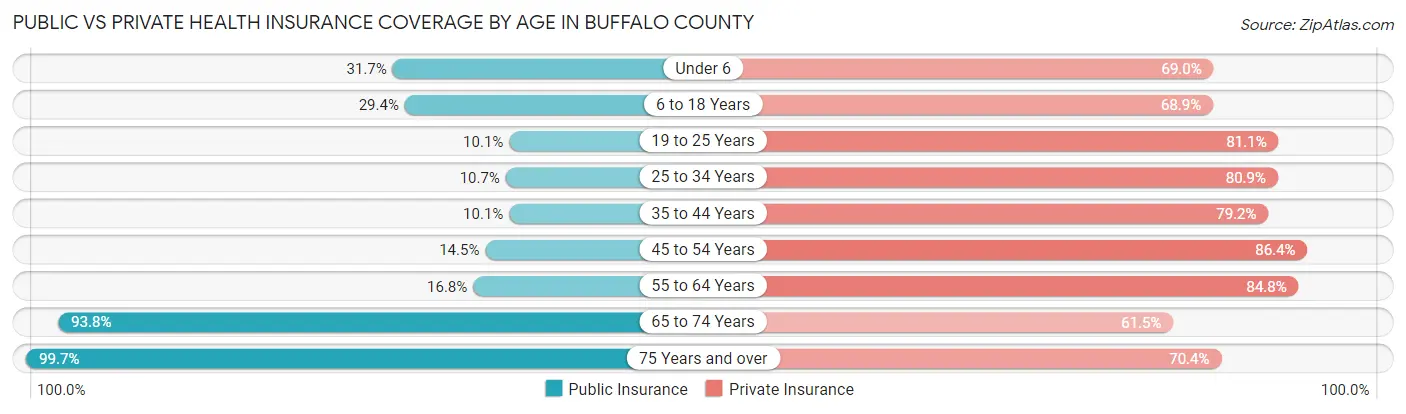
| Age Bracket | Public Insurance | Private Insurance |
| Under 6 | 1,144 (31.7%) | 2,490 (69.0%) |
| 6 to 18 Years | 2,592 (29.4%) | 6,065 (68.9%) |
| 19 to 25 Years | 708 (10.1%) | 5,703 (81.0%) |
| 25 to 34 Years | 621 (10.7%) | 4,695 (80.9%) |
| 35 to 44 Years | 621 (10.1%) | 4,888 (79.2%) |
| 45 to 54 Years | 735 (14.5%) | 4,380 (86.4%) |
| 55 to 64 Years | 912 (16.8%) | 4,616 (84.8%) |
| 65 to 74 Years | 4,193 (93.8%) | 2,751 (61.5%) |
| 75 Years and over | 3,001 (99.7%) | 2,120 (70.4%) |
| Total | 14,527 (29.4%) | 37,708 (76.3%) |
Disability Status by Sex by Age in Buffalo County
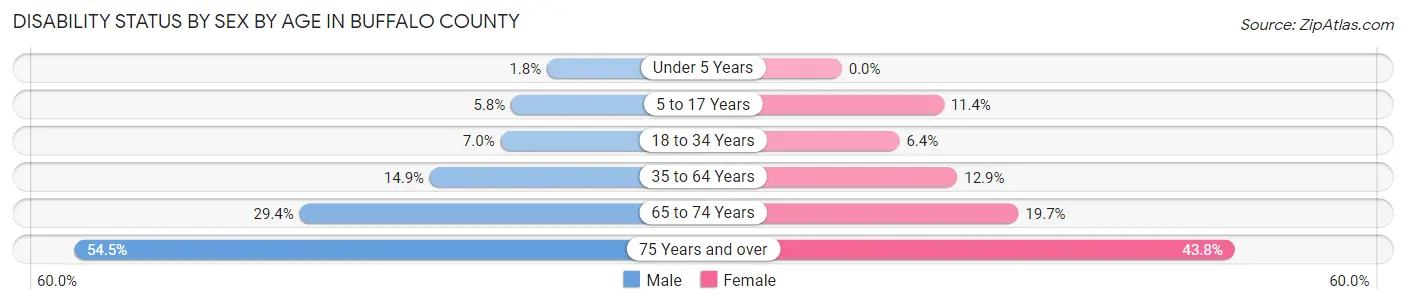
| Age Bracket | Male | Female |
| Under 5 Years | 29 (1.8%) | 0 (0.0%) |
| 5 to 17 Years | 249 (5.8%) | 458 (11.4%) |
| 18 to 34 Years | 486 (7.0%) | 445 (6.4%) |
| 35 to 64 Years | 1,271 (14.9%) | 1,046 (12.9%) |
| 65 to 74 Years | 640 (29.4%) | 451 (19.7%) |
| 75 Years and over | 624 (54.5%) | 816 (43.8%) |
Disability Class by Sex by Age in Buffalo County
Disability Class: Hearing Difficulty
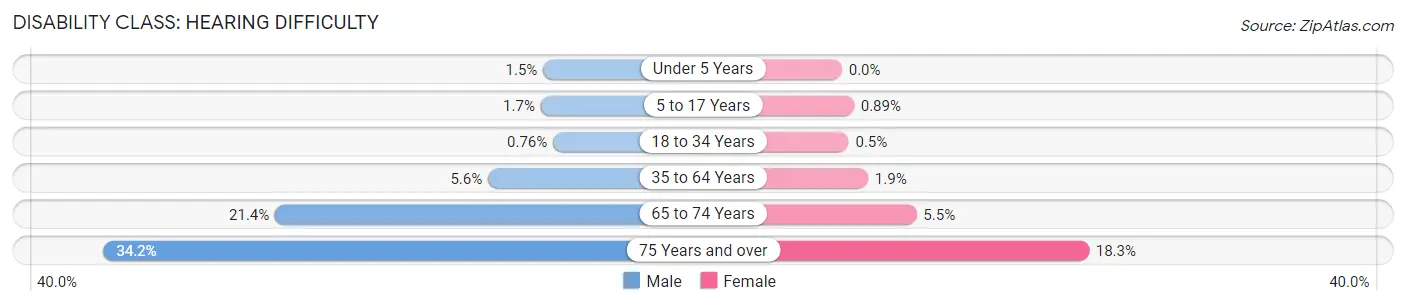
| Age Bracket | Male | Female |
| Under 5 Years | 24 (1.5%) | 0 (0.0%) |
| 5 to 17 Years | 72 (1.7%) | 36 (0.9%) |
| 18 to 34 Years | 53 (0.8%) | 35 (0.5%) |
| 35 to 64 Years | 478 (5.6%) | 158 (1.9%) |
| 65 to 74 Years | 466 (21.4%) | 127 (5.5%) |
| 75 Years and over | 391 (34.2%) | 342 (18.3%) |
Disability Class: Vision Difficulty
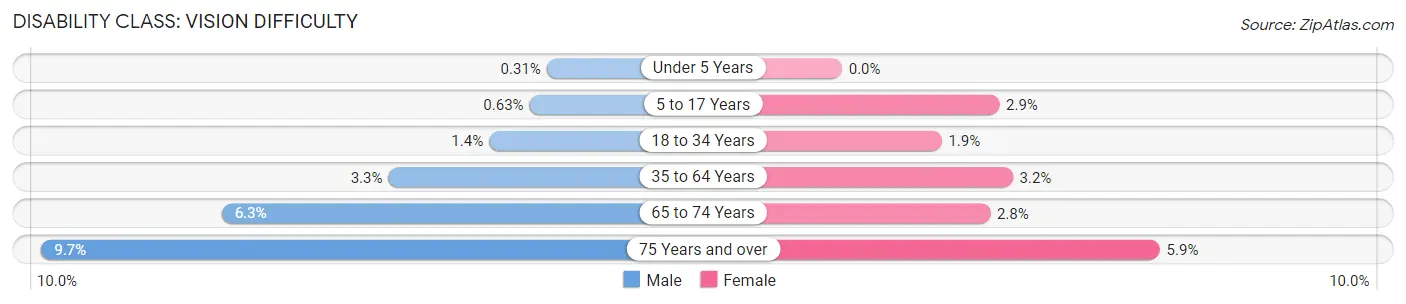
| Age Bracket | Male | Female |
| Under 5 Years | 5 (0.3%) | 0 (0.0%) |
| 5 to 17 Years | 27 (0.6%) | 118 (2.9%) |
| 18 to 34 Years | 96 (1.4%) | 128 (1.8%) |
| 35 to 64 Years | 278 (3.3%) | 258 (3.2%) |
| 65 to 74 Years | 138 (6.3%) | 63 (2.8%) |
| 75 Years and over | 111 (9.7%) | 110 (5.9%) |
Disability Class: Cognitive Difficulty
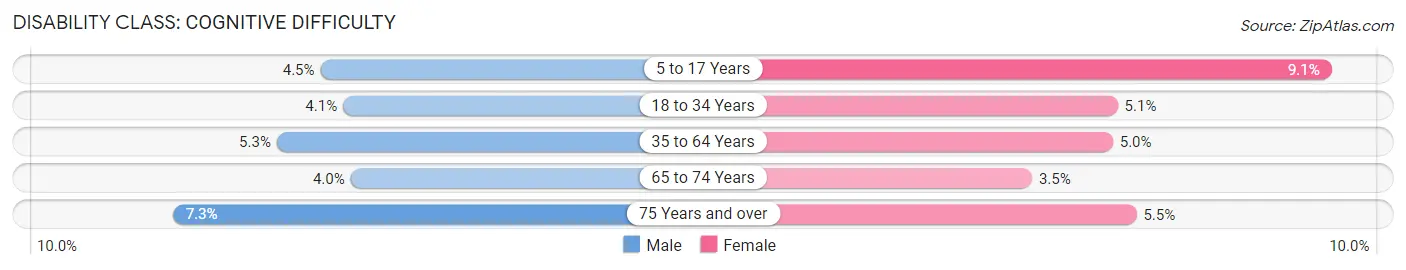
| Age Bracket | Male | Female |
| 5 to 17 Years | 193 (4.5%) | 367 (9.1%) |
| 18 to 34 Years | 284 (4.1%) | 355 (5.1%) |
| 35 to 64 Years | 455 (5.3%) | 409 (5.0%) |
| 65 to 74 Years | 86 (4.0%) | 81 (3.5%) |
| 75 Years and over | 83 (7.2%) | 102 (5.5%) |
Disability Class: Ambulatory Difficulty
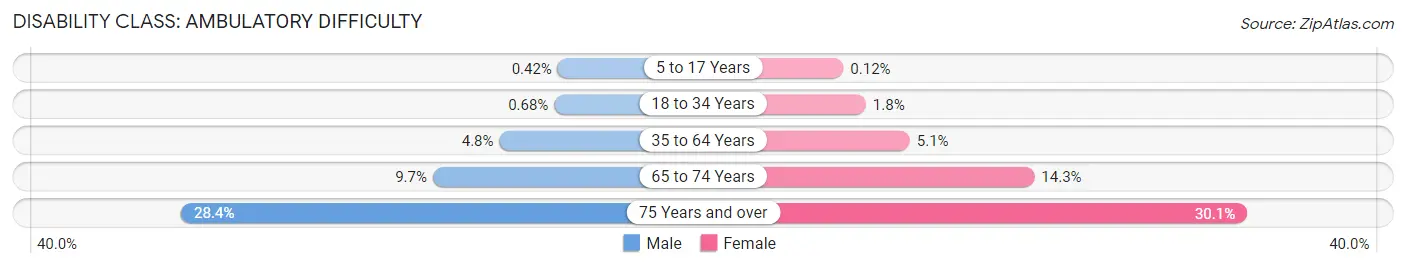
| Age Bracket | Male | Female |
| 5 to 17 Years | 18 (0.4%) | 5 (0.1%) |
| 18 to 34 Years | 47 (0.7%) | 124 (1.8%) |
| 35 to 64 Years | 406 (4.8%) | 411 (5.1%) |
| 65 to 74 Years | 211 (9.7%) | 328 (14.3%) |
| 75 Years and over | 325 (28.4%) | 561 (30.1%) |
Disability Class: Self-Care Difficulty
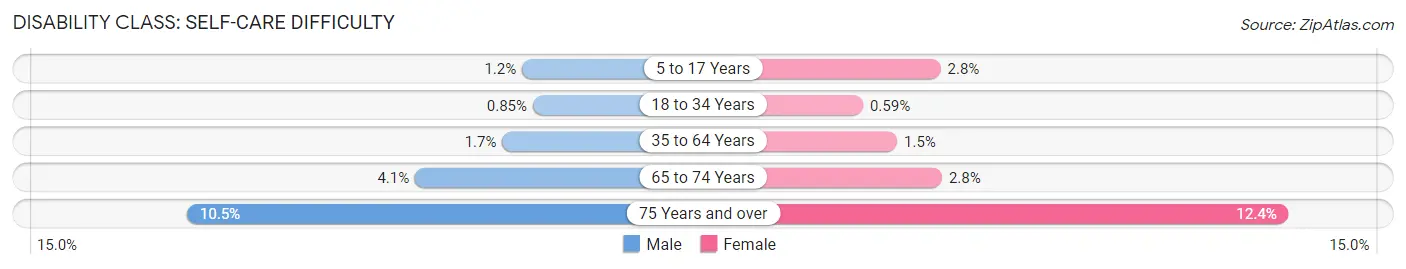
| Age Bracket | Male | Female |
| 5 to 17 Years | 49 (1.1%) | 111 (2.8%) |
| 18 to 34 Years | 59 (0.9%) | 41 (0.6%) |
| 35 to 64 Years | 145 (1.7%) | 125 (1.5%) |
| 65 to 74 Years | 90 (4.1%) | 64 (2.8%) |
| 75 Years and over | 120 (10.5%) | 232 (12.4%) |
Technology Access in Buffalo County
Computing Device Access in Buffalo County
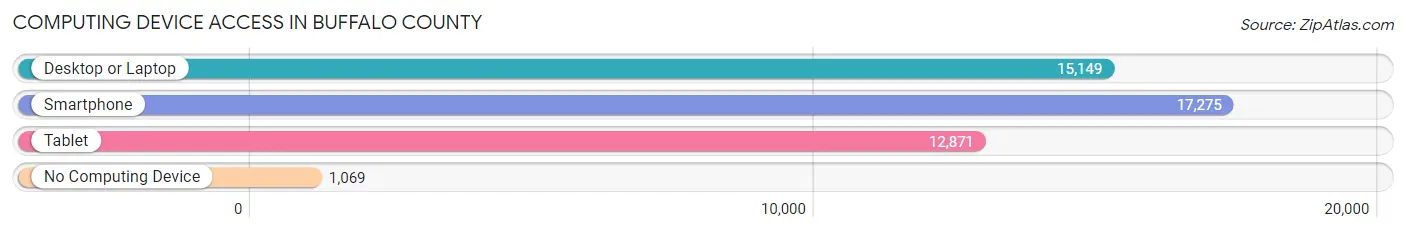
| Device Type | # Households | % Households |
| Desktop or Laptop | 15,149 | 77.5% |
| Smartphone | 17,275 | 88.4% |
| Tablet | 12,871 | 65.9% |
| No Computing Device | 1,069 | 5.5% |
| Total | 19,544 | 100.0% |
Internet Access in Buffalo County
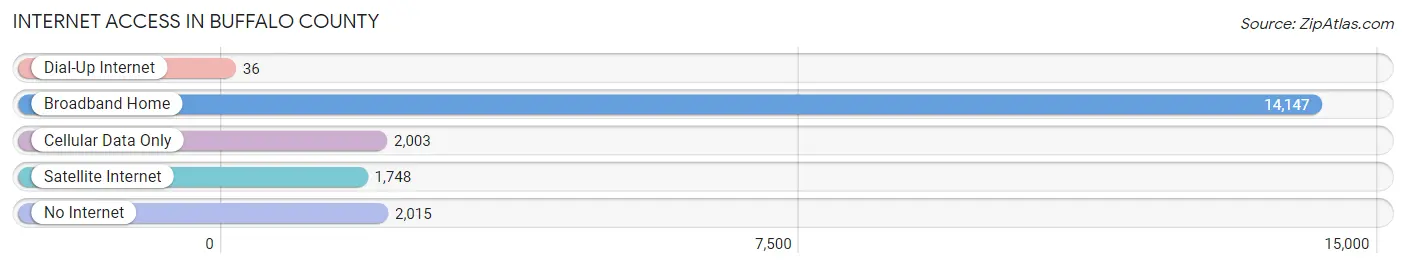
| Internet Type | # Households | % Households |
| Dial-Up Internet | 36 | 0.2% |
| Broadband Home | 14,147 | 72.4% |
| Cellular Data Only | 2,003 | 10.2% |
| Satellite Internet | 1,748 | 8.9% |
| No Internet | 2,015 | 10.3% |
| Total | 19,544 | 100.0% |
Buffalo County Summary
Buffalo County is located in the state of Nebraska in the Midwestern United States. It is bordered by Hall, Howard, Sherman, and Dawson counties. The county seat is Kearney, which is also the largest city in the county. As of the 2010 census, the population of Buffalo County was 48,918.
Geography
Buffalo County is located in the south-central part of Nebraska. It is bordered by Hall County to the north, Howard County to the east, Sherman County to the south, and Dawson County to the west. The county has a total area of 845 square miles, of which 844 square miles is land and 1 square mile is water. The county is mostly flat, with some rolling hills in the western part. The Platte River runs through the county, and there are several small lakes and ponds scattered throughout.
The county is divided into two distinct regions. The eastern part of the county is part of the Central Plains region, while the western part is part of the High Plains region. The eastern part of the county is mostly flat, with some rolling hills. The western part of the county is more hilly and is home to the Wildcat Hills, which are a series of low hills and ridges.
Climate
Buffalo County has a humid continental climate, with hot summers and cold winters. The average annual temperature is 50°F, and the average annual precipitation is 22 inches. The county is prone to severe weather, including tornadoes, hail, and thunderstorms.
Demographics
As of the 2010 census, there were 48,918 people, 17,945 households, and 11,945 families living in Buffalo County. The population density was 58 people per square mile. The racial makeup of the county was 90.2% White, 2.3% African American, 0.7% Native American, 1.7% Asian, 0.1% Pacific Islander, 3.2% from other races, and 2.0% from two or more races. Hispanic or Latino of any race were 8.2% of the population.
The median income for a household in the county was $45,945, and the median income for a family was $55,945. The per capita income for the county was $22,945. About 8.2% of families and 11.2% of the population were below the poverty line, including 14.2% of those under age 18 and 8.2% of those age 65 or over.
Economy
The economy of Buffalo County is largely based on agriculture and manufacturing. The county is home to several large agricultural operations, including cattle ranches, dairy farms, and grain farms. The county is also home to several manufacturing companies, including a large food processing plant and a plastics factory.
The county is also home to the University of Nebraska at Kearney, which is a major employer in the area. The university provides jobs for faculty, staff, and students, and it also attracts visitors to the area.
The county is served by two major highways, Interstate 80 and U.S. Route 30. The county is also served by the Burlington Northern Santa Fe Railroad, which runs through the county.
Conclusion
Buffalo County is a rural county located in the state of Nebraska. It is bordered by Hall, Howard, Sherman, and Dawson counties. The county has a population of 48,918, and the county seat is Kearney. The county has a humid continental climate, with hot summers and cold winters. The economy of the county is largely based on agriculture and manufacturing. The county is served by two major highways and the Burlington Northern Santa Fe Railroad.
Common Questions
What is the Total Population of Buffalo County?
Total Population of Buffalo County is 50,103.
What is the Total Male Population of Buffalo County?
Total Male Population of Buffalo County is 25,127.
What is the Total Female Population of Buffalo County?
Total Female Population of Buffalo County is 24,976.
What is the Ratio of Males per 100 Females in Buffalo County?
There are 100.60 Males per 100 Females in Buffalo County.
What is the Ratio of Females per 100 Males in Buffalo County?
There are 99.40 Females per 100 Males in Buffalo County.
What is the Median Population Age in Buffalo County?
Median Population Age in Buffalo County is 34.2 Years.
What is the Average Family Size in Buffalo County
Average Family Size in Buffalo County is 3.0 People.
What is the Average Household Size in Buffalo County
Average Household Size in Buffalo County is 2.5 People.
What is Per Capita Income in Buffalo County?
Per Capita income in Buffalo County is $36,327.
What is the Median Family Income in Buffalo County?
Median Family Income in Buffalo County is $93,464.
What is the Median Household income in Buffalo County?
Median Household Income in Buffalo County is $70,093.
What is Income or Wage Gap in Buffalo County?
Income or Wage Gap in Buffalo County is 32.8%.
Women in Buffalo County earn 67.2 cents for every dollar earned by a man.
What is Family Income Deficit in Buffalo County?
Family Income Deficit in Buffalo County is $9,409.
Families that are below poverty line in Buffalo County earn $9,409 less on average than the poverty threshold level.
What is Inequality or Gini Index in Buffalo County?
Inequality or Gini Index in Buffalo County is 0.44.
How Large is the Labor Force in Buffalo County?
There are 28,413 People in the Labor Forcein in Buffalo County.
What is the Percentage of People in the Labor Force in Buffalo County?
71.0% of People are in the Labor Force in Buffalo County.
What is the Unemployment Rate in Buffalo County?
Unemployment Rate in Buffalo County is 2.9%.