Arcadia, NE
Arcadia Map
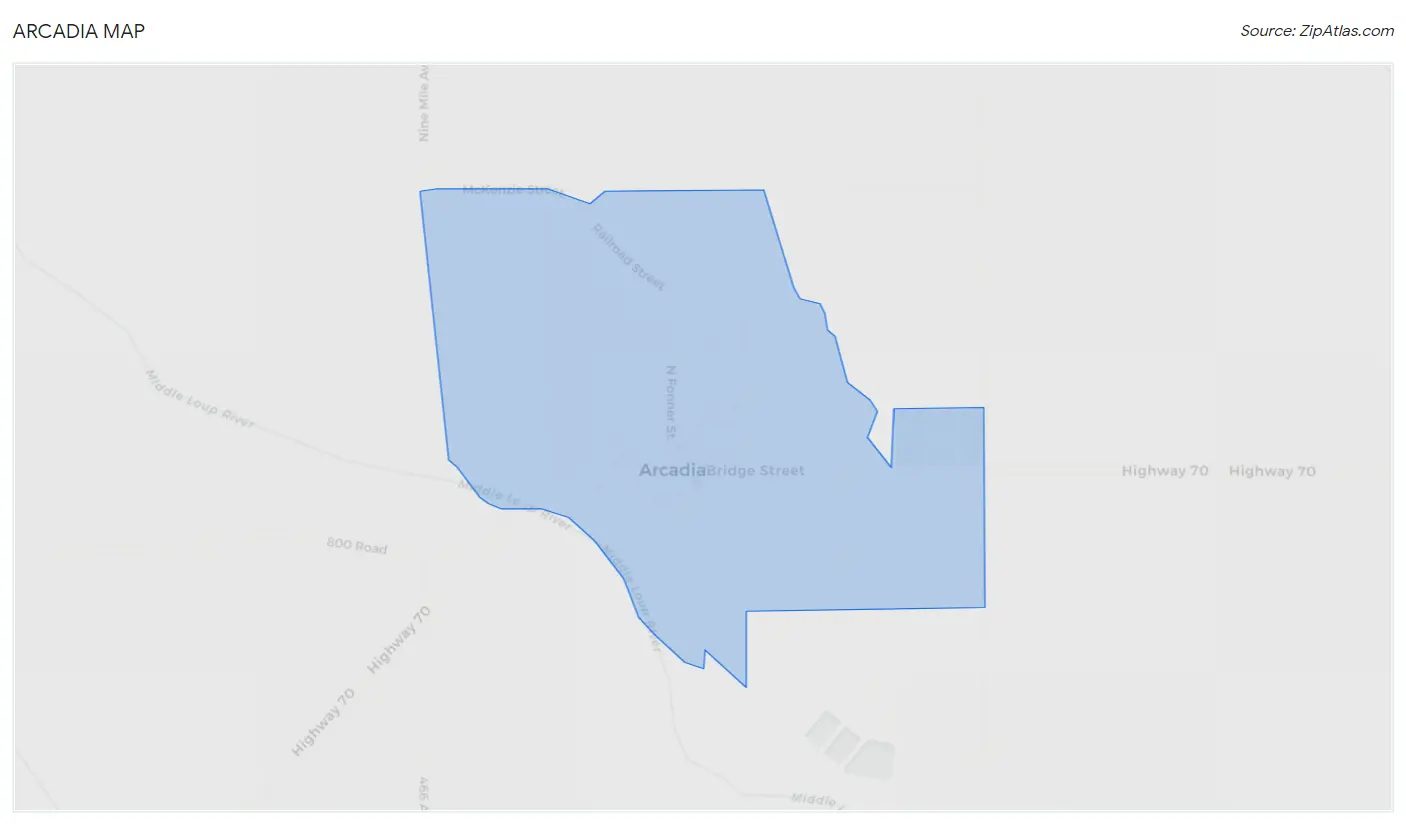
Arcadia Overview
333
TOTAL POPULATION
166
MALE POPULATION
167
FEMALE POPULATION
99.40
MALES / 100 FEMALES
100.60
FEMALES / 100 MALES
44.1
MEDIAN AGE
2.9
AVG FAMILY SIZE
2.3
AVG HOUSEHOLD SIZE
$42,191
PER CAPITA INCOME
$89,063
AVG FAMILY INCOME
$86,875
AVG HOUSEHOLD INCOME
30.1%
WAGE / INCOME GAP [ % ]
69.9¢/ $1
WAGE / INCOME GAP [ $ ]
0.41
INEQUALITY / GINI INDEX
196
LABOR FORCE [ PEOPLE ]
70.5%
PERCENT IN LABOR FORCE
Arcadia Zip Codes
Arcadia Area Codes
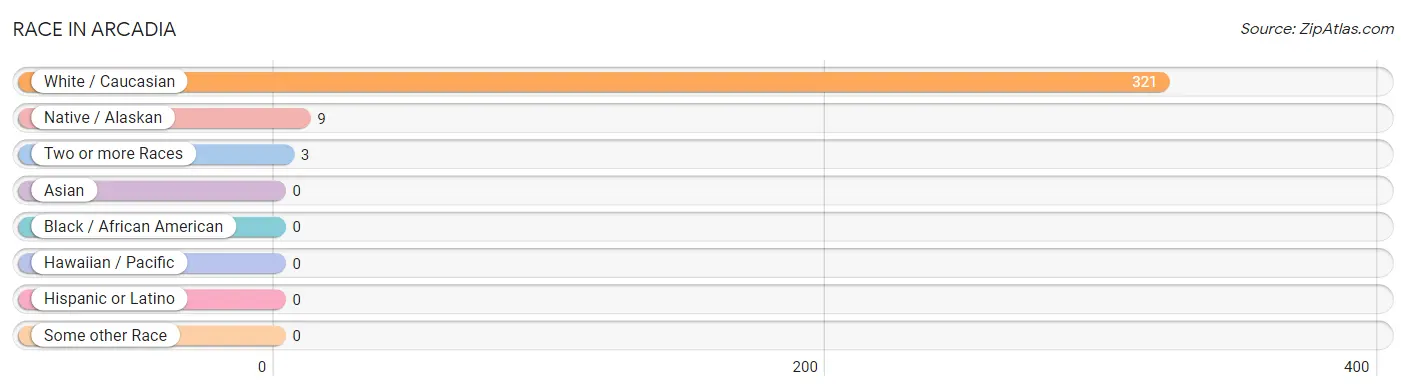
Race in Arcadia
The most populous races in Arcadia are White / Caucasian (321 | 96.4%), Native / Alaskan (9 | 2.7%), and Two or more Races (3 | 0.9%).
| Race | # Population | % Population |
| Asian | 0 | 0.0% |
| Black / African American | 0 | 0.0% |
| Hawaiian / Pacific | 0 | 0.0% |
| Hispanic or Latino | 0 | 0.0% |
| Native / Alaskan | 9 | 2.7% |
| White / Caucasian | 321 | 96.4% |
| Two or more Races | 3 | 0.9% |
| Some other Race | 0 | 0.0% |
| Total | 333 | 100.0% |
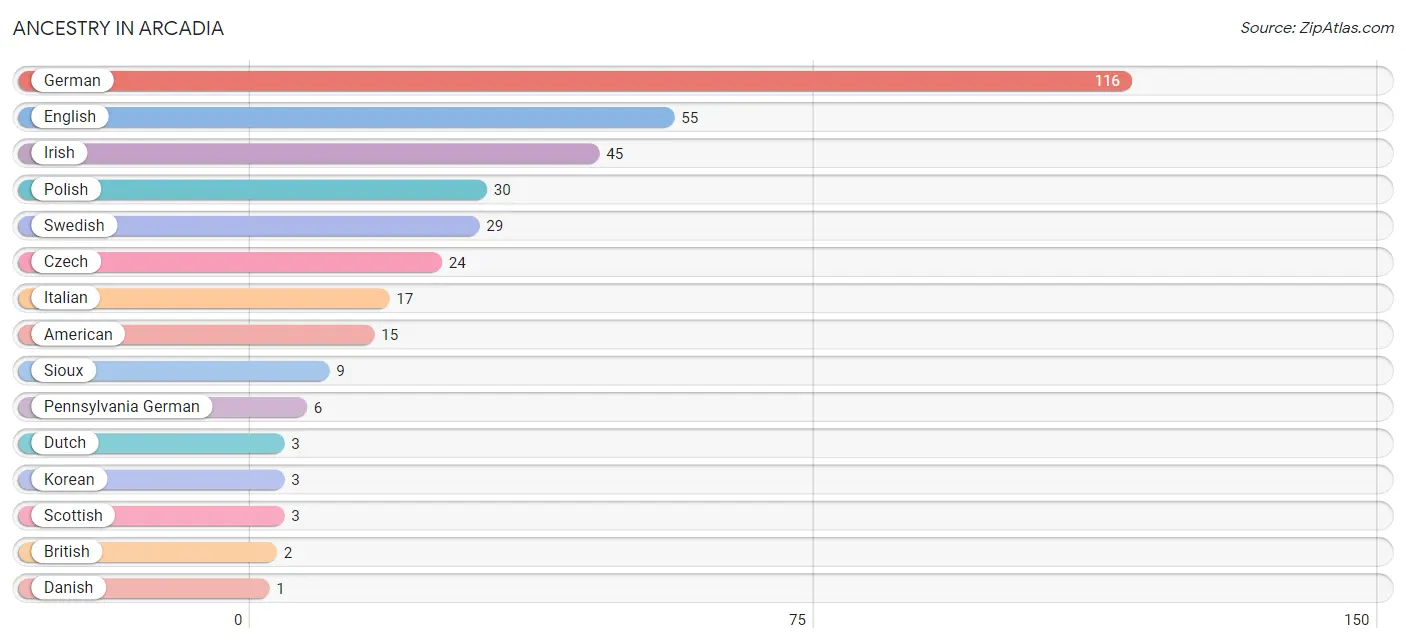
Ancestry in Arcadia
The most populous ancestries reported in Arcadia are German (116 | 34.8%), English (55 | 16.5%), Irish (45 | 13.5%), Polish (30 | 9.0%), and Swedish (29 | 8.7%), together accounting for 82.6% of all Arcadia residents.
| Ancestry | # Population | % Population |
| American | 15 | 4.5% |
| British | 2 | 0.6% |
| Czech | 24 | 7.2% |
| Danish | 1 | 0.3% |
| Dutch | 3 | 0.9% |
| English | 55 | 16.5% |
| German | 116 | 34.8% |
| Irish | 45 | 13.5% |
| Italian | 17 | 5.1% |
| Korean | 3 | 0.9% |
| Pennsylvania German | 6 | 1.8% |
| Polish | 30 | 9.0% |
| Scottish | 3 | 0.9% |
| Sioux | 9 | 2.7% |
| Swedish | 29 | 8.7% | View All 15 Rows |
Immigrants in Arcadia

| Immigration Origin | # Population | % Population | View All 0 Rows |
Sex and Age in Arcadia
Sex and Age in Arcadia
The most populous age groups in Arcadia are 10 to 14 Years (30 | 18.1%) for men and 40 to 44 Years (34 | 20.4%) for women.

| Age Bracket | Male | Female |
| Under 5 Years | 1 (0.6%) | 3 (1.8%) |
| 5 to 9 Years | 7 (4.2%) | 7 (4.2%) |
| 10 to 14 Years | 30 (18.1%) | 7 (4.2%) |
| 15 to 19 Years | 15 (9.0%) | 6 (3.6%) |
| 20 to 24 Years | 10 (6.0%) | 13 (7.8%) |
| 25 to 29 Years | 12 (7.2%) | 3 (1.8%) |
| 30 to 34 Years | 13 (7.8%) | 0 (0.0%) |
| 35 to 39 Years | 4 (2.4%) | 3 (1.8%) |
| 40 to 44 Years | 2 (1.2%) | 34 (20.4%) |
| 45 to 49 Years | 24 (14.5%) | 4 (2.4%) |
| 50 to 54 Years | 0 (0.0%) | 18 (10.8%) |
| 55 to 59 Years | 9 (5.4%) | 16 (9.6%) |
| 60 to 64 Years | 6 (3.6%) | 6 (3.6%) |
| 65 to 69 Years | 1 (0.6%) | 4 (2.4%) |
| 70 to 74 Years | 3 (1.8%) | 8 (4.8%) |
| 75 to 79 Years | 20 (12.0%) | 24 (14.4%) |
| 80 to 84 Years | 7 (4.2%) | 5 (3.0%) |
| 85 Years and over | 2 (1.2%) | 6 (3.6%) |
| Total | 166 (100.0%) | 167 (100.0%) |
Families and Households in Arcadia
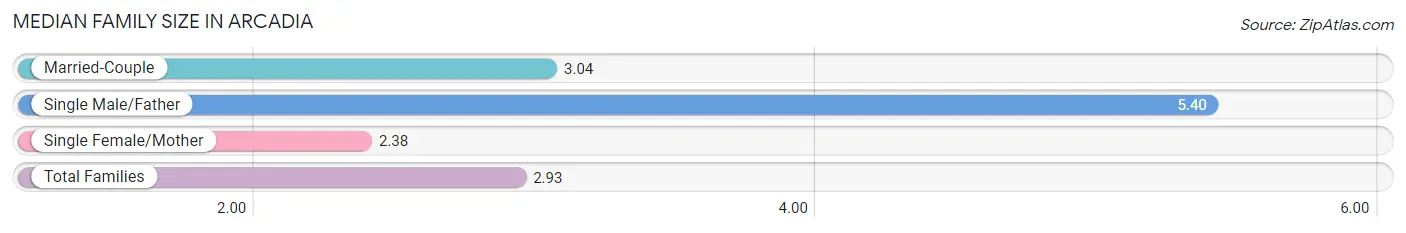
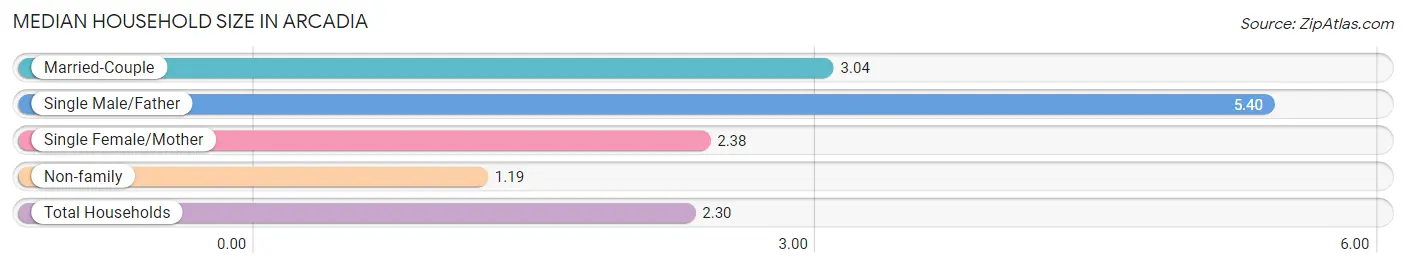
Median Family Size in Arcadia
The median family size in Arcadia is 2.93 persons per family, with single male/father families (5 | 5.4%) accounting for the largest median family size of 5.4 persons per family. On the other hand, single female/mother families (32 | 34.8%) represent the smallest median family size with 2.38 persons per family.
| Family Type | # Families | Family Size |
| Married-Couple | 55 (59.8%) | 3.04 |
| Single Male/Father | 5 (5.4%) | 5.40 |
| Single Female/Mother | 32 (34.8%) | 2.38 |
| Total Families | 92 (100.0%) | 2.93 |
Median Household Size in Arcadia
The median household size in Arcadia is 2.30 persons per household, with single male/father households (5 | 3.5%) accounting for the largest median household size of 5.4 persons per household. non-family households (53 | 36.5%) represent the smallest median household size with 1.19 persons per household.
| Household Type | # Households | Household Size |
| Married-Couple | 55 (37.9%) | 3.04 |
| Single Male/Father | 5 (3.5%) | 5.40 |
| Single Female/Mother | 32 (22.1%) | 2.38 |
| Non-family | 53 (36.5%) | 1.19 |
| Total Households | 145 (100.0%) | 2.30 |
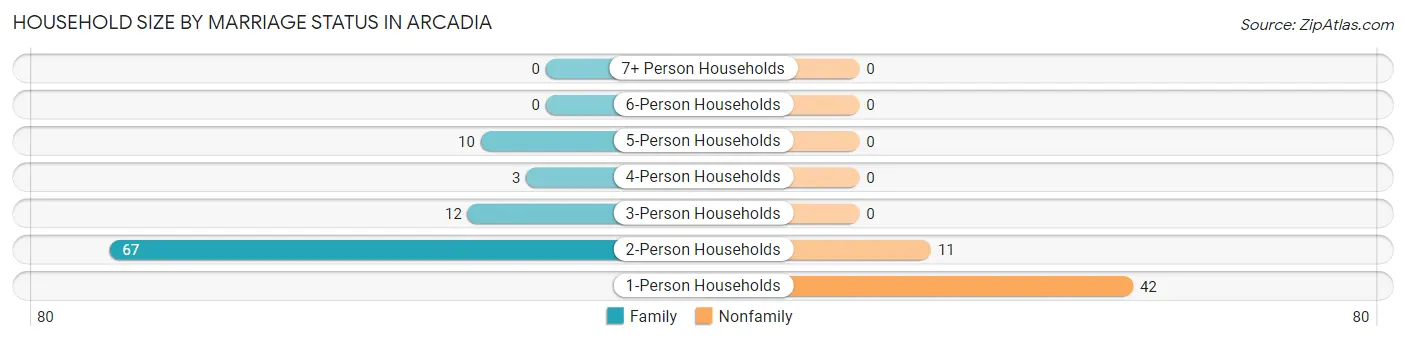
Household Size by Marriage Status in Arcadia
Out of a total of 145 households in Arcadia, 92 (63.4%) are family households, while 53 (36.5%) are nonfamily households. The most numerous type of family households are 2-person households, comprising 67, and the most common type of nonfamily households are 1-person households, comprising 42.
| Household Size | Family Households | Nonfamily Households |
| 1-Person Households | - | 42 (29.0%) |
| 2-Person Households | 67 (46.2%) | 11 (7.6%) |
| 3-Person Households | 12 (8.3%) | 0 (0.0%) |
| 4-Person Households | 3 (2.1%) | 0 (0.0%) |
| 5-Person Households | 10 (6.9%) | 0 (0.0%) |
| 6-Person Households | 0 (0.0%) | 0 (0.0%) |
| 7+ Person Households | 0 (0.0%) | 0 (0.0%) |
| Total | 92 (63.4%) | 53 (36.5%) |
Female Fertility in Arcadia
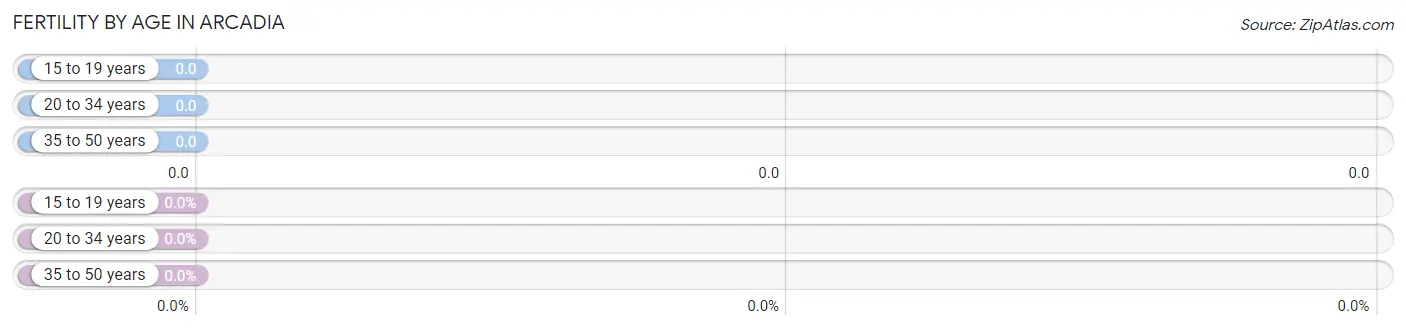
Fertility by Age in Arcadia
| Age Bracket | Women with Births | Births / 1,000 Women |
| 15 to 19 years | 0 (0.0%) | 0.0 |
| 20 to 34 years | 0 (0.0%) | 0.0 |
| 35 to 50 years | 0 (0.0%) | 0.0 |
| Total | 0 (0.0%) | 0.0 |
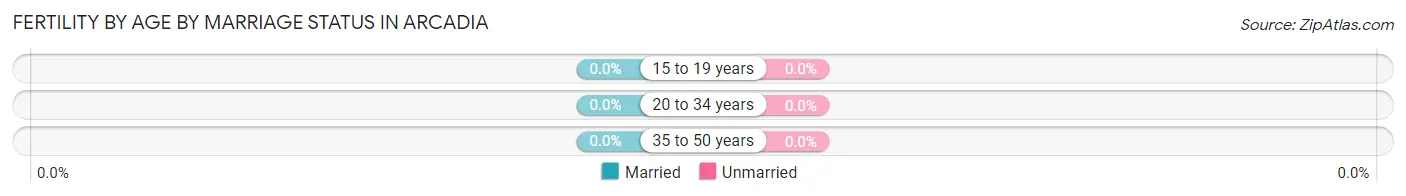
Fertility by Age by Marriage Status in Arcadia
| Age Bracket | Married | Unmarried |
| 15 to 19 years | 0 (0.0%) | 0 (0.0%) |
| 20 to 34 years | 0 (0.0%) | 0 (0.0%) |
| 35 to 50 years | 0 (0.0%) | 0 (0.0%) |
| Total | 0 (0.0%) | 0 (0.0%) |
Fertility by Education in Arcadia
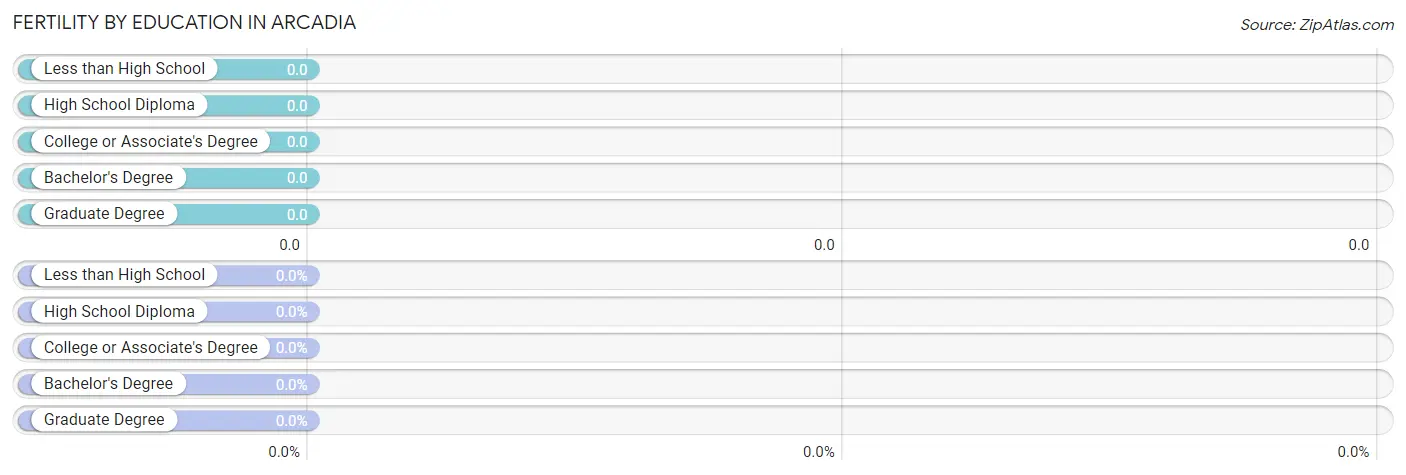
| Educational Attainment | Women with Births | Births / 1,000 Women |
| Less than High School | 0 (0.0%) | 0.0 |
| High School Diploma | 0 (0.0%) | 0.0 |
| College or Associate's Degree | 0 (0.0%) | 0.0 |
| Bachelor's Degree | 0 (0.0%) | 0.0 |
| Graduate Degree | 0 (0.0%) | 0.0 |
| Total | 0 (0.0%) | 0.0 |
Fertility by Education by Marriage Status in Arcadia
| Educational Attainment | Married | Unmarried |
| Less than High School | 0 (0.0%) | 0 (0.0%) |
| High School Diploma | 0 (0.0%) | 0 (0.0%) |
| College or Associate's Degree | 0 (0.0%) | 0 (0.0%) |
| Bachelor's Degree | 0 (0.0%) | 0 (0.0%) |
| Graduate Degree | 0 (0.0%) | 0 (0.0%) |
| Total | 0 (0.0%) | 0 (0.0%) |
Income in Arcadia
Income Overview in Arcadia
Per Capita Income in Arcadia is $42,191, while median incomes of families and households are $89,063 and $86,875 respectively.
| Characteristic | Number | Measure |
| Per Capita Income | 333 | $42,191 |
| Median Family Income | 92 | $89,063 |
| Mean Family Income | 92 | $104,262 |
| Median Household Income | 145 | $86,875 |
| Mean Household Income | 145 | $91,365 |
| Income Deficit | 92 | $0 |
| Wage / Income Gap (%) | 333 | 30.07% |
| Wage / Income Gap ($) | 333 | 69.93¢ per $1 |
| Gini / Inequality Index | 333 | 0.41 |
Earnings by Sex in Arcadia
Average Earnings in Arcadia are $36,513, $46,477 for men and $32,500 for women, a difference of 30.1%.

| Sex | Number | Average Earnings |
| Male | 99 (47.8%) | $46,477 |
| Female | 108 (52.2%) | $32,500 |
| Total | 207 (100.0%) | $36,513 |
Earnings by Sex by Income Bracket in Arcadia
The most common earnings brackets in Arcadia are $35,000 to $39,999 for men (19 | 19.2%) and $30,000 to $34,999 for women (31 | 28.7%).
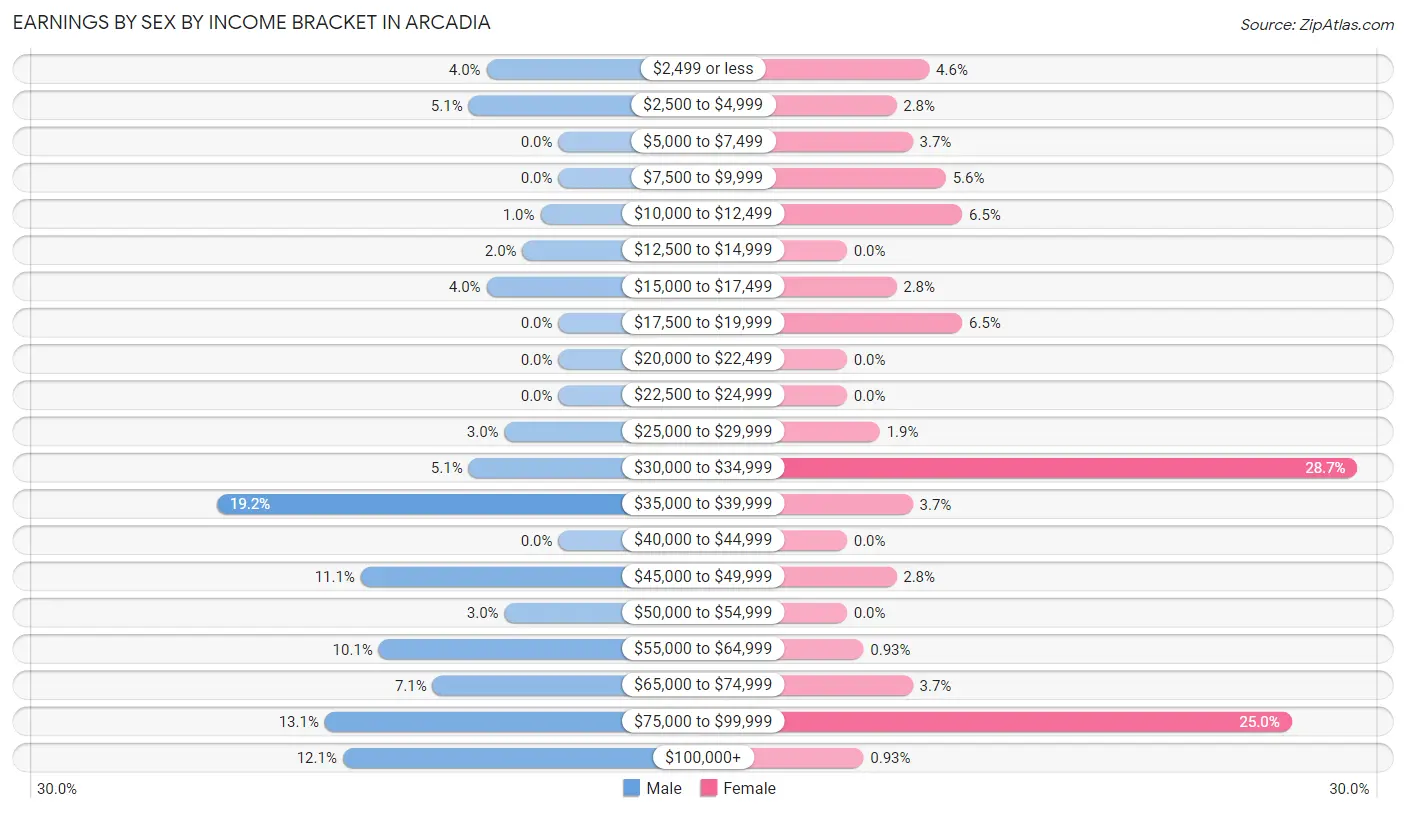
| Income | Male | Female |
| $2,499 or less | 4 (4.0%) | 5 (4.6%) |
| $2,500 to $4,999 | 5 (5.1%) | 3 (2.8%) |
| $5,000 to $7,499 | 0 (0.0%) | 4 (3.7%) |
| $7,500 to $9,999 | 0 (0.0%) | 6 (5.6%) |
| $10,000 to $12,499 | 1 (1.0%) | 7 (6.5%) |
| $12,500 to $14,999 | 2 (2.0%) | 0 (0.0%) |
| $15,000 to $17,499 | 4 (4.0%) | 3 (2.8%) |
| $17,500 to $19,999 | 0 (0.0%) | 7 (6.5%) |
| $20,000 to $22,499 | 0 (0.0%) | 0 (0.0%) |
| $22,500 to $24,999 | 0 (0.0%) | 0 (0.0%) |
| $25,000 to $29,999 | 3 (3.0%) | 2 (1.8%) |
| $30,000 to $34,999 | 5 (5.1%) | 31 (28.7%) |
| $35,000 to $39,999 | 19 (19.2%) | 4 (3.7%) |
| $40,000 to $44,999 | 0 (0.0%) | 0 (0.0%) |
| $45,000 to $49,999 | 11 (11.1%) | 3 (2.8%) |
| $50,000 to $54,999 | 3 (3.0%) | 0 (0.0%) |
| $55,000 to $64,999 | 10 (10.1%) | 1 (0.9%) |
| $65,000 to $74,999 | 7 (7.1%) | 4 (3.7%) |
| $75,000 to $99,999 | 13 (13.1%) | 27 (25.0%) |
| $100,000+ | 12 (12.1%) | 1 (0.9%) |
| Total | 99 (100.0%) | 108 (100.0%) |
Earnings by Sex by Educational Attainment in Arcadia
Average earnings in Arcadia are $62,639 for men and $34,018 for women, a difference of 45.7%. Men with an educational attainment of college or associate's degree enjoy the highest average annual earnings of $67,500, while those with high school diploma education earn the least with $37,308. Women with an educational attainment of bachelor's degree earn the most with the average annual earnings of $87,865, while those with college or associate's degree education have the smallest earnings of $33,625.
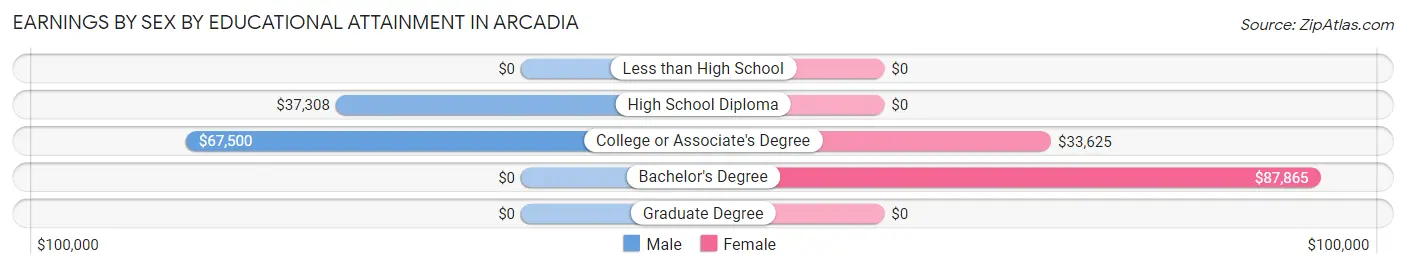
| Educational Attainment | Male Income | Female Income |
| Less than High School | - | - |
| High School Diploma | $37,308 | $0 |
| College or Associate's Degree | $67,500 | $33,625 |
| Bachelor's Degree | - | - |
| Graduate Degree | - | - |
| Total | $62,639 | $34,018 |
Family Income in Arcadia
Family Income Brackets in Arcadia
According to the Arcadia family income data, there are 39 families falling into the $75,000 to $99,999 income range, which is the most common income bracket and makes up 42.4% of all families.

| Income Bracket | # Families | % Families |
| Less than $10,000 | 0 | 0.0% |
| $10,000 to $14,999 | 1 | 1.1% |
| $15,000 to $24,999 | 4 | 4.3% |
| $25,000 to $34,999 | 7 | 7.6% |
| $35,000 to $49,999 | 2 | 2.2% |
| $50,000 to $74,999 | 8 | 8.7% |
| $75,000 to $99,999 | 39 | 42.4% |
| $100,000 to $149,999 | 10 | 10.9% |
| $150,000 to $199,999 | 11 | 12.0% |
| $200,000+ | 10 | 10.9% |
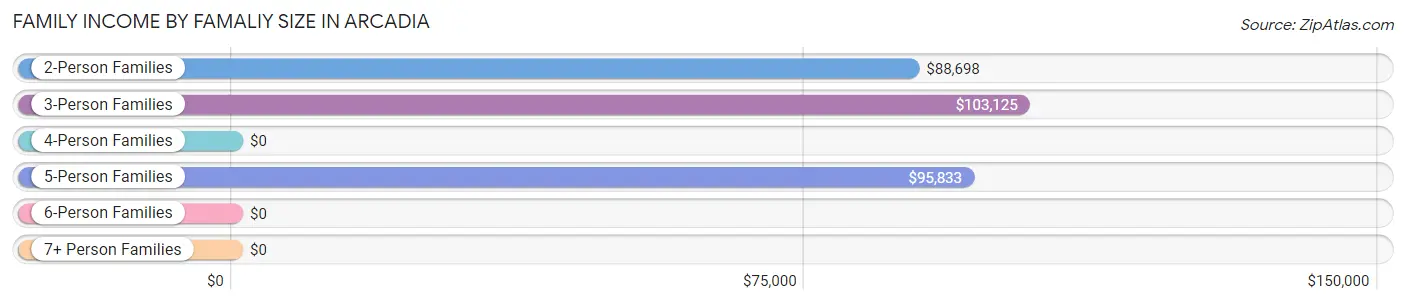
Family Income by Famaliy Size in Arcadia
3-person families (12 | 13.0%) account for the highest median family income in Arcadia with $103,125 per family, while 2-person families (67 | 72.8%) have the highest median income of $44,349 per family member.
| Income Bracket | # Families | Median Income |
| 2-Person Families | 67 (72.8%) | $88,698 |
| 3-Person Families | 12 (13.0%) | $103,125 |
| 4-Person Families | 3 (3.3%) | $0 |
| 5-Person Families | 10 (10.9%) | $95,833 |
| 6-Person Families | 0 (0.0%) | $0 |
| 7+ Person Families | 0 (0.0%) | $0 |
| Total | 92 (100.0%) | $89,063 |
Family Income by Number of Earners in Arcadia

| Number of Earners | # Families | Median Income |
| No Earners | 9 (9.8%) | $0 |
| 1 Earner | 37 (40.2%) | $88,594 |
| 2 Earners | 37 (40.2%) | $114,583 |
| 3+ Earners | 9 (9.8%) | $0 |
| Total | 92 (100.0%) | $89,063 |
Household Income in Arcadia
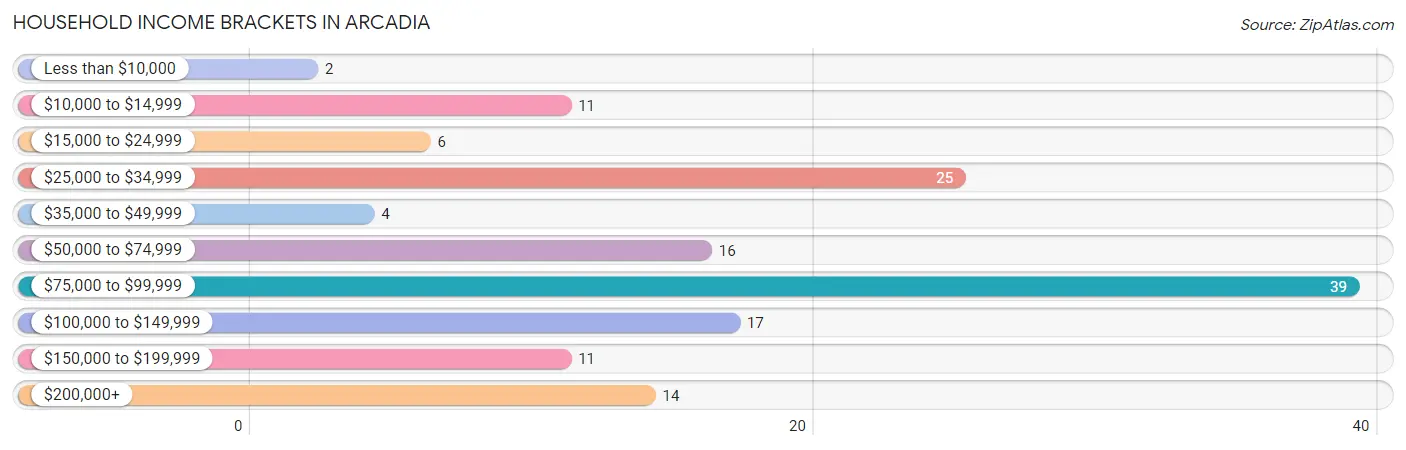
Household Income Brackets in Arcadia
With 39 households falling in the category, the $75,000 to $99,999 income range is the most frequent in Arcadia, accounting for 26.9% of all households. In contrast, only 2 households (1.4%) fall into the less than $10,000 income bracket, making it the least populous group.
| Income Bracket | # Households | % Households |
| Less than $10,000 | 2 | 1.4% |
| $10,000 to $14,999 | 11 | 7.6% |
| $15,000 to $24,999 | 6 | 4.1% |
| $25,000 to $34,999 | 25 | 17.2% |
| $35,000 to $49,999 | 4 | 2.8% |
| $50,000 to $74,999 | 16 | 11.0% |
| $75,000 to $99,999 | 39 | 26.9% |
| $100,000 to $149,999 | 17 | 11.7% |
| $150,000 to $199,999 | 11 | 7.6% |
| $200,000+ | 14 | 9.7% |
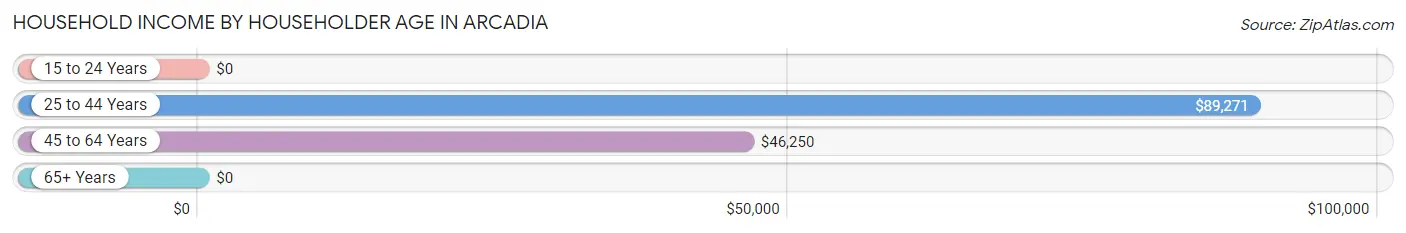
Household Income by Householder Age in Arcadia
The median household income in Arcadia is $86,875, with the highest median household income of $89,271 found in the 25 to 44 years age bracket for the primary householder. A total of 50 households (34.5%) fall into this category. Meanwhile, the 15 to 24 years age bracket for the primary householder has the lowest median household income of $0, with 6 households (4.1%) in this group.
| Income Bracket | # Households | Median Income |
| 15 to 24 Years | 6 (4.1%) | $0 |
| 25 to 44 Years | 50 (34.5%) | $89,271 |
| 45 to 64 Years | 35 (24.1%) | $46,250 |
| 65+ Years | 54 (37.2%) | $0 |
| Total | 145 (100.0%) | $86,875 |
Poverty in Arcadia
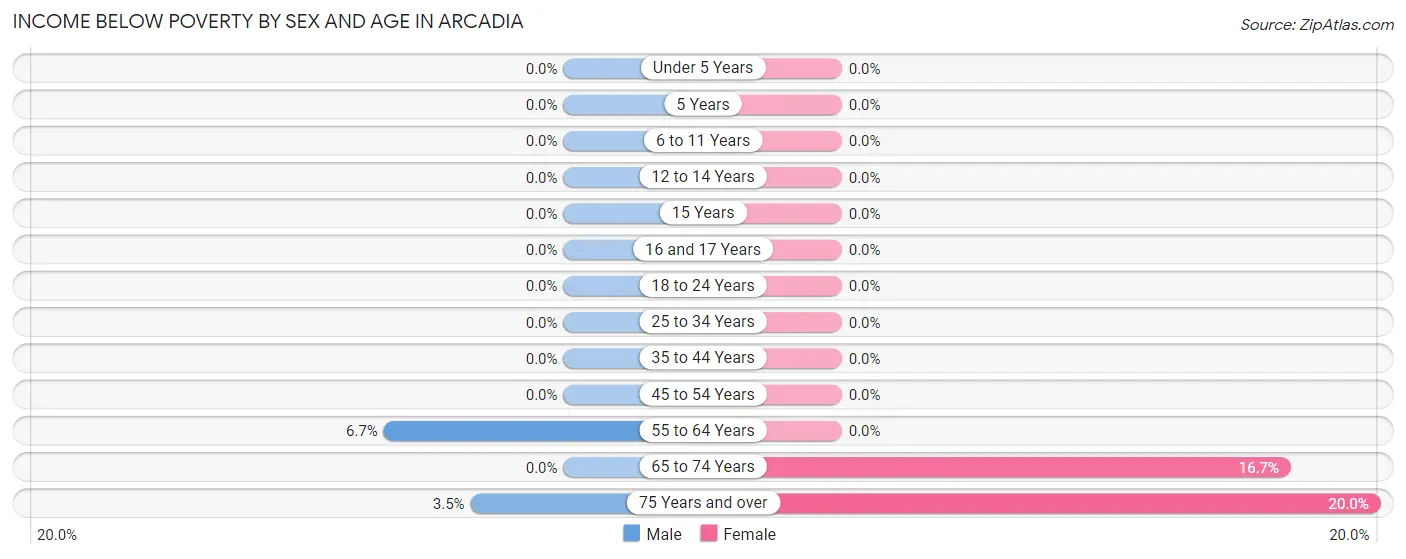
Income Below Poverty by Sex and Age in Arcadia
With 1.2% poverty level for males and 5.4% for females among the residents of Arcadia, 55 to 64 year old males and 75 year old and over females are the most vulnerable to poverty, with 1 males (6.7%) and 7 females (20.0%) in their respective age groups living below the poverty level.
| Age Bracket | Male | Female |
| Under 5 Years | 0 (0.0%) | 0 (0.0%) |
| 5 Years | 0 (0.0%) | 0 (0.0%) |
| 6 to 11 Years | 0 (0.0%) | 0 (0.0%) |
| 12 to 14 Years | 0 (0.0%) | 0 (0.0%) |
| 15 Years | 0 (0.0%) | 0 (0.0%) |
| 16 and 17 Years | 0 (0.0%) | 0 (0.0%) |
| 18 to 24 Years | 0 (0.0%) | 0 (0.0%) |
| 25 to 34 Years | 0 (0.0%) | 0 (0.0%) |
| 35 to 44 Years | 0 (0.0%) | 0 (0.0%) |
| 45 to 54 Years | 0 (0.0%) | 0 (0.0%) |
| 55 to 64 Years | 1 (6.7%) | 0 (0.0%) |
| 65 to 74 Years | 0 (0.0%) | 2 (16.7%) |
| 75 Years and over | 1 (3.5%) | 7 (20.0%) |
| Total | 2 (1.2%) | 9 (5.4%) |
Income Above Poverty by Sex and Age in Arcadia
According to the poverty statistics in Arcadia, males aged under 5 years and females aged under 5 years are the age groups that are most secure financially, with 100.0% of males and 100.0% of females in these age groups living above the poverty line.
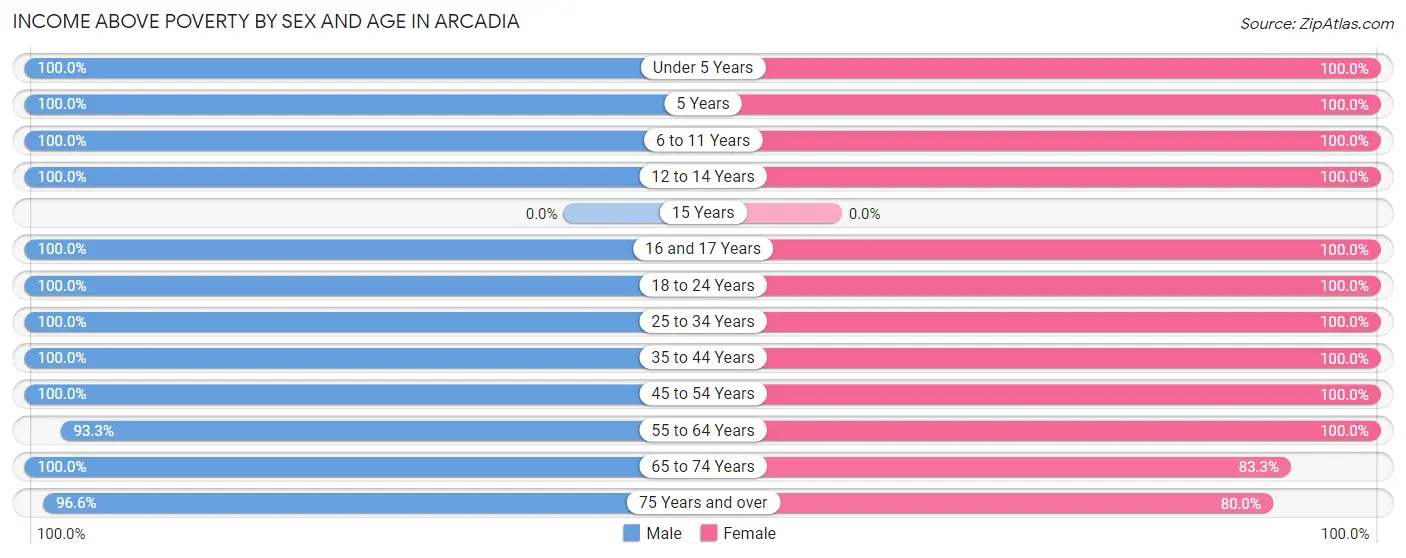
| Age Bracket | Male | Female |
| Under 5 Years | 1 (100.0%) | 3 (100.0%) |
| 5 Years | 1 (100.0%) | 3 (100.0%) |
| 6 to 11 Years | 10 (100.0%) | 4 (100.0%) |
| 12 to 14 Years | 26 (100.0%) | 7 (100.0%) |
| 15 Years | 0 (0.0%) | 0 (0.0%) |
| 16 and 17 Years | 8 (100.0%) | 2 (100.0%) |
| 18 to 24 Years | 17 (100.0%) | 17 (100.0%) |
| 25 to 34 Years | 25 (100.0%) | 3 (100.0%) |
| 35 to 44 Years | 6 (100.0%) | 37 (100.0%) |
| 45 to 54 Years | 24 (100.0%) | 22 (100.0%) |
| 55 to 64 Years | 14 (93.3%) | 22 (100.0%) |
| 65 to 74 Years | 4 (100.0%) | 10 (83.3%) |
| 75 Years and over | 28 (96.6%) | 28 (80.0%) |
| Total | 164 (98.8%) | 158 (94.6%) |
Income Below Poverty Among Married-Couple Families in Arcadia
The poverty statistics for married-couple families in Arcadia show that 1.8% or 1 of the total 55 families live below the poverty line. Families with no children have the highest poverty rate of 2.1%, comprising of 1 families. On the other hand, families with 3 or 4 children have the lowest poverty rate of 0.0%, which includes 0 families.
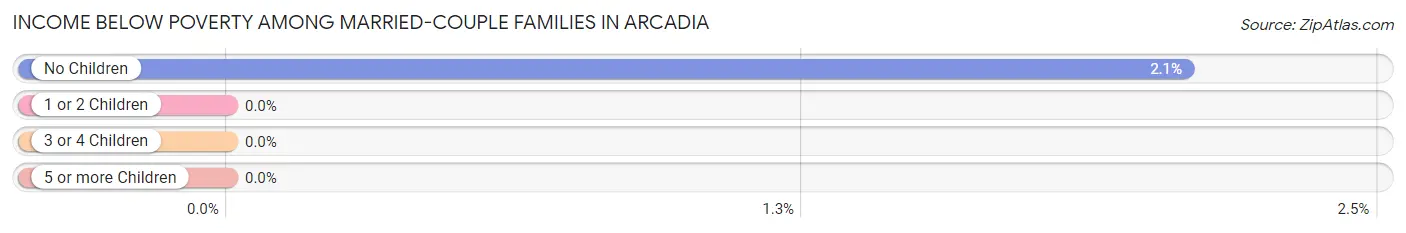
| Children | Above Poverty | Below Poverty |
| No Children | 47 (97.9%) | 1 (2.1%) |
| 1 or 2 Children | 0 (0.0%) | 0 (0.0%) |
| 3 or 4 Children | 7 (100.0%) | 0 (0.0%) |
| 5 or more Children | 0 (0.0%) | 0 (0.0%) |
| Total | 54 (98.2%) | 1 (1.8%) |
Income Below Poverty Among Single-Parent Households in Arcadia
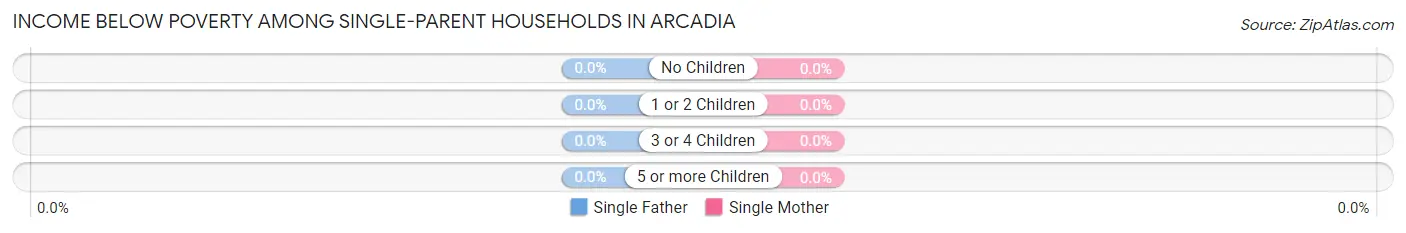
| Children | Single Father | Single Mother |
| No Children | 0 (0.0%) | 0 (0.0%) |
| 1 or 2 Children | 0 (0.0%) | 0 (0.0%) |
| 3 or 4 Children | 0 (0.0%) | 0 (0.0%) |
| 5 or more Children | 0 (0.0%) | 0 (0.0%) |
| Total | 0 (0.0%) | 0 (0.0%) |
Income Below Poverty Among Married-Couple vs Single-Parent Households in Arcadia
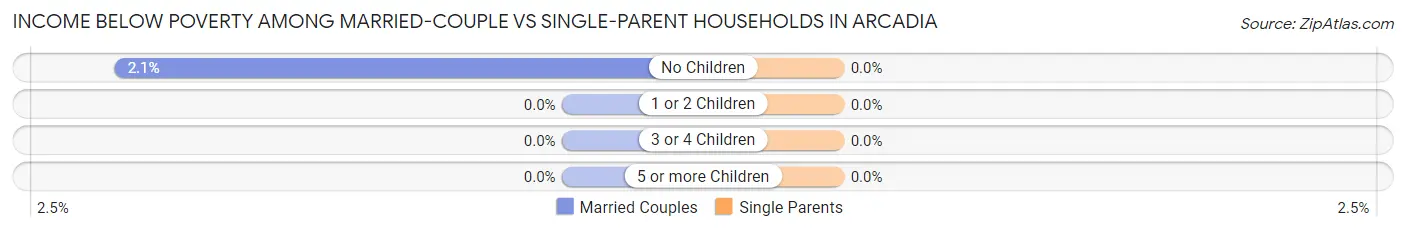
| Children | Married-Couple Families | Single-Parent Households |
| No Children | 1 (2.1%) | 0 (0.0%) |
| 1 or 2 Children | 0 (0.0%) | 0 (0.0%) |
| 3 or 4 Children | 0 (0.0%) | 0 (0.0%) |
| 5 or more Children | 0 (0.0%) | 0 (0.0%) |
| Total | 1 (1.8%) | 0 (0.0%) |
Employment Characteristics in Arcadia
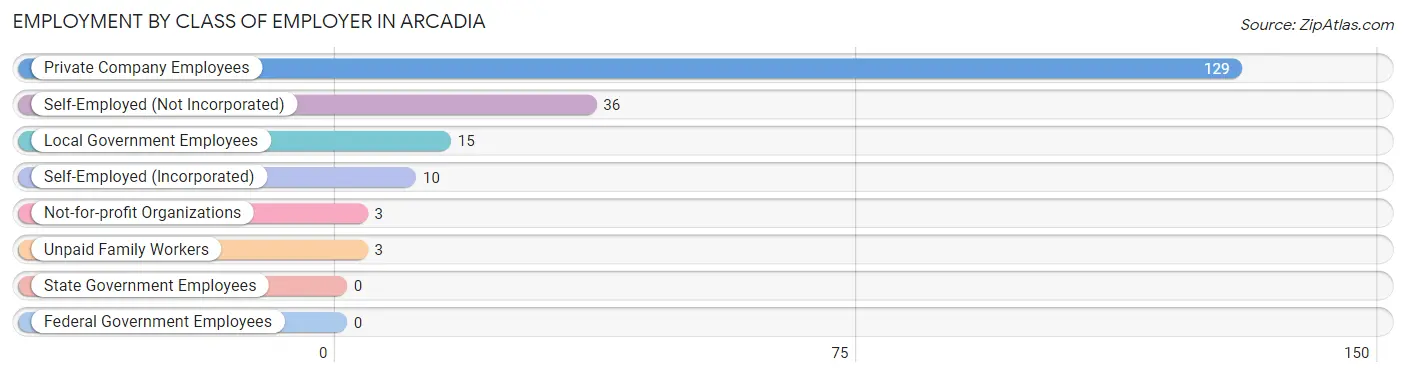
Employment by Class of Employer in Arcadia
Among the 196 employed individuals in Arcadia, private company employees (129 | 65.8%), self-employed (not incorporated) (36 | 18.4%), and local government employees (15 | 7.6%) make up the most common classes of employment.
| Employer Class | # Employees | % Employees |
| Private Company Employees | 129 | 65.8% |
| Self-Employed (Incorporated) | 10 | 5.1% |
| Self-Employed (Not Incorporated) | 36 | 18.4% |
| Not-for-profit Organizations | 3 | 1.5% |
| Local Government Employees | 15 | 7.6% |
| State Government Employees | 0 | 0.0% |
| Federal Government Employees | 0 | 0.0% |
| Unpaid Family Workers | 3 | 1.5% |
| Total | 196 | 100.0% |
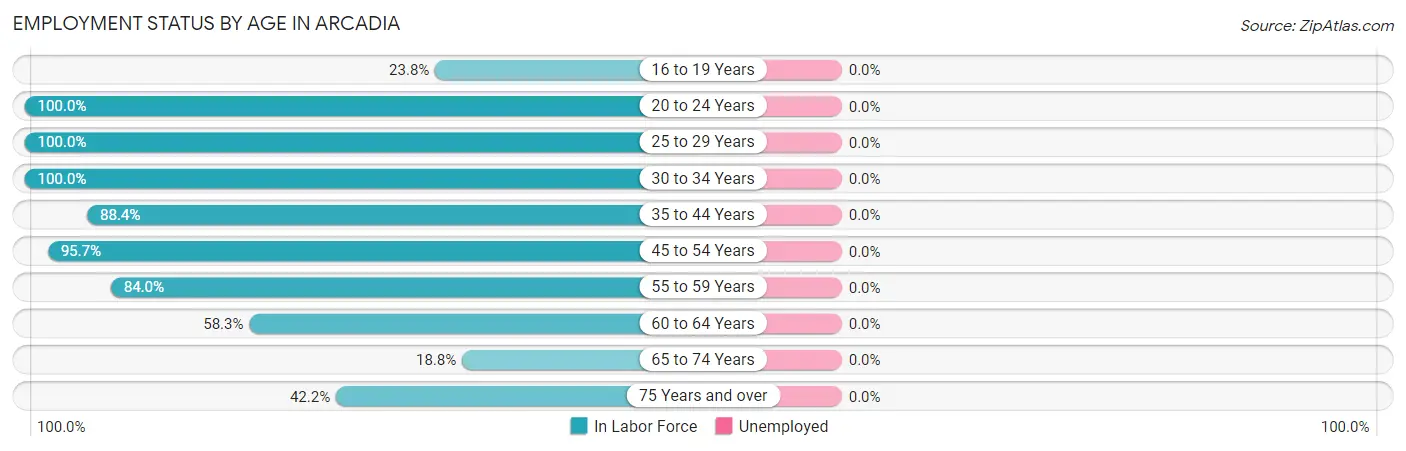
Employment Status by Age in Arcadia
| Age Bracket | In Labor Force | Unemployed |
| 16 to 19 Years | 5 (23.8%) | 0 (0.0%) |
| 20 to 24 Years | 23 (100.0%) | 0 (0.0%) |
| 25 to 29 Years | 15 (100.0%) | 0 (0.0%) |
| 30 to 34 Years | 13 (100.0%) | 0 (0.0%) |
| 35 to 44 Years | 38 (88.4%) | 0 (0.0%) |
| 45 to 54 Years | 44 (95.7%) | 0 (0.0%) |
| 55 to 59 Years | 21 (84.0%) | 0 (0.0%) |
| 60 to 64 Years | 7 (58.3%) | 0 (0.0%) |
| 65 to 74 Years | 3 (18.8%) | 0 (0.0%) |
| 75 Years and over | 27 (42.2%) | 0 (0.0%) |
| Total | 196 (70.5%) | 0 (0.0%) |
Employment Status by Educational Attainment in Arcadia

| Educational Attainment | In Labor Force | Unemployed |
| Less than High School | 4 (100.0%) | 0 (0.0%) |
| High School Diploma | 35 (85.4%) | 0 (0.0%) |
| College / Associate Degree | 45 (86.5%) | 0 (0.0%) |
| Bachelor's Degree or higher | 54 (94.7%) | 0 (0.0%) |
| Total | 138 (89.6%) | 0 (0.0%) |
Employment Occupations by Sex in Arcadia
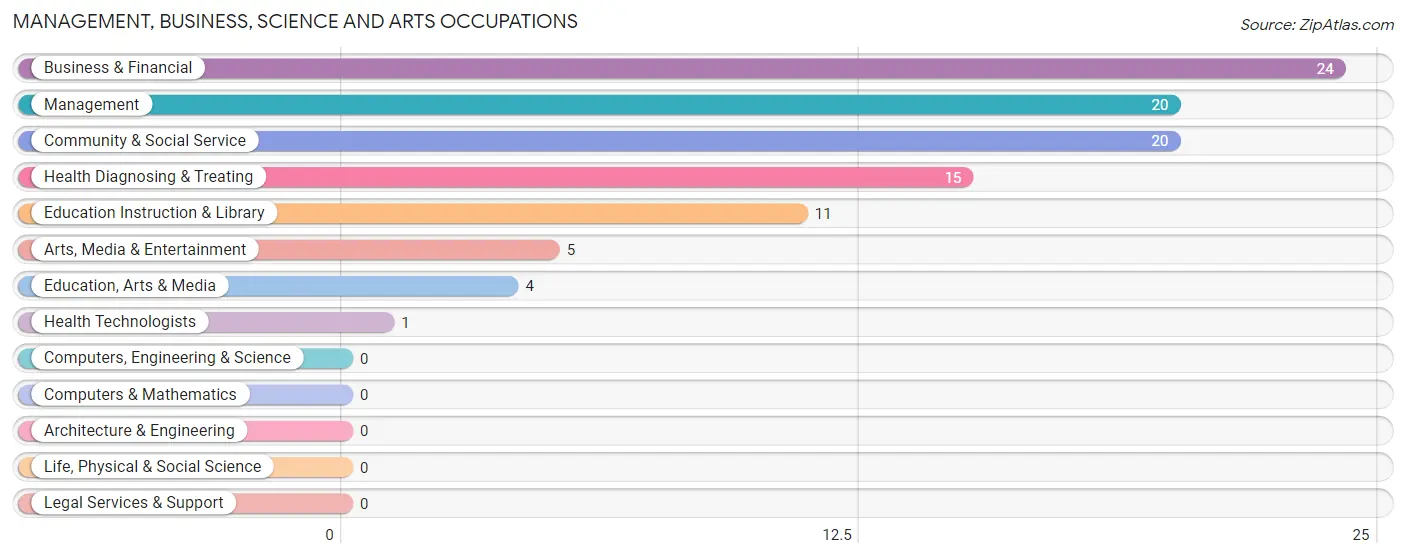
Management, Business, Science and Arts Occupations
The most common Management, Business, Science and Arts occupations in Arcadia are Business & Financial (24 | 12.2%), Management (20 | 10.2%), Community & Social Service (20 | 10.2%), Health Diagnosing & Treating (15 | 7.6%), and Education Instruction & Library (11 | 5.6%).
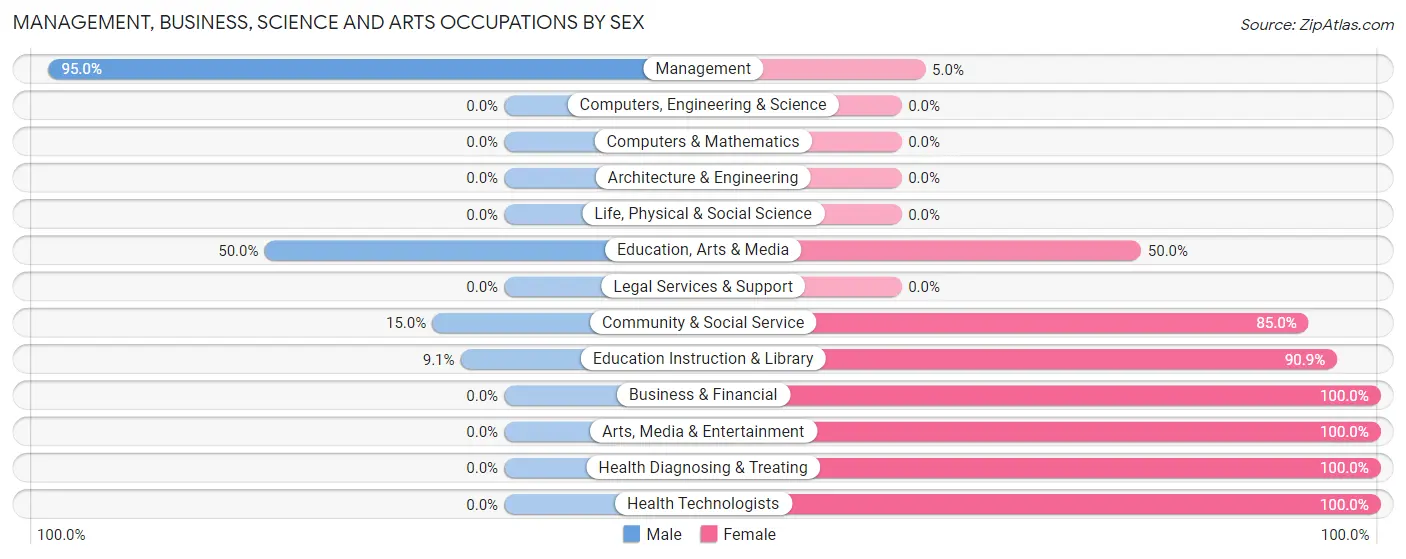
Management, Business, Science and Arts Occupations by Sex
Within the Management, Business, Science and Arts occupations in Arcadia, the most male-oriented occupations are Management (95.0%), Education, Arts & Media (50.0%), and Community & Social Service (15.0%), while the most female-oriented occupations are Business & Financial (100.0%), Arts, Media & Entertainment (100.0%), and Health Diagnosing & Treating (100.0%).
| Occupation | Male | Female |
| Management | 19 (95.0%) | 1 (5.0%) |
| Business & Financial | 0 (0.0%) | 24 (100.0%) |
| Computers, Engineering & Science | 0 (0.0%) | 0 (0.0%) |
| Computers & Mathematics | 0 (0.0%) | 0 (0.0%) |
| Architecture & Engineering | 0 (0.0%) | 0 (0.0%) |
| Life, Physical & Social Science | 0 (0.0%) | 0 (0.0%) |
| Community & Social Service | 3 (15.0%) | 17 (85.0%) |
| Education, Arts & Media | 2 (50.0%) | 2 (50.0%) |
| Legal Services & Support | 0 (0.0%) | 0 (0.0%) |
| Education Instruction & Library | 1 (9.1%) | 10 (90.9%) |
| Arts, Media & Entertainment | 0 (0.0%) | 5 (100.0%) |
| Health Diagnosing & Treating | 0 (0.0%) | 15 (100.0%) |
| Health Technologists | 0 (0.0%) | 1 (100.0%) |
| Total (Category) | 22 (27.9%) | 57 (72.2%) |
| Total (Overall) | 95 (48.5%) | 101 (51.5%) |
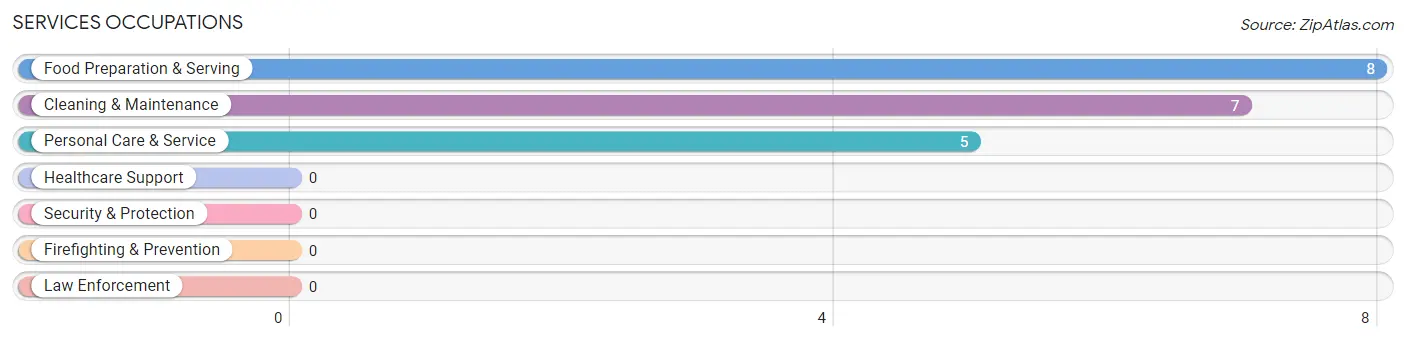
Services Occupations
The most common Services occupations in Arcadia are Food Preparation & Serving (8 | 4.1%), Cleaning & Maintenance (7 | 3.6%), and Personal Care & Service (5 | 2.5%).
Services Occupations by Sex
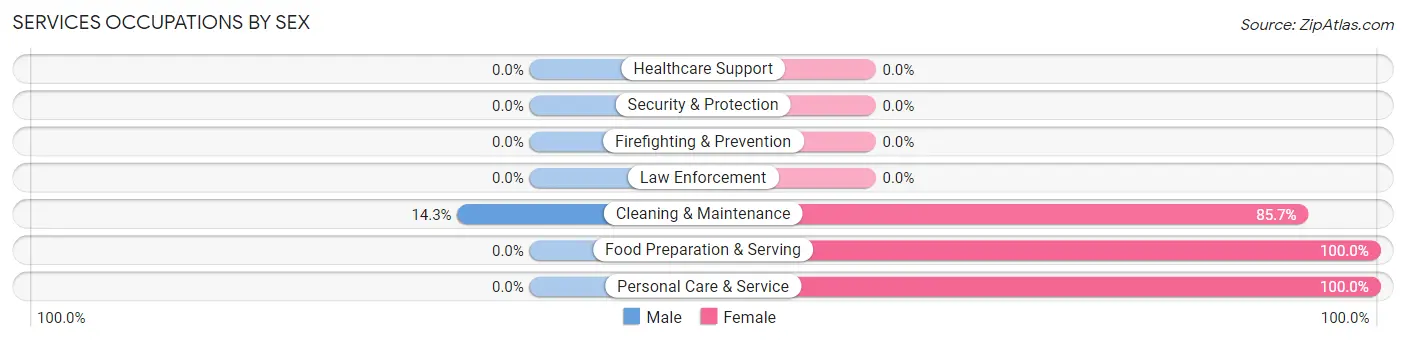
| Occupation | Male | Female |
| Healthcare Support | 0 (0.0%) | 0 (0.0%) |
| Security & Protection | 0 (0.0%) | 0 (0.0%) |
| Firefighting & Prevention | 0 (0.0%) | 0 (0.0%) |
| Law Enforcement | 0 (0.0%) | 0 (0.0%) |
| Food Preparation & Serving | 0 (0.0%) | 8 (100.0%) |
| Cleaning & Maintenance | 1 (14.3%) | 6 (85.7%) |
| Personal Care & Service | 0 (0.0%) | 5 (100.0%) |
| Total (Category) | 1 (5.0%) | 19 (95.0%) |
| Total (Overall) | 95 (48.5%) | 101 (51.5%) |
Sales and Office Occupations
The most common Sales and Office occupations in Arcadia are Office & Administration (21 | 10.7%), and Sales & Related (6 | 3.1%).

Sales and Office Occupations by Sex

| Occupation | Male | Female |
| Sales & Related | 4 (66.7%) | 2 (33.3%) |
| Office & Administration | 4 (19.1%) | 17 (80.9%) |
| Total (Category) | 8 (29.6%) | 19 (70.4%) |
| Total (Overall) | 95 (48.5%) | 101 (51.5%) |
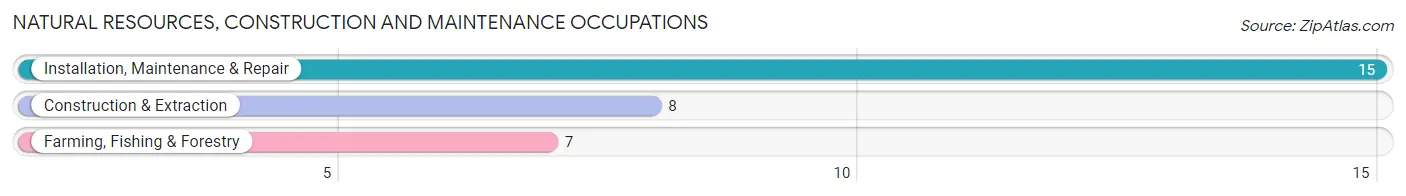
Natural Resources, Construction and Maintenance Occupations
The most common Natural Resources, Construction and Maintenance occupations in Arcadia are Installation, Maintenance & Repair (15 | 7.6%), Construction & Extraction (8 | 4.1%), and Farming, Fishing & Forestry (7 | 3.6%).
Natural Resources, Construction and Maintenance Occupations by Sex

| Occupation | Male | Female |
| Farming, Fishing & Forestry | 7 (100.0%) | 0 (0.0%) |
| Construction & Extraction | 8 (100.0%) | 0 (0.0%) |
| Installation, Maintenance & Repair | 15 (100.0%) | 0 (0.0%) |
| Total (Category) | 30 (100.0%) | 0 (0.0%) |
| Total (Overall) | 95 (48.5%) | 101 (51.5%) |
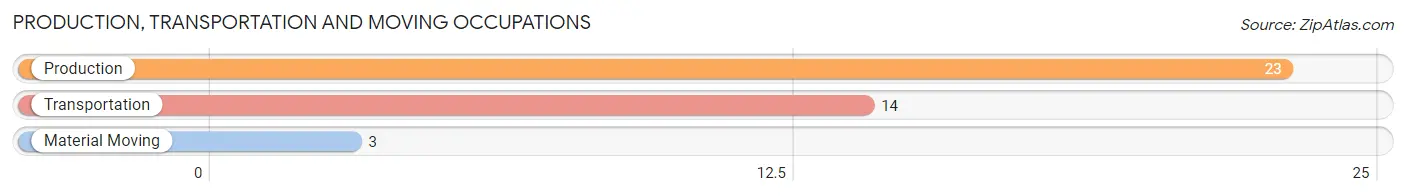
Production, Transportation and Moving Occupations
The most common Production, Transportation and Moving occupations in Arcadia are Production (23 | 11.7%), Transportation (14 | 7.1%), and Material Moving (3 | 1.5%).
Production, Transportation and Moving Occupations by Sex
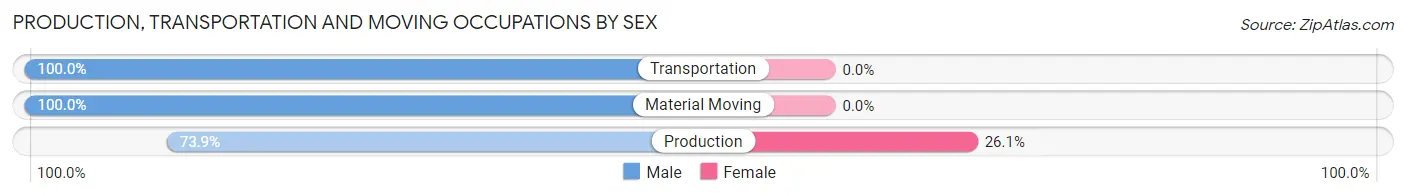
| Occupation | Male | Female |
| Production | 17 (73.9%) | 6 (26.1%) |
| Transportation | 14 (100.0%) | 0 (0.0%) |
| Material Moving | 3 (100.0%) | 0 (0.0%) |
| Total (Category) | 34 (85.0%) | 6 (15.0%) |
| Total (Overall) | 95 (48.5%) | 101 (51.5%) |
Employment Industries by Sex in Arcadia
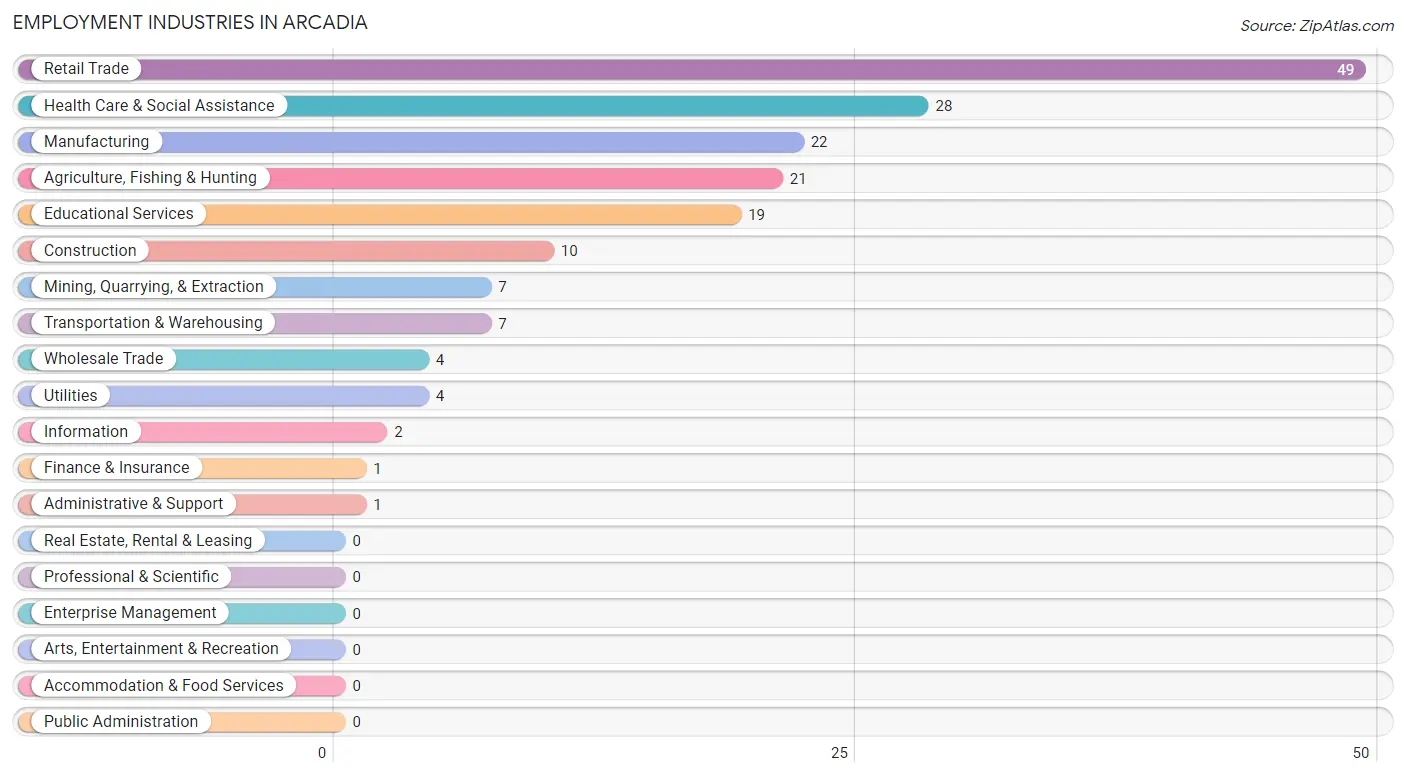
Employment Industries in Arcadia
The major employment industries in Arcadia include Retail Trade (49 | 25.0%), Health Care & Social Assistance (28 | 14.3%), Manufacturing (22 | 11.2%), Agriculture, Fishing & Hunting (21 | 10.7%), and Educational Services (19 | 9.7%).
Employment Industries by Sex in Arcadia
The Arcadia industries that see more men than women are Mining, Quarrying, & Extraction (100.0%), Wholesale Trade (100.0%), and Transportation & Warehousing (100.0%), whereas the industries that tend to have a higher number of women are Information (100.0%), Finance & Insurance (100.0%), and Health Care & Social Assistance (100.0%).
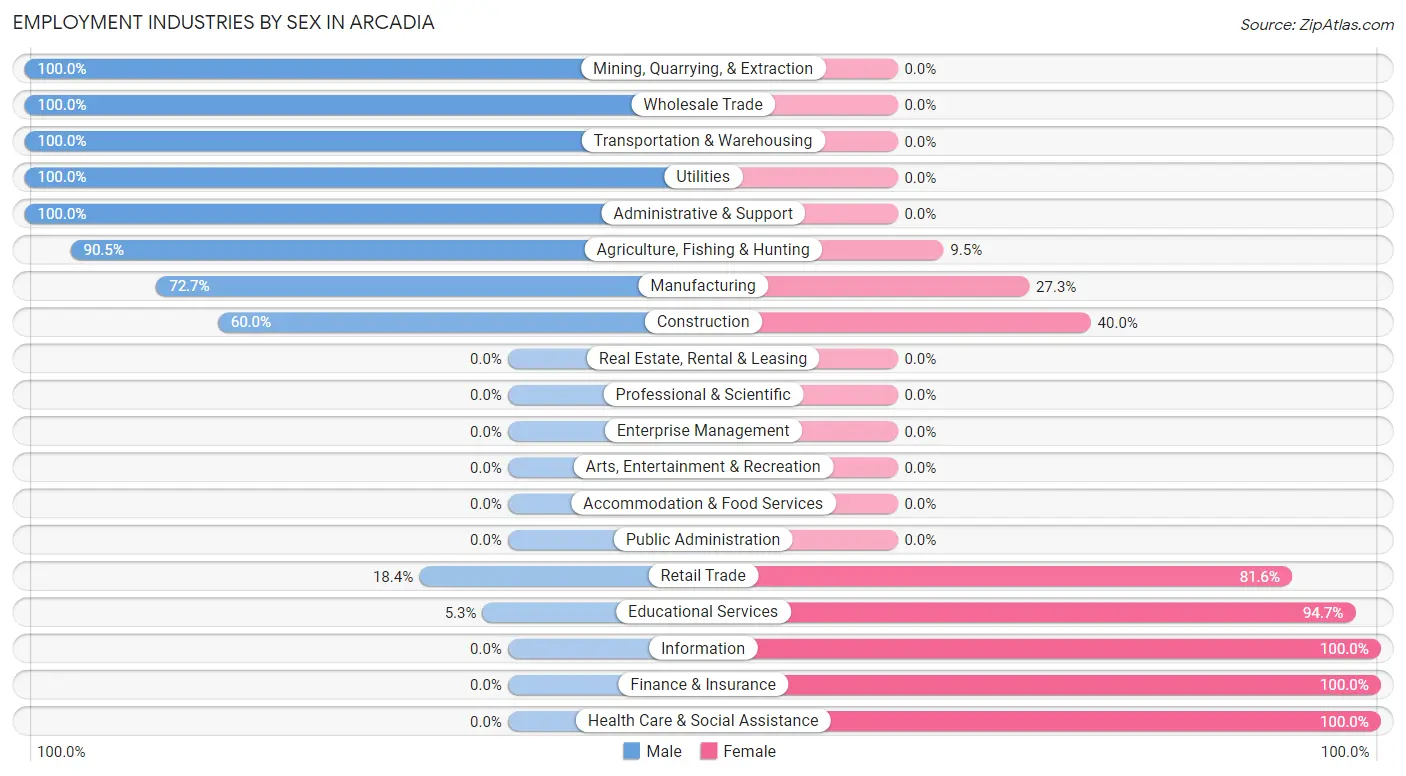
| Industry | Male | Female |
| Agriculture, Fishing & Hunting | 19 (90.5%) | 2 (9.5%) |
| Mining, Quarrying, & Extraction | 7 (100.0%) | 0 (0.0%) |
| Construction | 6 (60.0%) | 4 (40.0%) |
| Manufacturing | 16 (72.7%) | 6 (27.3%) |
| Wholesale Trade | 4 (100.0%) | 0 (0.0%) |
| Retail Trade | 9 (18.4%) | 40 (81.6%) |
| Transportation & Warehousing | 7 (100.0%) | 0 (0.0%) |
| Utilities | 4 (100.0%) | 0 (0.0%) |
| Information | 0 (0.0%) | 2 (100.0%) |
| Finance & Insurance | 0 (0.0%) | 1 (100.0%) |
| Real Estate, Rental & Leasing | 0 (0.0%) | 0 (0.0%) |
| Professional & Scientific | 0 (0.0%) | 0 (0.0%) |
| Enterprise Management | 0 (0.0%) | 0 (0.0%) |
| Administrative & Support | 1 (100.0%) | 0 (0.0%) |
| Educational Services | 1 (5.3%) | 18 (94.7%) |
| Health Care & Social Assistance | 0 (0.0%) | 28 (100.0%) |
| Arts, Entertainment & Recreation | 0 (0.0%) | 0 (0.0%) |
| Accommodation & Food Services | 0 (0.0%) | 0 (0.0%) |
| Public Administration | 0 (0.0%) | 0 (0.0%) |
| Total | 95 (48.5%) | 101 (51.5%) |
Education in Arcadia
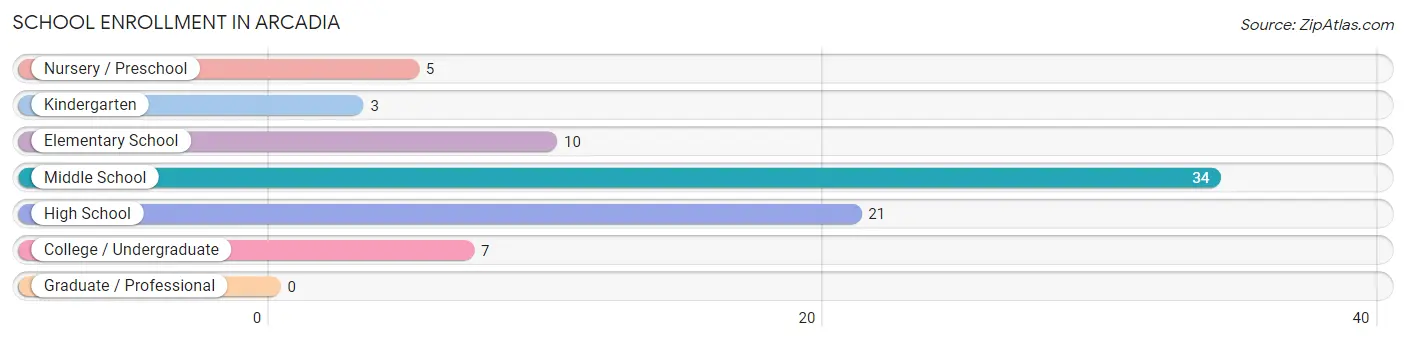
School Enrollment in Arcadia
The most common levels of schooling among the 80 students in Arcadia are middle school (34 | 42.5%), high school (21 | 26.3%), and elementary school (10 | 12.5%).
| School Level | # Students | % Students |
| Nursery / Preschool | 5 | 6.2% |
| Kindergarten | 3 | 3.7% |
| Elementary School | 10 | 12.5% |
| Middle School | 34 | 42.5% |
| High School | 21 | 26.3% |
| College / Undergraduate | 7 | 8.7% |
| Graduate / Professional | 0 | 0.0% |
| Total | 80 | 100.0% |
School Enrollment by Age by Funding Source in Arcadia
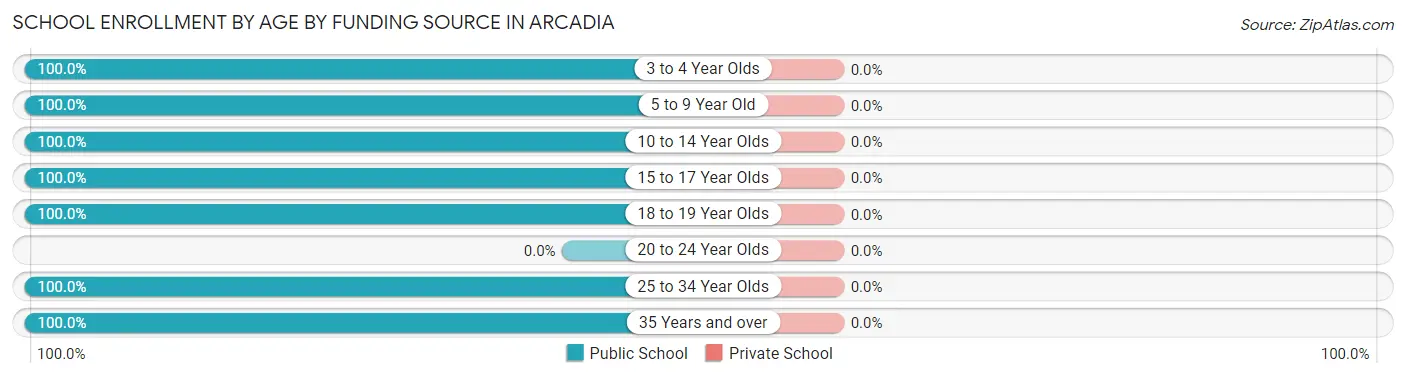
| Age Bracket | Public School | Private School |
| 3 to 4 Year Olds | 1 (100.0%) | 0 (0.0%) |
| 5 to 9 Year Old | 14 (100.0%) | 0 (0.0%) |
| 10 to 14 Year Olds | 37 (100.0%) | 0 (0.0%) |
| 15 to 17 Year Olds | 10 (100.0%) | 0 (0.0%) |
| 18 to 19 Year Olds | 11 (100.0%) | 0 (0.0%) |
| 20 to 24 Year Olds | 0 (0.0%) | 0 (0.0%) |
| 25 to 34 Year Olds | 5 (100.0%) | 0 (0.0%) |
| 35 Years and over | 2 (100.0%) | 0 (0.0%) |
| Total | 80 (100.0%) | 0 (0.0%) |
Educational Attainment by Field of Study in Arcadia
Psychology (30 | 41.7%), education (24 | 33.3%), arts & humanities (6 | 8.3%), business (5 | 6.9%), and social sciences (2 | 2.8%) are the most common fields of study among 72 individuals in Arcadia who have obtained a bachelor's degree or higher.
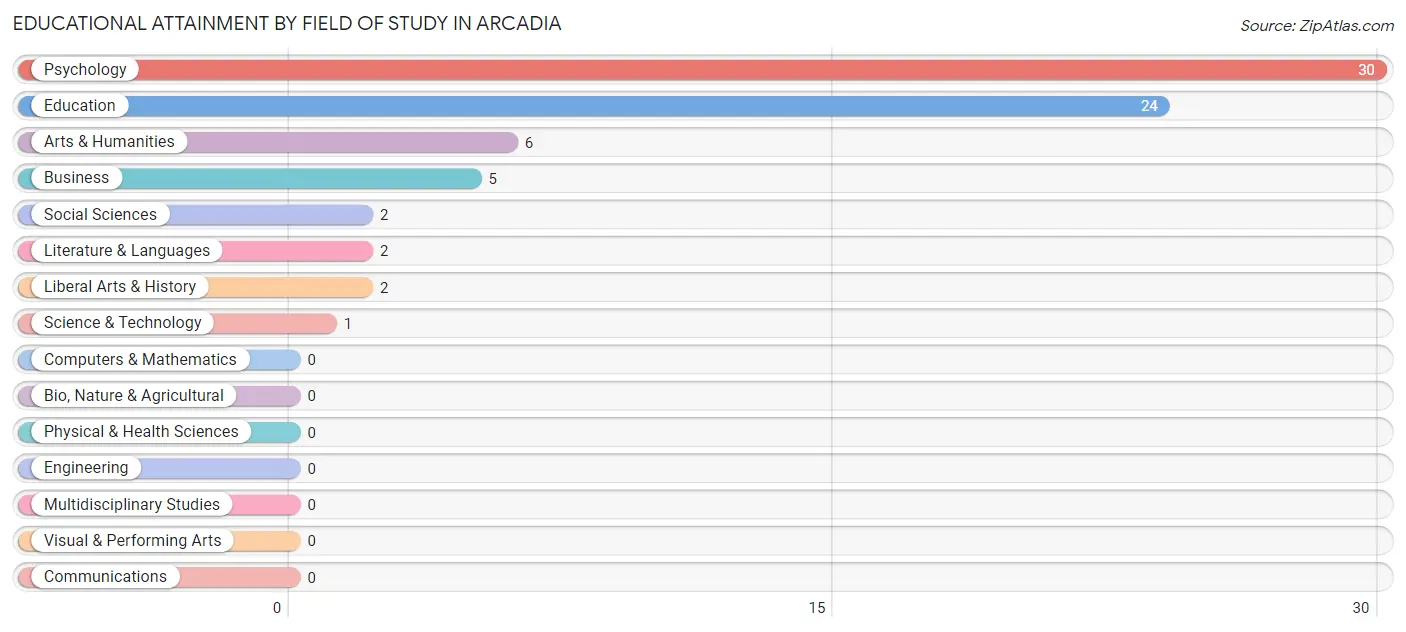
| Field of Study | # Graduates | % Graduates |
| Computers & Mathematics | 0 | 0.0% |
| Bio, Nature & Agricultural | 0 | 0.0% |
| Physical & Health Sciences | 0 | 0.0% |
| Psychology | 30 | 41.7% |
| Social Sciences | 2 | 2.8% |
| Engineering | 0 | 0.0% |
| Multidisciplinary Studies | 0 | 0.0% |
| Science & Technology | 1 | 1.4% |
| Business | 5 | 6.9% |
| Education | 24 | 33.3% |
| Literature & Languages | 2 | 2.8% |
| Liberal Arts & History | 2 | 2.8% |
| Visual & Performing Arts | 0 | 0.0% |
| Communications | 0 | 0.0% |
| Arts & Humanities | 6 | 8.3% |
| Total | 72 | 100.0% |
Transportation & Commute in Arcadia
Vehicle Availability by Sex in Arcadia
The most prevalent vehicle ownership categories in Arcadia are males with 3 vehicles (40, accounting for 42.1%) and females with 3 vehicles (23, making up 39.6%).
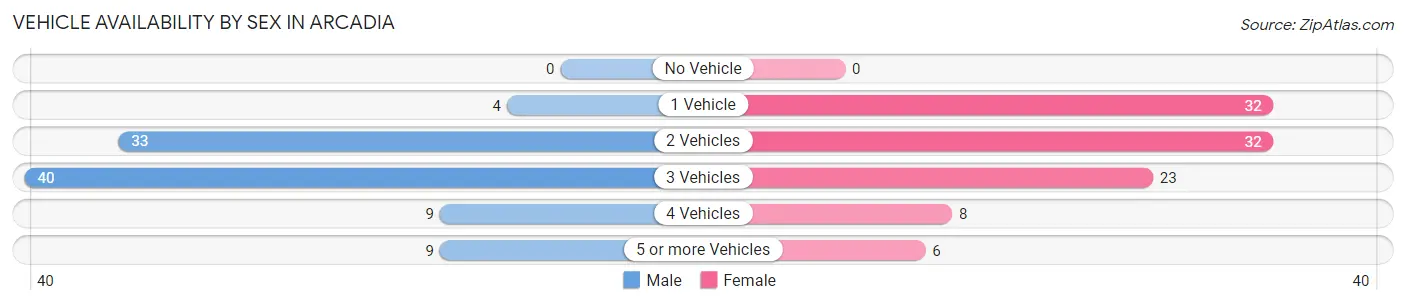
| Vehicles Available | Male | Female |
| No Vehicle | 0 (0.0%) | 0 (0.0%) |
| 1 Vehicle | 4 (4.2%) | 32 (31.7%) |
| 2 Vehicles | 33 (34.7%) | 32 (31.7%) |
| 3 Vehicles | 40 (42.1%) | 23 (22.8%) |
| 4 Vehicles | 9 (9.5%) | 8 (7.9%) |
| 5 or more Vehicles | 9 (9.5%) | 6 (5.9%) |
| Total | 95 (100.0%) | 101 (100.0%) |
Commute Time in Arcadia
The most frequently occuring commute durations in Arcadia are less than 5 minutes (77 commuters, 39.3%), 60 to 89 minutes (31 commuters, 15.8%), and 30 to 34 minutes (29 commuters, 14.8%).
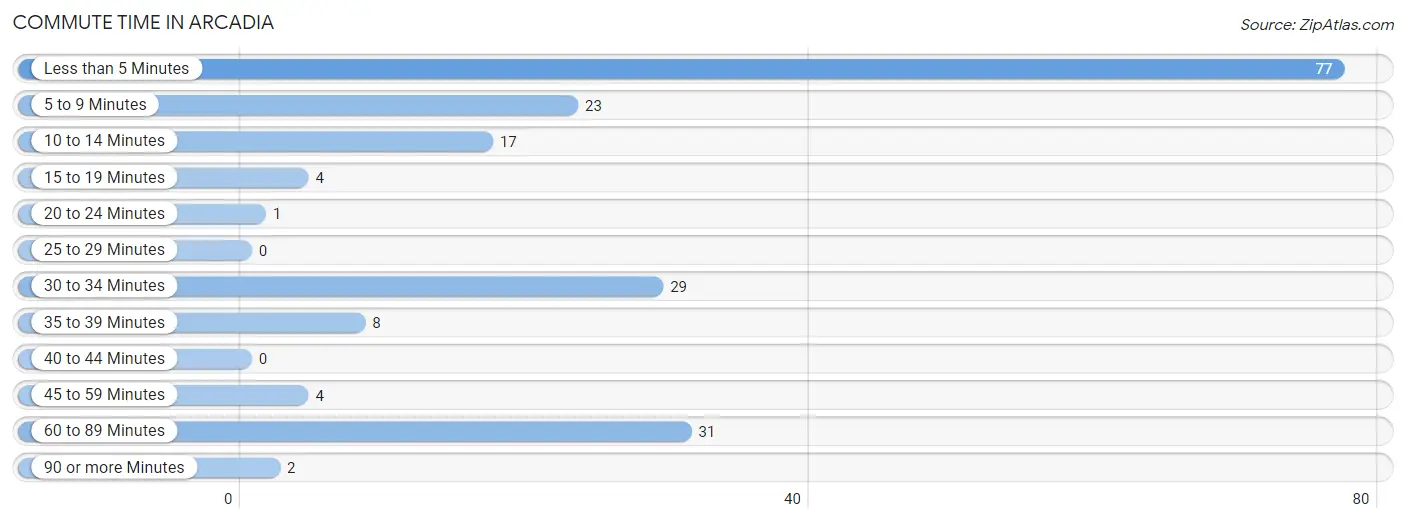
| Commute Time | # Commuters | % Commuters |
| Less than 5 Minutes | 77 | 39.3% |
| 5 to 9 Minutes | 23 | 11.7% |
| 10 to 14 Minutes | 17 | 8.7% |
| 15 to 19 Minutes | 4 | 2.0% |
| 20 to 24 Minutes | 1 | 0.5% |
| 25 to 29 Minutes | 0 | 0.0% |
| 30 to 34 Minutes | 29 | 14.8% |
| 35 to 39 Minutes | 8 | 4.1% |
| 40 to 44 Minutes | 0 | 0.0% |
| 45 to 59 Minutes | 4 | 2.0% |
| 60 to 89 Minutes | 31 | 15.8% |
| 90 or more Minutes | 2 | 1.0% |
Commute Time by Sex in Arcadia
The most common commute times in Arcadia are less than 5 minutes (34 commuters, 35.8%) for males and less than 5 minutes (43 commuters, 42.6%) for females.
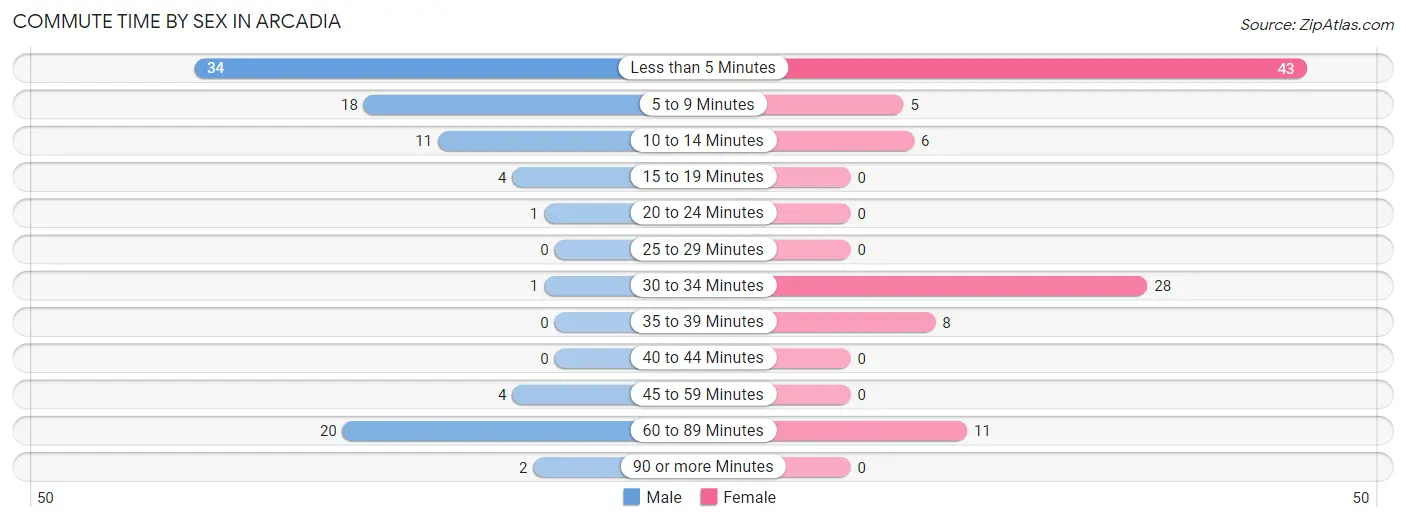
| Commute Time | Male | Female |
| Less than 5 Minutes | 34 (35.8%) | 43 (42.6%) |
| 5 to 9 Minutes | 18 (19.0%) | 5 (5.0%) |
| 10 to 14 Minutes | 11 (11.6%) | 6 (5.9%) |
| 15 to 19 Minutes | 4 (4.2%) | 0 (0.0%) |
| 20 to 24 Minutes | 1 (1.1%) | 0 (0.0%) |
| 25 to 29 Minutes | 0 (0.0%) | 0 (0.0%) |
| 30 to 34 Minutes | 1 (1.1%) | 28 (27.7%) |
| 35 to 39 Minutes | 0 (0.0%) | 8 (7.9%) |
| 40 to 44 Minutes | 0 (0.0%) | 0 (0.0%) |
| 45 to 59 Minutes | 4 (4.2%) | 0 (0.0%) |
| 60 to 89 Minutes | 20 (21.0%) | 11 (10.9%) |
| 90 or more Minutes | 2 (2.1%) | 0 (0.0%) |
Time of Departure to Work by Sex in Arcadia
The most frequent times of departure to work in Arcadia are 7:00 AM to 7:29 AM (26, 27.4%) for males and 6:00 AM to 6:29 AM (24, 23.8%) for females.
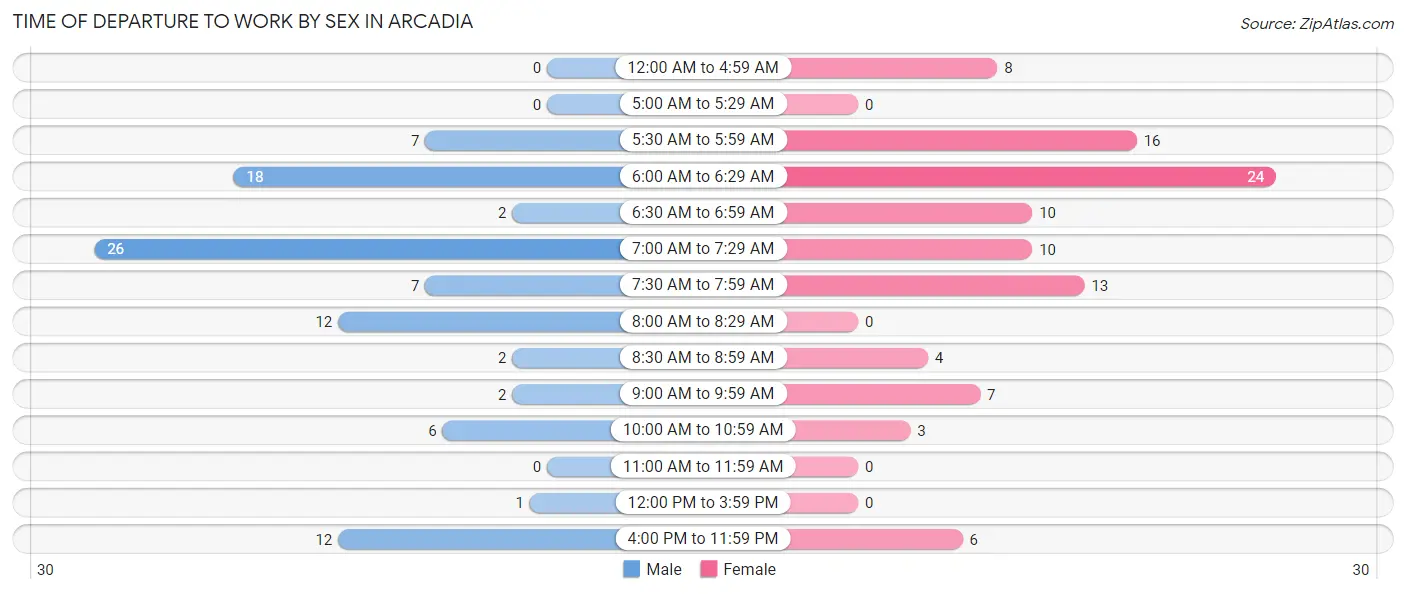
| Time of Departure | Male | Female |
| 12:00 AM to 4:59 AM | 0 (0.0%) | 8 (7.9%) |
| 5:00 AM to 5:29 AM | 0 (0.0%) | 0 (0.0%) |
| 5:30 AM to 5:59 AM | 7 (7.4%) | 16 (15.8%) |
| 6:00 AM to 6:29 AM | 18 (19.0%) | 24 (23.8%) |
| 6:30 AM to 6:59 AM | 2 (2.1%) | 10 (9.9%) |
| 7:00 AM to 7:29 AM | 26 (27.4%) | 10 (9.9%) |
| 7:30 AM to 7:59 AM | 7 (7.4%) | 13 (12.9%) |
| 8:00 AM to 8:29 AM | 12 (12.6%) | 0 (0.0%) |
| 8:30 AM to 8:59 AM | 2 (2.1%) | 4 (4.0%) |
| 9:00 AM to 9:59 AM | 2 (2.1%) | 7 (6.9%) |
| 10:00 AM to 10:59 AM | 6 (6.3%) | 3 (3.0%) |
| 11:00 AM to 11:59 AM | 0 (0.0%) | 0 (0.0%) |
| 12:00 PM to 3:59 PM | 1 (1.1%) | 0 (0.0%) |
| 4:00 PM to 11:59 PM | 12 (12.6%) | 6 (5.9%) |
| Total | 95 (100.0%) | 101 (100.0%) |
Housing Occupancy in Arcadia
Occupancy by Ownership in Arcadia
Of the total 145 dwellings in Arcadia, owner-occupied units account for 115 (79.3%), while renter-occupied units make up 30 (20.7%).
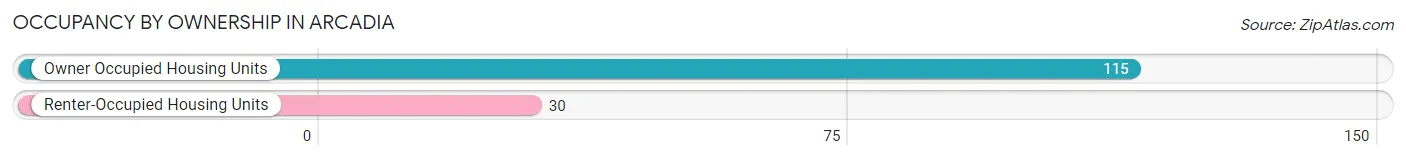
| Occupancy | # Housing Units | % Housing Units |
| Owner Occupied Housing Units | 115 | 79.3% |
| Renter-Occupied Housing Units | 30 | 20.7% |
| Total Occupied Housing Units | 145 | 100.0% |
Occupancy by Household Size in Arcadia
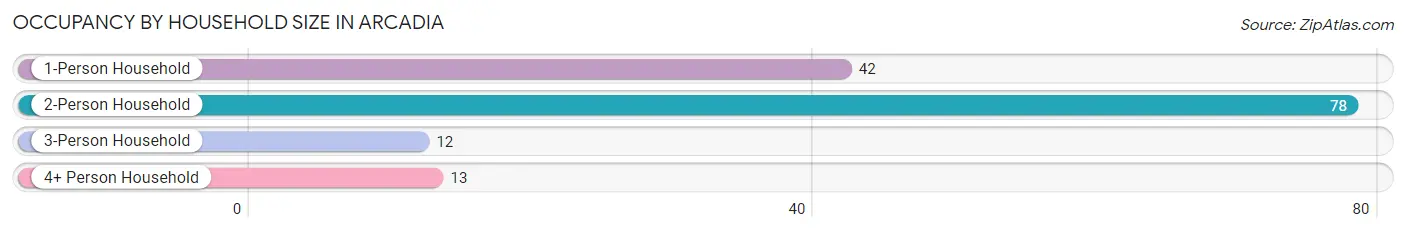
| Household Size | # Housing Units | % Housing Units |
| 1-Person Household | 42 | 29.0% |
| 2-Person Household | 78 | 53.8% |
| 3-Person Household | 12 | 8.3% |
| 4+ Person Household | 13 | 9.0% |
| Total Housing Units | 145 | 100.0% |
Occupancy by Ownership by Household Size in Arcadia
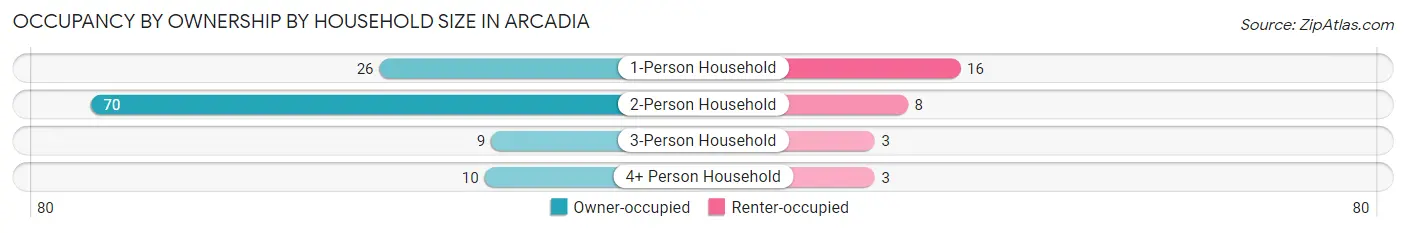
| Household Size | Owner-occupied | Renter-occupied |
| 1-Person Household | 26 (61.9%) | 16 (38.1%) |
| 2-Person Household | 70 (89.7%) | 8 (10.3%) |
| 3-Person Household | 9 (75.0%) | 3 (25.0%) |
| 4+ Person Household | 10 (76.9%) | 3 (23.1%) |
| Total Housing Units | 115 (79.3%) | 30 (20.7%) |
Occupancy by Educational Attainment in Arcadia
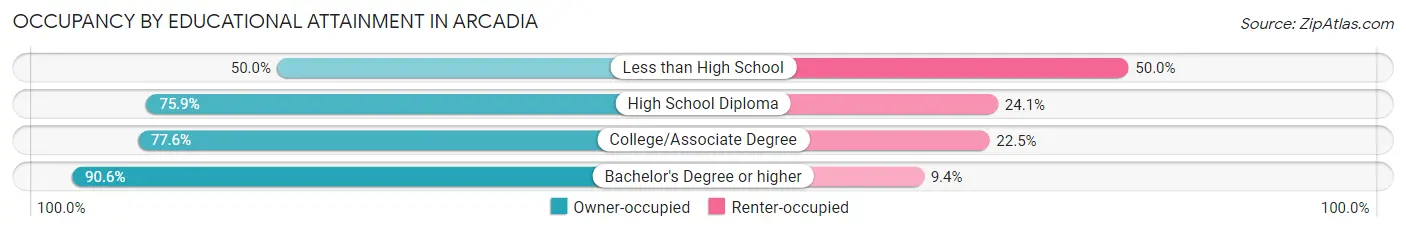
| Household Size | Owner-occupied | Renter-occupied |
| Less than High School | 7 (50.0%) | 7 (50.0%) |
| High School Diploma | 22 (75.9%) | 7 (24.1%) |
| College/Associate Degree | 38 (77.5%) | 11 (22.5%) |
| Bachelor's Degree or higher | 48 (90.6%) | 5 (9.4%) |
Occupancy by Age of Householder in Arcadia
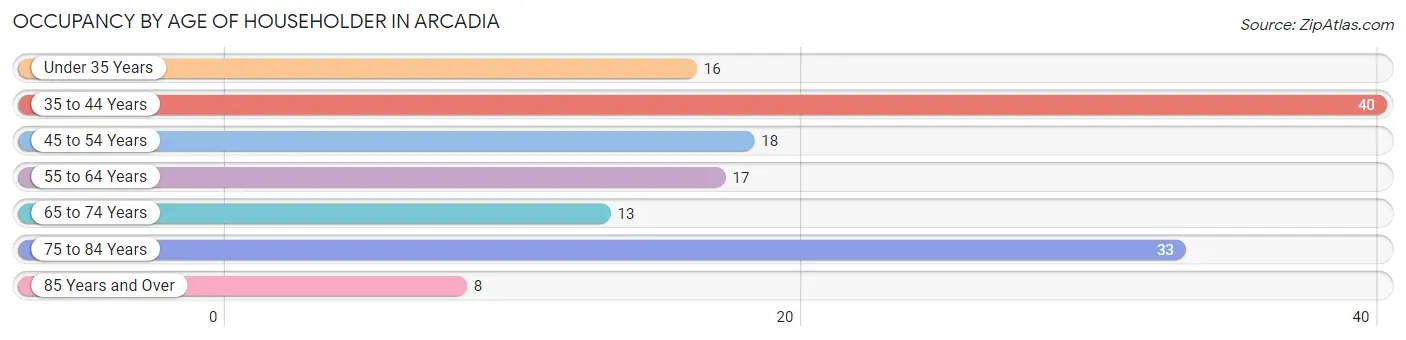
| Age Bracket | # Households | % Households |
| Under 35 Years | 16 | 11.0% |
| 35 to 44 Years | 40 | 27.6% |
| 45 to 54 Years | 18 | 12.4% |
| 55 to 64 Years | 17 | 11.7% |
| 65 to 74 Years | 13 | 9.0% |
| 75 to 84 Years | 33 | 22.8% |
| 85 Years and Over | 8 | 5.5% |
| Total | 145 | 100.0% |
Housing Finances in Arcadia
Median Income by Occupancy in Arcadia
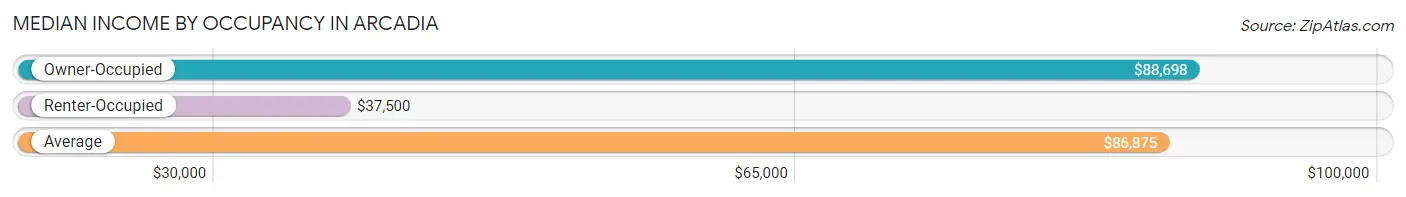
| Occupancy Type | # Households | Median Income |
| Owner-Occupied | 115 (79.3%) | $88,698 |
| Renter-Occupied | 30 (20.7%) | $37,500 |
| Average | 145 (100.0%) | $86,875 |
Occupancy by Householder Income Bracket in Arcadia

| Income Bracket | Owner-occupied | Renter-occupied |
| Less than $5,000 | 1 (0.9%) | 0 (0.0%) |
| $5,000 to $9,999 | 1 (0.9%) | 0 (0.0%) |
| $10,000 to $14,999 | 5 (4.3%) | 6 (20.0%) |
| $15,000 to $19,999 | 0 (0.0%) | 0 (0.0%) |
| $20,000 to $24,999 | 4 (3.5%) | 2 (6.7%) |
| $25,000 to $34,999 | 18 (15.7%) | 7 (23.3%) |
| $35,000 to $49,999 | 2 (1.7%) | 2 (6.7%) |
| $50,000 to $74,999 | 9 (7.8%) | 7 (23.3%) |
| $75,000 to $99,999 | 36 (31.3%) | 3 (10.0%) |
| $100,000 to $149,999 | 17 (14.8%) | 0 (0.0%) |
| $150,000 or more | 22 (19.1%) | 3 (10.0%) |
| Total | 115 (100.0%) | 30 (100.0%) |
Monthly Housing Cost Tiers in Arcadia
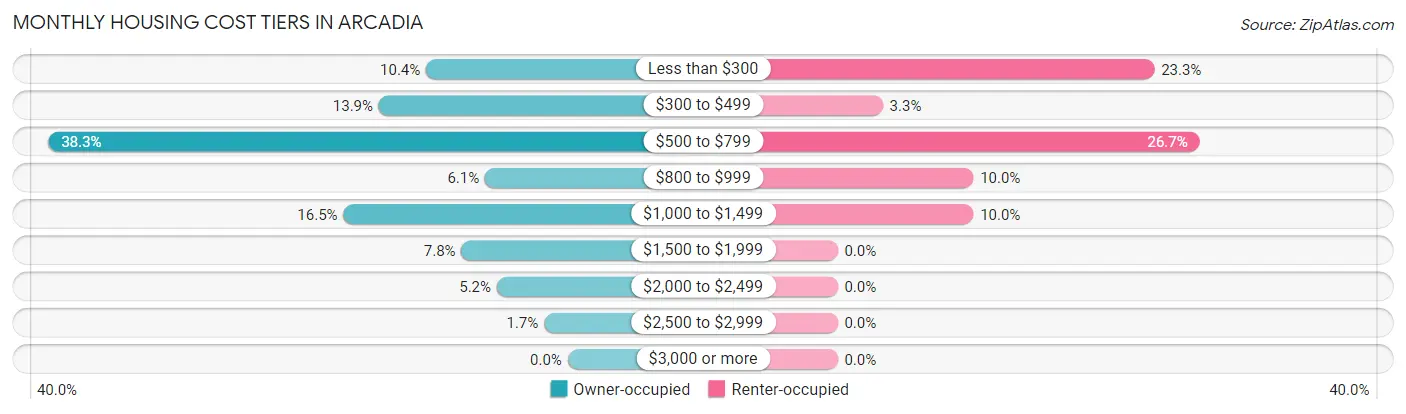
| Monthly Cost | Owner-occupied | Renter-occupied |
| Less than $300 | 12 (10.4%) | 7 (23.3%) |
| $300 to $499 | 16 (13.9%) | 1 (3.3%) |
| $500 to $799 | 44 (38.3%) | 8 (26.7%) |
| $800 to $999 | 7 (6.1%) | 3 (10.0%) |
| $1,000 to $1,499 | 19 (16.5%) | 3 (10.0%) |
| $1,500 to $1,999 | 9 (7.8%) | 0 (0.0%) |
| $2,000 to $2,499 | 6 (5.2%) | 0 (0.0%) |
| $2,500 to $2,999 | 2 (1.7%) | 0 (0.0%) |
| $3,000 or more | 0 (0.0%) | 0 (0.0%) |
| Total | 115 (100.0%) | 30 (100.0%) |
Physical Housing Characteristics in Arcadia
Housing Structures in Arcadia
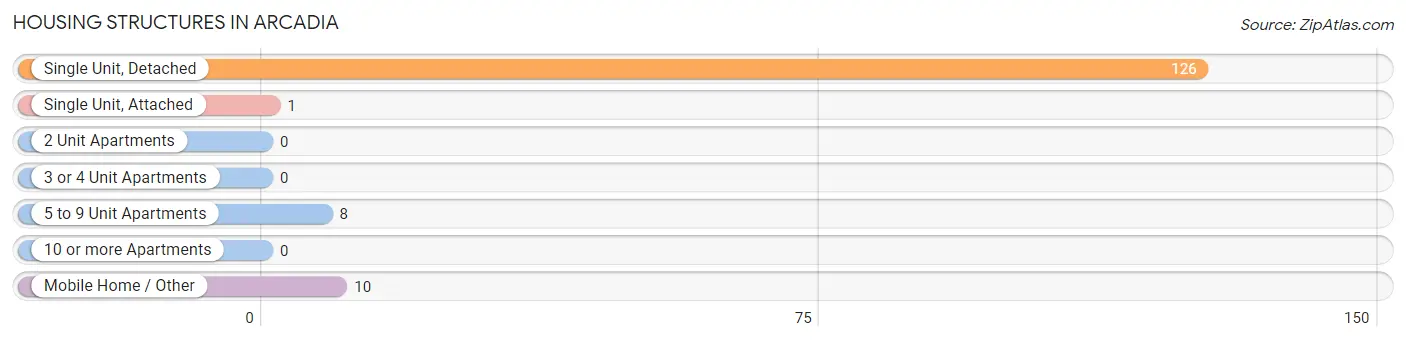
| Structure Type | # Housing Units | % Housing Units |
| Single Unit, Detached | 126 | 86.9% |
| Single Unit, Attached | 1 | 0.7% |
| 2 Unit Apartments | 0 | 0.0% |
| 3 or 4 Unit Apartments | 0 | 0.0% |
| 5 to 9 Unit Apartments | 8 | 5.5% |
| 10 or more Apartments | 0 | 0.0% |
| Mobile Home / Other | 10 | 6.9% |
| Total | 145 | 100.0% |
Housing Structures by Occupancy in Arcadia
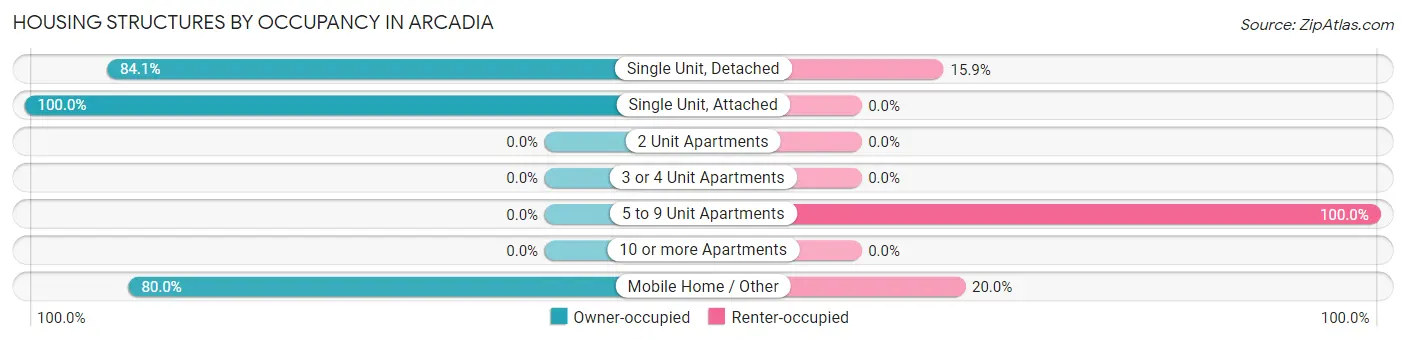
| Structure Type | Owner-occupied | Renter-occupied |
| Single Unit, Detached | 106 (84.1%) | 20 (15.9%) |
| Single Unit, Attached | 1 (100.0%) | 0 (0.0%) |
| 2 Unit Apartments | 0 (0.0%) | 0 (0.0%) |
| 3 or 4 Unit Apartments | 0 (0.0%) | 0 (0.0%) |
| 5 to 9 Unit Apartments | 0 (0.0%) | 8 (100.0%) |
| 10 or more Apartments | 0 (0.0%) | 0 (0.0%) |
| Mobile Home / Other | 8 (80.0%) | 2 (20.0%) |
| Total | 115 (79.3%) | 30 (20.7%) |
Housing Structures by Number of Rooms in Arcadia
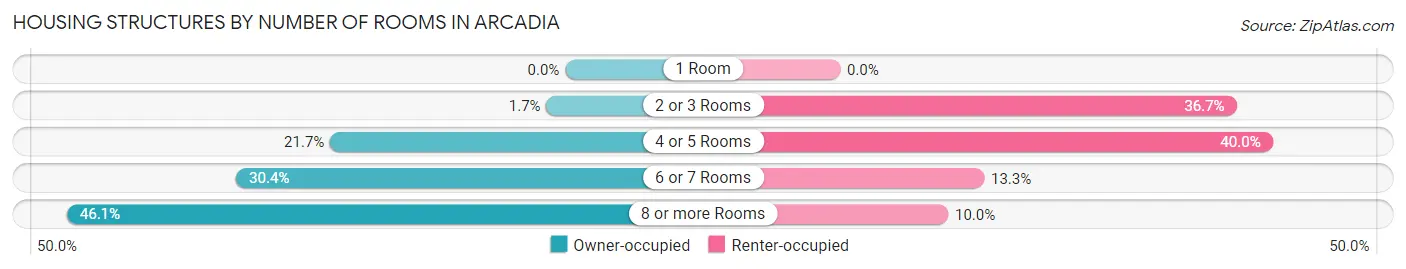
| Number of Rooms | Owner-occupied | Renter-occupied |
| 1 Room | 0 (0.0%) | 0 (0.0%) |
| 2 or 3 Rooms | 2 (1.7%) | 11 (36.7%) |
| 4 or 5 Rooms | 25 (21.7%) | 12 (40.0%) |
| 6 or 7 Rooms | 35 (30.4%) | 4 (13.3%) |
| 8 or more Rooms | 53 (46.1%) | 3 (10.0%) |
| Total | 115 (100.0%) | 30 (100.0%) |
Housing Structure by Heating Type in Arcadia

| Heating Type | Owner-occupied | Renter-occupied |
| Utility Gas | 41 (35.6%) | 11 (36.7%) |
| Bottled, Tank, or LP Gas | 3 (2.6%) | 5 (16.7%) |
| Electricity | 63 (54.8%) | 14 (46.7%) |
| Fuel Oil or Kerosene | 0 (0.0%) | 0 (0.0%) |
| Coal or Coke | 0 (0.0%) | 0 (0.0%) |
| All other Fuels | 6 (5.2%) | 0 (0.0%) |
| No Fuel Used | 2 (1.7%) | 0 (0.0%) |
| Total | 115 (100.0%) | 30 (100.0%) |
Household Vehicle Usage in Arcadia
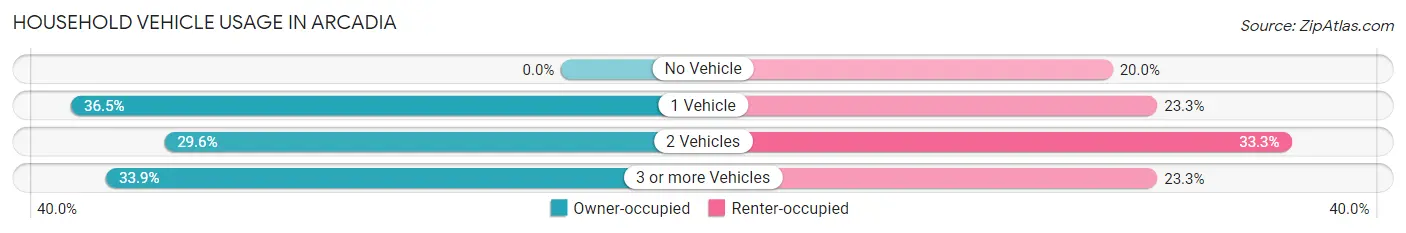
| Vehicles per Household | Owner-occupied | Renter-occupied |
| No Vehicle | 0 (0.0%) | 6 (20.0%) |
| 1 Vehicle | 42 (36.5%) | 7 (23.3%) |
| 2 Vehicles | 34 (29.6%) | 10 (33.3%) |
| 3 or more Vehicles | 39 (33.9%) | 7 (23.3%) |
| Total | 115 (100.0%) | 30 (100.0%) |
Real Estate & Mortgages in Arcadia
Real Estate and Mortgage Overview in Arcadia
| Characteristic | Without Mortgage | With Mortgage |
| Housing Units | 74 | 41 |
| Median Property Value | $109,200 | $154,200 |
| Median Household Income | $87,604 | $18 |
| Monthly Housing Costs | $618 | $0 |
| Real Estate Taxes | $1,712 | $0 |
Property Value by Mortgage Status in Arcadia
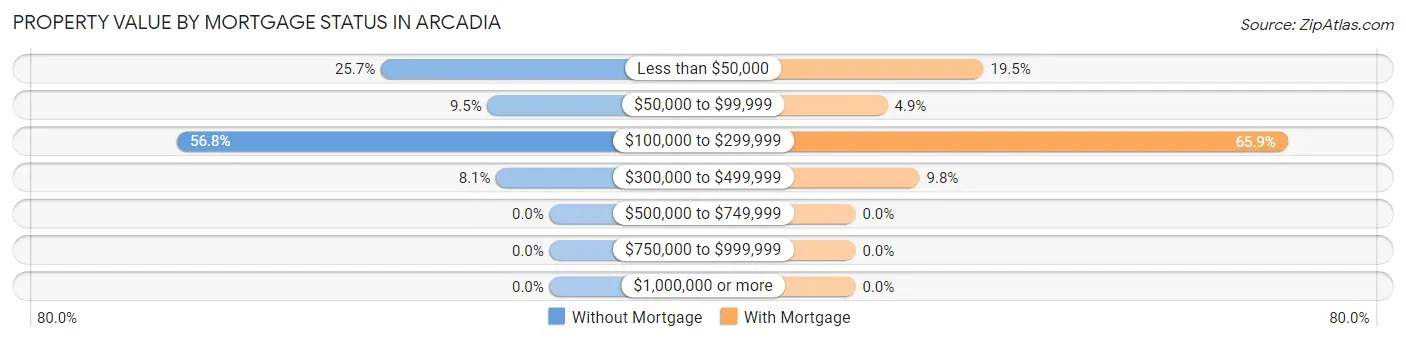
| Property Value | Without Mortgage | With Mortgage |
| Less than $50,000 | 19 (25.7%) | 8 (19.5%) |
| $50,000 to $99,999 | 7 (9.5%) | 2 (4.9%) |
| $100,000 to $299,999 | 42 (56.8%) | 27 (65.8%) |
| $300,000 to $499,999 | 6 (8.1%) | 4 (9.8%) |
| $500,000 to $749,999 | 0 (0.0%) | 0 (0.0%) |
| $750,000 to $999,999 | 0 (0.0%) | 0 (0.0%) |
| $1,000,000 or more | 0 (0.0%) | 0 (0.0%) |
| Total | 74 (100.0%) | 41 (100.0%) |
Household Income by Mortgage Status in Arcadia
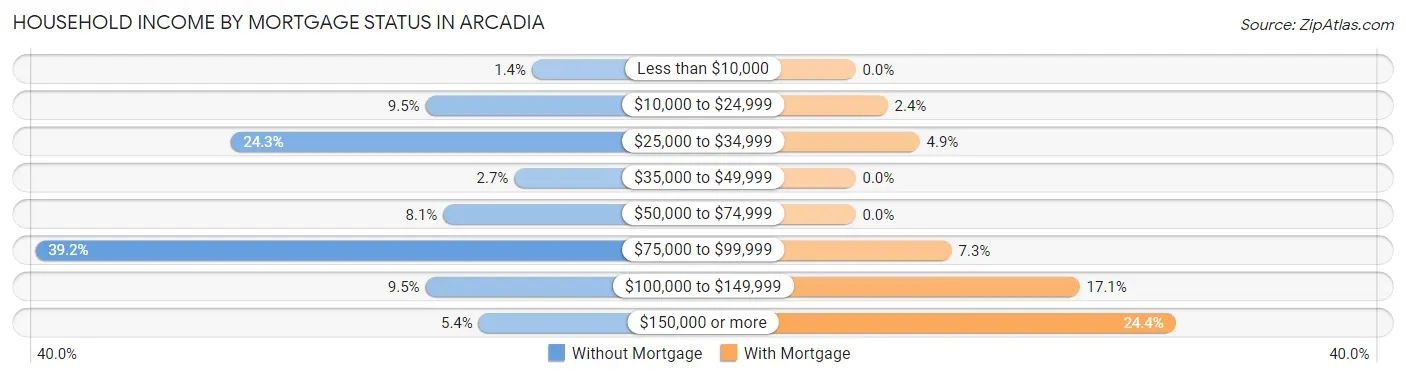
| Household Income | Without Mortgage | With Mortgage |
| Less than $10,000 | 1 (1.3%) | 0 (0.0%) |
| $10,000 to $24,999 | 7 (9.5%) | 1 (2.4%) |
| $25,000 to $34,999 | 18 (24.3%) | 2 (4.9%) |
| $35,000 to $49,999 | 2 (2.7%) | 0 (0.0%) |
| $50,000 to $74,999 | 6 (8.1%) | 0 (0.0%) |
| $75,000 to $99,999 | 29 (39.2%) | 3 (7.3%) |
| $100,000 to $149,999 | 7 (9.5%) | 7 (17.1%) |
| $150,000 or more | 4 (5.4%) | 10 (24.4%) |
| Total | 74 (100.0%) | 41 (100.0%) |
Property Value to Household Income Ratio in Arcadia
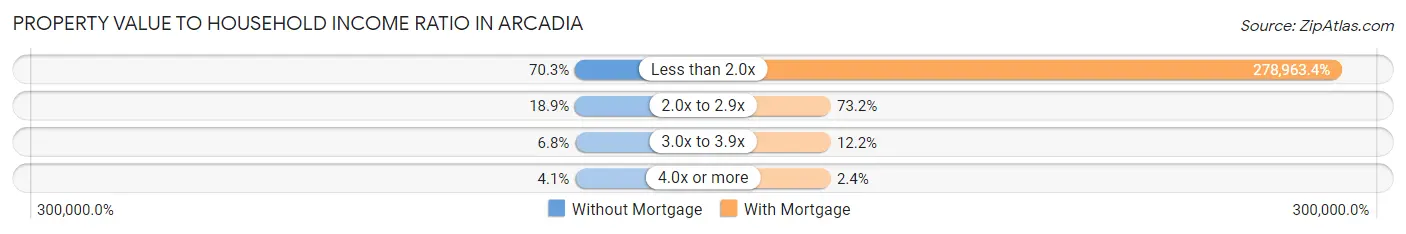
| Value-to-Income Ratio | Without Mortgage | With Mortgage |
| Less than 2.0x | 52 (70.3%) | 114,375 (278,963.4%) |
| 2.0x to 2.9x | 14 (18.9%) | 30 (73.2%) |
| 3.0x to 3.9x | 5 (6.8%) | 5 (12.2%) |
| 4.0x or more | 3 (4.1%) | 1 (2.4%) |
| Total | 74 (100.0%) | 41 (100.0%) |
Real Estate Taxes by Mortgage Status in Arcadia
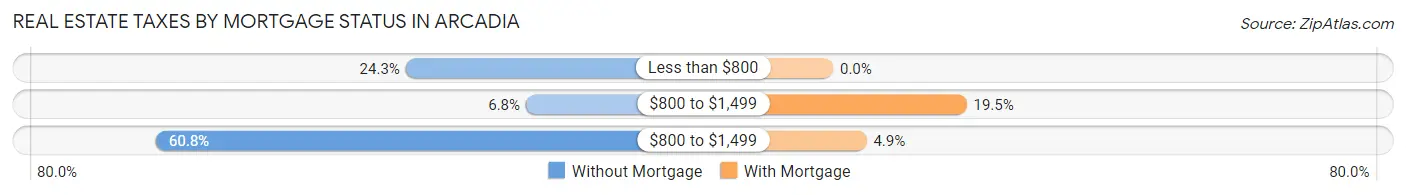
| Property Taxes | Without Mortgage | With Mortgage |
| Less than $800 | 18 (24.3%) | 0 (0.0%) |
| $800 to $1,499 | 5 (6.8%) | 8 (19.5%) |
| $800 to $1,499 | 45 (60.8%) | 2 (4.9%) |
| Total | 74 (100.0%) | 41 (100.0%) |
Health & Disability in Arcadia
Health Insurance Coverage by Age in Arcadia
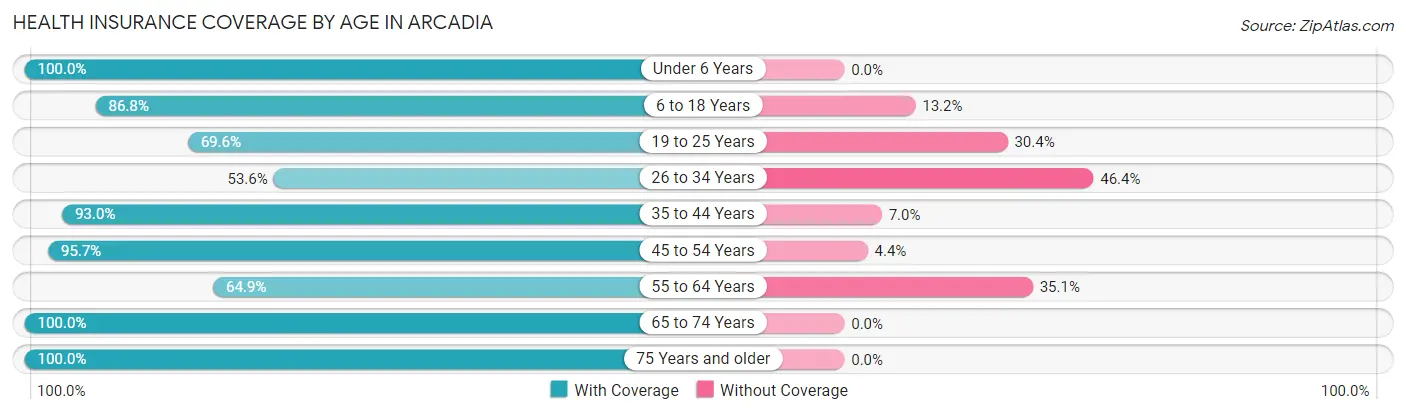
| Age Bracket | With Coverage | Without Coverage |
| Under 6 Years | 8 (100.0%) | 0 (0.0%) |
| 6 to 18 Years | 59 (86.8%) | 9 (13.2%) |
| 19 to 25 Years | 16 (69.6%) | 7 (30.4%) |
| 26 to 34 Years | 15 (53.6%) | 13 (46.4%) |
| 35 to 44 Years | 40 (93.0%) | 3 (7.0%) |
| 45 to 54 Years | 44 (95.7%) | 2 (4.3%) |
| 55 to 64 Years | 24 (64.9%) | 13 (35.1%) |
| 65 to 74 Years | 16 (100.0%) | 0 (0.0%) |
| 75 Years and older | 64 (100.0%) | 0 (0.0%) |
| Total | 286 (85.9%) | 47 (14.1%) |
Health Insurance Coverage by Citizenship Status in Arcadia

| Citizenship Status | With Coverage | Without Coverage |
| Native Born | 8 (100.0%) | 0 (0.0%) |
| Foreign Born, Citizen | 59 (86.8%) | 9 (13.2%) |
| Foreign Born, not a Citizen | 16 (69.6%) | 7 (30.4%) |
Health Insurance Coverage by Household Income in Arcadia
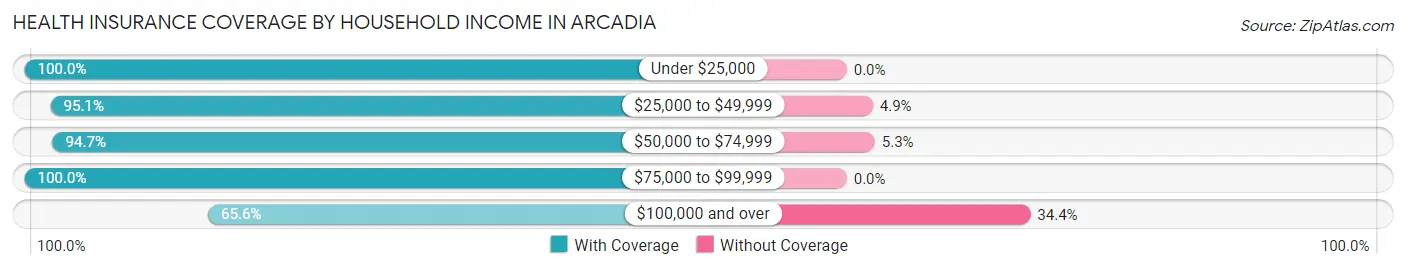
| Household Income | With Coverage | Without Coverage |
| Under $25,000 | 29 (100.0%) | 0 (0.0%) |
| $25,000 to $49,999 | 39 (95.1%) | 2 (4.9%) |
| $50,000 to $74,999 | 36 (94.7%) | 2 (5.3%) |
| $75,000 to $99,999 | 100 (100.0%) | 0 (0.0%) |
| $100,000 and over | 82 (65.6%) | 43 (34.4%) |
Public vs Private Health Insurance Coverage by Age in Arcadia
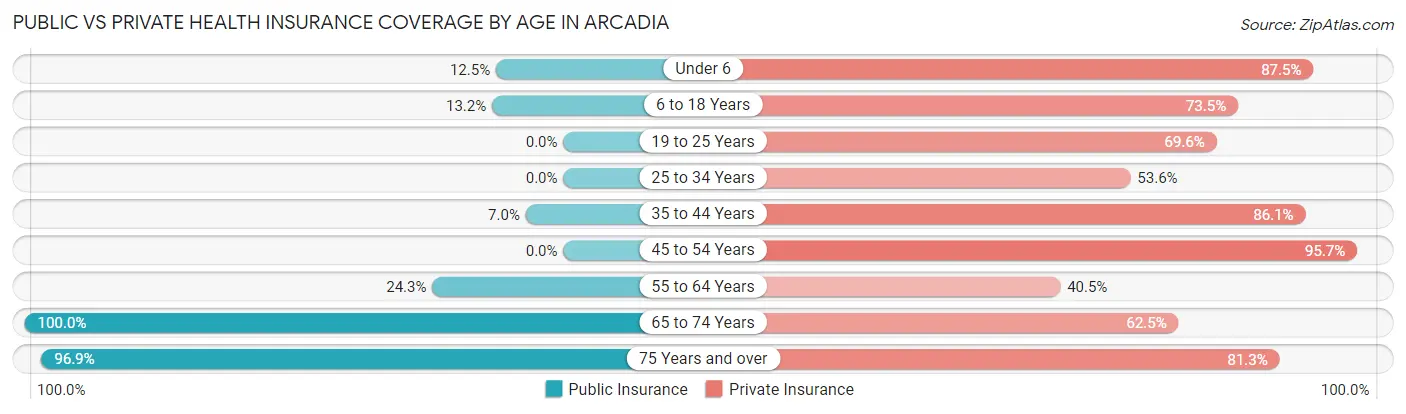
| Age Bracket | Public Insurance | Private Insurance |
| Under 6 | 1 (12.5%) | 7 (87.5%) |
| 6 to 18 Years | 9 (13.2%) | 50 (73.5%) |
| 19 to 25 Years | 0 (0.0%) | 16 (69.6%) |
| 25 to 34 Years | 0 (0.0%) | 15 (53.6%) |
| 35 to 44 Years | 3 (7.0%) | 37 (86.1%) |
| 45 to 54 Years | 0 (0.0%) | 44 (95.7%) |
| 55 to 64 Years | 9 (24.3%) | 15 (40.5%) |
| 65 to 74 Years | 16 (100.0%) | 10 (62.5%) |
| 75 Years and over | 62 (96.9%) | 52 (81.2%) |
| Total | 100 (30.0%) | 246 (73.9%) |
Disability Status by Sex by Age in Arcadia
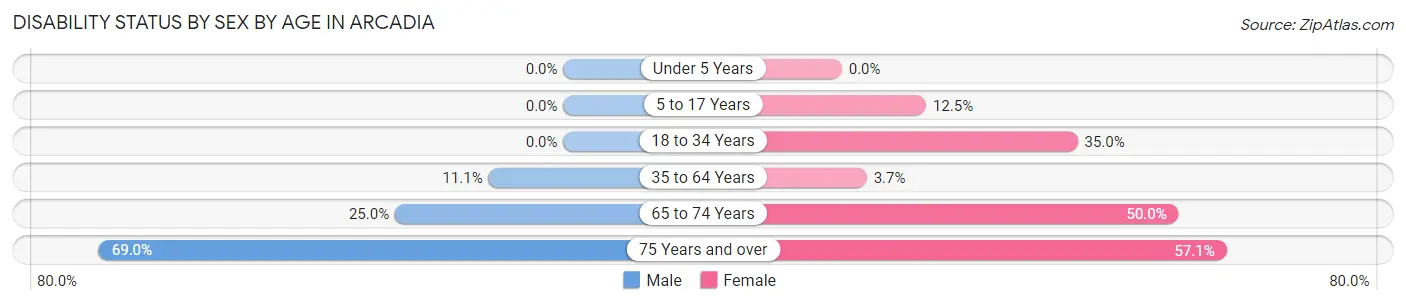
| Age Bracket | Male | Female |
| Under 5 Years | 0 (0.0%) | 0 (0.0%) |
| 5 to 17 Years | 0 (0.0%) | 2 (12.5%) |
| 18 to 34 Years | 0 (0.0%) | 7 (35.0%) |
| 35 to 64 Years | 5 (11.1%) | 3 (3.7%) |
| 65 to 74 Years | 1 (25.0%) | 6 (50.0%) |
| 75 Years and over | 20 (69.0%) | 20 (57.1%) |
Disability Class by Sex by Age in Arcadia
Disability Class: Hearing Difficulty

| Age Bracket | Male | Female |
| Under 5 Years | 0 (0.0%) | 0 (0.0%) |
| 5 to 17 Years | 0 (0.0%) | 0 (0.0%) |
| 18 to 34 Years | 0 (0.0%) | 0 (0.0%) |
| 35 to 64 Years | 4 (8.9%) | 0 (0.0%) |
| 65 to 74 Years | 1 (25.0%) | 0 (0.0%) |
| 75 Years and over | 19 (65.5%) | 2 (5.7%) |
Disability Class: Vision Difficulty
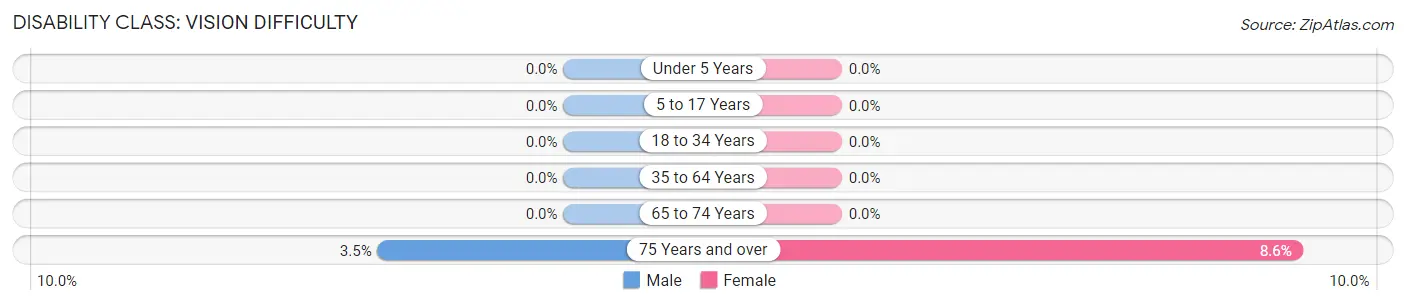
| Age Bracket | Male | Female |
| Under 5 Years | 0 (0.0%) | 0 (0.0%) |
| 5 to 17 Years | 0 (0.0%) | 0 (0.0%) |
| 18 to 34 Years | 0 (0.0%) | 0 (0.0%) |
| 35 to 64 Years | 0 (0.0%) | 0 (0.0%) |
| 65 to 74 Years | 0 (0.0%) | 0 (0.0%) |
| 75 Years and over | 1 (3.5%) | 3 (8.6%) |
Disability Class: Cognitive Difficulty
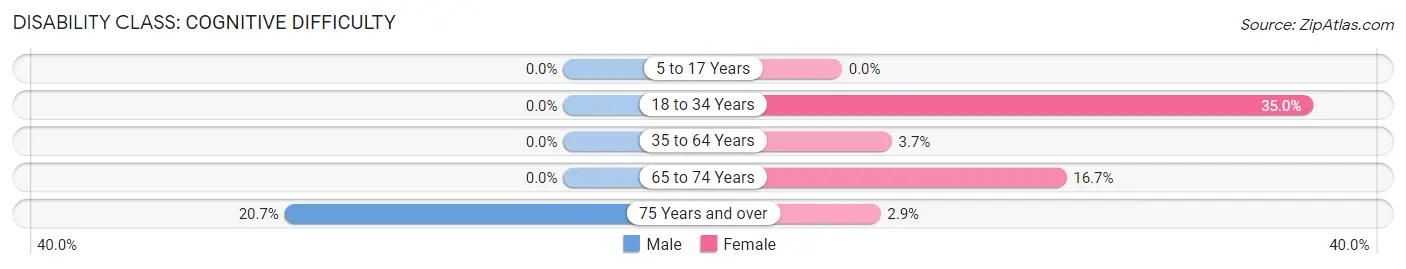
| Age Bracket | Male | Female |
| 5 to 17 Years | 0 (0.0%) | 0 (0.0%) |
| 18 to 34 Years | 0 (0.0%) | 7 (35.0%) |
| 35 to 64 Years | 0 (0.0%) | 3 (3.7%) |
| 65 to 74 Years | 0 (0.0%) | 2 (16.7%) |
| 75 Years and over | 6 (20.7%) | 1 (2.9%) |
Disability Class: Ambulatory Difficulty
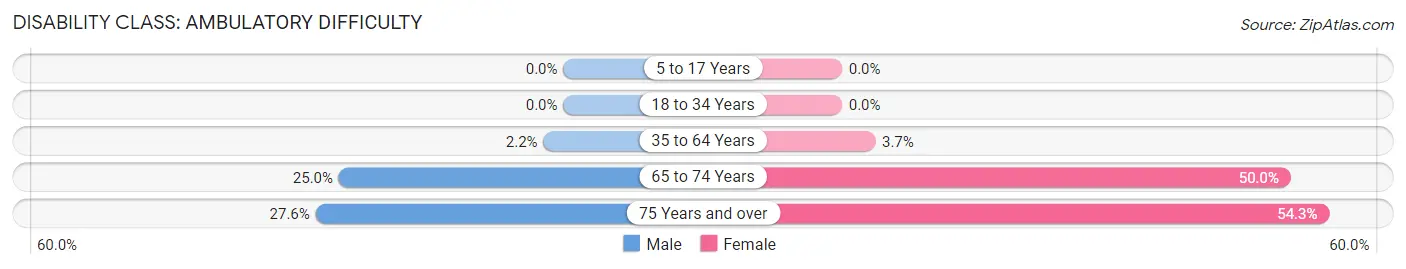
| Age Bracket | Male | Female |
| 5 to 17 Years | 0 (0.0%) | 0 (0.0%) |
| 18 to 34 Years | 0 (0.0%) | 0 (0.0%) |
| 35 to 64 Years | 1 (2.2%) | 3 (3.7%) |
| 65 to 74 Years | 1 (25.0%) | 6 (50.0%) |
| 75 Years and over | 8 (27.6%) | 19 (54.3%) |
Disability Class: Self-Care Difficulty
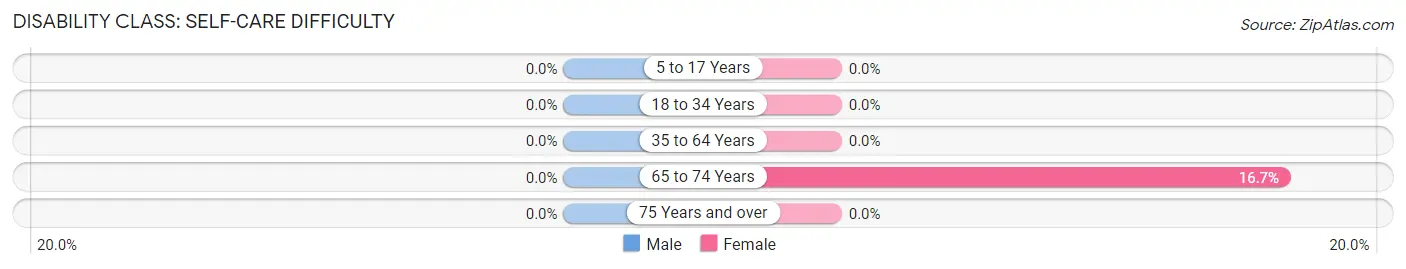
| Age Bracket | Male | Female |
| 5 to 17 Years | 0 (0.0%) | 0 (0.0%) |
| 18 to 34 Years | 0 (0.0%) | 0 (0.0%) |
| 35 to 64 Years | 0 (0.0%) | 0 (0.0%) |
| 65 to 74 Years | 0 (0.0%) | 2 (16.7%) |
| 75 Years and over | 0 (0.0%) | 0 (0.0%) |
Technology Access in Arcadia
Computing Device Access in Arcadia
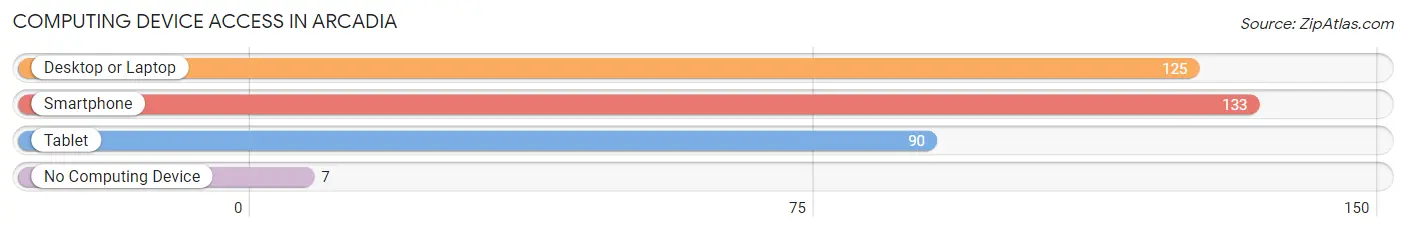
| Device Type | # Households | % Households |
| Desktop or Laptop | 125 | 86.2% |
| Smartphone | 133 | 91.7% |
| Tablet | 90 | 62.1% |
| No Computing Device | 7 | 4.8% |
| Total | 145 | 100.0% |
Internet Access in Arcadia
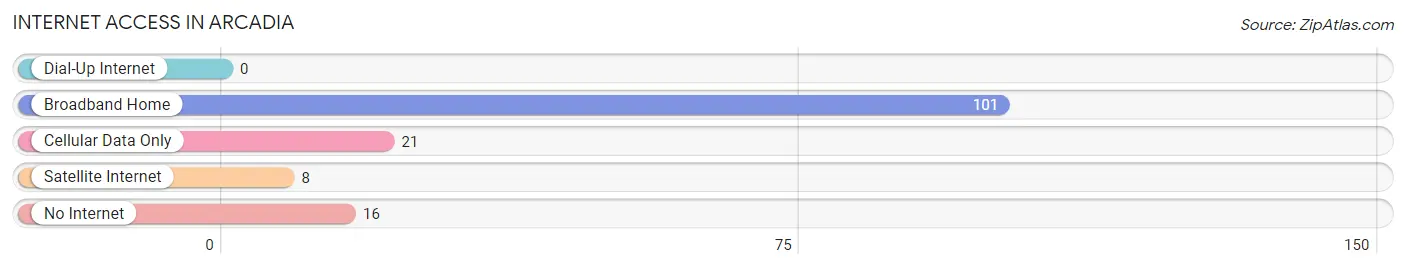
| Internet Type | # Households | % Households |
| Dial-Up Internet | 0 | 0.0% |
| Broadband Home | 101 | 69.7% |
| Cellular Data Only | 21 | 14.5% |
| Satellite Internet | 8 | 5.5% |
| No Internet | 16 | 11.0% |
| Total | 145 | 100.0% |
Arcadia Summary
Arcadia, Nebraska is a small town located in the southeastern corner of the state. It is situated in the rolling hills of the Loess Hills region, and is surrounded by farmland. The town was founded in 1871 and has a population of approximately 500 people.
Geography
Arcadia is located in the southeastern corner of Nebraska, in the rolling hills of the Loess Hills region. The town is situated on the banks of the Missouri River, and is surrounded by farmland. The town is located approximately 25 miles from Omaha, and is accessible by both Interstate 80 and Highway 75.
The town is situated on a flat plain, with the Missouri River to the east and the Loess Hills to the west. The town is located at an elevation of 1,200 feet above sea level. The climate in Arcadia is generally mild, with temperatures ranging from the low 30s in the winter to the mid-80s in the summer.
Economy
Arcadia’s economy is largely based on agriculture. The town is home to several large farms, which produce a variety of crops, including corn, soybeans, wheat, and hay. The town also has a number of small businesses, including a grocery store, a hardware store, and a few restaurants.
The town is also home to a number of manufacturing companies, including a furniture factory, a plastics factory, and a metal fabrication plant. The town is also home to a number of small businesses, including a gas station, a barber shop, and a beauty salon.
Demographics
As of the 2010 census, the population of Arcadia was 498 people. The racial makeup of the town was 97.2% White, 0.2% African American, 0.2% Native American, 0.2% Asian, 0.2% from other races, and 1.8% from two or more races. Hispanic or Latino of any race were 0.8% of the population.
The median income for a household in Arcadia was $41,250, and the median income for a family was $45,625. The per capita income for the town was $18,945. About 8.2% of families and 10.2% of the population were below the poverty line, including 11.2% of those under age 18 and 8.2% of those age 65 or over.
History
Arcadia was founded in 1871 by a group of settlers from Iowa. The town was named after the Greek city of Arcadia, which was known for its beauty and peacefulness. The town was originally a farming community, and the settlers quickly established a number of farms in the area.
In the late 19th century, the town began to grow and develop. The town was home to a number of businesses, including a hotel, a bank, and a newspaper. The town also had a number of churches, including a Methodist church, a Presbyterian church, and a Catholic church.
In the early 20th century, the town began to decline. The Great Depression hit the town hard, and many of the businesses closed. The town’s population also began to decline, and by the 1950s, the population had dropped to just over 400 people.
In recent years, the town has seen a resurgence in population and economic activity. The town is now home to a number of small businesses, and the population has grown to over 500 people. The town is also home to a number of festivals and events, including the Arcadia Days Festival, which is held every summer.
Common Questions
What is the Total Population of Arcadia?
Total Population of Arcadia is 333.
What is the Total Male Population of Arcadia?
Total Male Population of Arcadia is 166.
What is the Total Female Population of Arcadia?
Total Female Population of Arcadia is 167.
What is the Ratio of Males per 100 Females in Arcadia?
There are 99.40 Males per 100 Females in Arcadia.
What is the Ratio of Females per 100 Males in Arcadia?
There are 100.60 Females per 100 Males in Arcadia.
What is the Median Population Age in Arcadia?
Median Population Age in Arcadia is 44.1 Years.
What is the Average Family Size in Arcadia
Average Family Size in Arcadia is 2.9 People.
What is the Average Household Size in Arcadia
Average Household Size in Arcadia is 2.3 People.
What is Per Capita Income in Arcadia?
Per Capita income in Arcadia is $42,191.
What is the Median Family Income in Arcadia?
Median Family Income in Arcadia is $89,063.
What is the Median Household income in Arcadia?
Median Household Income in Arcadia is $86,875.
What is Income or Wage Gap in Arcadia?
Income or Wage Gap in Arcadia is 30.1%.
Women in Arcadia earn 69.9 cents for every dollar earned by a man.
What is Inequality or Gini Index in Arcadia?
Inequality or Gini Index in Arcadia is 0.41.
How Large is the Labor Force in Arcadia?
There are 196 People in the Labor Forcein in Arcadia.
What is the Percentage of People in the Labor Force in Arcadia?
70.5% of People are in the Labor Force in Arcadia.