Zip Codes with the Highest Percentage of Population with a Degree in Liberal Arts and History in Gastonia, NC
RELATED REPORTS & OPTIONS
Liberal Arts and History
Gastonia
Compare Zip Codes
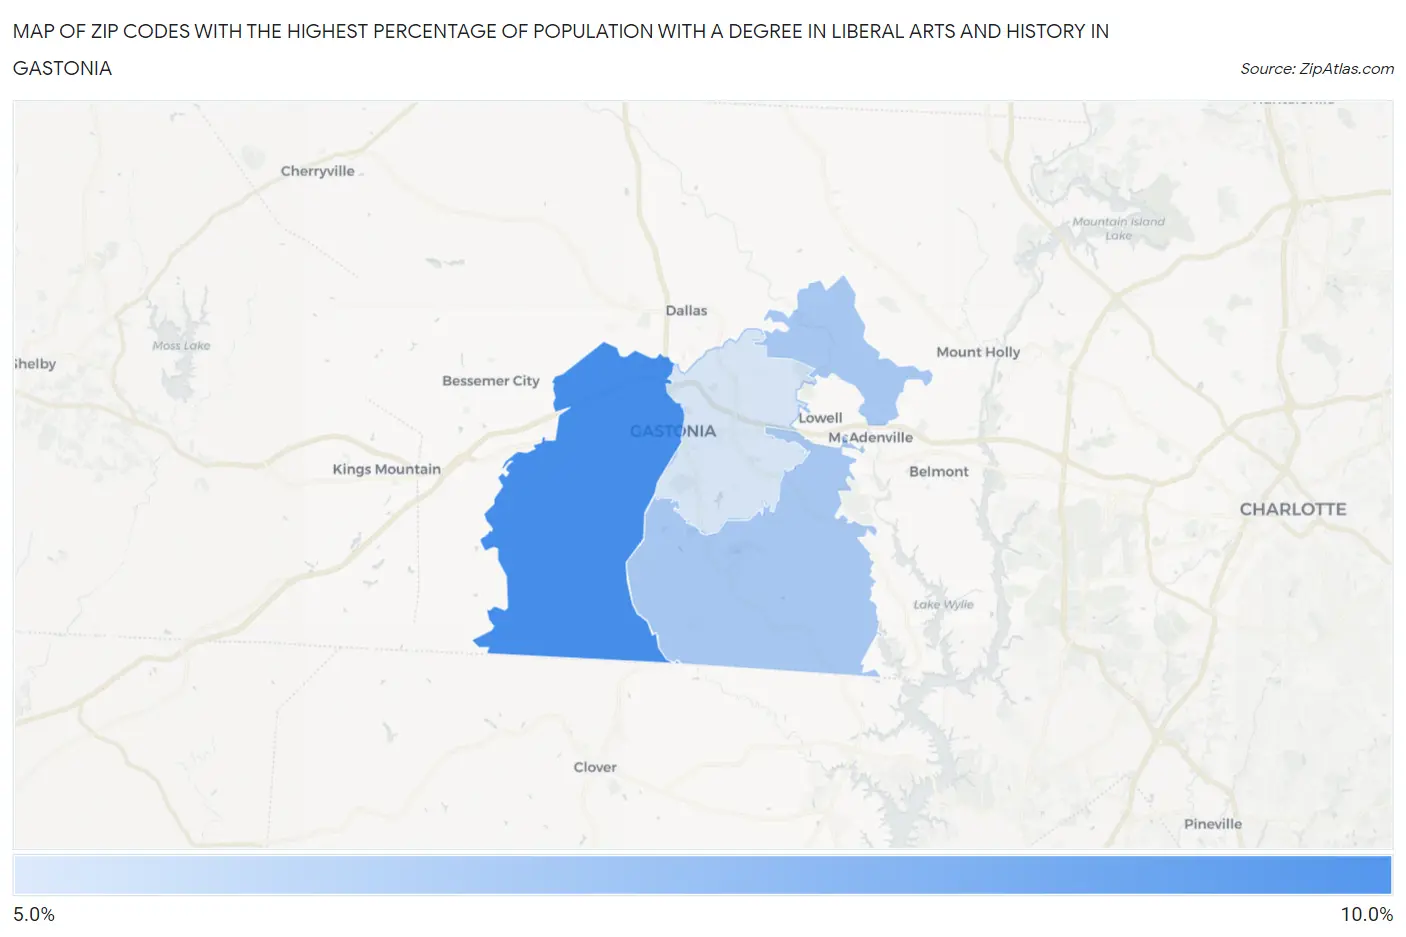
Map of Zip Codes with the Highest Percentage of Population with a Degree in Liberal Arts and History in Gastonia
0.0%
10.0%
Zip Codes with the Highest Percentage of Population with a Degree in Liberal Arts and History in Gastonia, NC
| Zip Code | % Graduates | vs State | vs National | |
| 1. | 28052 | 8.2% | 4.9%(+3.31)#127 | 4.9%(+3.34)#4,644 |
| 2. | 28056 | 6.1% | 4.9%(+1.20)#235 | 4.9%(+1.23)#8,254 |
| 3. | 28054 | 5.1% | 4.9%(+0.210)#325 | 4.9%(+0.238)#11,007 |
1
Common Questions
What are the Top Zip Codes with the Highest Percentage of Population with a Degree in Liberal Arts and History in Gastonia, NC?
Top Zip Codes with the Highest Percentage of Population with a Degree in Liberal Arts and History in Gastonia, NC are:
What zip code has the Highest Percentage of Population with a Degree in Liberal Arts and History in Gastonia, NC?
28052 has the Highest Percentage of Population with a Degree in Liberal Arts and History in Gastonia, NC with 8.2%.
What is the Percentage of Population with a Degree in Liberal Arts and History in Gastonia, NC?
Percentage of Population with a Degree in Liberal Arts and History in Gastonia is 5.2%.
What is the Percentage of Population with a Degree in Liberal Arts and History in North Carolina?
Percentage of Population with a Degree in Liberal Arts and History in North Carolina is 4.9%.
What is the Percentage of Population with a Degree in Liberal Arts and History in the United States?
Percentage of Population with a Degree in Liberal Arts and History in the United States is 4.9%.