Zip Codes with the Highest Percentage of Population with a Degree in Visual and Performing Arts in Billings, MT
RELATED REPORTS & OPTIONS
Visual and Performing Arts
Billings
Compare Zip Codes
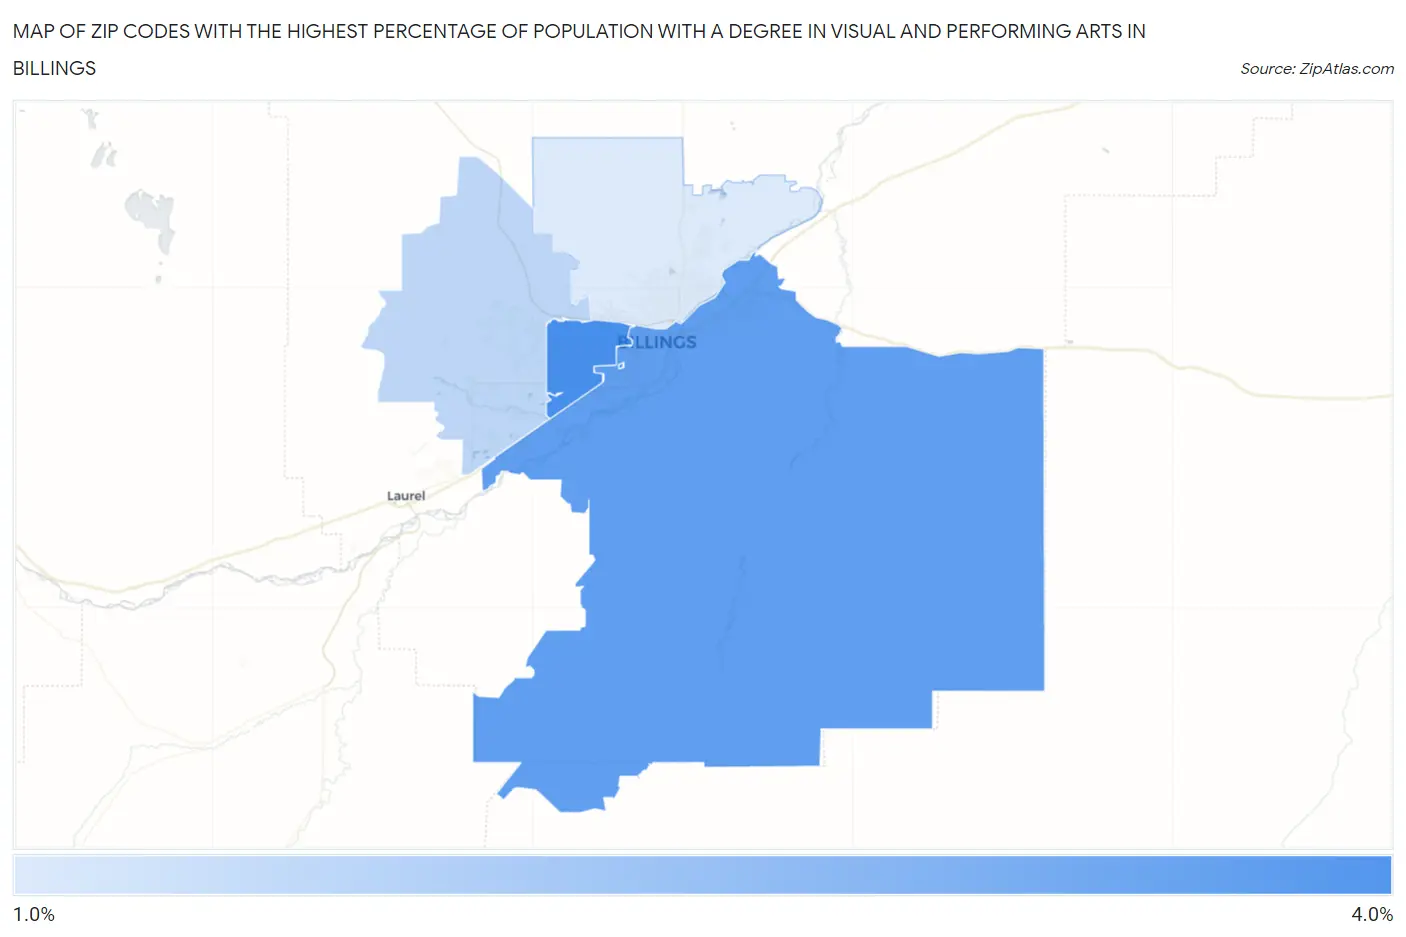
Map of Zip Codes with the Highest Percentage of Population with a Degree in Visual and Performing Arts in Billings
0.0%
4.0%
Zip Codes with the Highest Percentage of Population with a Degree in Visual and Performing Arts in Billings, MT
| Zip Code | % Graduates | vs State | vs National | |
| 1. | 59102 | 3.7% | 3.8%(-0.059)#84 | 4.3%(-0.528)#10,080 |
| 2. | 59101 | 3.4% | 3.8%(-0.383)#91 | 4.3%(-0.852)#11,255 |
| 3. | 59106 | 2.3% | 3.8%(-1.50)#115 | 4.3%(-1.97)#15,433 |
| 4. | 59105 | 1.9% | 3.8%(-1.89)#123 | 4.3%(-2.36)#16,805 |
1
Common Questions
What are the Top 3 Zip Codes with the Highest Percentage of Population with a Degree in Visual and Performing Arts in Billings, MT?
Top 3 Zip Codes with the Highest Percentage of Population with a Degree in Visual and Performing Arts in Billings, MT are:
What zip code has the Highest Percentage of Population with a Degree in Visual and Performing Arts in Billings, MT?
59102 has the Highest Percentage of Population with a Degree in Visual and Performing Arts in Billings, MT with 3.7%.
What is the Percentage of Population with a Degree in Visual and Performing Arts in Billings, MT?
Percentage of Population with a Degree in Visual and Performing Arts in Billings is 3.3%.
What is the Percentage of Population with a Degree in Visual and Performing Arts in Montana?
Percentage of Population with a Degree in Visual and Performing Arts in Montana is 3.8%.
What is the Percentage of Population with a Degree in Visual and Performing Arts in the United States?
Percentage of Population with a Degree in Visual and Performing Arts in the United States is 4.3%.