Zip Codes with the Highest Percentage of Population Employed in Security & Protection in Billings, MT
RELATED REPORTS & OPTIONS
Security & Protection
Billings
Compare Zip Codes
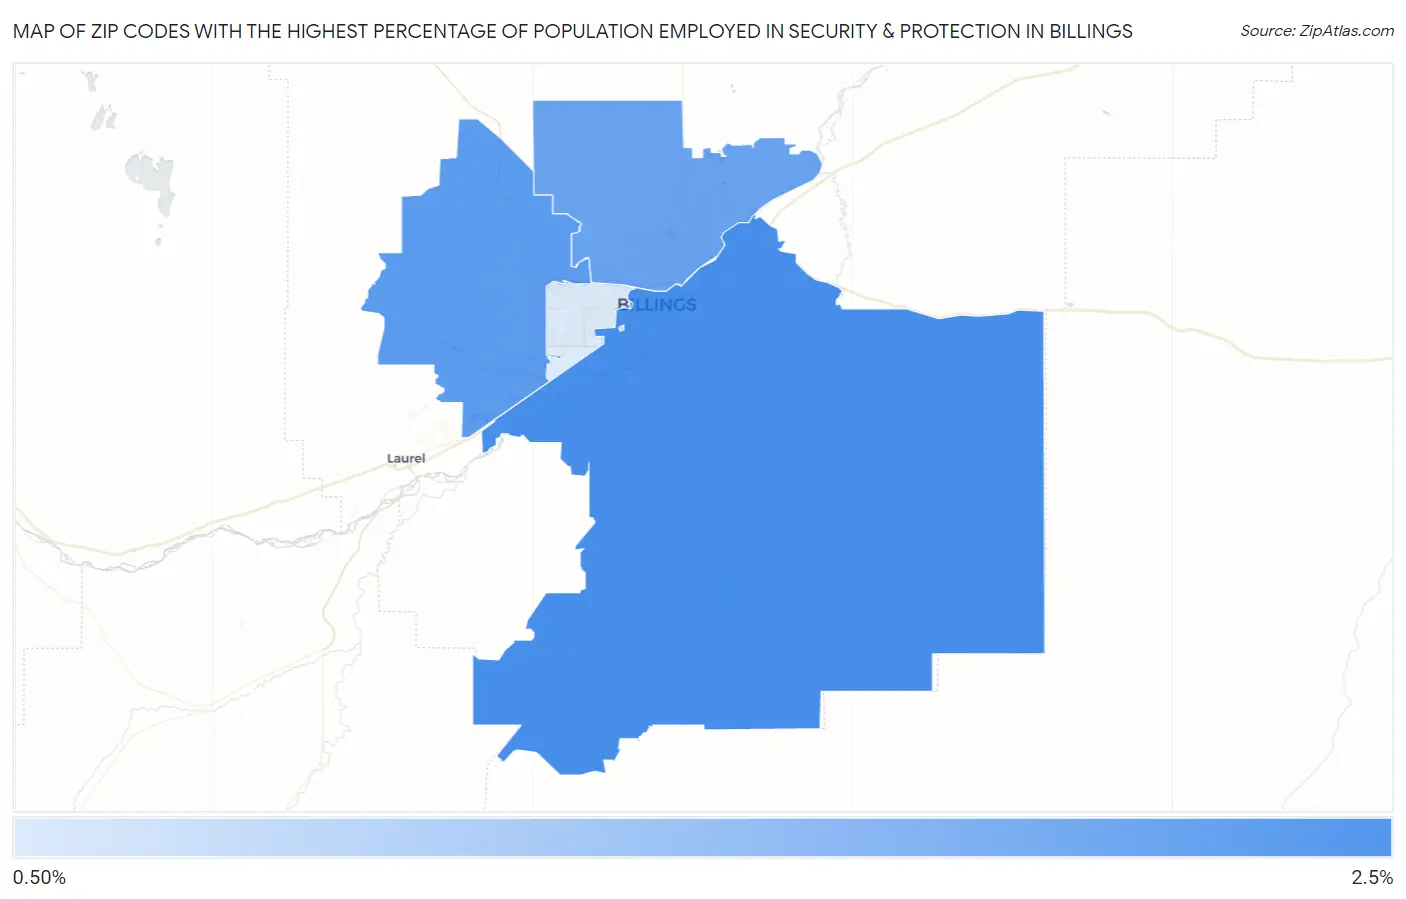
Map of Zip Codes with the Highest Percentage of Population Employed in Security & Protection in Billings
0.0%
2.5%
Zip Codes with the Highest Percentage of Population Employed in Security & Protection in Billings, MT
| Zip Code | % Employed | vs State | vs National | |
| 1. | 59101 | 2.2% | 1.9%(+0.307)#95 | 2.1%(+0.067)#11,157 |
| 2. | 59106 | 2.0% | 1.9%(+0.121)#102 | 2.1%(-0.118)#12,364 |
| 3. | 59105 | 1.9% | 1.9%(+0.026)#107 | 2.1%(-0.214)#12,986 |
| 4. | 59102 | 0.90% | 1.9%(-1.01)#148 | 2.1%(-1.25)#20,807 |
1
Common Questions
What are the Top 3 Zip Codes with the Highest Percentage of Population Employed in Security & Protection in Billings, MT?
Top 3 Zip Codes with the Highest Percentage of Population Employed in Security & Protection in Billings, MT are:
What zip code has the Highest Percentage of Population Employed in Security & Protection in Billings, MT?
59101 has the Highest Percentage of Population Employed in Security & Protection in Billings, MT with 2.2%.
What is the Percentage of Population Employed in Security & Protection in Billings, MT?
Percentage of Population Employed in Security & Protection in Billings is 1.5%.
What is the Percentage of Population Employed in Security & Protection in Montana?
Percentage of Population Employed in Security & Protection in Montana is 1.9%.
What is the Percentage of Population Employed in Security & Protection in the United States?
Percentage of Population Employed in Security & Protection in the United States is 2.1%.