Zip Codes with the Highest Percentage of Population Taking Taxi / Cab to Work in Grand Rapids, MI
RELATED REPORTS & OPTIONS
Taxi / Cab
Grand Rapids
Compare Zip Codes
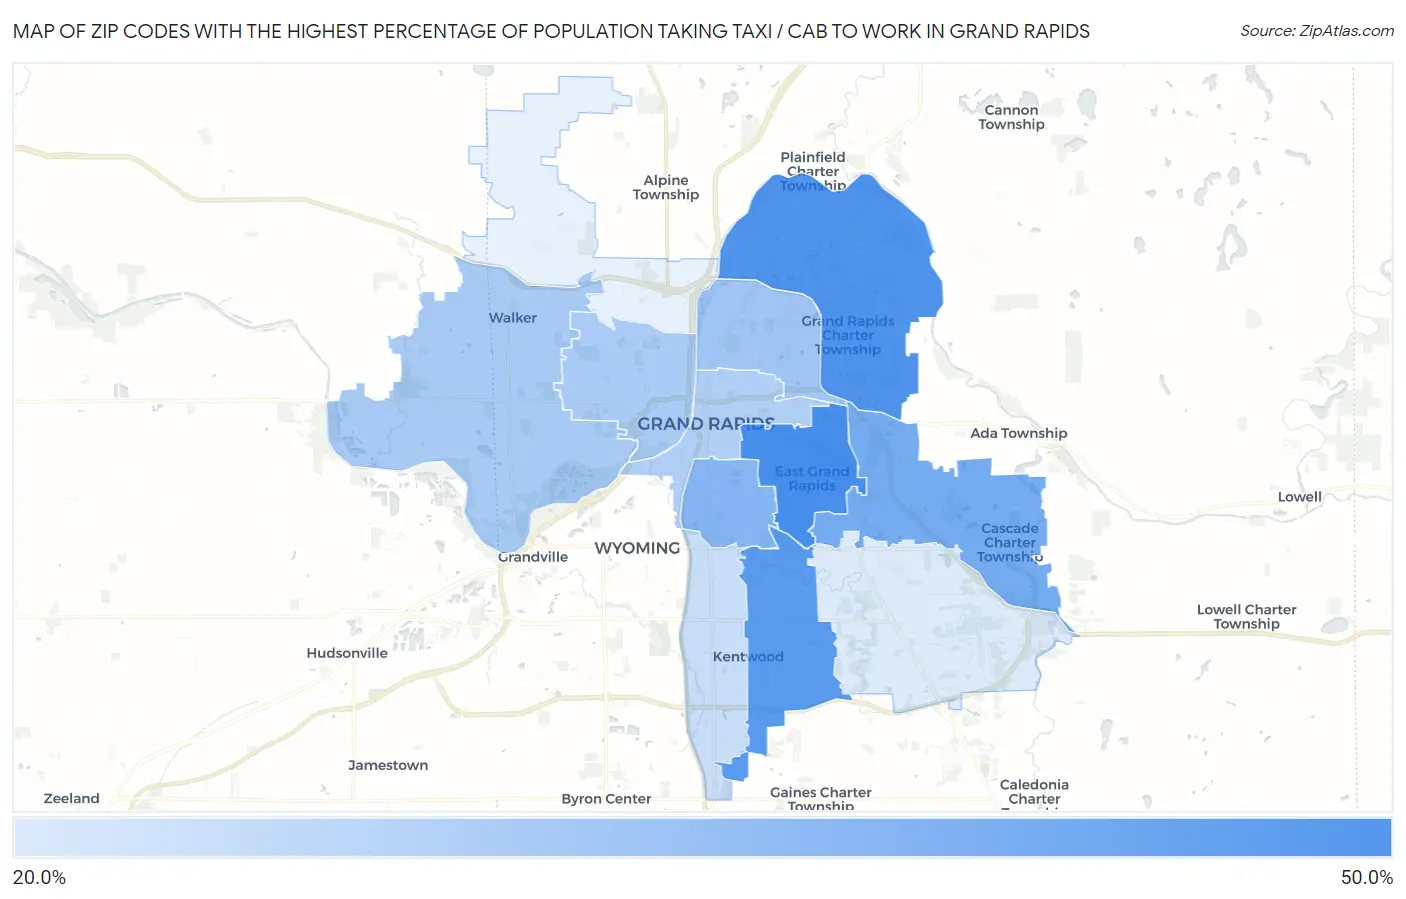
Map of Zip Codes with the Highest Percentage of Population Taking Taxi / Cab to Work in Grand Rapids
0.0%
50.0%
Zip Codes with the Highest Percentage of Population Taking Taxi / Cab to Work in Grand Rapids, MI
| Zip Code | % Take Taxi / Cab | vs State | vs National | |
| 1. | 49506 | 49.1% | 36.2%(+12.9)#126 | 38.2%(+10.9)#3,232 |
| 2. | 49525 | 47.6% | 36.2%(+11.4)#145 | 38.2%(+9.40)#3,747 |
| 3. | 49508 | 45.9% | 36.2%(+9.70)#171 | 38.2%(+7.70)#4,328 |
| 4. | 49546 | 40.2% | 36.2%(+4.00)#248 | 38.2%(+2.00)#6,526 |
| 5. | 49507 | 37.2% | 36.2%(+1.00)#296 | 38.2%(-1.000)#7,849 |
| 6. | 49505 | 32.5% | 36.2%(-3.70)#366 | 38.2%(-5.70)#9,993 |
| 7. | 49534 | 31.2% | 36.2%(-5.00)#392 | 38.2%(-7.00)#10,468 |
| 8. | 49504 | 30.8% | 36.2%(-5.40)#402 | 38.2%(-7.40)#10,604 |
| 9. | 49503 | 29.6% | 36.2%(-6.60)#425 | 38.2%(-8.60)#11,049 |
| 10. | 49548 | 25.8% | 36.2%(-10.4)#470 | 38.2%(-12.4)#12,065 |
| 11. | 49512 | 22.4% | 36.2%(-13.8)#499 | 38.2%(-15.8)#12,723 |
1
Common Questions
What are the Top 10 Zip Codes with the Highest Percentage of Population Taking Taxi / Cab to Work in Grand Rapids, MI?
Top 10 Zip Codes with the Highest Percentage of Population Taking Taxi / Cab to Work in Grand Rapids, MI are:
What zip code has the Highest Percentage of Population Taking Taxi / Cab to Work in Grand Rapids, MI?
49506 has the Highest Percentage of Population Taking Taxi / Cab to Work in Grand Rapids, MI with 49.1%.
What is the Percentage of Population Taking Taxi / Cab to Work in Grand Rapids, MI?
Percentage of Population Taking Taxi / Cab to Work in Grand Rapids is 32.8%.
What is the Percentage of Population Taking Taxi / Cab to Work in Michigan?
Percentage of Population Taking Taxi / Cab to Work in Michigan is 36.2%.
What is the Percentage of Population Taking Taxi / Cab to Work in the United States?
Percentage of Population Taking Taxi / Cab to Work in the United States is 38.2%.