Zip Codes with the Highest Percentage of Population Taking Taxi / Cab to Work in Dearborn Heights, MI
RELATED REPORTS & OPTIONS
Taxi / Cab
Dearborn Heights
Compare Zip Codes
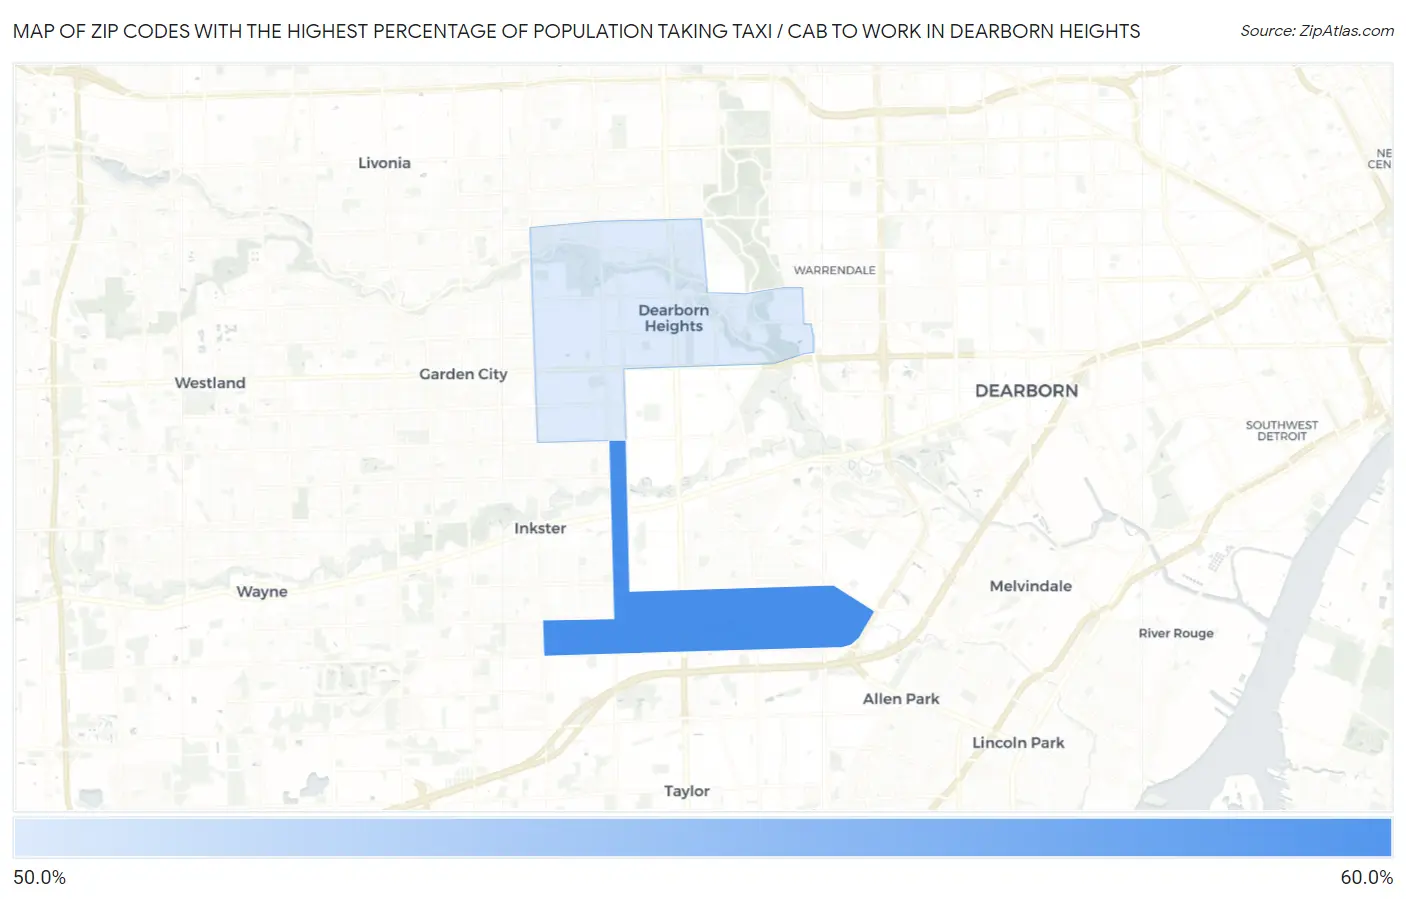
Map of Zip Codes with the Highest Percentage of Population Taking Taxi / Cab to Work in Dearborn Heights
0.0%
60.0%
Zip Codes with the Highest Percentage of Population Taking Taxi / Cab to Work in Dearborn Heights, MI
| Zip Code | % Take Taxi / Cab | vs State | vs National | |
| 1. | 48125 | 54.7% | 36.2%(+18.5)#73 | 38.2%(+16.5)#1,658 |
| 2. | 48127 | 50.4% | 36.2%(+14.2)#112 | 38.2%(+12.2)#2,816 |
1
Common Questions
What are the Top Zip Codes with the Highest Percentage of Population Taking Taxi / Cab to Work in Dearborn Heights, MI?
Top Zip Codes with the Highest Percentage of Population Taking Taxi / Cab to Work in Dearborn Heights, MI are:
What zip code has the Highest Percentage of Population Taking Taxi / Cab to Work in Dearborn Heights, MI?
48125 has the Highest Percentage of Population Taking Taxi / Cab to Work in Dearborn Heights, MI with 54.7%.
What is the Percentage of Population Taking Taxi / Cab to Work in Dearborn Heights, MI?
Percentage of Population Taking Taxi / Cab to Work in Dearborn Heights is 50.5%.
What is the Percentage of Population Taking Taxi / Cab to Work in Michigan?
Percentage of Population Taking Taxi / Cab to Work in Michigan is 36.2%.
What is the Percentage of Population Taking Taxi / Cab to Work in the United States?
Percentage of Population Taking Taxi / Cab to Work in the United States is 38.2%.