Zip Codes with the Highest Percentage of Population Employed in Agriculture, Fishing & Hunting in Glen Burnie, MD
RELATED REPORTS & OPTIONS
Agriculture, Fishing & Hunting
Glen Burnie
Compare Zip Codes
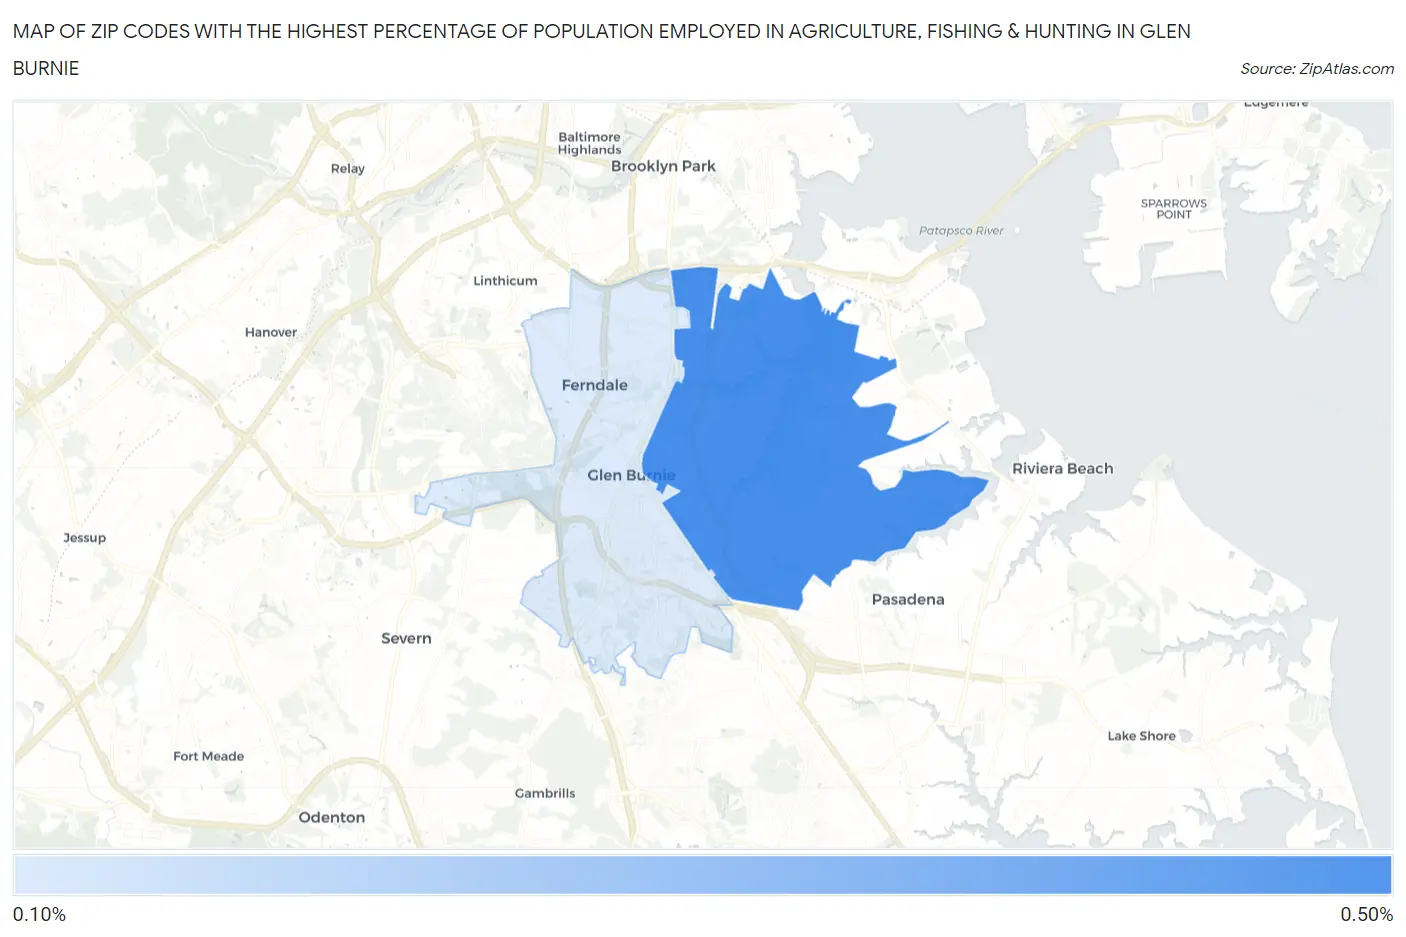
Map of Zip Codes with the Highest Percentage of Population Employed in Agriculture, Fishing & Hunting in Glen Burnie
0.0%
0.50%
Zip Codes with the Highest Percentage of Population Employed in Agriculture, Fishing & Hunting in Glen Burnie, MD
| Zip Code | % Employed | vs State | vs National | |
| 1. | 21060 | 0.40% | 0.50%(-0.100)#193 | 1.2%(-0.795)#20,115 |
| 2. | 21061 | 0.16% | 0.50%(-0.348)#251 | 1.2%(-1.04)#22,933 |
1
Common Questions
What are the Top Zip Codes with the Highest Percentage of Population Employed in Agriculture, Fishing & Hunting in Glen Burnie, MD?
Top Zip Codes with the Highest Percentage of Population Employed in Agriculture, Fishing & Hunting in Glen Burnie, MD are:
What zip code has the Highest Percentage of Population Employed in Agriculture, Fishing & Hunting in Glen Burnie, MD?
21060 has the Highest Percentage of Population Employed in Agriculture, Fishing & Hunting in Glen Burnie, MD with 0.40%.
What is the Percentage of Population Employed in Agriculture, Fishing & Hunting in Glen Burnie, MD?
Percentage of Population Employed in Agriculture, Fishing & Hunting in Glen Burnie is 0.20%.
What is the Percentage of Population Employed in Agriculture, Fishing & Hunting in Maryland?
Percentage of Population Employed in Agriculture, Fishing & Hunting in Maryland is 0.50%.
What is the Percentage of Population Employed in Agriculture, Fishing & Hunting in the United States?
Percentage of Population Employed in Agriculture, Fishing & Hunting in the United States is 1.2%.