Zip Codes with the Highest Percentage of Population Employed in Accommodation & Food Services in Glen Burnie, MD
RELATED REPORTS & OPTIONS
Accommodation & Food Services
Glen Burnie
Compare Zip Codes
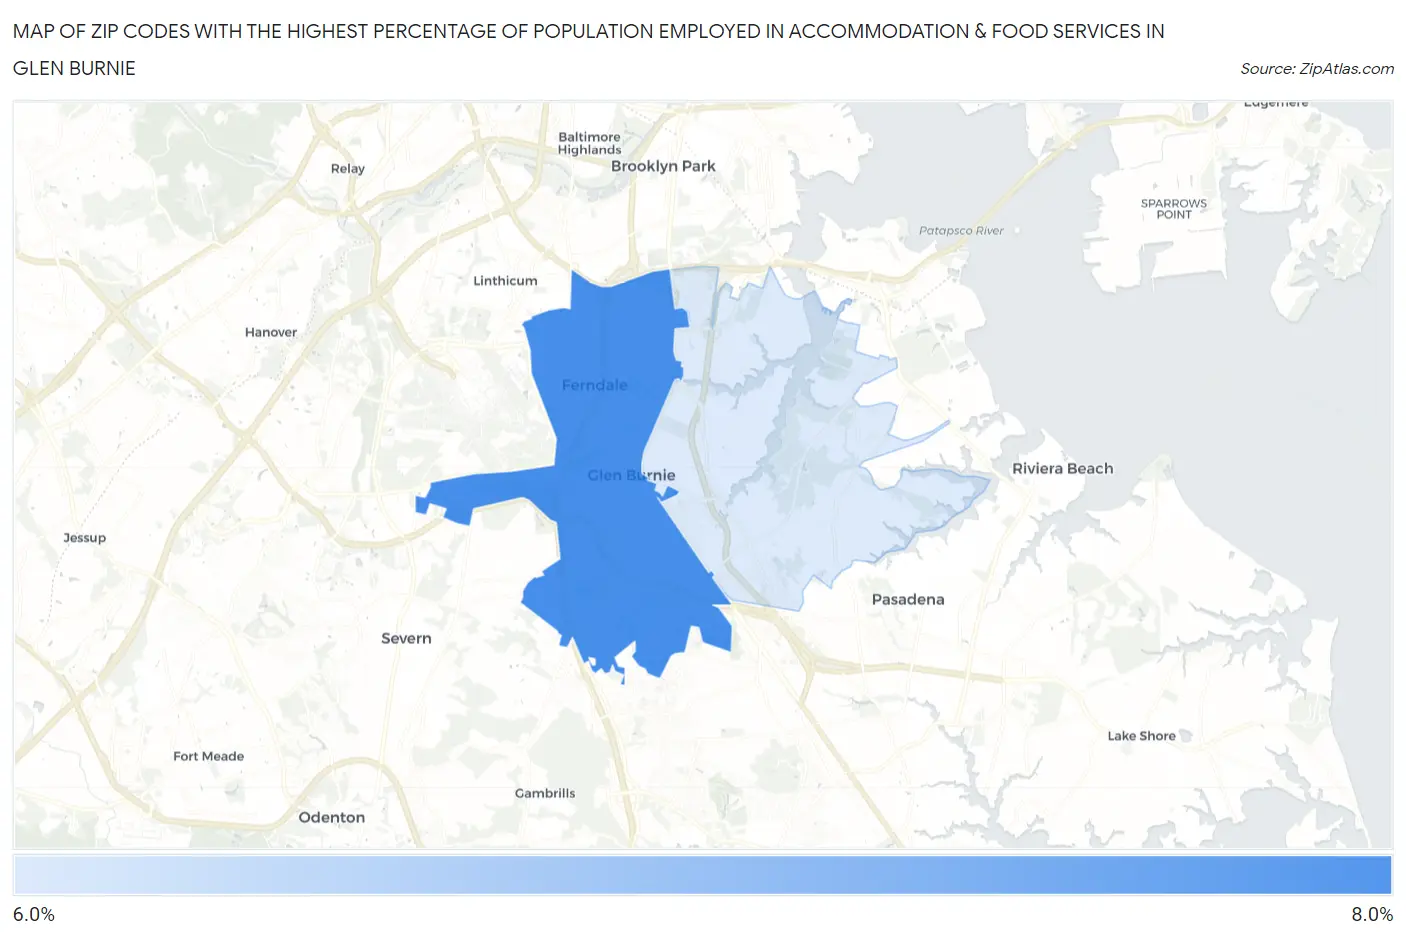
Map of Zip Codes with the Highest Percentage of Population Employed in Accommodation & Food Services in Glen Burnie
0.0%
8.0%
Zip Codes with the Highest Percentage of Population Employed in Accommodation & Food Services in Glen Burnie, MD
| Zip Code | % Employed | vs State | vs National | |
| 1. | 21061 | 6.6% | 5.8%(+0.729)#129 | 6.9%(-0.305)#11,593 |
| 2. | 21060 | 6.4% | 5.8%(+0.554)#137 | 6.9%(-0.480)#12,158 |
1
Common Questions
What are the Top Zip Codes with the Highest Percentage of Population Employed in Accommodation & Food Services in Glen Burnie, MD?
Top Zip Codes with the Highest Percentage of Population Employed in Accommodation & Food Services in Glen Burnie, MD are:
What zip code has the Highest Percentage of Population Employed in Accommodation & Food Services in Glen Burnie, MD?
21061 has the Highest Percentage of Population Employed in Accommodation & Food Services in Glen Burnie, MD with 6.6%.
What is the Percentage of Population Employed in Accommodation & Food Services in Glen Burnie, MD?
Percentage of Population Employed in Accommodation & Food Services in Glen Burnie is 5.5%.
What is the Percentage of Population Employed in Accommodation & Food Services in Maryland?
Percentage of Population Employed in Accommodation & Food Services in Maryland is 5.8%.
What is the Percentage of Population Employed in Accommodation & Food Services in the United States?
Percentage of Population Employed in Accommodation & Food Services in the United States is 6.9%.