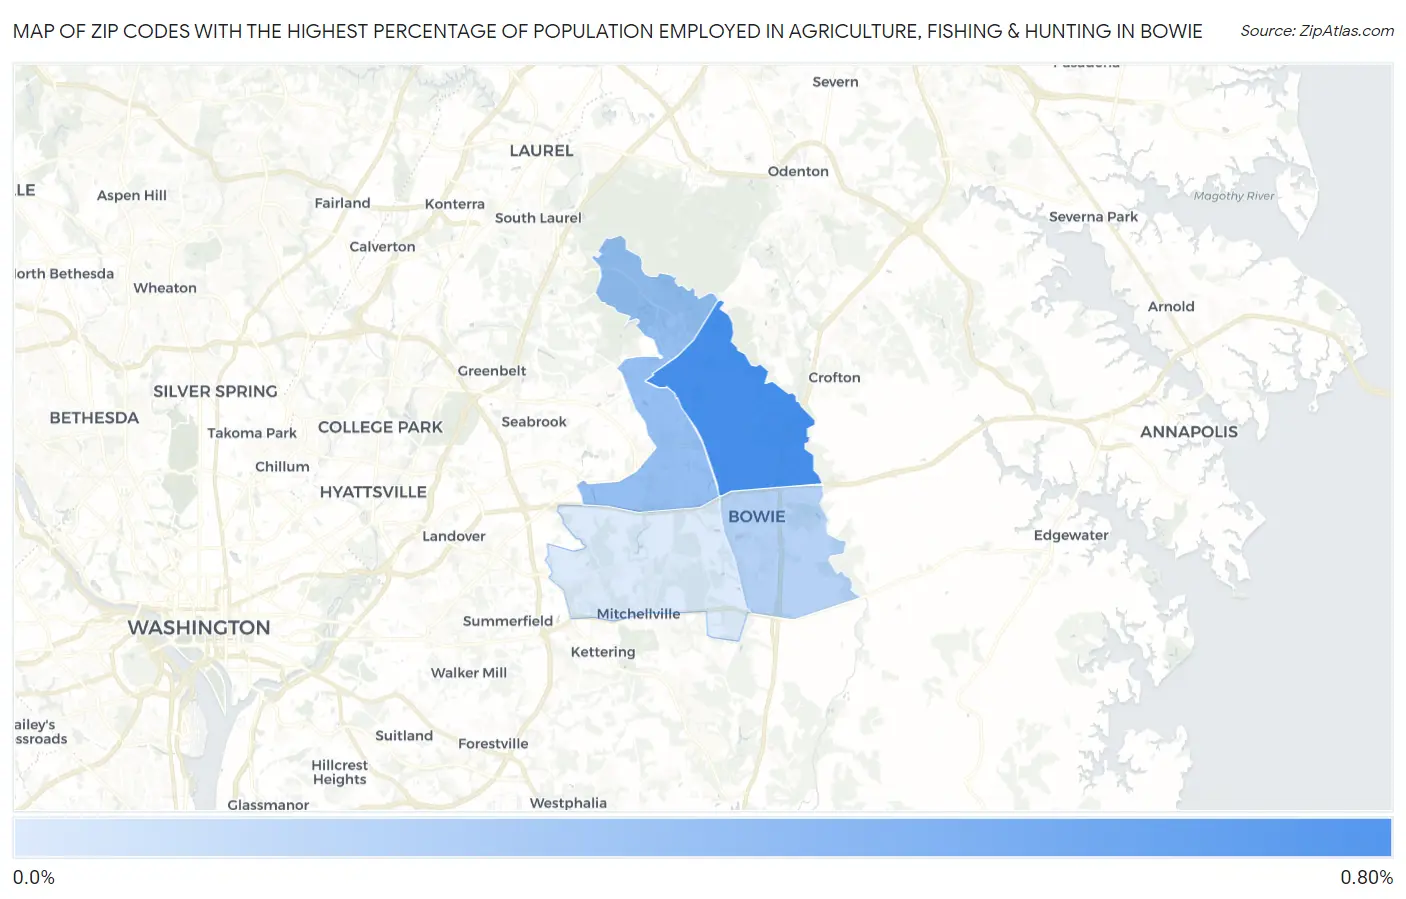
Zip Codes with the Highest Percentage of Population Employed in Agriculture, Fishing & Hunting in Bowie, MD
RELATED REPORTS & OPTIONS
Agriculture, Fishing & Hunting
Bowie
Compare Zip Codes
Map of Zip Codes with the Highest Percentage of Population Employed in Agriculture, Fishing & Hunting in Bowie
0.0%
0.80%
Zip Codes with the Highest Percentage of Population Employed in Agriculture, Fishing & Hunting in Bowie, MD
| Zip Code | % Employed | vs State | vs National | |
| 1. | 20715 | 0.71% | 0.50%(+0.210)#160 | 1.2%(-0.485)#17,767 |
| 2. | 20720 | 0.36% | 0.50%(-0.142)#198 | 1.2%(-0.837)#20,513 |
| 3. | 20716 | 0.23% | 0.50%(-0.278)#227 | 1.2%(-0.973)#22,036 |
| 4. | 20721 | 0.047% | 0.50%(-0.458)#291 | 1.2%(-1.15)#24,387 |
1
Common Questions
What are the Top 3 Zip Codes with the Highest Percentage of Population Employed in Agriculture, Fishing & Hunting in Bowie, MD?
Top 3 Zip Codes with the Highest Percentage of Population Employed in Agriculture, Fishing & Hunting in Bowie, MD are:
What zip code has the Highest Percentage of Population Employed in Agriculture, Fishing & Hunting in Bowie, MD?
20715 has the Highest Percentage of Population Employed in Agriculture, Fishing & Hunting in Bowie, MD with 0.71%.
What is the Percentage of Population Employed in Agriculture, Fishing & Hunting in Bowie, MD?
Percentage of Population Employed in Agriculture, Fishing & Hunting in Bowie is 0.39%.
What is the Percentage of Population Employed in Agriculture, Fishing & Hunting in Maryland?
Percentage of Population Employed in Agriculture, Fishing & Hunting in Maryland is 0.50%.
What is the Percentage of Population Employed in Agriculture, Fishing & Hunting in the United States?
Percentage of Population Employed in Agriculture, Fishing & Hunting in the United States is 1.2%.