Zip Codes with the Highest Percentage of Population Employed in Health Diagnosing & Treating in Lawrence, MA
RELATED REPORTS & OPTIONS
Health Diagnosing & Treating
Lawrence
Compare Zip Codes
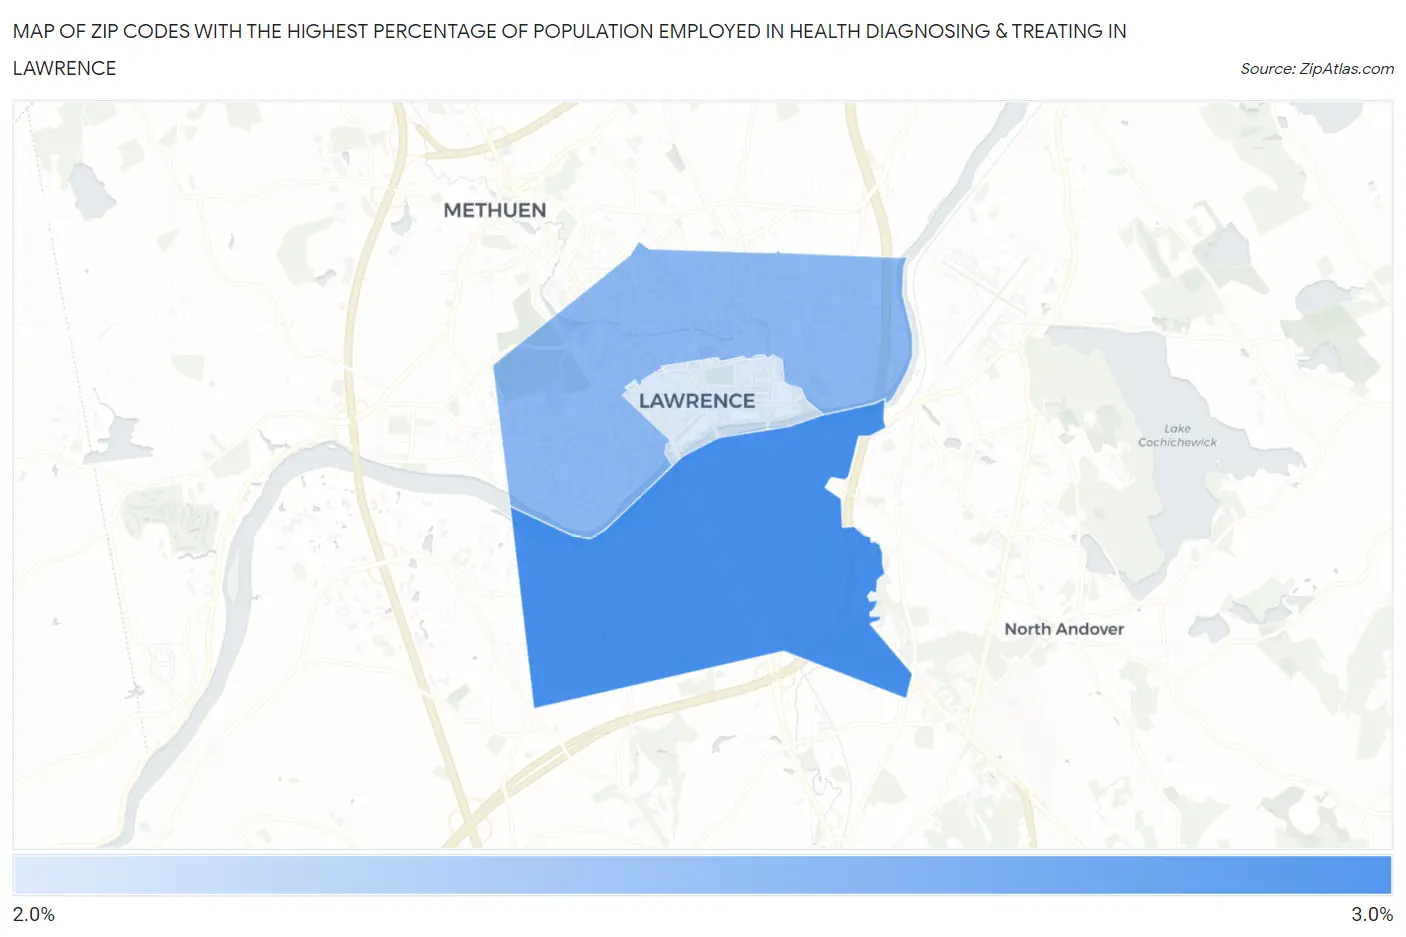
Map of Zip Codes with the Highest Percentage of Population Employed in Health Diagnosing & Treating in Lawrence
0.0%
3.0%
Zip Codes with the Highest Percentage of Population Employed in Health Diagnosing & Treating in Lawrence, MA
| Zip Code | % Employed | vs State | vs National | |
| 1. | 01843 | 2.7% | 6.9%(-4.20)#481 | 6.2%(-3.54)#25,057 |
| 2. | 01841 | 2.5% | 6.9%(-4.43)#487 | 6.2%(-3.77)#25,573 |
| 3. | 01840 | 2.2% | 6.9%(-4.70)#492 | 6.2%(-4.04)#26,113 |
1
Common Questions
What are the Top Zip Codes with the Highest Percentage of Population Employed in Health Diagnosing & Treating in Lawrence, MA?
Top Zip Codes with the Highest Percentage of Population Employed in Health Diagnosing & Treating in Lawrence, MA are:
What zip code has the Highest Percentage of Population Employed in Health Diagnosing & Treating in Lawrence, MA?
01843 has the Highest Percentage of Population Employed in Health Diagnosing & Treating in Lawrence, MA with 2.7%.
What is the Percentage of Population Employed in Health Diagnosing & Treating in Lawrence, MA?
Percentage of Population Employed in Health Diagnosing & Treating in Lawrence is 2.5%.
What is the Percentage of Population Employed in Health Diagnosing & Treating in Massachusetts?
Percentage of Population Employed in Health Diagnosing & Treating in Massachusetts is 6.9%.
What is the Percentage of Population Employed in Health Diagnosing & Treating in the United States?
Percentage of Population Employed in Health Diagnosing & Treating in the United States is 6.2%.