Zip Codes with the Highest Percentage of Population Employed in Health Diagnosing & Treating in Lexington, MA
RELATED REPORTS & OPTIONS
Health Diagnosing & Treating
Lexington
Compare Zip Codes
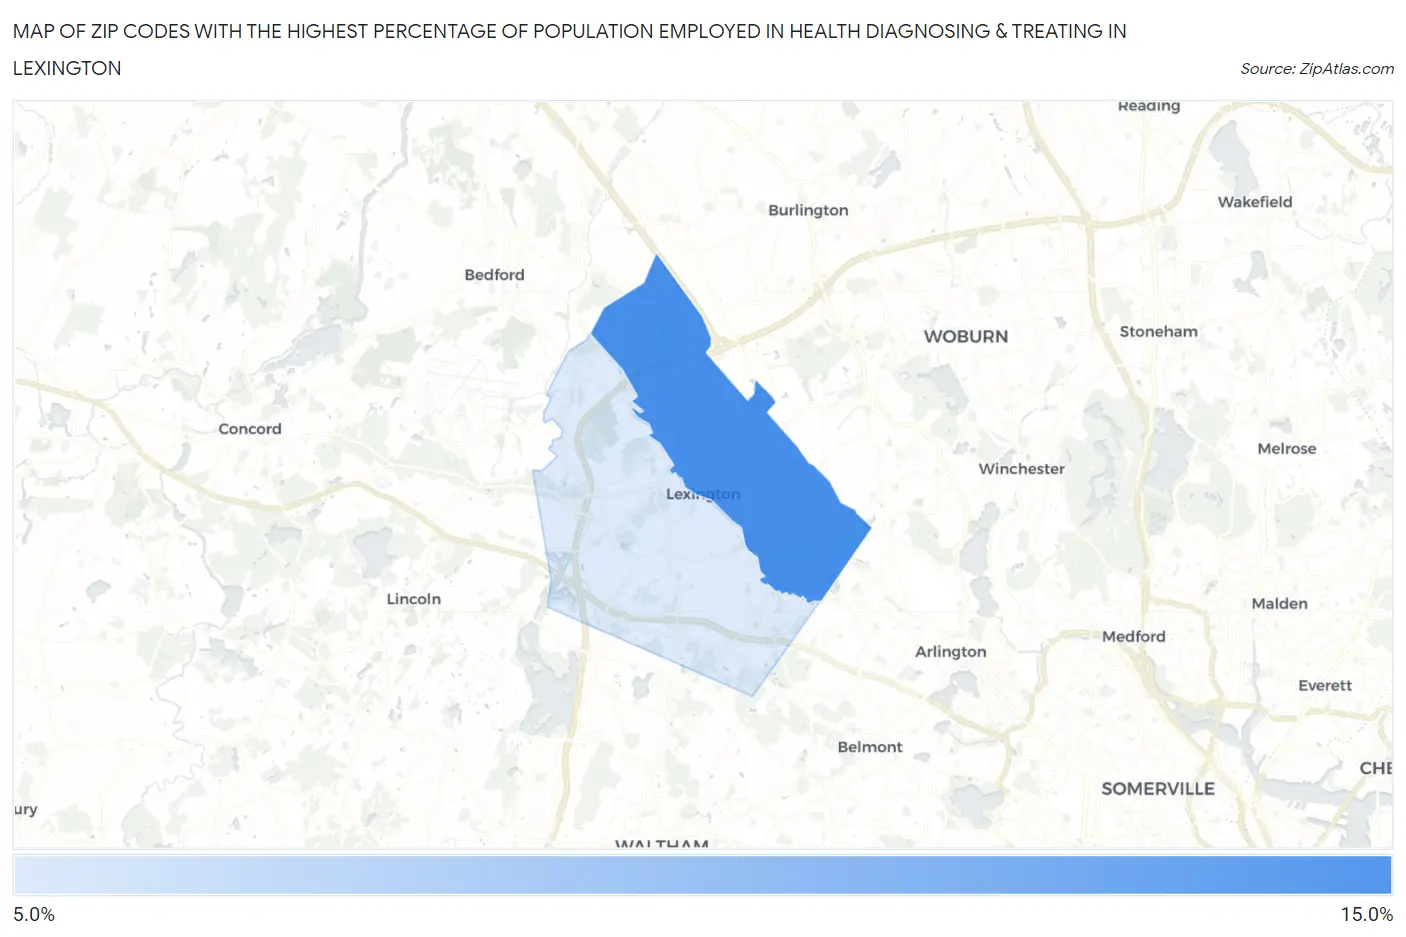
Map of Zip Codes with the Highest Percentage of Population Employed in Health Diagnosing & Treating in Lexington
0.0%
15.0%
Zip Codes with the Highest Percentage of Population Employed in Health Diagnosing & Treating in Lexington, MA
| Zip Code | % Employed | vs State | vs National | |
| 1. | 02420 | 11.2% | 6.9%(+4.32)#54 | 6.2%(+4.98)#2,712 |
| 2. | 02421 | 6.3% | 6.9%(-0.646)#306 | 6.2%(+0.013)#12,908 |
1
Common Questions
What are the Top Zip Codes with the Highest Percentage of Population Employed in Health Diagnosing & Treating in Lexington, MA?
Top Zip Codes with the Highest Percentage of Population Employed in Health Diagnosing & Treating in Lexington, MA are:
What zip code has the Highest Percentage of Population Employed in Health Diagnosing & Treating in Lexington, MA?
02420 has the Highest Percentage of Population Employed in Health Diagnosing & Treating in Lexington, MA with 11.2%.
What is the Percentage of Population Employed in Health Diagnosing & Treating in Lexington, MA?
Percentage of Population Employed in Health Diagnosing & Treating in Lexington is 8.7%.
What is the Percentage of Population Employed in Health Diagnosing & Treating in Massachusetts?
Percentage of Population Employed in Health Diagnosing & Treating in Massachusetts is 6.9%.
What is the Percentage of Population Employed in Health Diagnosing & Treating in the United States?
Percentage of Population Employed in Health Diagnosing & Treating in the United States is 6.2%.